Article

Combining Ability and Gene Action for Yield Characteristics in Novel Aromatic Cytoplasmic Male Sterile Hybrid Rice under Water-Stress Conditions

by
Hamdi F. El-Mowafi
1,
Muneera D. F. AlKahtani
2,*,
Rizk M. Abdallah
1,
Amr M. Reda
1,
Kotb A. Attia
1,3,*,
Mahmoud A. El-Hity
4,
Hend E. El-Dabaawy
1,
Latifa Al Husnain
2,
Talal K. Al-Ateeq
3 and
Mohamed A. EL-Esawi
5
1
Rice Department, Field Crops Research Institute, ARC, Sakha, Kafr El-Sheikh 33717, Egypt
2
Biology Department, College of Science, Princess Nourah Bint Abdulrahman University, P.O. Box 102275 Riyadh 11675, Saudi Arabia
3
Center of Excellence in Biotechnology Research, King Saud University, P.O. Box 2455 Riyadh 11451, Saudi Arabia
4
Agronomy Department, College of Agriculture, Kafrelsheikh University, Kafr El-Sheikh 33512, Egypt
5
Botany Department, Faculty of Science, Tanta University, Tanta 31527, Egypt
*
Authors to whom correspondence should be addressed.
Submission received: 1 February 2021 / Revised: 26 February 2021 / Accepted: 4 March 2021 / Published: 9 March 2021

Abstract

:
Hybrid rice parental lines with better combining abilities provide an efficient tool to increase rice production. In the current study, twenty hybrid combinations were generated from five aromatic cytoplasmic male sterile (CMS) lines and four restorer lines (three of them aromatic) using a line × tester mating design. The hybrids and their parental lines were evaluated under two water regimes: normal irrigation and water-stress. Ten yield-component traits were studied over a period of 2 years, and the significant differences between the parents and hybrids are reported in this investigation. Overall, all yield component traits were significantly affected by the water deficit and were governed by both additive and non-additive gene actions. More specifically, the grain yield (GY) was mainly controlled by non-additive gene action under both normal and water-stress conditions. The contribution of the additive variance (σ2 A) was more prominent in the genetic components of traits as compared to the dominance variance (σ2 D). The aromatic parental line CMS IR58025A and the restorer line PR2 were recorded as the best combiners for the GY and good combiners for many other characteristics under both growth conditions. The cross combinations Pusa12A/IR25571-31R and Pusa12A/Giza-Basmati-201 revealed significantly positive specific combining ability (SCA) effects for the GY under both normal and water-stress conditions. The inconsistent correlation between the general combining ability (GCA) and SCA manifested complex interactions among the positive and negative alleles of the genes controlling the yield traits. Generally, the findings of this investigation demonstrated the importance of the GCA and SCA for understanding the genetic components and gene actions of the yield characteristics in new aromatic hybrid rice parental lines. Therefore, we recommend considering these findings in the selection of elite parents for developing superior aromatic hybrid rice varieties under water-stress conditions.

1. Introduction

Rice is a prominent global crop that provides essential food for the majority of human beings. Rice contains high carbohydrates, low fat, and is rich in proteins, vitamins, and minerals [1,2]. Rice is grown widely in many regions around the world, including in Egypt. Researchers predicted that the global population will increase continually from the current 7.7 to 9 billion in 2035 [3]. Therefore, this will require a corresponding increase in the global rice demand from the current 763 to 850 million tons. However, only a 1% annual increase in the rice yield was recorded in the past decade [4].
Due to the limited water-resources, along with various biotic and abiotic stresses, the demand for sustainable ways to increase rice production remains an enormous challenge. In Egypt, the performance of the rice sector in terms of the production and yield has been impressive in the last three decades. The wide adoption of semi-dwarf and early maturing Egyptian varieties expedited the rice yield per unit from 5.7 t/ha in the 1980s to the level of 9.52 t/ha in the 2000s [5]. However, this increase in rice production still could not match the increasing rate of population with the decrease in water resources.
The exploitation of heterosis through hybrid rice technology offers a powerful way to increase rice productivity. This technology exploits the heterosis phenomenon, which is the superiority of an F1 hybrid over its parents [6,7]. The F1 hybrid rice has a 15–20% yield advantage over traditional high-yielding inbred varieties [8]. Hybrid rice was first developed in China through a three-line system involving an A-line (cytoplasmic male sterile (CMS)), B-line (maintainer), and R-line (restorer). To produce hybrid rice parental lines; R-lines are crossed with the A-lines to produce F1 progenies, and B-lines are crossed with A-lines to maintain the sterility of the A-lines [9,10].
The main factor for successful hybrid rice technology is to identify superior parental lines for producing hybrid combinations. Therefore, the selection for developing potential parental lines is constantly a challenge for rice breeders. To solve this problem, the combining ability has been used to investigate the ability of a specific parental line to pass on the genetic information to its progeny [11,12,13]. The general combining ability (GCA) estimates the average performance of the parents and reflects additive gene action [11].
The specific combining ability (SCA) measures the performance of the hybrid combinations and reflects non-additive gene action associated with dominance, overdominance, and epistatic effects [14,15]. Line × tester analysis is a powerful biometric approach for measuring both the GCA and SCA, as well as providing information regarding the nature of gene actions [16,17]. Genetic diversity among parental lines has great role in hybrid combinations. Different approaches, both morphological and molecular, have been used to assess the genetic variability of the parental lines used in hybrid rice breeding [3,4,5,6,7,8,9,10,11,12,13,14,15,16,17,18,19,20].
The success story of commercial hybrid rice cultivation in China has encouraged Egypt to adopt this technology [5]. Although aromatic rice constitutes only a small sub-group of rice, it has high economic value. The rice international markets rated aromatic rice as having the highest grain quality and fetching a higher price than good quality non-aromatic rice [21,22]. Increasing the productivity of aroma-rice through hybrid rice technology is of crucial economic importance. Thus, the current investigation was conducted to assess the combining ability and gene action for yield-related traits in new aromatic CMS lines under both normal and water-stress conditions. This is useful for developing elite aromatic hybrid rice varieties.

2. Materials and Methods

2.1. Genotypes Materials and Experimental Designation

Twenty hybrid rice combinations were developed using the line × tester mating design [16] between five aromatic CMS lines with three aromatic and one non-aromatic (IR25571-31-1) restorer lines (Table 1). The parental lines and hybrid combinations were evaluated at the Experimental Farm of Sakha Agricultural Research Station, KafrEL-Sheikh, Egypt (30°57’12” north latitude, 31°07’19” east longitude) during the two rice growing seasons of 2018 and 2019. The soil’s mechanical properties were clay (64.3%), sand (7.6%), and silt (28.1%), with pH ranging from 7.8 to 8.5, and the weather was hot and humid.
Data analysis was performed at the Center of Excellence in Biotechnology Research, Science College, King Saud University, Saudi Arabia. The F1 hybrid combinations along with their respective male and female parents were grown in two experiments. One experiment was transplanted under normal conditions (N) of continuous flooding. The second experiment was transplanted under a water stress regime (S) with flash irrigation every 12 days without any standing water. The stress condition was exposed after 2 weeks from the transplanting date until the maturity stage. All experiments were designed in Randomized Complete Block Design (RCBD) with three replications.
Thirty-day-old seedlings were transplanted with one seedling per hill adopting a spacing of 20 cm between rows and 20 cm between plants. All cultural practices were applied as recommended by the Egyptian rice breeding program [5]. Phenotypic measurements: At maturity, 10 plants from each genotype in each replication were randomly selected to measure the phenotypic data of 10 yield component traits. These yield characteristics included the day to maturity (day; DM), plant height (cm; PH), panicle length (cm; PL), spikelets panicle−1 (SP), panicles plant−1 (PP), panicle weight (g; PW), filled grains panicle−1 (FGP), spikelet fertility (%; SF), 1000-grain weight (g; GW), and grain yield plant−1 (g; GY) according to [23].

2.2. Data Analysis

Dendrogram Analysis: The CMS and tester lines were clustered based on 10 agronomic traits using the UPGMA method of hierarchical clustering [24]. Analysis of variance: Data of the phenotypic traits were subjected to analysis of variance (ANOVA) with the coefficient of variation (CV%) using SAS software version 9.4 as described by [25]. Correlation of traits: Correlation among the values of the traits estimated was calculated using Pearson correlation coefficients and plotted via the packages corrplot and Performance Analytics [26,27]. Combining ability analysis: Analysis of GCA and SCA was performed using the line × tester method according to [16]. The significant test of the GCA and SCA effects was done with an LSD test at 5% and 1%. Heritability: The broad (h2b) and narrow sense (h2n) heritability for the recorded traits was estimated according to [28]. The additive (σ2 A) and dominance (σ2 D) genetic variances were calculated, and the additive and non-additive type of gene actions were performed as described [29].

3. Results

3.1. Genotypes Performance and Variation

Phylogenetic analysis of parental lines: The dendrogram analysis of nine parental lines relied on their morphological data and showed three main clusters with internal sub-clusters revealing varying degrees of diversity (Figure 1). Out of the main clusters, one clustered three CMS lines together, and another formed three aromatic restorer lines. In the third main cluster, however, the non-aromatic restorer line (IR25571-31-1) was placed distantly from the rest of the aromatic restorer lines and was in close affinity with the CMS lines IR68902A and Pusa11a (Figure 1). This indicated that more similar genotypes were grouped in the same cluster based on their phylogeny.
The mean performances of the male and female lines and their hybrid combinations under both normal and water-stress conditions are shown in (Table 1). All traits in this study were affected significantly by the water-stress conditions compared with the normal irrigation conditions. The traits that were highly affected by water-stress were SP, FGP, SP, GW, and GY (Table S1). The parental lines and their hybrid combinations showed better performance in all traits under normal conditions compared with under water-stress (Table S1).
In addition, the hybrids were determined to have high PP, SP, PW, and FGP compared with the assessed parental lines. More specifically, the aromatic restorer lines recorded the highest PW among all genotypes under both normal and water-stress conditions. In terms of the GW trait, all 29 genotypes showed significantly different depression under water stress compared with the normal irrigation conditions. However, the hybrid combination Pusa12A/Giza Basmati 201 followed by Pusa13A/Giza Basmati 201 showed superiority in the 1000-grain weight over the other tested genotypes under both growth conditions.
The hybrid combinations Pusa13A/PR1 and IR68902A/IR25571-31R recorded the highest grain yield under normal irrigation conditions. The hybrid Pusa12A/IR25571-31R followed by the hybrid IR58025A/PR2 demonstrated the highest grain yield under water-stress conditions (Figure 2).
Correlation analysis for the 10 characteristics for all materials under both normal and water-stress conditions are shown in (Figure 3). The data revealed that 16 correlation coefficients showed significantly (p < 0.05) among the traits under normal growth conditions (Figure 3, upper triangle). Among these, one had a negative correlation, and four had highly positive correlations. The GW negatively correlated with the DM, while the four highly positive correlations were two between the PW with PH and SP, and the other two were between the FGP with SP and PW.
All traits showed no or negative correlations with the DM except PH. On the other hand, there were different correlations degrees among all traits except with PH (Figure 3 upper triangle). In terms of the water-stress conditions, a total of 20 correlation coefficients were found to be significant (p < 0.05), eighteen of these were positive and the other two were negative correlations (Figure 3 lower triangle). The DM negatively correlated with the GW and SF, whereas, among the positive correlations, there were five absolute correlations, which were between the PW with PH, PL, and SP; and between the FGP with SP and PW. Similarly, there were no or negative correlations between all traits and the DM except for PH (Figure 3 lower triangle).

3.2. Analysis of Variance (ANOVA)

The ANOVA results revealed significant differences among 29 genotypes tested for all 10 yield traits under both conditions except for SF under normal irrigation conditions (Table 1). However, there were no significant differences observed among the replications for all characteristics, demonstrating the existence of inherent variability among all the crosses. The mean squares due to parents versus hybrids (average heterosis) were significantly high for all characteristics under both growth conditions except for the PP and SF under normal conditions (Table 1). Likewise, the variances due to line × tester (SCA) were significant for all characteristics under both growth conditions except for GY under stress conditions (Table 1). This result reflected the interactions between the female and male lines and produced markedly different specific combining ability effects, which might be due to the wide genetic variability of the CMS and restorer lines.

3.3. Estimation of the Genetic Parameters and Gene Action

The estimates of genetic parameters for all studied traits are shown in Table 2. The results demonstrated that the additive variance (σ2 A) due to the relative importance of the GCA% for the DM, PH, and GW traits was greater than the dominance variance (σ2 D) due to the relative importance of the SCA% for those traits under both growth conditions (Table 2). Whereas, the additive variance (σ2 A), due to relative importance of the GCA% for SP and FGP under normal conditions and PL (under water stress), were greater than the dominance variance (σ2 D) due to the relative importance of the SCA%.
This data indicated that the above-mentioned characteristics were largely governed by additive gene action. On the other hand, the dominance variance (σ2 D) due to the relative importance of the SCA% for the PP, PW, SP, and GY was higher than the additive variance (σ2 A) due to the relative importance of the GCA% under both normal and water-stress conditions. Likewise, the dominance variance (σ2 D), due to the relative importance of the SCA% for the PL (under normal conditions) and SP and FGP under water stress, was greater than the additive variance (σ2 A) due to the relative importance of the GCA% (Table 2).
These findings indicated that the above-mentioned characteristics were largely governed by non-additive gene action. Concerning heritability estimation, in a broad sense (h2b%), the results indicated that the heritability values were high for most of the characteristics studied under both normal and water-stress conditions. However, the heritability values of narrow sense (h2n%) were varied from moderate to high for most of the characteristics under both normal and water-stress conditions (Table 2). These results indicated that a major part of the total genotypic variance was the additive variance.

3.4. General Combining Ability Estimation

Significant differences of the GCA effects of nine parental lines were estimated for 10 yield component characteristics under both normal and water stress growth conditions (Table 3). The GCA estimates of the CMS lines revealed that the CMS line IR58025A was the best combiner due to the highly significant positive GCA effect value for the GY (3.89 and 2.29) under both growth normal and water-stress conditions, respectively. This line was a good combiner for the PW, FGP, SP, and GW under water stress. The CMS line IR68902A recorded the maximum GCA effect value for the PW under normal growth and SP under water stress, and was a good combiner for the PW and FGP under water stress as well as a good combiner for the GY under both normal and water-stress conditions (Table 3).
The CMS line Pusa11A/B was the best combiner for the PL and PW under water-stress conditions. This line was a good combiner for the PH and PP under water stress and the PL, SP, and FGP under both normal and water-stress conditions, respectively (Table 3). The CMS line Pusa12A revealed the highest GCA effect value in terms of the DM, SP, PP, and FGP under both normal and water-stress conditions. In addition, it was the best combiner for the PL, PW, and SF under water-stress conditions. Similarly, the CMS line Pusa13A was found to be the best combiner for the PH and GW under both normal and water stress and was good combiner in terms of the DM and SP under normal conditions (Table 3).
The assessment of GCA among the restorer lines revealed that the non-aromatic restorer line IR25571-31R recorded the maximum GCA effect value for the DM and PL and was a good combiner for the GY under both growth conditions. The aromatic restorer line PR1 exhibited the highest GCA effect for the PH and GY under normal growth conditions; in addition, it was the best combiner for the SP and FGP under water-stress conditions. Similarly, it was the best combiner in terms of the PW under both normal and water-stress conditions (Table 3).
The aromatic restorer line PR2 possessed higher GCA effect values for the PH, PP, and GY under water-stress conditions. Similarly, it was the best combiner for the SP and FGP under normal growth conditions. This line was a good combiner for the SP and FGP under water-stress conditions. The aromatic line Giza Basmati 201 exhibited the highest GCA effect value for the PP and GW under normal and water-stress conditions and was a good combiner in terms of the SP under normal conditions (Table 3).

3.5. Specific Combining Ability Estimation

The SCA estimations of 20 cross combinations for the studied characteristics under normal growth and water-stress conditions are summarized in (Table 4). The results showed that, out of the 20 hybrid rice combinations, 9 (under normal) and 3 (under stress) recorded significantly negative SCA effects for the DM. In addition, 4 (under normal) and 10 (under stress) hybrids showed a negative SCA effect for the PH. There were seven (under normal) and eight (under stress) hybrids that showed significantly positive SCA effects of the PL trait under both normal and water-stress conditions (Table 4).
In terms of the PP, there were six and nine hybrids that had superior SCA effects under normal and water-stress conditions, respectively. Four (under normal) and six (under stress) hybrids showed the highest SCA effects for the SP. Similarly, 2 and 6 hybrids for the PW; 5 and 10 for the FGP; 2 and 7 for the SP; 5 and 6 for the GW; and 6 and 11 for the GY all demonstrated superior SCA effects for these traits under both normal and water-stress conditions, respectively (Table 4). Four combinations viz, Pusa11A/PR1, Pusa12A/IR25571-31R, Pusa12A/Giza-Basmati-201, and Pusa13A/PR1 possessed significantly positive SCA effects for the GY under both normal and water-stress conditions (Table 4).

3.6. Correlation and Distribution of Combining Ability of Yield Traits

The correlation and distribution of the combining ability to yield characteristics, such as the GCA and SCA, contributed variously to different characteristics. The correlation among GCAs or SCAs can be varied from that among the traits per se. The correlation among GCAs and SCAs of yield traits under normal growth conditions are shown in (Figure 4A). It is clear that the correlation between the GCAs of two traits can be the same or different from those between SCAs. We found that the GCA FGP was highly positively correlated with the GCA SP, which was similar to the SCA of those two traits. This indicated that there was a positive additive effect between these two traits.
On the other hand, the GCA GW was positively correlated with the GCA SP and GCA FGP, but the SCA GW was negatively correlated with the SCA SP and SCA FGP. This result demonstrated that there were both positive additive and negative non-additive effects among the GW, SP, and FGP traits. Thus, the dissection of the phenotype into GCA and SCA assisted in explaining the genetic relationships among yield-related traits. In the case of water-stress conditions, the correlations among the GCAs and SCAs of yield traits are shown in (Figure 4B). The data showed that the GCA FGP was highly positively correlated with the GCA PH, GCA SP, GCA PP, and GCA PW.
The SCA FGP was highly positively correlated only with the SCA SP and SCA PW, and no correlation was found between the SCA FGP and the SCA PH and SCA PP (Figure 4B). These data indicated that there was a positive additive effect among the FGP, SP, and PW traits. There were negative non-additive effects among the FGP, PH, and PP. On the other hand, the GCA GW was negatively correlated with the GCA PL, GCA SP, GCA PP, and GCA FGP. However, the SCA GW was negatively correlated with the SCA of all traits except for the DH. This indicated that there were both positive additive and negative non-additive effects among those traits. Thus, this correlation analysis revealed the importance of the GCA and SCA for understanding the genetic relationships among yield characteristics.

4. Discussion

4.1. Variation Analysis

The current investigation evaluated the yield-component characteristics of nine aromatic parental lines, along with their 20 F1 hybrid combinations under normal and water-stress conditions. The assessment of the genetic variation between the CMS and restorer lines is highly requisite for the efficient use of heterosis breeding. In this study, the UPGMA cluster analysis revealed that there was a high diversity difference between the CMS and restorer lines (Figure 1). This wide diversity can lead to the development of super heterotic hybrid Rice [18,19,20]. Our study revealed that all traits were significantly affected by water deficit compared with normal irrigation conditions (Table S1).
The genotypes that gave the lowest reduction under water-deficit were more tolerant to drought than others. Similar results were reported by previous studies [30,31,32]. Overall, the hybrids performed better for yield-related traits compared with the parental lines, which reflected the evident hybrid vigor (Table S1). The results demonstrated a positive correlation among the yield traits, except for the DM under both conditions and the GW under water-stress conditions. The GY was positively correlated with the PH, PW, PL, and SP (Figure 3). These results were consistent with previous findings as the grain yield demonstrated a significant correlation with the yield-related characteristics under normal growth conditions [3,4,5,6,7,8,9,10,11,12,13,14,15,16,17,18,19,20,21,22,23,24,25,26,27,28,29,30,31,32,33,34].

4.2. Genetic Components of Variance

According to genetic parameter analysis, all characteristics were observed to be under the genetic control of both additive and non-additive gene effects. The additive gene action controlled the traits DM, PH, and GW, whereas the traits PP, PW, SP, and GY were governed by non-additive gene action under both normal and water-stress conditions. These results are in agreement with [35]. Interestingly, there were traits, such as SP and FGP, that were controlled by the additive gene action under normal growth, while the same traits were governed by non-additive gene action under water-stress conditions (Table 2).
These results indicated that the gene action directions were affected by the water-stress conditions. Our results indicated that the heritability h2b values were higher than the h2n values for most of the characteristics studied under both normal and water-stress conditions (Table 2). These results indicated that the total genotypic variance for most traits was additive variance. For the yield component traits, selection for desired genotypes based on phenotype performance may be effective. Previous studies reported the effect of additive gene action on the GY and other yield component traits [22,23,24,25,26,27,28,29,30,31,32,33,34,35,36,37,38,39]. Concurrently, other studies reported the influence of both additive and non-additive gene action, indicating their importance for hybrid rice development [40,41,42,43,44,45].

4.3. Combining Ability and Gene Action
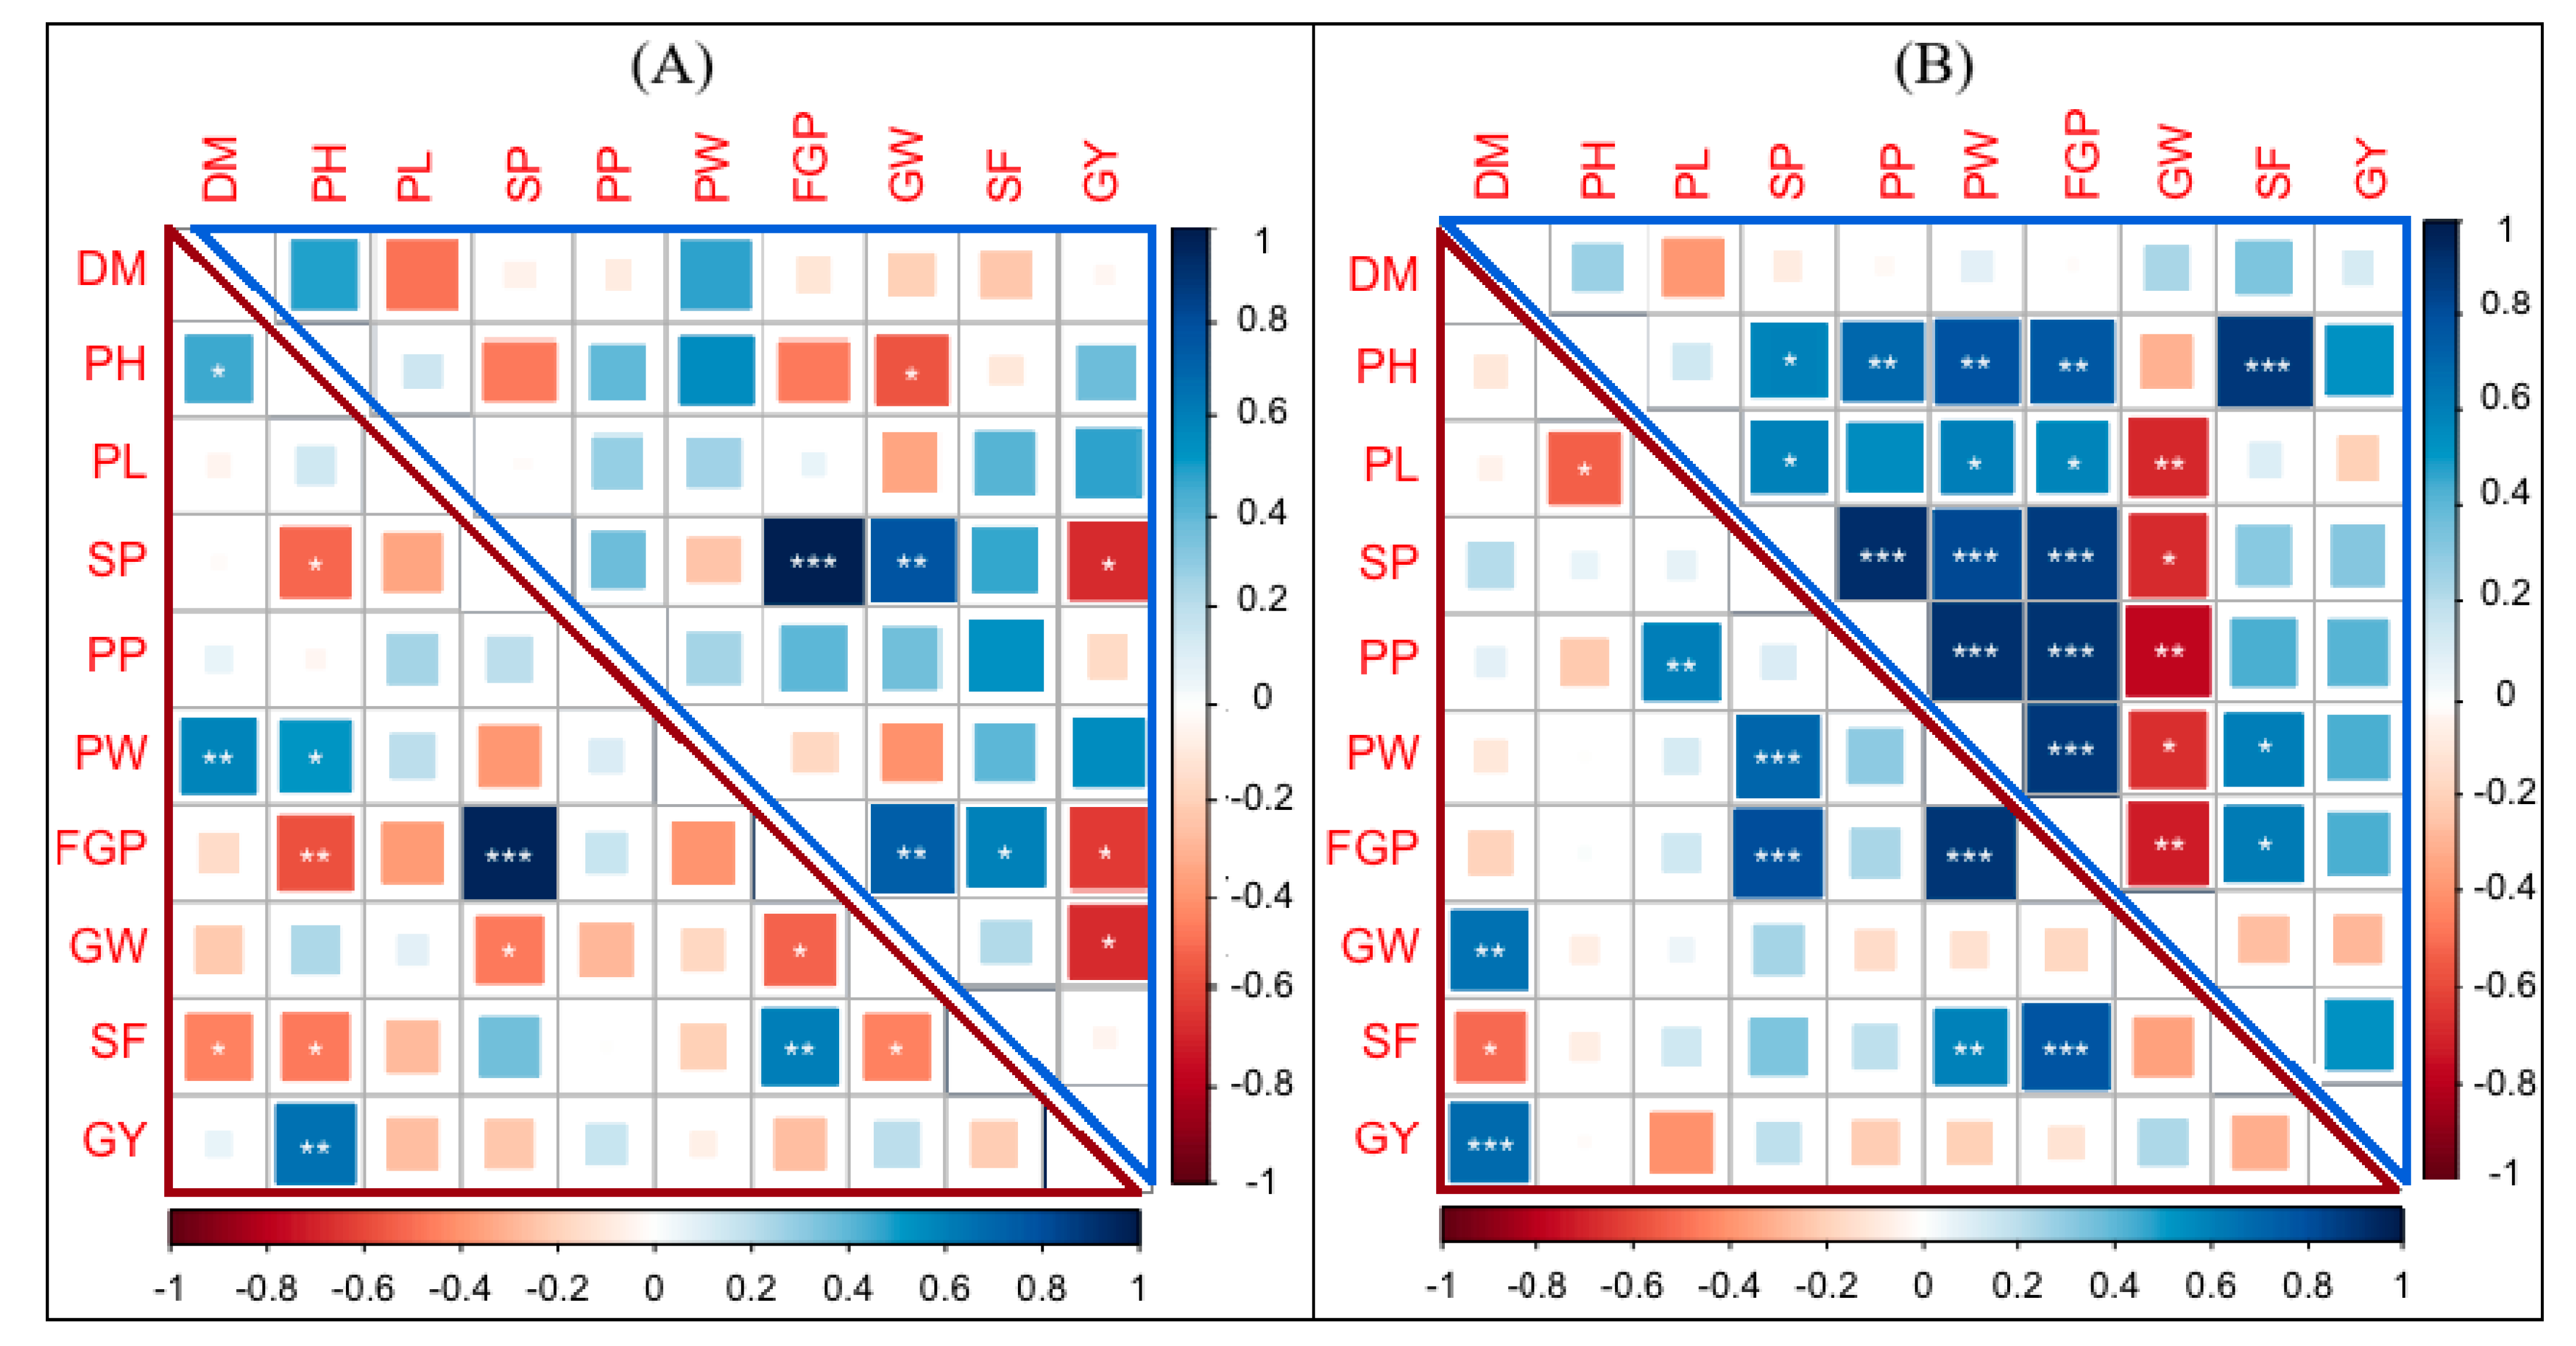
The combining ability was investigated to identify the genotypes with the good genetic potential to develop cross combinations with desirable characteristics and to observe the action of genes involved in trait expression [11]. From a genetic point of view, the GCA measures additive and additive × additive gene action, whereas the SCA estimates non-additive gene action. In the current investigation, all CMS lines were observed to be the best combiner for at least one yield-characteristic and a good combiner for a minimum of two yield component traits under both conditions.
However, among these, the CMS line IR58025A was the best combiner for GY and a good combiner for most of the yield component characteristics under both normal and water-stress conditions. This finding was better compared to previous studies in which no single parent had the best or good GCA effects for all yield component traits [14,15,16,17,18,19,20,21,22,23,24,25,26,27,28,29,30,31,32,33,34,35,36,37,38,39,40,41,42,43,44,45,46,47]. In contrast, all restorer lines also recorded a greater GCA effect for their traits. Among these, the aromatic restorer line PR2 was the best combiner for the PH, PP, GY, SP, and FGP and a good combiner for SP and FGP whether under normal or water-stress conditions. Likewise, a higher GCA of restorer lines was reported in previous studies [5,6,7,8,9,10,11,12,13,14,15,16,17,18,19,20,21,22,23,24,25,26,27,28,29,30,31,32,33,34,35,36,37,38,39,40,41,42,43,44,45,46,47,48].
The SCA estimation of the hybrid combinations demonstrated that all the hybrids showed significantly positive SCA effects for at least one yield characteristic. Among these, the hybrids Pusa12A/IR25571-31R and Pusa12A/Giza-Basmati-201 demonstrated significantly positive SCA effects for the GY under both normal and water-stress conditions (Table 4). These data demonstrated that no specific combination had positive SCA values for all the studied traits concurrently. This finding is in agreement with those reported from previous studies. [45,46,47]. Our results manifested that certain hybrid combinations with a high significant SCA for various traits had both parents with a good GCA.
Such results demonstrated the role of the cumulative effects of additive × additive interactions of positive alleles [49,50,51,52,53]. On the other hand, other hybrids revealed that a significantly high SCA in desirable characteristics had at least one of the parents reflecting poor GCA effects. This may be due to a good combiner parent displaying suitable additive effects and a poor combiner parent producing epistatic effects [50,51,52,53,54]. Concurrently, good-by-good general combiners did not always present the best hybrids in terms of the SCA.
The hybrid Pusa12A/Giza-Basmati-201 had the highest SCA for the GY despite both of its parents having a negative GCA for that trait under both normal and water-stress conditions (Table 4). In contrast, the hybrid IR58025A × IR25571-31-1 exhibited negative SCA effects despite both of its parents having a good GCA for the GY under normal and water-stress conditions. Such results are possible due to complex combinations and interactions among the positive and negative alleles of the genes of the parents. Similar findings were also found in previous studies [14,15,16,17,18,19,20,21,22,23,24,25,26,27,28,29,30,31,32,33,34,35,36,37,38,39,40,41,42,43,44,45,46,47,48,49,50,51,52,53,54,55].

4.4. Correlation

The correlations among GCAs or SCAs can be varied from those among the traits per se. This is due to the additive and non-additive gene effects of the studied traits. In our study, it was clear that the correlation between the GCAs of two characteristics could be the same or different from those between the SCAs. This observed inconsistent correlation between the GCA and SCA is the indication of a complex interaction of genes for quantitative traits [15,16,17,18,19,20,21,22,23,24,25,26,27,28,29,30,31,32,33,34,35,36,37,38,39,40,41,42,43,44,45,46,47,48,49,50,51,52,53]. Such correlation analysis revealed the importance of the GCA and SCA for understanding the genetic relationships among the yield characteristics. Thus, we recommend that breeders should consider both the GCA and SCA in the selection of elite genotypes for producing heterotic hybrids.

5. Conclusions

In this study, we evaluated the combining ability and gene action of five aromatic CMS lines and four restorer lines using line × tester analyses for the yield component characteristics under normal and water-stress growth conditions. Based on the data analysis, all characteristics were affected by water deficits and were governed by both additive and non-additive gene actions. The female and male parents with the potential to produce superior hybrids under both growth conditions were identified. The best hybrid combinations that recorded the highest GY under both growth conditions were detected. In this study, inconsistent correlations between the GCA and SCA demonstrated the importance of both the GCA and SCA for understanding the genetic relationships among yield traits. Therefore, we recommend considering both the GCA and SCA in designing breeding programs for developing superior hybrids.

Supplementary Materials

The following are available online at https://0-www-mdpi-com.brum.beds.ac.uk/2077-0472/11/3/226/s1, Table S1: The mean performance of the Parental Lines and their F1 hybrid for 10 yield component characteristics under normal and water-stress conditions.

Author Contributions

Conceptualization, H.F.E.-M., A.M.R., K.A.A., M.A.E.-H. and R.M.A.; methodology, H.E.E.-D., T.K.A.-A. and R.M.A.; software, T.K.A.-A., K.A.A., A.M.R. and H.E.E.-D.; formal analysis, H.F.E.-M, A.M.R., K.A.A. and M.A.E.-E.; investigation, H.F.E.-M., M.A.E.-H., K.A.A., H.E.E.-D. and M.A.E.-E.; resources, H.F.E.-M. and R.M.A.; writing-original draft preparation, H.F.E.-M, H.E.E.-D., M.D.F.A., L.A.H., and R.M.A.; writing-review and editing, K.A.A., T.K.A.-A., M.D.F.A.; L.A.H. and M.A.E.-E.; funding acquisition, K.A.A.,T.K.A.-A. and H.F.E.-M.; All authors have read and agreed to the published version of the manuscript.

Funding

This research was funded by the Deanship of Scientific Research at Princess Nourah bint Abdulrahman University through the Fast-track Research Funding Program.

Institutional Review Board Statement

Not applicable.

Informed Consent Statement

Not applicable.

Data Availability Statement

Original Data.

Acknowledgments

The authors extend their appreciation to the Deanship of Scientific Research at Princess Nourah bint Abdulrahman University.

Conflicts of Interest

The authors declare that there is no conflict of interest.

References

  1. Khush, G.S. What it will take to Feed 5.0 Billion Rice consumers in 2030. Plant Mol. Biol. 2005, 59, 1–6. [Google Scholar] [CrossRef] [PubMed]
  2. Cheng, S.H.; Zhuang, J.I.Y.; Fan, Y.Y.; Du, J.I.H.; Cao, L.I.Y. Progress in research and development on hybrid rice: A super-domesticate in China. Ann. Bot. 2007, 100, 959–966. [Google Scholar] [CrossRef] [PubMed]
  3. Leonilo, V.G.; Joanne, D.C.; Enriquez, J.O.S. Heterosis and combining ability analysis in CMS hybrid rice. Euphytica 2020, 216, 14. [Google Scholar]
  4. Khush, G. Strategies for increasing the yield potential of cereals: Case of rice as an example. Plant. Breed. 2013, 132, 433–436. [Google Scholar] [CrossRef]
  5. El-Mowafi, H.F.; Bastawisi, A.O.; Abo-Youssef, M.I.; Zaman, F.U. Exploitation of rice heterosis under Egyptian conditions. Egypt. J. Agric. 2005, 83, 143–166. [Google Scholar]
  6. Shull, G.H. Duplicate genes for capsule form in Bursa bursa-pastoris. Zeitschrift Induktive Abstammungs Vererbungslehre 1914, 12, 97–149. [Google Scholar] [CrossRef]
  7. Virmani, S.S. Hybrid rice. Adv. Agron. 1996, 57, 378–462. [Google Scholar]
  8. Virmani, S.S.; Mao, C.X.; Hardy, B. Hybrid Rice for Food Security, Poverty Alleviation, and Environmental Protection. In Proceedings of the 4th International Symposium on Hybrid Rice, Hanoi, Vietnam, 14–17 May 2002; p. 407. [Google Scholar]
  9. Virmani, S.S.; Sun, Z.X.; Mou, T.M.; Ali, A.J.; Mao, C.X. Two Lines Hybrid Rice Breeding Manual; International Rice Research Institute: Los Banos, Philippines, 1997. [Google Scholar]
  10. Chang, Z.; Wang, N.; Xie, G.; Lu, W.; Zhou, J.; Tang, X.; Deng, X.W. Construction of a male sterility system for hybrid rice breeding and seed production using a nuclear male sterility gene. Proc. Natl. Acad. Sci. USA 2016, 113, 14145–14150. [Google Scholar] [CrossRef] [Green Version]
  11. Sprague, G.A.; Tatum, L.A. General vs specific combining ability in single crosses of corn. J. Am. Soc. Agron. 1942, 34, 923–932. [Google Scholar] [CrossRef]
  12. Griffing, B. Concept of general and specific combining ability in relation to diallel crossing systems. Aust. J. Biol. Sci. 1956, 9, 463–493. [Google Scholar] [CrossRef]
  13. Aly, R.S.H. Relationship between combining ability of grain yield and yield components for some newly yellow maize inbred lines via line 9 tester analysis. Alex. J. Agric. Res. 2013, 58, 115–124. [Google Scholar]
  14. Latha, S.; Sharma, D.; Sanghera, G.S. Combining ability and heterosis for grain yield and its components in rice (Oryza sativa L.). Not. Sci. Biol. 2013, 5, 90–97. [Google Scholar] [CrossRef] [Green Version]
  15. Su, J.; Zhang, F.; Yang, X.; Feng, Y.; Yang, X.; Wu, Y.; Guan, Z.; Fang, W.; Chen, F. Combining ability, heterosis, genetic distance and their intercorrelations for waterlogging tolerance traits in chrysanthemum. Euphytica 2017, 213, 42. [Google Scholar] [CrossRef] [Green Version]
  16. Kempthorne, O. An Introduction to Genetic Studies; John Willey Sons Inc.: New York, NY, USA, 1957; pp. 458–471. [Google Scholar]
  17. Dey, S.S.; Bhatia, R.; Bhardwaj, I.; Mishra, V.; Sharma, K.; Parkash, C. Molecular-agronomic characterization and genetic study reveals usefulness of refined Ogura cytoplasm based CMS lines in hybrid breeding of cauliflower (Brassica oleracea var. botrytis L.). Sci. Hortic. 2017, 224, 27–36. [Google Scholar] [CrossRef]
  18. Wang, K.; Qiu, F.; Larazo, W.; Dela Paz, M.A.; Xie, F. Heterotic groups in tropical indica rice germplasm. Appl. Genet. 2015, 128, 421–430. [Google Scholar] [CrossRef]
  19. Wang, Y.; Cai, Q.; Xie, H.; Wu, F.; Lian, L.; He, W.; Chen, L.; Xie, H.; Zhang, J. Determination of heterotic groups and heterosis analysis of yield performance in indica rice. Rice Sci. 2018, 25, 261–269. [Google Scholar]
  20. Xie, F.; He, Z.; Esguerra, M.Q.; Qiu, F.; Ramanathan, V. Determination of heterotic groups for tropical Indica hybrid rice germplasm. Appl. Genet. 2014, 127, 407–417. [Google Scholar] [CrossRef] [PubMed]
  21. Singh, N.K.; Kumar, A. Combining ability analysis to identify suitable parents for heterotic rice hybrid breeding. IRRN 2004, 29, 21–22. [Google Scholar]
  22. El-Mowafi, H.F.; Abdallah, R.M.; Abdelkhalek, S.M.; Mubarak, M.H. Combining ability and molecular evaluation for developing new basmati rice hybrids in Egypt. Egypt J. Plant Breed. 2018, 22, 1467–1485. [Google Scholar]
  23. International Rice Research Institute (IRRI). Standard Evaluation System (SES) for Rice, 5th ed.; International Rice Research Institute (IRRI): Los Banos, Philippines, 2013.
  24. Esteves, F.R. Script for UPGMA Analysis. Available online: https://www.researchgate.net/publication/303944638_R_script_for_Principal_Component_Analysis_PCA (accessed on 15 July 2018).
  25. Team, C.R. R: A Language and Environment for Statistical Computing; R Foundation for Statistical Computing: Vienna, Austria, 2008. [Google Scholar]
  26. Wei, T.; Simko, V.; Levy, M.; Xie, Y.; Jin, Y.; Zemla, J. Corrplot: Visualization of a Correlation Matrix. Available online: http://cran.r-project.org/package=corrplot (accessed on 2 August 2018).
  27. Peterson, B.G.; Carl, P.; Boudt, K.; Bennett, R.; Ulrich, J.; Zivot, E.; Cornilly, D.; Hung, E.; Lestel, M.; Balkissoon, K. Performance Analytics: Econometric Tools for Performance and Risk Analysis. Available online: https://github.com/braverock/PerformanceAnalytics (accessed on 2 August 2018).
  28. Griffiths, A.J.F.; Miller, J.H.; Suzuki, D.T.; Lewontin, R.C.; Gelbart, W.M. An Introduction to Genetic Analysis, 7th ed.; WH Freeman and Company: New York, NY, USA, 2000; p. 860. [Google Scholar]
  29. Verma, O.P.; Srivastava, H.K. Genetic components and combining ability analysis in relation to heterosis for yield and associated traits using three divers rice growing ecosystem. Proc. Natl. Acad. Sci. USA 2004, 88, 91–102. [Google Scholar]
  30. Manickavelu, A.; Nadarajan, S.K.; Ganesh, R.P.; Gnanamalar, R.C. Drought tolerance in rice: Morphological and molecular genetic consideration. Plant. Growth Regul. 2006, 50, 121–138. [Google Scholar] [CrossRef]
  31. El-Hity, M.A.; El-Degwy, E.S.; Reda, A.M.; Abdallah, R.M.; Hadefa, E.A. Combining ability and genetic parameters analysis for three and two line system in hybrid rice under normal and water-stress conditions. J. Agric. Res. 2015, 41, 1118–1131. [Google Scholar]
  32. Herwibawa, B.; Sakhidin; Haryanto, T.A. Agronomic performances of aromatic and nonaromatic M1 rice under drought stress. Open Agric. 2019, 4, 575–584. [Google Scholar] [CrossRef]
  33. Kropff, M.J.; Cassman, K.G.; Peng, S.; Matthews, R.B.; Setter, T.L. Quantitative understanding of yield potential. Break. Yield Barrier 1994, 1, 21–38. [Google Scholar]
  34. Ying, J.; Peng, S.; He, Q.; Yang, H.; Yang, C.; Visperas, R.M.; Cassman, K.G. Comparison of high yield rice in tropical and subtropical environments I: Determinants of grain and dry matter yields. Field Crop. Res. 1998, 57, 71–84. [Google Scholar] [CrossRef]
  35. Singh, R.K.; Chaudhary, B.D. Biometrical methods in quantitative genetic analysis. Biom. Methods Quant. Genet. Anal. 1979, 3, 318. [Google Scholar]
  36. Sharma, M.K.; Sharma, A.K.; Agarwal, R.K.; Richharia, A.K. Combining ability and gene action for yield and quality characteristics in Ahu rices of Assam. Indian J. Genet. 2007, 67, 278–280. [Google Scholar]
  37. Tyagi, J.P.; Tejbir, S.; Singh, V.P. Genetic analysis of combining ability for quality characteristics in Basmati rice. Int. J. Rice 2010, 47, 96–99. [Google Scholar]
  38. Qu, Z.; Li, L.; Luo, J.; Wang, P.; Yu, S.; Mou, T.; Zheng, X.; Hu, Z. QTL mapping of combining ability and heterosis of agronomic traits in rice backcross recombinant inbred lines and hybrid crosses. PLoS ONE 2012, 7, 1–10. [Google Scholar] [CrossRef]
  39. Ganapati, R.K.; Rasul, M.G.; Sarker, U.; Singha, A.; Faruquee, M. Gene action of yield and yield contributing traits of submergence tolerant rice (Oryza sativa L.) in Bangladesh. Bull. Natl. Res. Cent. 2020, 44, 2–7. [Google Scholar] [CrossRef] [Green Version]
  40. Ghosh, A. Combining ability for yield and its related traits in upland rice. Int. J. Rice 1993, 30, 275–279. [Google Scholar]
  41. Sreeramachandra, B.M.; Satyanarana, P.V.; Madhuri, J.; Kumar, R.V. Combining ability analysis for identifying elite parents for hybrid rice. Acad. J. Agric. Res. 2000, 37, 19–22. [Google Scholar]
  42. Singh, R.K. Heterosis breeding in aromatic rice for yield and quality characteristics. Indian J. Genet. Plant Breed. 2005, 65, 176–179. [Google Scholar]
  43. Kumar, S.; Singh, H.B.; Sharma, J.K. Combining ability analysis for grain yield and other associated traits in rice. Oryza 2007, 44, 108–114. [Google Scholar]
  44. El-Mowafi, H.F.; Reda, A.M.; Abdallah, R.M.; Arafat, E.F.A. Combining ability analysis for agronomic and yield attributing traits in hybrid rice. Egypt J. Plant Breed. 2015, 19, 2195–2219. [Google Scholar] [CrossRef]
  45. Huang, M.; Chen, L.Y.; Chen, Z.Q. Diallel analysis of combining ability and heterosis for yield and yield components in rice by using positive loci. Euphytica 2015, 205, 37–50. [Google Scholar] [CrossRef]
  46. Tiwari, K.; Pandey, P.; Giri, S.P.; Dwivedi, J.L. Heterosis studies for yield and its components in rice hybrids using CMS system. Asian J. Plant. Sci. 2011, 10, 29–42. [Google Scholar] [CrossRef]
  47. Yuga, M.E.; Kimani, P.M.; Olubayo, M.F.; Muthomi, J.W.; Nzuve, F.M. Combining ability of heterosis for agronomic and yield traits in indica and japonica rice crosses. J. Agric. Sci. 2018, 10, 92–103. [Google Scholar] [CrossRef]
  48. Attia, K.A.; Zhong, X.Q.; Bastawisi, A.O. Combining ability and standard heterosis analysis of two-line system hybrid rice. Pak. J. Biol. Sci. 2001, 4, 346–350. [Google Scholar]
  49. Singh, S.; Bhatia, R.; Kumar, R.; Sharma, K.; Dash, S.; Dey, S.S. Cytoplasmic male sterile and doubled haploid lines with desirable combining ability enhances the concentration of important antioxidant attributes in Brassica oleracea. Euphytica 2018, 214, 207. [Google Scholar] [CrossRef]
  50. Fasahat, P.; Rajabi, A.; Rad, M.J.; Derera, J. Principles and utilization of combining ability in plant breeding. Biom. Biostat. Int. J. 2016, 4, 1–24. [Google Scholar] [CrossRef]
  51. Singh, S.; Dey, S.S.; Bhatia, R.; Kumar, R.; Sharma, K.; Behera, T.K. Heterosis and combining ability in cytoplasmic male sterile and doubled haploid based Brassica oleracea progenies and prediction of heterosis using microsatellites. PLoS ONE 2019, 14, 1–26. [Google Scholar] [CrossRef]
  52. Zaid, I.U.; Tang, W.; Liu, E.; Khan, S.U.; Wang, H.; Mawuli, E.W.; Hong, D. Genome-Wide single-nucleotide polymorphisms in cms and restorer lines discovered by genotyping using sequencing and association with marker-combining ability for 12 yield-related traits in Oryza sativa L. subsp. Japonica. Front. Plant Sci. 2019, 8, 143. [Google Scholar] [CrossRef] [Green Version]
  53. Chen, J.; Zhou, H.; Xie, W.; Xia, D.; Gao, G.; Zhang, Q.; Wang, G.; Lian, X.; Xiao, J.; He, Y.; et al. Genome-wide association analyses reveal the genetic basis of combining ability in rice. Plant Biot. J. 2019, 17, 2211–2222. [Google Scholar] [CrossRef] [PubMed] [Green Version]
  54. Tyagi, V.; Dhillon, S.K.; Kaushik, P.; Kaur, G. Characterization for Drought tolerance and physiological efficiency in novel cytoplasmic male sterile sources of sunflower (Helianthus annuus L.). Agronomy 2018, 8, 232. [Google Scholar] [CrossRef] [Green Version]
  55. Sanghera, G.S.; Hussain, W. Heterosis and combining ability estimates using line × tester analysis to develop rice hybrids for temprate conditions. Not. Sci. Biol. 2012, 4, 131–142. [Google Scholar] [CrossRef] [Green Version]
Figure 1. UPGMA dendrogram analysis of aroma cytoplasmic male sterile (CMS) and Restorer lines based on the morpho-logical data of their yield component characteristics.
Agriculture 11 00226 g001
Figure 2. The mean performance of promising genotypes for five economic yield characteristics under normal and water-stress conditions. N (normal irrigation conditions), and S (water-stress conditions).
Agriculture 11 00226 g002
Figure 3. Corrplot depicting Pearson’s correlation between 10 yield traits across 29 genotypes under normal (upper triangle) and water-stress (lower triangle) conditions. Red squares indicate a negative correlation; blue squares indicate a positive correlation; and white squares indicate no correlation. The asterisks indicate significant correlations using a two-tailed t-test (* and ** p < 0.05; and *** p < 0.01).
Agriculture 11 00226 g003
Figure 4. Corrplot depicting Pearson’s correlation between the general and specific combining ability for 10 yield traits across 29 genotypes. Red squares indicate a negative correlation; blue squares indicate a positive correlation; and white squares indicate no correlation. (A) GCAs (upper triangle) and SCAs (lower triangle) under normal growth conditions. (B) GCAs (upper triangle) and SCAs (lower triangle) under water-stress conditions. The asterisks indicate significant correlations using a two-tailed t-test (* and ** p < 0.05; and *** p < 0.01).
Agriculture 11 00226 g004
Table 1. Analysis of Variance of the Line × Tester Mating Design for 10 Yield Characteristics under Normal and Water-Stress Conditions.
S.O.V.dfDays to Maturity
(Day)
Plant Height
(cm)
Panicle Length
(cm)
Spikelets/PanicleTillers Plant
NSNSNSNSNS
Replications20.390.556.025.380.040.0113.35111.862.690.01
Treatments2834.91 **22.79 **170.58 **178.57 **8.77 **9.28 **1855.11 **2504.73 **37.21 **18.02 **
Parents844.62 **52.02 **135.76 **95.75 **14.73 **8.06 **458.96 **713.41 **24.22 **26.65 **
Crosses1926.93 **10.68 **63.19 **152.45 **4.60 **8.03 **697.40 **1707.76 **39.71 **13.82 **
Par.vs.crosses1108.70 **18.94 **2489.36 **1337.44 **40.26 **42.99 **35,020.86 **31,977.68 **93.47 **28.92 **
Lines435.19 **18.17 **127.74 **383.48 **2.65 **26.84 **1900.03 **3098.91 **28.72 **13.82 **
Testers387.54 **25.84 **27.15 *57.65 **3.29 *3.15 **644.52 **1151.53 **56.25 **12.40 **
Lines × testers129.03 **4.40 *50.69 **99.14 **5.58 **2.97 **309.75 **1383.10 **39.24 **14.18 **
Residual560.521.7911.23 2.120.940.0128.50122.010.960.02
CV% 0.540.992.951.433.480.472.346.034.610.7
S.O.V.dfPanicle WeightFilled Grains PanicleGrain Yield PlantSpikelet Fertility%1000 Grain Weight
NSNSNSNSNS
Replications20.030.017.740.862.450.050.224.560.050.002
Treatments282.13 **2.41 **1689.51 **2482.01 **212.35 **93.58 **4.79 **123.23 **8.47 **13.70 **
Parents81.30 **0.59 **373.21 **570.26 **53.36 **57.87 **1.57177.96 **20.87 **32.76 **
Crosses190.26 **1.96 **743.52 **2005.10 **209.98 **84.40 **6.36 **101.85 **2.96 **2.66 **
Par.vs.crosses144.29 **25.46 **301,93.81 **26,837.20 **1529.30 **553.66 **0.5591.64 **13.89 **70.79 **
Lines40.37 **5.21 **2001.32 **2737.07 **103.81 **74.50 **13.16 **143.07 **9.62 **5.50 **
Testers30.210.04599.43 **1431.12 **243.62 **69.14 **0.8023.04 **3.76 **4.19 **
Lines × testers120.23 **1.35 **360.27 **1904.61 **236.96 **91.525.49 **107.81 **0.54 **1.33 **
Residual560.080.0236.970.676.370.531.711.900.070.04
CV% 5.303.492.910.545.492.371.421.660.990.80
* and **—Significant differences at the 0.05 and 0.01 levels of probability, respectively. N: Normal conditions. S: Water-stress conditions.
Table 2. Genetic Parameters for 10 Yield Characteristics Under Normal and Water-Stress Conditions.
S.O.V.Days to Maturity
(Day)
Plant Height
(cm)
Panicle Length
(cm)
Spikelets Panicle−1Panicles Plant−1
NSNSNSNSNS
Parameter
Additive variance (σ2 A)7.4142.5774.85220.928−0.3972.001154.842127.5460.257−0.149
Dominant variance (σ2 D)2.8350.86913.15332.3411.5450.98693.747420.36312.7634.720
Environmental variance (σ2 E)0.5221.79411.2272.1200.9420.01428.504122.0130.9550.016
Genotypic variance (σ2 G)10.2493.44518.00653.2691.1482.987248.589547.90913.0204.571
Phenotypic variance (σ2 P)10.7715.23929.23355.3892.0903.001277.093669.92213.9754.587
Broad sense heritability (h2b)%95.15465.75861.59596.17354.93099.53389.71381.78793.16699.651
Narrow sense heritability (h2n)%68.83349.17816.59937.784−18.97566.68955.88119.0391.839−3.242
Relative importance of GCA% *72.33974.78626.95039.288−34.54567.00262.28823.2791.973−3.254
Relative importance of SCA% **27.66125.21473.05060.712134.54532.99837.71276.72198.027103.254
S.O.V.Panicle Weight (g)Filled Grains Panicle−11000 Grain Weight (g)Spikelet Fertility%Grain Yield Plant−1
NSNSNSNSNS
Parameter
Additive variance (σ2 A)0.0100.235152.69837.8050.9710.5370.326−2.713−10.652−2.909
Dominant variance (σ2 D)0.0500.444107.768634.6490.1560.4331.26035.30276.86630.328
Environmental variance (σ2 E)0.0840.01936.9650.6660.0700.0351.7081.9026.3660.530
Genotypic variance (σ2 G)0.0590.679260.467672.4541.1280.9701.58632.58966.21427.419
Phenotypic variance (σ2 P)0.1430.698297.432673.1201.1981.0053.29434.49172.58027.949
Broad sense heritability (h2b)%41.42997.27687.57299.90194.15596.51948.15594.48591.22998.104
Narrow sense heritability (h2n)%6.79833.67751.3395.61681.10153.4549.910−7.866−14.677−10.410
Relative importance of GCA% *16.41034.62058.6255.62286.13655.38220.578−8.325−16.088−10.611
Relative importance of SCA% **83.59065.38041.37594.37813.86444.61879.422108.325116.088110.611
N: Normal conditions. S: Water-stress conditions; * significant at p < 0.05, ** high significant at p < 0.01.
Table 3. Estimation of the General Combining Ability (GCA) Effects of Parental Genotypes for 10 Yield Characteristics Under Normal and Water-Stress Conditions.
GenotypesDays to Maturity
(day)
Plant Height
(cm)
Panicle Length
(cm)
Spikelets Panicle−1Panicles Plant−1
NSNSNSNSNS
Lines
IR58025A0.35 *0.212.79 **2.44 **−0.96 **−0.33 **−15.70 **−1.29−0.08−0.28 **
IR68902A2.03 **1.83 **2.71 **4.69 **0.51 *−0.47 **−11.04 **−4.02−0.270.24 **
Pusa 11a0.93 **0.031.29−2.31 **0.98 **1.69 **8.54 **9.29 **0.140.79 **
Pusa 12A−2.42 **−1.55 **−2.21 *4.03 **1.64 **0.26 **12.75 **19.47 **0.72 **1.61 **
Pusa 13A−0.89 **−0.52−4.57 **−8.85 **−2.18 **−1.16 **5.45 **−23.45 **−0.51 *−2.36 **
LSD 5%0.350.651.620.700.470.062.585.330.470.06
1%0.500.922.311.000.670.093.687.620.670.08
Testers
IR25571-31-1−3.48 **−1.86 **0.22−1.14 **2.35 **0.95 **−9.44 **−4.590.09−0.33 **
PR 10.92 **0.12−1.71 *2.13 **0.65 **0.57 **0.828.68 **−0.46 *0.31 **
PR 20.48 **0.58 *−0.07−2.11 **−0.87 **−0.53 **5.30 **5.88 **−0.240.47 **
Giza Basmati 2012.08 **1.16 **1.57 *1.13 **−2.13 **−0.98 **3.32 **−9.97 **0.61 **−0.45 **
LSD 5%0.310.581.450.630.420.052.304.770.420.05
1%0.450.832.070.900.600.083.296.820.600.07
GenotypesPanicle Weight (g)Filled Grains Panicle−11000 Grain Weight (g)Spikelet Fertility%Grain Yield Plant−1 (g)
NSNSNSNSNS
Lines
IR58025A−0.020.16 **−16.57 **3.63 **−0.54 **0.58 **−0.95 **1.58 **3.89 **2.29 **
IR68902A0.30 **0.18 **−9.44 **5.92 **−1.21 **−0.32 **0.344.53 **2.38 **1.55 **
Pusa 11a−0.090.41 **5.86 **4.75 **0.07−0.60 **−0.79 *−2.01 **−1.51 *−2.50 **
Pusa 12A−0.030.41 **15.82 **12.08 **0.72 **−0.52 **1.64 **0.42−2.01 **1.57 **
Pusa 13A−0.15 *−1.16 **4.33 **−26.38 **0.96 **0.87 **−0.24−4.52 **−2.74 **−2.91 **
LSD 5%0.140.072.930.390.130.090.630.671.220.35
1%0.200.104.190.560.180.130.900.951.740.50
Testers
IR25571-31-1−0.060.01−9.02 **−1.34 **−0.43 **−0.38 **−0.121.06 **2.73 **0.42 *
PR 10.15 *0.07 *1.0510.99 **−0.13 *0.060.090.88 **4.13 **−2.34 **
PR 2−0.13 *−0.015.68 **2.83 **−0.16 **−0.40 **0.28−1.62 **−2.83 **2.74 **
Giza Basmati 2010.04−0.07 *2.29−12.48 **0.72 **0.73 **−0.24−0.32−4.03 **−0.82 **
LSD 5%0.130.062.620.350.110.080.560.601.090.31
1%0.180.093.750.500.160.120.810.851.560.45
* and **—Significant differences at the 0.05 and 0.01 levels of probability, respectively.
Table 4. Estimation of Specific Combining Ability (SCA) Effects of Hybrid Rice Combinations for 10 Yield Characteristics Under Normal and Water-Stress Conditions.
HybridDays to Maturity
(day)
Plant Height
(cm)
Panicle Length
(cm)
Spikelets Panicle−1Panicles Plant−1
NSNSNSNSNS
IR58025A × IR25571-31-11.57 **−0.03−0.38−4.44 **−0.042.80 **19.34 **−14.25 *0.96 *1.15 **
IR58025A × PR 11.67 **1.02−1.79−3.38 **0.00−0.87 **−6.68 *−9.51−0.150.48 **
IR58025A × PR 2−0.78 *0.401.91−0.140.18−0.55 **−5.71 *2.95−0.17−1.70 **
IR58025A × Giza Basmati 201−2.46 **−1.38 *0.277.96 **−0.13−1.38 **−6.95 *20.81 **−0.650.08
IR68902A × IR25571-31-1−1.41 **−0.671.377.98 **−2.44 **−1.36 **0.12−11.85 *−0.51−0.63 **
IR68902A × PR 10.96 *0.171.63−2.29 **−4.77 **−2.00 **1.2720.23 **−0.62−0.69 **
IR68902A × PR 21.81 **1.061.32−1.062.96 **1.06 **1.48−6.651.16 *0.72 **
IR68902A × Giza Basmati 201−1.37 **−0.57−4.32 *−4.63 **4.26 **2.30 **−2.87−1.73−0.030.60 **
Pusa 11A × IR25571-31-10.79 *0.955.12 **−2.03 **4.81 **1.44 **−14.12 **9.84−1.26 *0.03
Pusa 11A × PR 1−1.25 **−0.59−1.291.71 *−2.62 **−1.72 **4.52−32.45 **−0.70−0.93 **
Pusa 11A × PR 2−0.83 *0.04−0.59−2.39 **0.261.46 **1.1830.38 **2.08 **1.46 **
Pusa 11A × Giza Basmati 2011.29 **−0.41−3.23 *2.71 **−2.45 **−1.18 **8.42 **−7.77−0.11−0.56 **
Pusa 12A × IR25571-31-10.471.210.953.98 **0.76−2.63 **−13.38 **13.34 *1.17 *0.14 *
Pusa 12A × PR 1−1.46 **−1.21−2.12−5.29 **5.47 **3.93 **4.616.74−0.010.60 **
Pusa 12A × PR 2−1.18 **−1.61 *−4.76 **2.94 **−3.14 **−1.08 **10.00 **−31.13 **−0.570.01
Pusa 12A × Giza Basmati 2012.18 **1.61 *5.93 **−1.63 *−3.09 **−0.23 **−1.2211.06 *−0.59−0.75 **
Pusa 13A × IR25571-31-1−1.42 **−1.46 *−7.05 **−5.48 **−3.08 **−0.24 **8.04 **2.92−0.37−0.69 **
Pusa 13A × PR 10.080.603.57 *9.25 **1.92 **0.65 **−3.7214.99 *1.49 **0.54 **
Pusa 13A × PR 20.99 *0.112.130.65-0.25−0.90 **−6.95 *4.45−2.50 **−0.50 **
Pusa 13A × Giza Basmati 2010.350.751.35−4.42 **1.42 **0.49 **2.62−22.36 **1.38 **0.64 **
LSD 5%0.701.293.231.400.940.125.1510.660.940.11
1%1.001.854.622.011.350.177.3715.241.340.16
HybridPanicle Weight (g)Filled Grains Panicle−11000 Grain Weight (g)Spikelet Fertility%Grain Yield Plant−1
NSNSNSNSNS
IR58025A × IR25571-31-1−0.03−0.32 **20.63 **−14.16 **−0.54 **−0.21 *1.25−0.23−1.33−3.09 **
IR58025A × PR 10.17−0.42 **−9.46 **−14.16 **0.38 **0.46 **−1.50 *−2.18 **−7.71 **1.89 **
IR58025A × PR 20.20−0.26 **−6.77 *−6.99 **0.170.01−0.56−4.98 **2.124.80 **
IR58025A × Giza Basmati 201−0.34 *1.00 **−4.4135.31 **−0.01−0.26 **0.817.39 **6.92 **−3.61 **
IR68902A × IR25571-31-1−0.15−0.57 **−1.73−22.28 **0.60 **−0.19 *−0.85−5.73 **8.24 **−3.74 **
IR68902A × PR 10.210.82 **4.5419.88 **−0.45 **0.051.49 *2.02 **0.442.12 **
IR68902A × PR 20.070.03−2.722.05 **−0.44 **0.37 **−1.67 *4.61 **1.233.71 **
IR68902A × Giza Basmati 201−0.13−0.28 **−0.090.350.29 *−0.23 *1.03−0.89−9.91 **−2.09 **
Pusa 11A × IR25571-31-10.230.46 **−15.95 **1.72 **0.29 *1.19 **−1.37 *−3.14 **−0.50−2.50 **
Pusa 11A × PR 1−0.09−1.06 **7.22 *−37.62 **−0.12−0.36 **1.28 *−4.97 **4.09 **3.33 **
Pusa 11A × PR 2−0.060.59 **2.6927.38 **0.23−0.43 **0.711.83 *0.751.78 **
Pusa 11A × Giza Basmati 201−0.090.016.04 *8.52 **−0.40 **−0.40 **−0.626.28 **−4.35 **−2.61 **
Pusa 12A × IR25571-31-10.29 *0.43 **−11.30 **17.55 **-0.32 *-0.40 **0.58−0.083.40 *8.14 **
Pusa 12A × PR 1−0.070.67 **3.8325.72 **−0.06−0.38 **−0.176.45 **−12.64 **−8.80 **
Pusa 12A × PR 2−0.31 *−0.36 **12.56 **−22.45 **−0.10−0.50 **1.20−0.32−0.41−6.28 **
Pusa 12A × Giza Basmati 2010.09−0.74 **−5.09−20.82 **0.48 **1.29 **−1.61 *−6.06 **9.65 **6.95 **
Pusa 13A × IR25571-31-1−0.34 *0.008.35 *17.18 **−0.02−0.40 **0.399.17 **−9.81 **1.18 **
Pusa 13A × PR 1−0.22−0.01−6.14 *6.18 **0.240.24 *−1.10−1.3215.82 **1.46 **
Pusa 13A × PR 20.090.00−5.760.010.140.55 **0.31−1.13−3.69 **−4.01 **
Pusa 13A × Giza Basmati 2010.47 **0.023.55−23.36 **−0.36 *−0.40 **0.40−6.72 **−2.321.37 **
LSD 5%0.280.135.870.790.260.181.261.332.430.70
1%0.400.198.391.130.370.261.801.903.481.00
* and **—Significant differences at the 0.05 and 0.01 levels of probability, respectively.
Publisher’s Note: MDPI stays neutral with regard to jurisdictional claims in published maps and institutional affiliations.

