1. Introduction
Currently, the world economy is focusing its attention on the financial situation and measuring the financial health of businesses more than ever before. The financial condition of companies is influenced by various factors, whose significance must be identified in order to achieve sustainable long-term business development. The situation in agriculture, which is the primary sector of the national economy of the Slovak Republic, is no exception. It is therefore important for farmers to be aware of the basic factors influencing their prosperity, success, and performance, as well as to assess the current position of society, its financial capabilities, and capabilities compared to the competitive environment, also due to increasing globalization in this sector.
Assessing the financial condition of agricultural companies and diagnosing critical situations through effective methods allow for the identification of the threat of bankruptcy in the earliest stages and the utilization of all options to address it. Thus, accurate and timely diagnosis of problems and critical situations helps to eliminate the probable consequences of the negative effects on the financial health of agricultural companies, taking into account the specifics of accounting and agricultural production [
1]. The critical factors of failure vary in the agricultural sector. There are factors that are similar to those in other sectors, such as a high level of corporate indebtedness and the associated high interest rates, the lower level of profitability in the recession phase, etc. However, specific factors include those that have adverse environmental effects (droughts, floods, frost, etc.) [
2]. According to Majstorovic et al. [
3], in order to ensure appropriate conditions for the development of agricultural companies and their survival on the market, emphasis should be placed on modern management of their future activities. In this context, the business analysis of agrarian entities, which is able to "generate" data on modern management, is of great importance. Myšková and Hájek [
4] state that a financially healthy company is a company that is capable of creating a profit, consequently increasing the value of invested capital, and of repaying all of its liabilities in a timely fashion. There are currently various methods of measuring and evaluating the financial performance of companies. The choice of the right method depends on several criteria, the most important of which are criteria such as the time frame, purpose of use, nature of data, and information sources. The selection of an appropriate method, taking into account these criteria, should be aimed at achieving the necessary level of measurement complexity and subsequent evaluation of the company.
Each economic situation is caused by different factors. Financial difficulties cannot occur without reason and are often the result of changes in both the internal and external environment. According to Purves et al. [
5], for the rapidly changing situation in the economy of the agricultural sector, knowledge of the factors influencing the organizational success and solid survival of the companies is of extreme importance. Predicting the success or failure of agricultural holdings will become increasingly important as the growing population continuously increases the demand of food supplies. The factors of failure in the agricultural sector are clearly different, most often economic (profitability, liquidity, operating efficiency, etc.) and noneconomic (managerial planning and decision making). Stulpinienė and Aleknevičienė [
6] argue that farm failure and subsequent bankruptcy can be the result of the macroeconomic environment and its factors or unsuccessful and incorrect decisions by managers, but also the result of natural and climatic factors. Different determinants of financial distress may have different effects on the financial health and performance of agricultural holdings. Most research on financial distress focuses on the internal causes of poor farm performance. The most accurate indicators of financial distress are considered to be financial indicators [
7]. In an effort to become a successful and competitive company in the current dynamically changing environment, according to Klieštik et al. [
8], it is necessary not only to maintain the good financial condition of a company but also to take care of its financial development in the future. From this point of view, however, the use of retrospective methods of financial analysis appears to be inefficient and insufficient. In such a process, the development and use of prediction models accepting the specifics of individual countries is of fundamental importance.
Predicting the financial failure of companies is one of the main topics addressed by many international institutions due to the negative impact on society itself and the economy as a whole. In the conditions of the Slovak Republic, agricultural companies have recently been characterized by stagnant production efficiency. The business environment in the agro-sector is mainly affected by the risks associated with the volatility of agricultural commodity markets, as well as with the European Union’s support system under the Common Agricultural Policy. Equally important are internal factors (legislation and various economic and financial instruments) as well as management decisions and austerity measures in companies. The importance of financial forecasting in the agrarian sector represents also lies in helping decision makers to take appropriate decisions regarding its financing [
9]. All of these aspects support the importance of analyzing and evaluating the financial health of companies and their subsequent responses through concrete measures.
The ability to raise financial capital and have access to credit is an essential attribute of financial health in agricultural production. The importance of this is also reinforced by the fact that the agricultural sector has characteristic sectoral specificities, such as the seasonality of production or aspects of production associated with natural processes [
10,
11]. According to Uzun [
12], the bankruptcy of large agricultural holdings has a significant impact on production volume, consumer spending, agricultural income, government spending on the development of this sector, and its efficiency and competitiveness.
Another important task of financial analysis is to find and specify the individual steps that ensure good financial health of agribusiness companies, and thus support quality and correct management decisions of these entities. Successful prediction depends on model settings and the data ratio. At present, however, there remains a scarcity of research that is suitable for practical decisions about whether a company is at risk and should tackle the potential crisis [
13]. There are several authors who have examined the financial health of agricultural companies, including Kravčáková Vozárová et al. [
14,
15,
16], Valašková et al. [
17], Adamišin et al. [
18], Hornungová and Milichovský [
19], Henning and Jordaan [
10], Martínez-Victoria et al. [
20], Sjauw-Koen-Fa et al. [
21], Lopez-Valeiras et al. [
22], Majewski [
23], and Soboh et al. [
24]. However, there remains a scarcity of studies that engage in designing a systematic and comprehensive model for measuring the financial health of agricultural companies.
Measuring economic performance, gaining an understanding of financial stability, and predicting financial health are essential tasks for any business in today’s globalized environment. Bankruptcy forecasting is a globally known concept, and there are many prediction models designed to calculate a company’s financial health and, thus, whether the company is prone to expansion or failure. In the case of the use of predictive models, on the one hand, predictive models are globalized, but the vast majority of models measuring the financial health of companies are constructed exclusively under conditions applicable either to a specific economy or even to a concrete branch of a national economy [
25].
According to Csikósová et al. [
26], the financial health of a company can be understood as the ability to maintain its position in changing market conditions and in a competitive environment. This study analyzed the practical application of the selected methods of assessing the economic condition of companies in the Visegrad countries, as these countries share a common historical background and similar strategic interests and economic experiences. The findings of this analysis demonstrated the need to use several methods in the measurement of the financial health of entities in the Visegrad countries, as this leads to the partial elimination of the disadvantages of each one. Various indices are used to assess the financial health and predict financial problems of companies, which can serve as input for professional estimation. It is necessary to adjust these indices according to the specific conditions of individual sectors in the selected economies, as these have various environments in which business is conducted.
Several models have been developed for the conditions of Slovak agriculture, e.g., the Gurčík model or the Chrastinova model, for which explanatory power and use is discussed by experts from the scientific community [
27,
28,
29,
30]. This confirms the need to develop a comprehensive predictive model of the financial situation of Slovak agricultural companies that will also take into account existing knowledge. Valašková et al. [
17] argue that despite the fact that financial analyses are crucial to mitigating or eliminating potential critical risks that a company may face in the near future, modeling and predicting financial health in developing countries is primarily based on models designed for the conditions of other sectors or countries.
Both one-dimensional and multidimensional methods can be used to measure the future development of a company’s financial health. One-dimensional methods are based on finding several individually assessed indicators, but the values of multidimensional indicators are formed by several summary indicators. The advantage of multidimensional methods is the relatively clear classification of a company as successful or unsuccessful, while the results obtained using one-dimensional methods may be inconsistent. Some multidimensional methods allow not only the prediction of critical situations but also the assessment of possible growth in the value of a company [
31]. As previously mentioned, in multidimensional discriminatory analysis, the prediction of a company’s future is made by taking into account several indicators that create space. Such models include, e.g., the Altman Z-score, the Springate model, the Fulmer model, the Taffler model, and the Bonity Index, which are still considered relevant [
32,
33]. Their relevance is also documented by several modifications, such as the Altman model [
34,
35,
36]. Predicting the financial situation of agricultural companies using multidimensional discriminatory analysis has been the subject of several studies with confrontational results (e.g., Karpáč and Bartošová [
25]; Boďa and Úradníček [
37]; Jedik and Stalgiene [
38]; Karas et al. [
39]; Valašková et al. [
27]; Rajin et al. [
40]; Kiaupaite-Grushniene [
2]; Popescu [
41]).
We assumed that in post-communist countries (including the Slovak Republic), the financial condition of agricultural enterprises is determined by several factors, among which the legal form (and other consequences resulting from the legislation applicable to the type of business) can be included. Based on this assumption, which was not the object of the well-known research, the main research question is defined as “What is the financial condition of agricultural enterprises in the Slovak Republic and how is it determined?”
The aim of this study is to identify the comprehensive financial health of 469 agricultural enterprises in the Slovak Republic using three bankruptcy models (the Altman model, the Taffler model, and the Bonity index) in 2016. To verify this aim, three research hypotheses were defined:
- RH1
We assumed that there are statistically significant differences in the assessment of the financial health of agricultural cooperatives and businesses operating in the Slovak Republic using individual bankruptcy models.
- RH2
We assumed that there are statistically significant differences in the assessment of the financial health of agricultural cooperatives and businesses operating in the Slovak Republic using individual bankruptcy models at the level of individual regions.
- RH3
We assumed that there are statistically significant spatial differences in the comprehensive assessment of the financial health of agricultural cooperatives and businesses operating in the Slovak Republic using all three bankruptcy models simultaneously.
The paper is organized as follows. The first part discusses the theoretical background with reference to important studies carried out in this field of research from the perspective of domestic and foreign authors.
Section 2 presents the research methodology, a description of the prediction models, statistical methods, and tests that were used in the analysis. It includes a description of the database of companies and the methodological steps of research.
Section 3 summarizes the most important results in the field of comparison of prediction models in the agricultural sphere, and
Section 4 provides the discussion with a comparison of results of this study with other relevant research. The main findings drawn from this study and identified directions for future research are summarized in the conclusion.
2. Materials and Methods
Creditworthy models are among the commonly used tools of financial analysis, exist in different variants, and are commonly used in practice in different sectors. Given the opinion of experts in the field of bankruptcy model research, which point out the unconvincing and weak explanatory power of local models, in this analysis our attention was focused on standard practice-proven models developed in priority for other areas. The purpose was to verify the possibility of their use in the conditions of Slovak agriculture and thus bring a differentiated angle of view to the solved issue. From the point of view of the professional public, local models are confronted also within their use in the evaluation of regions outside the production areas (in the less favored areas), and their use and limits are still discussed by experts in this field of research. Therefore, the basic models that were selected to verify the hypothesis include the following:
The initial studies using the Altman model to analyze the financial and economic situation of companies used 22 indicators. From these indicators, five were chosen that make up the original Altman model, which was also used as one of the models in this study [
30].
where:
—Working Capital/Total Assets;
—Retained Earnings/Total Assets;
—EBIT/Total Assets;
—Market Value of Equity/Book Value of Total Liabilities;
—Sales/Total Assets.
The Altman model has subsequently been used with several modifications [
34,
35]. The evaluation of the Altman model is divided into three intervals: if the Altman model
Z < 1.81, we can expect future financial problems in the company (index C); if
Z > 2.99, the Altman model characterizes the company as healthy (index A); if the company’s overall rating is within the range of 1.81–2.99, it will be not possible to determine with certainty its future development (index B).
The second commonly used model is the Taffler model, which was created in 1977 and is based on the Altman model. When conducting the final assessment, it is recommended to compare the obtained results in the sector that would allow a more accurate prediction.
where:
—Profit before Tax/Current Liabilities;
—Current Assets/Total Liabilities;
—Current Liabilities/Total Assets;
—Sales/Total Assets.
The evaluation of the Taffler model is divided into three intervals: if the Taffler model T < 0.2, the model presumes a high probability of financial problems, and the profile of the company is similar to a company that went bankrupt (index C); if T > 0.3, the company is highly liquid, and it is very unlikely that it will decline over the year (index A); if the company’s overall rating is within the range of 0.2–0.3, it will be not possible to assess the risk of bankruptcy using this model (index B).
Compared to the first two models, the Bonity index has a lower reporting value, but its advantage is the greater ability to report on the overall situation of the analyzed business.
where:
—Cash Flow/External Capital;
—Total Assets/External Capital;
—Profit before Tax/Total Assets;
—Profit before Tax/Sales;
—Stocks /Sales;
—Sales/Total Assets.
The enterprise’s financial health assessment is divided into a total of eight intervals that are simplified and adapted to the previous two models for the purposes of this analysis. The resulting evaluation of the Bonity index will therefore be as follows: if the Bonity index
IB < 0, the analyzed enterprise is at risk of bankruptcy (index C); if
IB > 3, we can state that the company is in an extremely good financial condition (index A); if the company’s overall rating is within the range of <0–3>, the financial condition of the enterprise is neutral (index B) (
Table 1).
The spatial evaluation of the regions based on the median/average values of the individual models is based on the overall rating of the region calculated as the average of the achieved individual results. The results obtained from the use of the creditworthy models (the Altman model, Taffler model, and Bonity index) were described using the selected moment characteristics. The mathematical and statistical methods that were used can be divided into three groups. The first group consists of methods that monitor the differences between the evaluation of the regions. This group of methods includes the Kruskal–Wallis test and the Levene test. The Kruskal–Wallis test for differences in the evaluation of individual models at the level of the regions of the Slovak Republic was calculated as
where:
n—the total number of observations;
ni—the number of observations in the i-th group;
—the total sum of ranks in the i-th group.
The Levene test tests the homoskedasticity of the results thus obtained.
where:
k—the number of values of the monitored category variable;
N—the total number of observations;
Ni—the number of observations in the i-th group;
Yij—the measured value of the j-th unit of the i-th group;
—the average value of the i-th group;
—the median of the i-th group;
Z..—the average of groups Zij;
Zi—the average of Zij for the i-th group.
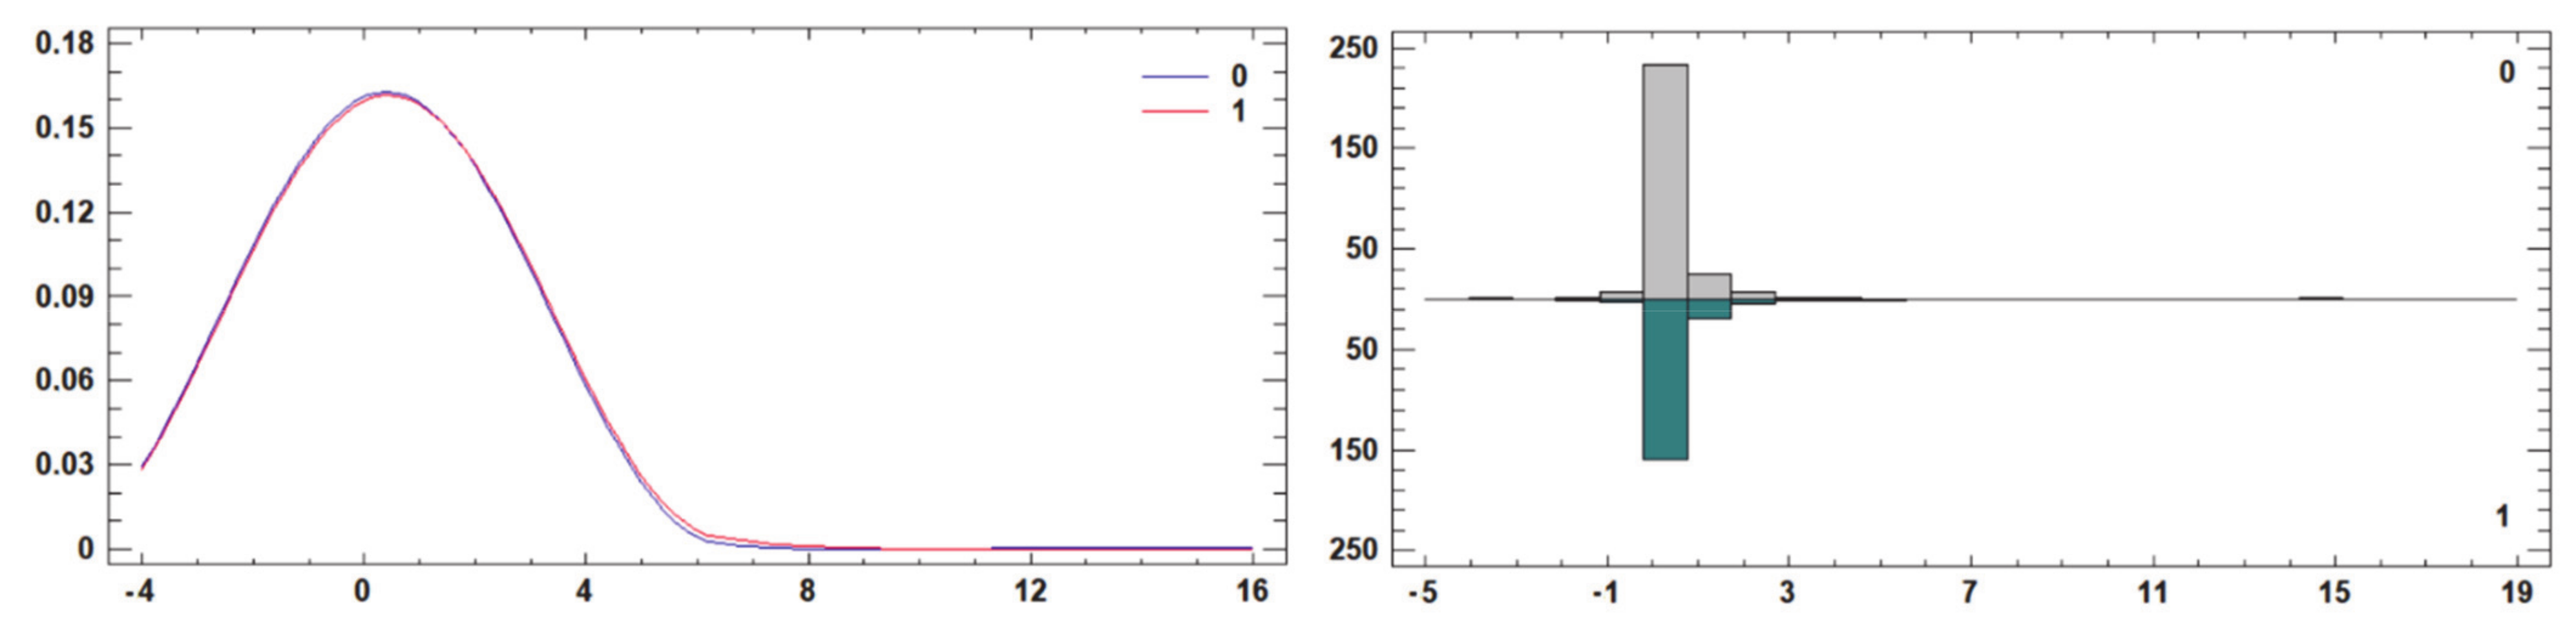
The second group consists of methods by which we tested the differences between the results obtained for agricultural companies identified as agricultural cooperatives and those identified as businesses. This group of methods includes the Kolmogorov–Smirnov test and the Mann–Whitney test. The Kolmogorov–Smirnov test compares the distribution functions of the results.
where:
—the empirical distribution function of the first selection;
—the empirical distribution function of the second selection.
The Mann–Whitney test is similar to the Kruskal–Wallis test for comparing the mean value of two files.
where:
nx—the number of observations or range of the
x-th file;
ny—the number of observations or range of the y-th file;
Ry—the sum of the ranks of the y-th file.
The third group of methods includes spatial autocorrelation methods represented by the Moran index for expressing spatial relations between regions.
where:
d—the critical distance;
n—the number of spatial units;
xi—the value of the examined phenomenon in the spatial unit i;
—the average value of the examined phenomenon;
wij (d)—the weight for unit i is the distance d.
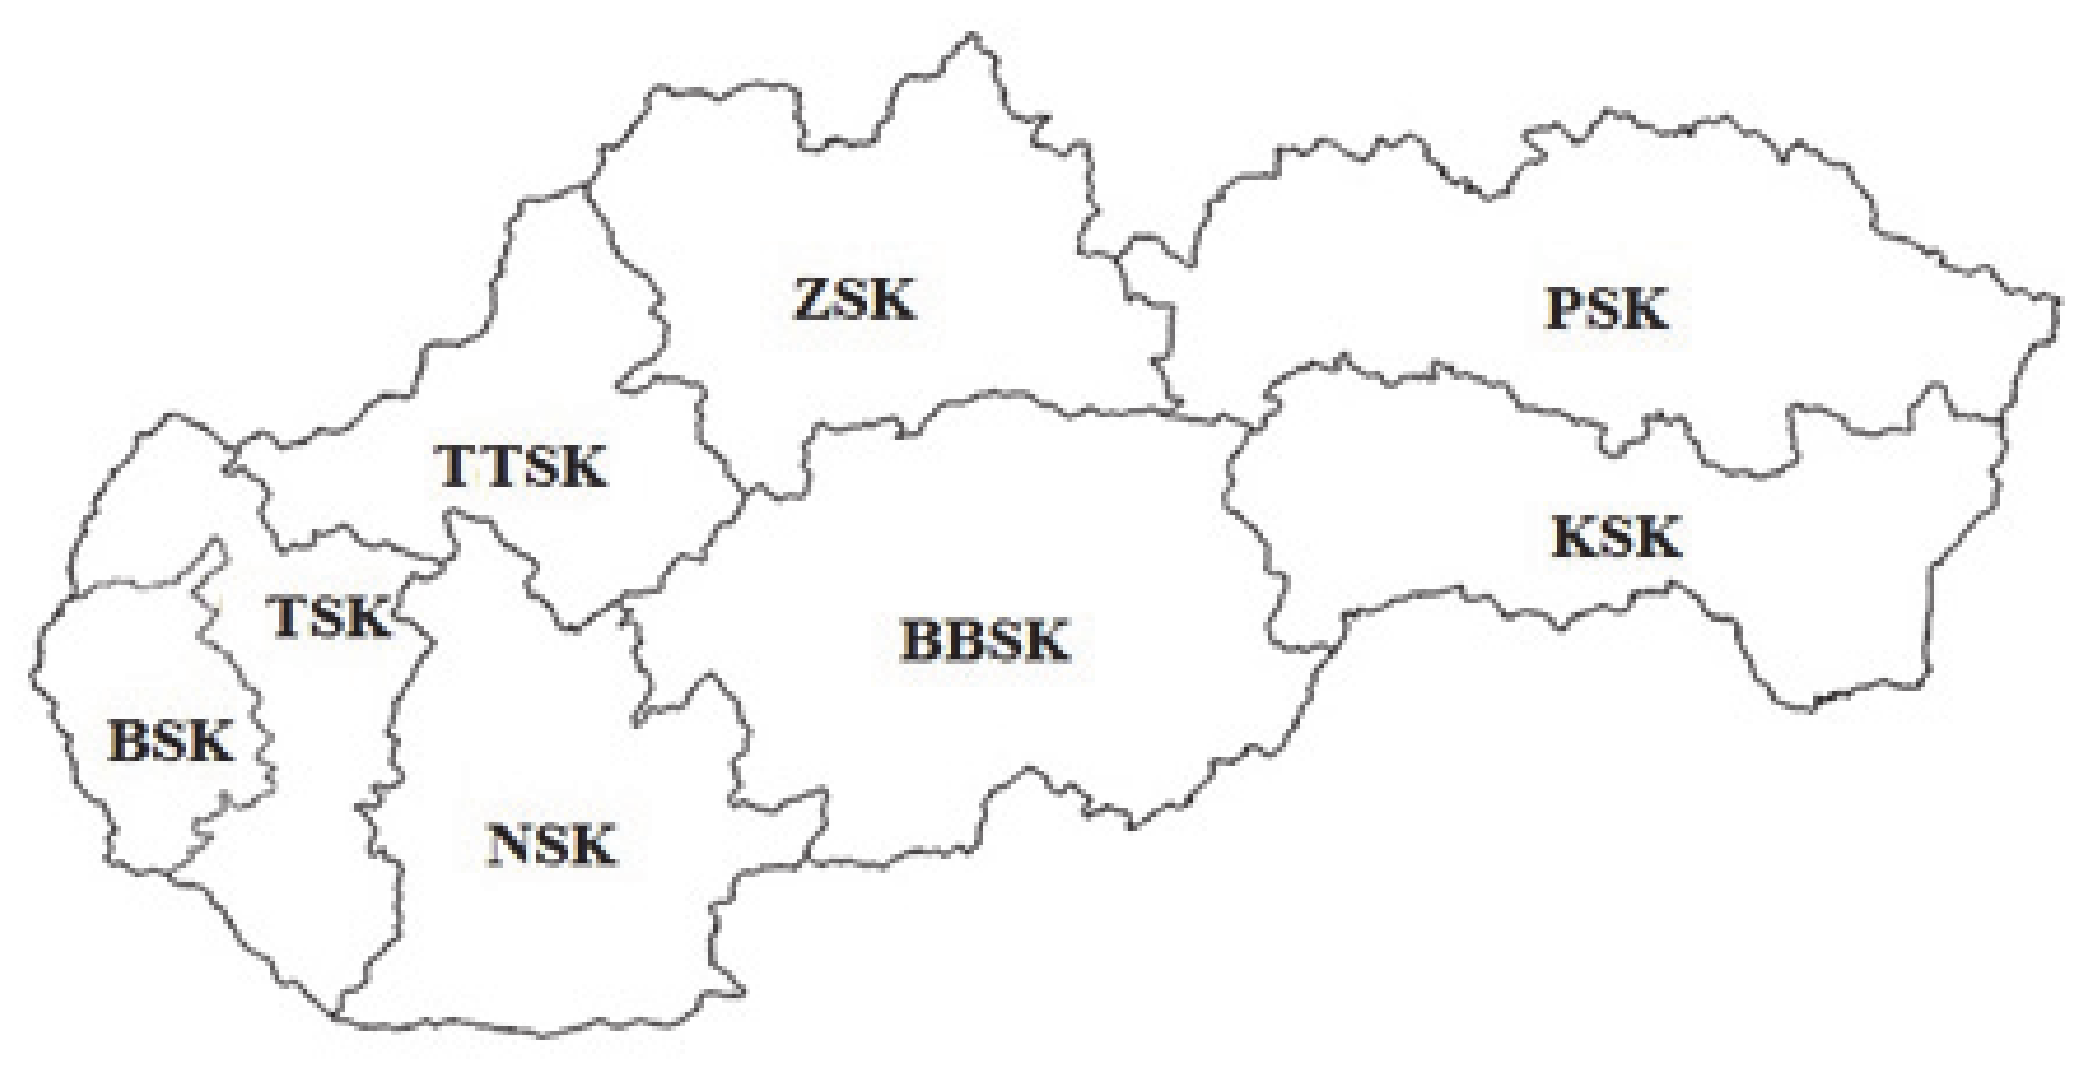
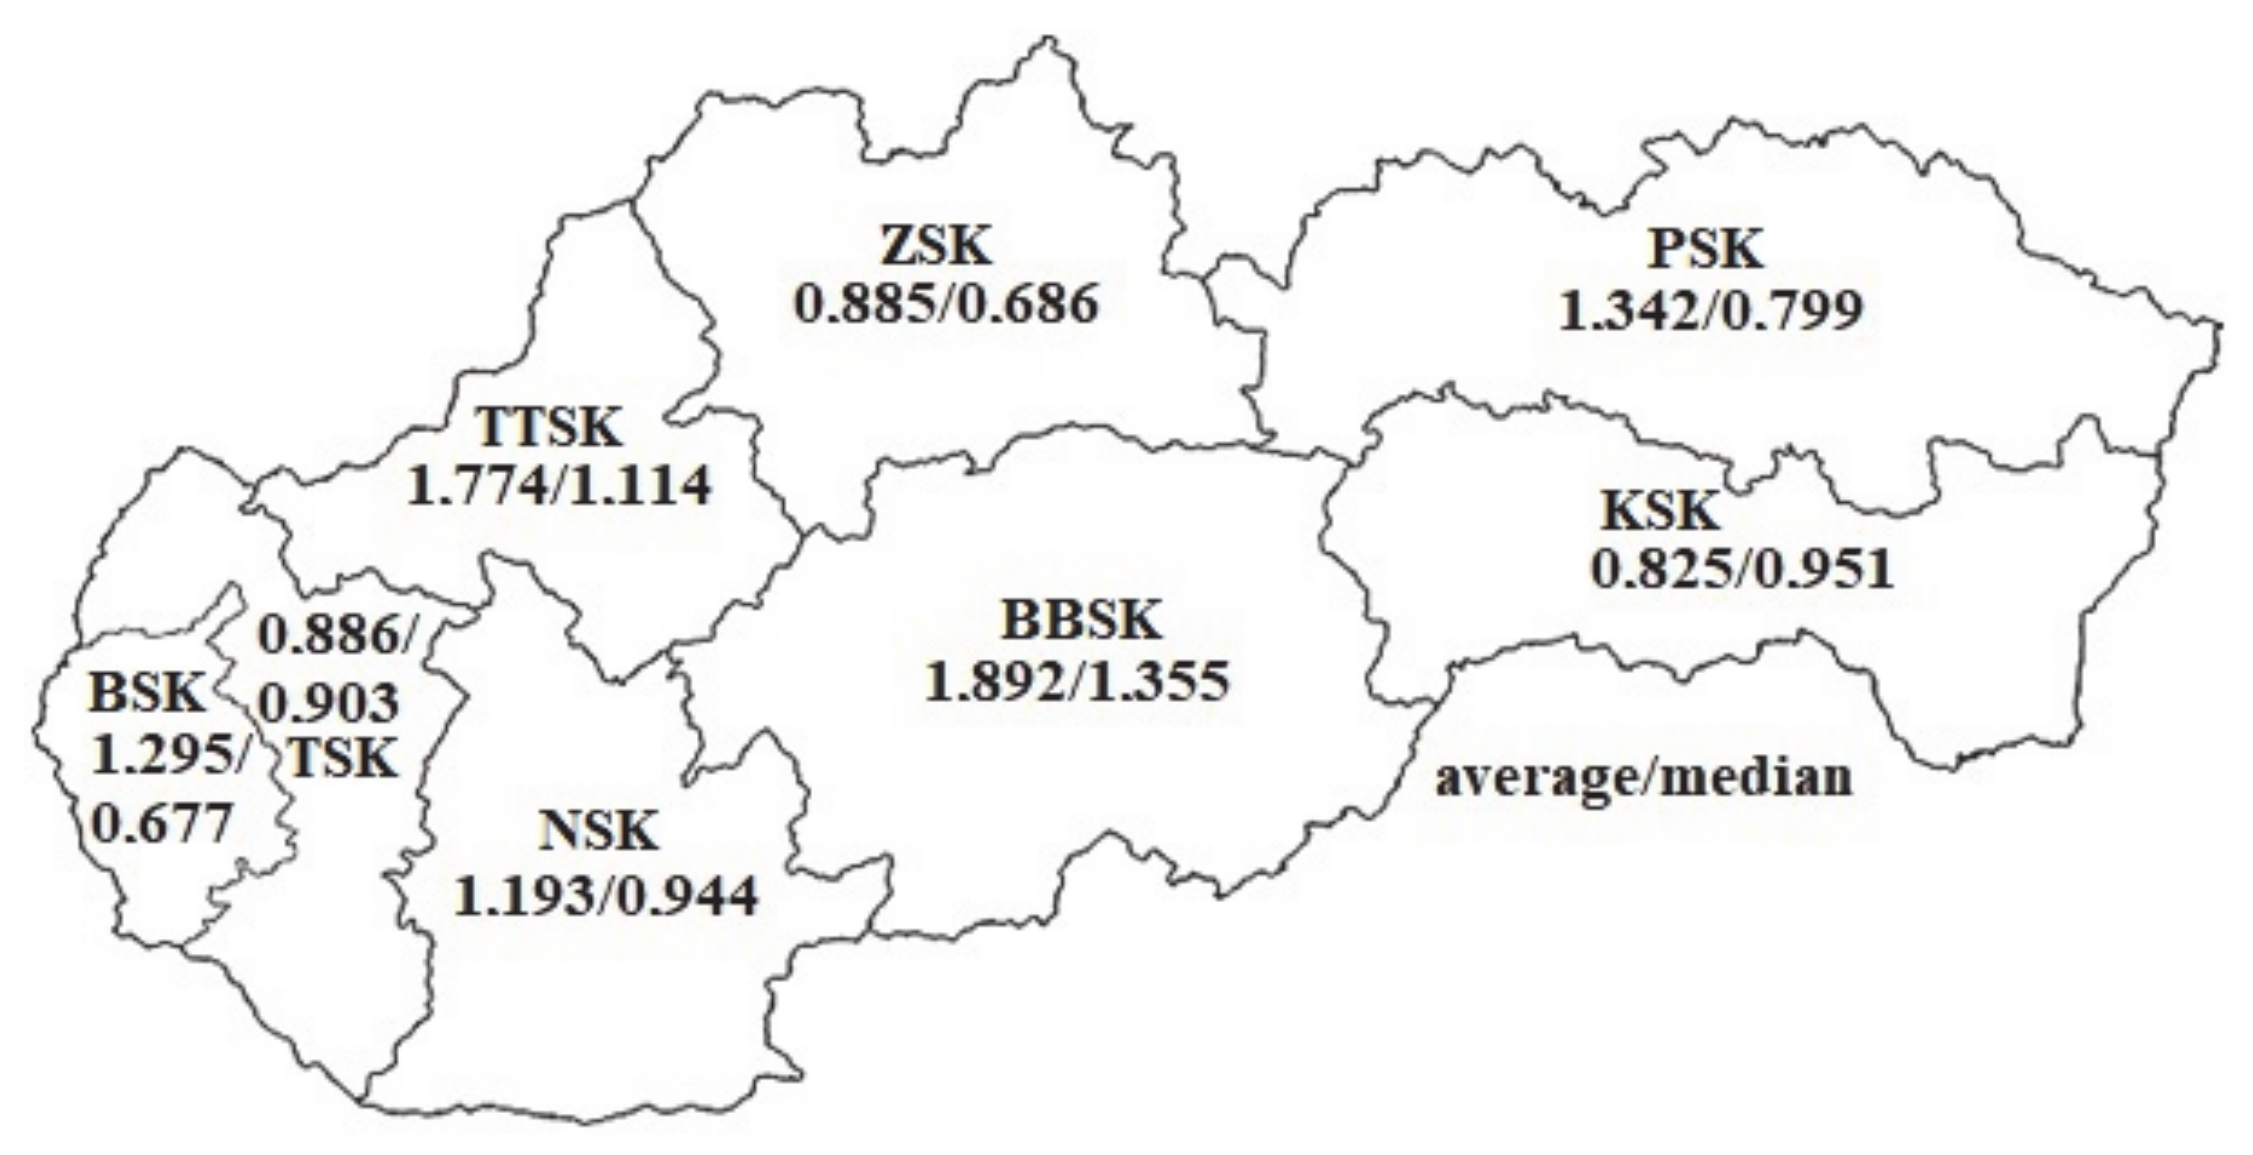
For the purpose of creating a spatial matrix, the map shown in
Figure 1 map was used. The regions of the Slovak Republic were analyzed at the NUTS III level.
The data for the research were obtained from data of agricultural entities (the balance sheet and profit and loss statement) provided by the Ministry of Agriculture and Rural Development of the Slovak Republic. The total file included 2509 subjects of legal and natural persons (only businesses and agricultural companies) with up to 19 and over 20 employees in the period after Slovakia joined the European Monetary Union (2009–2016). The total file captured the economic data of the agrarian companies that cultivated 81.3% of the agricultural land in Slovakia (1,930,570 ha). For year 2016, data were available for 1270 companies, from which a selection was made. We used the purposive sampling method to select our research sample in order to study a particular group of agricultural companies. By using the economic software for financial planning and managerial economy SOFINA_standard [
42], we identified 469 enterprises (from the total file of 1270 companies) for which there was a continuous database of financial data for the reference period. The main selection criterion was a flawless balance of control of financial statements (equality of assets and liabilities in the balance sheet). The sample was represented only by those selected companies that were without balance sheet errors in double-entry bookkeeping and a follow-up inspection performed by the economic software SOFINA_standard. The structure of research sample is as follows (
Table 2).
The data used in this study on the management of agricultural enterprises in the Slovak Republic in 2016 were in the form of selected creditworthy models. All of the above methods and procedures were processed in MS Excel and in the statistical programs Statistica 13.4 and Statgraphics XVIII.
4. Discussion
At present, the evaluation of the financial performance of companies is a necessary task both across countries and sectors and in terms of other attributes, such as the legal form of a business or territorial division. According to Valašková et al. [
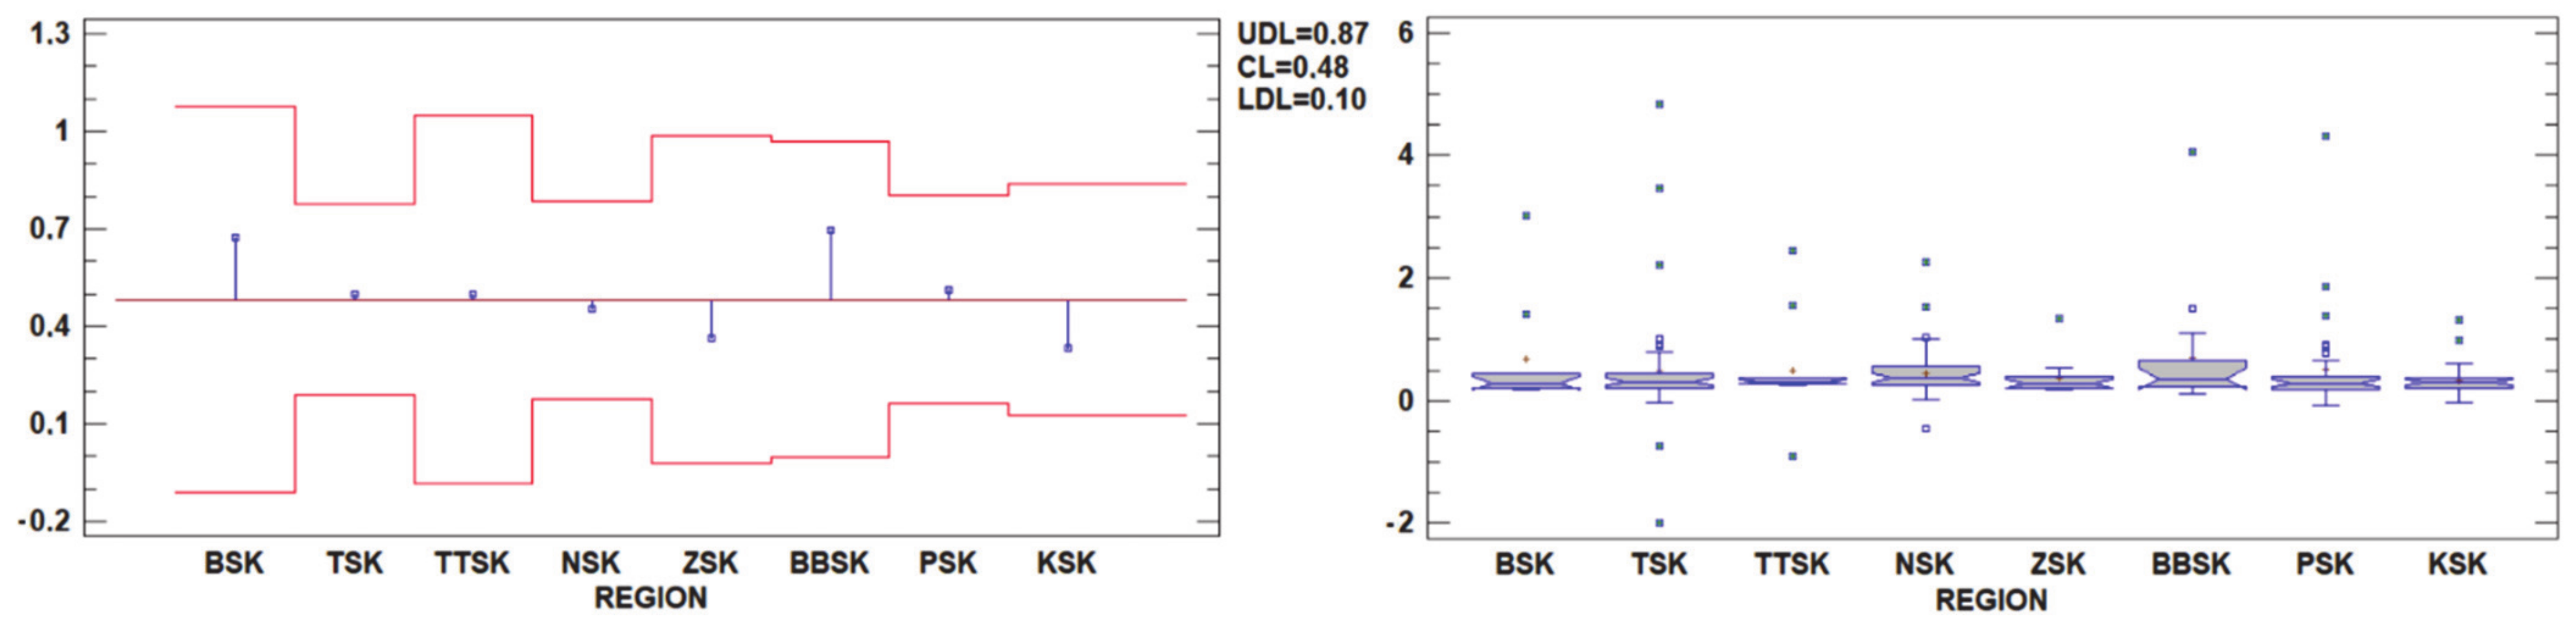
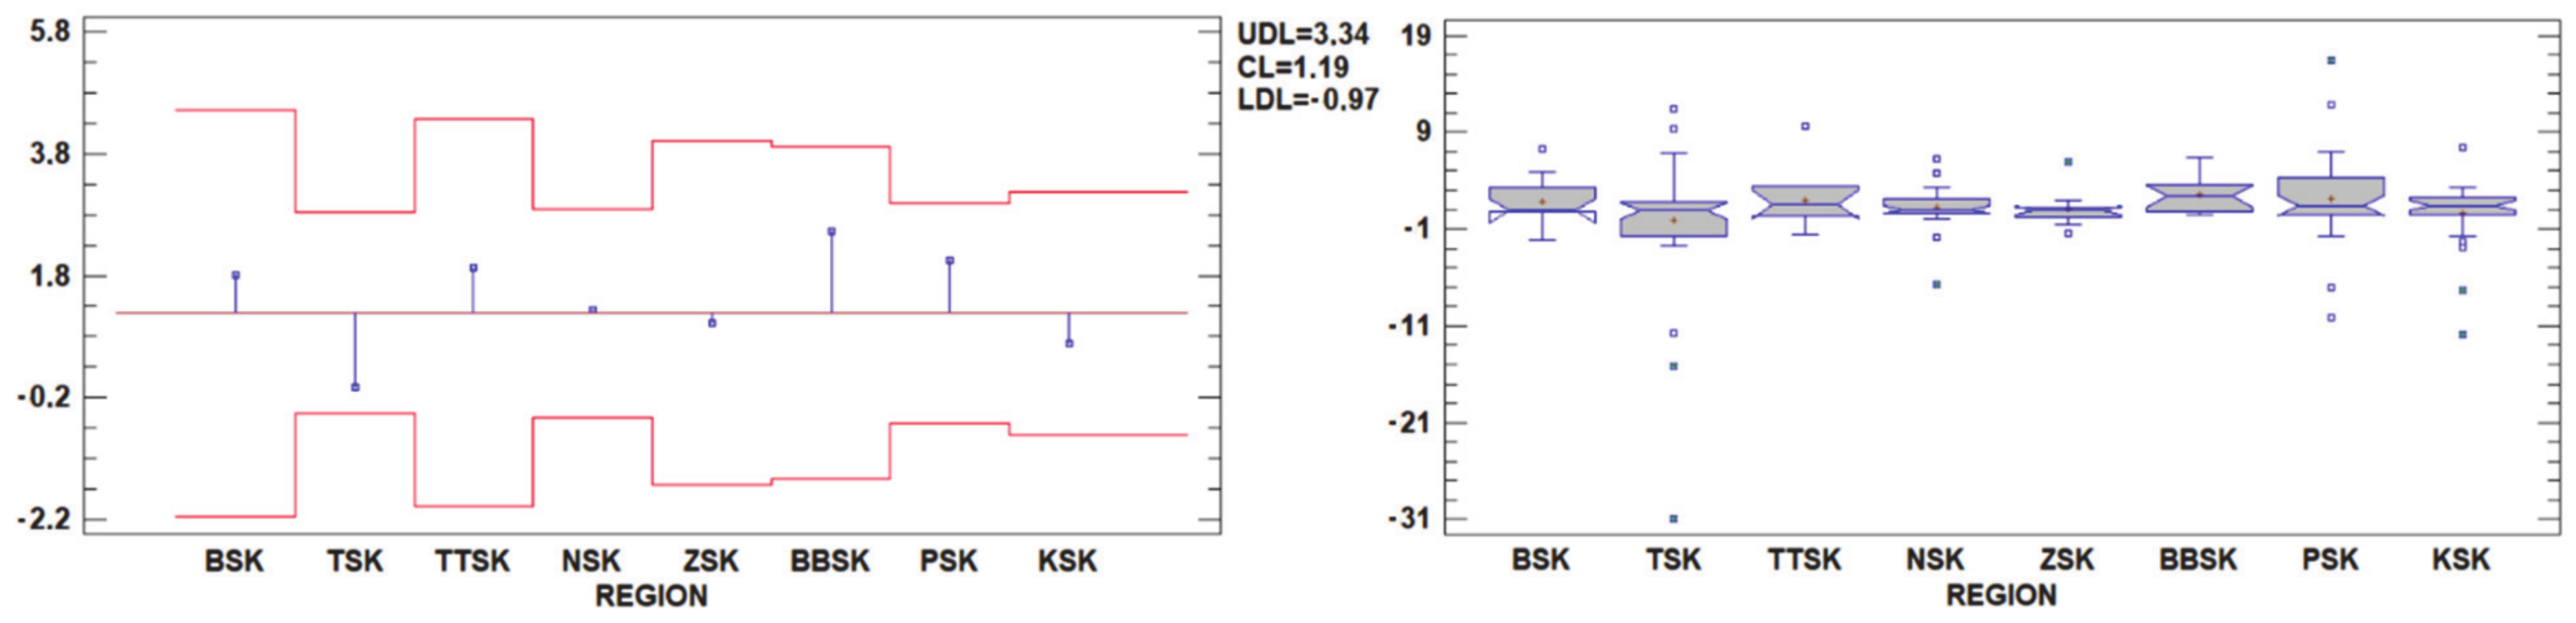
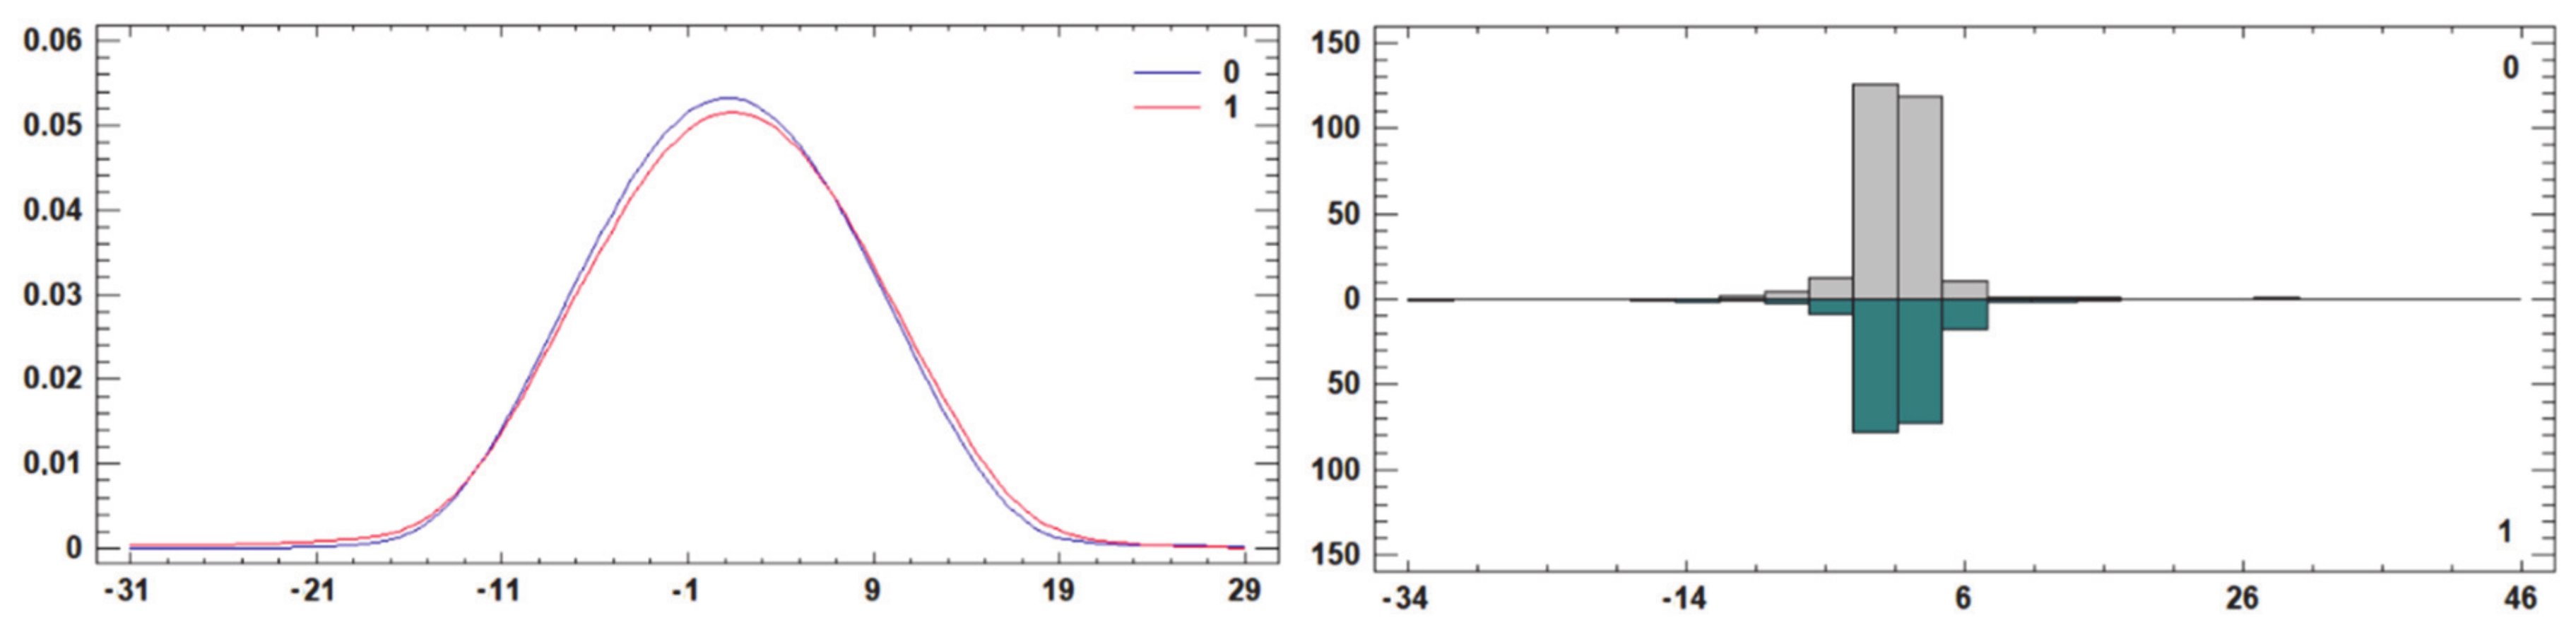
17], good financial health of companies with continuous assessment of potential risks and critical situations in the agrarian sector is an important factor from economic, social, and environmental perspectives. Important tools for assessing the financial health are bankruptcy models that provide a specialized as well as a comprehensive view of the subject. This study assessed the financial health of 469 agricultural companies in 2016 using three creditworthy models, namely the Altman model, Taffler model, and the Bonity Index. Each has its advantages and disadvantages; thus, the individual companies were evaluated by combining all three models. The first was the Altman model, which did not find statistically significant differences in the regions when comparing the results between agricultural cooperatives and businesses. The Altman model identified a smaller group of above-average evaluated agricultural entities (also graphically labeled as outliers in
Figure 2 and
Figure 3), but whose quantity was not sufficient to improve the assessment of the whole region. Based on the results obtained using this model, we confirmed significant differences in the assessment of the financial health of agricultural cooperatives and businesses operating in the Slovak Republic. The second Taffler model showed significant differences between the regions using the average values per region, indicating the presence of remote or extreme observations/subjects. The extreme observations significantly moved the mean value of the results for individual regions, which resulted in significantly better ratings than those obtained using the Altman model. This model did not show differences between agricultural cooperatives and businesses. The third model, the Bonity index, showed no difference between either the regions or the evaluated groups, with the exception of the heteroscedasticity of the results based on the average values. Based on these results, we can partially confirm both hypotheses: RH1 was confirmed using the Altman and the Taffler model. RH2 was confirmed using the Taffler model only.
Comparing the results obtained using the individual models, we note that the evaluation of a larger area, expressed in the mean value of the results of the given entities, was significantly determined by the used mean value. The incidence of the entities with outliers significantly affected the overall results of the Altman and Taffler models. In our case, we identified a total of 17 changes to the overall evaluation (of 48 possible changes) caused by a change in the used mean value. We also attributed these differences to the occurrence of remote values, which were influenced to a large extent by the average evaluation of the individual regions. The region’s rating through intervals (using indexes) was inappropriate in some cases of the analyzed set of agricultural subjects due to the constant evaluation of all regions (5 out of 12). For this reason, we recommend that the territory, district, or region is evaluated using the absolute results rather than indexes or verbal variables such as the “gray zone,” “green zone”, etc. An example of this would be comparing the KSK region as one of the best-rated regions using the average and the ZSK region, whose evaluation using the index did not adequately reflect the absolute differences between the entities in these regions. The significant differences are particularly notable in the cooperatives (
Table 2), thus confirming the impact of an individual (subject) on the group’s result (region). At the same time, we recommend using the median as the mean value, as it does not reflect outliers and better represents the situation in the given area. On the basis of the results obtained from the three models, we finally evaluated the spatial distribution of the results in the Slovak Republic. We note that the use of the average or median for both of the analyzed files did not affect the result, which was that there was no spatial correlation based on the randomness of the results.
Kopta [
31] also examined the prediction models for determining the financial health of companies in the agricultural sector. He argues that profitable/loss-making farms are characterized by very high variability and are strongly influenced by external factors. According to Adamišin et al. [
18], the variability of results of financial health may be influenced by the legal form of entrepreneurship, as in the case of business companies, it enables more efficient implementation and realization of managerial decisions as well as more efficient performance of individual necessary processes in management. The study of Kiaupaite-Grushniene [
2] also offers interesting conclusions. According to the author, the economic and financial position of the company is also influenced by subsidies. He found that even if farms operate the same amount of land in the same country, they result in different levels of state support due to crop diversity or different amounts of land included in government programs. This fact is considered by the author as an indicator of the quality of the company’s management, as more successful companies were able to identify more profitable/higher payments per hectare offering crops.
Another view is offered by the study of Duong et al. [
43], who argue farmers around the world face a wide range of business risks. These risks, linked to a number of factors, including globalization and increased trade in agricultural products or climate change, are forcing farmers to constantly renew their production and management strategies. The risks associated with the agricultural sector are increasingly complex and interconnected. As a result, there is an urgent need to better understand the threats and critical implications of agricultural risks. This claim is in line with the findings of Henning and Jordaan [
10], who confirmed the relationship between the managerial and entrepreneurial features (such as creativity and innovation, persistence, risk and conflict management, self-efficacy, need for achievement, tenacity, commitment, etc.) and the financial health of the enterprise. The competencies and skills of management for the functioning of the company also proved to be important factors in the evaluation of the financial situation of agricultural enterprises in the study conducted by Purves et al. [
5]. The results of this research confirmed that important nonfinancial factors for the success of agricultural companies include the professional experience and knowledge of management and the appropriate level of its managerial qualifications.
Regarding the obtained results, however, we agree with Boďa’s opinion, which challenges the fact that it is possible to predict the financial difficulties of agricultural holdings on the basis of the data contained in their accountancy. Although the financial statements of an enterprise should be evidence of the sound financial situation in which the enterprise finds itself, there are still cases of accounting manipulations. The agricultural sector, like other sectors of the economy, is to a large extent very sensitive to fluctuations in the economic cycle and, in addition, is significantly exposed to natural and climatic conditions. Relatively frequent changes in these conditions and specific factors are often characterized by significant and unpredictable effects that are not directly readable in financial statements [
37]. Despite the current recession, there is still a need to continue developing and building new agricultural companies. In the process of constant dynamic development, rural areas are still forced to face many critical situations and challenges. Agrarian entities will have to deal with these problems in the future, which can be helped by effective management using the right knowledge, which will also have a positive impact on the development of rural areas themselves [
44].
5. Conclusions
The aim of this study was to identify the comprehensive financial health of 469 agricultural enterprises in the Slovak Republic using three bankruptcy models (the Altman model, the Taffler model, and the Bonity index) in 2016. In order to objectify the results and test the hypotheses, the three most commonly used models in practice were used in the analysis. Using the median as a more realistic value to reflect the state of the financial health of the entities in the individual regions, the following conclusions were drawn. The results of Altman’s model mainly indicated potential future problems of businesses whose evaluation did not exceed the limit (1.81) in any region. The assessment of agricultural cooperatives was better, but not positive, because Altman’s model classified the status of the cooperatives in the gray zone, in which it was not possible to draw clear conclusions. The neutral situation was also assessed using the Bonity index, according to which the financial health could be regarded as neither insufficient nor optimal. The results of the Taffler model somewhat contradicted this. This model did not expect the occurrence of problems in the near future in both monitored groups of legal forms.
The assessment of the financial health of agricultural entities operating in the Slovak Republic was not determined by the territory or legal form. The management of these entities cannot be perceived negatively in the context of the obtained results because this situation was not identified by the used ex ante models. On the other hand, it is necessary to examine their management (by the state or by the entities themselves), as the current situation may not be sustainable in the long term. The European Union seeks to restore the competitive nature of the agricultural sector through the reforms of the Common Agricultural Policy. The implementation of measures under these reforms aims to reduce the gap between production and consumption in the agricultural market. The market for agricultural production is characterized by recurring problems, which also results in the still unfinished process of the current reform of the Common Agricultural Policy. From the point of view of these aspects, in an effort to support the competitiveness of companies, it is necessary to create pressure on economic rationality. Therefore, the effort of this study was to promote an alternative approach to economic rationality and point to reserves in terms of resource appreciation with regards to the results of the financial position of the companies. In the future, linking subsidies to compliance with the legislative framework governing the environment, food safety, plant and animal health, as well as the requirement to maintain the good condition of agricultural land, will be likely to become a necessary element for implementing agrarian activities and also and indispensable step in all managerial decisions. For this reason, this relationship between the subsidy support system and its subsequent pressure on economic efficiency will help stabilize the agricultural sector not only in the European Union but also at the level of the Slovak Republic.
The study brought a broader view of use of discriminant analysis in the evaluation of the financial health of agricultural enterprises in the conditions of Slovak Republic. The use of several methods has contributed to the complexity of the assessment, which can support agrarian subjects in making optimal management decisions. The research results are important for agrarian entities themselves, but also for other institutions, to eliminate financial and other corporate risks. The results received using discriminant analysis make it possible to broad a relationship among current scientific knowledge about forecasting of financial condition of the agrarian companies and empirical findings from practice.
In future research, we recommend processing data for a longer period of time in order to conduct a more in-depth analysis of the economic performance of enterprises in the agricultural sector in the Slovak Republic. Moreover, focus should also be placed on other aspects and criteria that could be relevant to the issue of different economic performances of agricultural entities, such as the ambiguity of agricultural subsidies and the related above-mentioned subsidy policy.


