
The Impact of Crop Diversification on the Economic Efficiency of Small Farms in Poland


Faculty of Economics, Department of Finance, Koszalin University of Technology, Kwiatkowskiego 6e, 75-343 Koszalin, Poland
*
Author to whom correspondence should be addressed.
Agriculture 2021, 11(3), 250; https://0-doi-org.brum.beds.ac.uk/10.3390/agriculture11030250
Submission received: 1 February 2021
/
Revised: 3 March 2021
/
Accepted: 7 March 2021
/
Published: 16 March 2021
(This article belongs to the Special Issue Agricultural Diversification)
Abstract
:Crop diversification finds an important place in the strategy of dealing with risk and uncertainty related to climate change. It helps to increase the resilience of farmers, significantly improving their income stability, but at the same time, it can lower the economic efficiency of small farms. The aim of the article is to identify the determinants of crop diversification and the impact of crop diversification on the economic efficiency of small farms in Poland. This article first provides a critical review of the literature on crop diversification, its role in stabilizing agricultural income and its impact on economic efficiency in small farms. Secondly, the level of crop diversification was determined and empirical research was conducted considering the economic, social and agronomic characteristics of farms. Thirdly, the economic efficiency of farms diversifying crops was compared with farms focused on one type of production. The research material consisted of small farms participating in the Polish system of collecting and using farm accountancy data (FADN) in 2018. The level of diversification was determined using the Herfindahl-Hirschman Index. The factors influencing crop diversification were identified using the logit regression model. The Mann–Whitney U rank sum test was used to assess the significance of the differences in distributions. The research results indicate an average level of crop diversification in small farms in Poland and its regional differentiation. In addition, a statistically significant positive impact on the probability of crop diversification in small farms in Poland was found of variables such as the level of exposure of agricultural production to atmospheric and agricultural drought and the location of the farm in the frost hardiness zone and a statistically significant negative impact of the variable: value of fixed assets. The existence of significant differences in the level of economic efficiency of farms diversifying crops and farms focused on one profile of agricultural production was proved. The study is an important voice in the discussion on increasing measures to strengthen support for small farms that diversify crops so as to ensure their greater stability and economic efficiency.
1. Introduction
Diversification of agricultural holdings consists in transforming homogeneous agricultural production into diverse. It is one of the possible farm development strategies aimed at stabilizing income and securing against risks, mainly climatic and natural [1]. Diversification influences the differentiation and often increases income, which is made independent from one source. In a situation of fragmentation of agriculture, as is the case, inter alia, in Poland, the issue of diversification of small farms becomes more important. In 2018, there were 1.4 million farms in Poland, of which more than half (53.1%) had arable lands up to 5 ha and ¾ entities (75.2%) farmed less than 10 ha [2]. A significant barrier in conducting research is the lack of an unambiguous definition of a small farm, which is often emphasized in the literature on the subject [3,4,5,6]. Among the classification criteria, on the basis of which small farms are distinguished, the following are taken into account: agricultural land [7,8,9,10], economic size [10,11,12,13,14,15] and the links between a farm and the market [16]. Various approaches to defining small farms mean that the results of research conducted among farms located in different regions/countries often cannot be directly comparable. Considering the above limitations, some researchers adopt several criteria that must be met simultaneously for a given farm to be considered small. For example, Hornowski et al. [6] selected small farms on the basis of the utilized agricultural area (from 1 to 15 ha) and the economic size not exceeding 25 thousand EUR Standard Output (SO determined in accordance with the Farm Accountancy Data Network—FADN methodology). In turn, Ardakani, Bartolini and Brunori [17] used an innovative approach to defining small farms in their research and proposed a composite index of farm structure, which took into account the average values of the following categories: area of holdings (ha), livestock units of holdings (LSU), labor force of holdings (AWU) and standard output of holdings (EUR). In their study, they assumed that a small farm is one that is not productive enough (considering inputs and results).
The research results confirm the important role of small farms in the food system and their importance for food security [18,19,20]. For example, Rodrigues Fortes et al. [18], conducting research in this area, showed that small farms are important for greater availability of food in the region in which they operate. The results of the research by Rivera et al. [19] also proved the important role of small farms in food supply, especially in regions where such farms dominate the agrarian structure. The results of these studies also indicate that the importance of small farms in relation to local food availability is closely related to non-market distribution channels. Galli et al. [20] have found that small farms ensure food and nutrition security for a household at local, regional and global levels.
Guarínet al. [21] indicate that the importance of small farms in Europe depends, inter alia, on the type of farms located in the area. They proposed the division of small farms based on the analysis of features relating to farmer’s histories and motivations, farm production, assets and labor, market linkages and access to support. In the course of the research, taking into account the above characteristics, they distinguished the following five types of small farms: (a) farms with a relatively weak commercial orientation: peasant farms, part-time farms and (b) farms with a relatively strong commercial orientation: diversified businesses, specialized businesses and new enterprises. The results of these studies indicate that among small farms, apart from units with low economic strength, with relatively weak commercial orientation, focused on self-supply, there are also entities that are characterized by entrepreneurship (farmer), strong connections with the market, innovation and production specialization. It should be added that small farms are characterized by relatively low profitability—both of assets and equity, relatively high cost-consumption and a strong dependence of agricultural income on the amount of financial support for operating activities, compared to larger units from the agricultural sector [22,23].
The diversity of crops in farming systems is essential to help farmers adapt to increasing climate variability in the future [24,25]. By diversifying crops, small farms are less exposed to losses in production and are more resistant to environmental changes [23]. By diversifying crops, it is possible to reduce the risks associated with low income from agricultural production, food insecurity and nutrition insecurity [26]. Diversification can be an effective system for securing the financial situation of farmers and integrating them more effectively into local outlets. Researchers emphasize that diversification can contribute to the sustainable development of rural areas by strengthening the links between agriculture and other sectors of the economy [27]. Sustainable agriculture is also based on the use of technology in the pursuit of maximizing productivity while striving to minimize the negative impact on the environment. Diversification therefore, enables farmers to be involved in the implementation of the SARD (Sustainable Agricultural and Rural Development) concept [28]. In the Resolution of the European Parliament of 27 October 2016 on how the Common Agricultural Policy can improve job creation in rural areas (2015/2226 (INI)), it was stated that the diversification of agricultural activities would encourage young generations to return to rural areas and will support entrepreneurship as well as focus on innovation and promotion of products typical for given areas.
Diversification of crops may improve the economic efficiency of small farms [29,30,31,32,33,34,35,36,37]. By protecting them, inter alia, against an economic downturn [38]. The greater economic efficiency of small farms that diversify crops provides them with relative income stabilization [39]. However, as the research results indicate, crop diversification may have negative effects on the economic efficiency of farms [32,40,41]. This means that decisions to diversify crops can represent a trade-off between productivity and resilience (income volatility) for small farmers [41].
Crop diversification may be determined by both internal factors—related to the characteristics of farmers and the farm structure and external factors—related to territorial features, including regional and spatial patterns [42]. By analyzing the results of research on internal factors, it was found that the following socio-economic characteristics of a farm as well as farmer’s household may have an impact on crop diversification: farmer’s gender, farmer’s age, level of education, household size and income level, fixed assets, livestock or technological limitations [25,42,43,44,45,46,47,48,49,50,51]. On the other hand, the most important external factors, as evidenced by the results of empirical research conducted in this area, include location of the farm, cultivation intensity, technical infrastructure, climatic conditions and access to credit and advisory services [42,43,44,45,46,48,50,51,52].
The results of the research concerning the influence of socio-economic features of an agricultural holding on the degree of crop diversification make it impossible to adopt a uniform approach to determining the relationship between these features and the studied phenomenon. The farmer’s age has a positive effect on the level of diversification [45,47]. This means that with age, the probability that the farmer will diversify his crops increases. Similarly, with an increase in the level of education, the probability of crop diversification increases [53,54,55,56], although in some developing countries the literacy rate is also important. As evidenced by the results of Geethu and Sharma [48], the degree of literacy can reduce crop diversification. The research also established that there is a positive relationship between the size (number) of an agricultural household and crop diversification [25,45,47,49]. This means that a larger number of people in the farmer’s household may contribute to the diversification of crops on the farm. With regard to farm resources, a positive impact of agricultural land on decisions concerning crop diversification was established. Thus, larger resources of land owned by a farmer may favor the diversification of crops [43,45,47,49,51]. Fixed assets are the basic component of the technical equipment of farms. They constitute the material and technical basis of the production capacity. The amount of these resources determines the way of organizing production. Kumar [50] proves that the diversification of crops is determined, inter alia, by the mechanization of a farm (farm equipment with tractors, electric trailers). The research conducted by Kołoszko-Chomentowska [57] shows that farms with low value of assets are characterized by relatively good equipment in buildings, while they are less equipped with machines and devices. On the other hand, farms with high value of fixed assets usually have modern machines and accompanying equipment. As suggested by Mańko and Płonka [58], the specificity of farms related to the orientation of production depends to a greater extent on the necessary equipping of farms with fixed assets than on the efficiency of their use. Moreover, a high value of fixed assets may mean that they have a high share in the property structure of a farm. According to Strzelecka [59], this proves a significant immobilization of farm assets and their low flexibility. Hence, the change in the activity profile and adaptation to climate change in these farms is difficult.
The risk in agriculture from uncertain factors such as the weather can result in variable returns (income) on decisions made in a given year. Hence, crop diversification is seen as a self-insurance strategy used by farmers to protect against risk [60]. Sarwosri and Mußhoff [61] considered the farmer’s risk attitudes and time preferences of the farmer and examined the effect of these factors on crop diversification. They found that risk-averse farmers were more likely to diversify their crops, indicating that they found this option safer. As indicated by Auffhammer and Carleton [62], crop diversification increases the resilience of the entire production and farm income in the event of unfavorable climatic conditions. Ashok et al. [63] indicate that climatic factors significantly explain the probability of a change in the crop model. Additionally, they suggest that awareness of climate change increases the likelihood of changes in the crop pattern. Huang et al. [64] prove that farmers’ decisions to diversify their crops are influenced by past experiences of extreme weather events. This is also confirmed by the results of the research by Mulwa and Visser [51], who proved that past exposure to climatic shocks and availability of climate information are factors that influence farmers’ decisions to diversify their crops. In turn, Kurdyś-Kujawska [65] indicates that the diversification of crops is characteristic of farms with a high exposure to weather hazards. Diversification is the logical answer to the risks associated with bad weather and price volatility. Some crops are more resistant to drought, for example, than others, but may offer worse economic benefits. A diversified product portfolio should ensure that agricultural production is not completely destroyed in bad weather. According to Di Falco et al. [66] crop diversification as a form of insurance is the basis of modern portfolio theory. The use of crop diversification has increased in recent decades due to protracted droughts and other extreme events that have been exacerbated by climate and weather variability [67]. The diversity of crops in farming systems is essential to help farmers adapt to increasing climate variability in the future. By diversifying crops, small farms are less exposed to losses in production and are more resistant to environmental changes [68].
Small farmers use various adaptation strategies to increase income stability, guided by their resources, information, intrinsic values and motivation. Consequently, crop diversification is one of the decisions made to spread risk and make economically sound choices. Understanding what influences these decisions can help identify the appropriate support programs for which it is important to ensure an adequate level of income and to stabilize it in small farms. This study will contribute to the emerging but still ambiguous research on the determinants of crop diversification and its impact on the economic efficiency of small farms. The aim of the research is to identify factors determining crop diversification and to determine the impact of crop diversification on the economic efficiency of small farms in Poland.
Hypotheses 1 (H1).
The factor determining crop diversification in small farms is the level of exposure to climate risk.
Hypotheses 2 (H2).
Small farms diversifying crops are characterized by lower economic efficiency than small farms focused on one agricultural production profile.
The rest of the paper is organized as follows. Materials and methods are described in the next section. The results of the study were then presented, which included two main stages. First, the crop diversification was assessed among the surveyed group of farms, considering its regional differentiation and it was determined whether there are differences between the economic results obtained by farms diversifying crops and the results characterizing the second group of farms included in the analysis. In the next stage, the factors influencing crop diversification (using a logistic regression model) were identified and assessed. The last section concludes.
2. Materials and Methods
2.1. Materials
The survey is based on a dataset from the national system for the collection and use of Farm Accountancy Data Network (FADN). In the study, small farms were defined on the basis of their economic size and agricultural area. Taking the above into account, the study covered 1612 farms from the FADN sample with an area of up to 10 ha of agricultural land, the economic size of which in 2018 does not exceed 8 thousand euro. To separate small farms diversifying crops from the sample, the FADN criterion for grouping farms according to agricultural types was used (TF14). The research assumed that farms diversifying crops are mixed farms, as well as mixed crops and livestock. Among the analyzed group of small farms, 34.30% diversified their crops (F_CD). The others specialized in COP (cereals, oilseeds and protein crops), other field crops, horticulture, orchards-fruits, olives, permanent cops combined, milk, sheep and goats, granivores and mixed livestock (F_N_CD).
2.2. Methods
The Herfindahl–Hirschman Index (HHI), one of the most commonly used measures of concentration, was used to assess the differentiation (diversification) of small farm crops. The HHI is the sum of the squares of the share of acreage of individual types of crops in relation to the total area of crops and is determined by the equation [69,70,71]:
where: represents acreage proportion of the i-th crop in total cropped area.
As the level of diversification increases, the sum of squares of the proportions of individual crops in the total area decreases, and thus, the indicators (HHI). The Herfindahl–Hirschman index is one when there is a specialization. Its value approaches zero when there is diversification.
The logistic regression model was used to identify the factors influencing crop diversification in small farms and to verify the research hypothesis (H1) adopted in the article. It allows to study the influence of many independent variables on the dependent variable Y, which is a dichotomous variable and can take one of the two values: 1 or 0. The value of the variable Y = 1 means that the given event occurs. Otherwise, this variable takes the value of 0 [72]. The regression analysis process allows to determine which factors are most important for the occurrence of a given event, which can be ignored and how they affect each other [73]. The logistic regression model is based on the logistic function. Its values are in the range . The function has the shape of the letter S. The analytical form of the logistic function used in logistic regression is defined by the equation [74]:
The logistic regression model, therefore, applies to two-categorical dependent variables, taking only two values: 0 and 1. The expected value of the dependent variable has been replaced with the conditional probability that the dependent variable Y will assume the value 1 for the independent variables . The logistic regression model for the dichotomous variable Y determines the conditional probability of assuming the distinguished value by this variable and is expressed by the following relationship [75]:
where they are parameters of the model, independent variables that may have both the qualitative and the quantitative character.
Due to the non-linearity of the model with respect to independent variables and parameters, in a logistic regression model the regression coefficients do not represent a measure of the relationship between the variables. Therefore, logarithmization transforms a logistic model into a linear model. For this purpose, the concept of the Odds Ratio is introduced. The concept of chance is understood as the ratio of the probability that a given phenomenon will occur to the probability that a given phenomenon will not occur [76], that is:
The odds ratio is a measure of the relationship between exposure and outcome. It provides an estimate (with a confidence interval) of the relationship between two binary variables (“yes” or “no”). It also allows to study the influence of other variables on this relationship using logistic regression [77]. The natural logarithm of the odds ratio is linear in relation to independent variables and considering the model parameters, which facilitates estimation to a high degree [53,74,78]:
The boundary value α is established as the share [fraction] of “ones” in the sample. Then, the evaluation of the correctness of the estimated model can be carried out, counting correctly and mistakenly the classified cases.
The quality of the constructed logistic regression model can be assessed using the measure, which takes values from the range defined as follows [75]:
The closer to one value of this measure the better adjustment of the logistic model to the empirical data of the studied phenomenon. indicates the percentage of correctly classified cases. The model works well in forecasting the studied phenomenon when . This means that the classification based on the model is better than the random one [73]. The quality of the constructed logistic regression model can also be assessed on the basis of the Hosmer–Lemeshow test [72], it compares the values of the estimated probability and the observed values of the occurrence of the phenomenon under study (the null hypothesis indicates a good fit of the model). Additionally, the classification quality of the model is illustrated by the ROC curve [54] and, more specifically, the area under this curve (AUC). The ROC curve is built based on the value of the dependent variable and its predicted probability. When the ROC curve coincides with the y = x diagonal, then the decision to assign a case to a selected class (+) or (−), made on the basis of the model, is synonymous with a random division of the studied cases. Each point on this curve has coordinates (1—specificity, sensitivity). Sensitivity means the ability to detect units without a distinguished feature and specificity is the ability to detect units with a distinguished feature [79].
The area under the ROC curve (AUC) is a measure of the quality of the method in such a way that the field 0.5 is a classification quality comparable to a random coin toss and the area 1.0 is a perfect, error-free classification. The classification quality of the model is good when the curve is significantly above the diagonal , i.e., when the area under the ROC curve is significantly greater than 0.5 [55]. If the chances of the occurrence of the of the studied phenomenon, the so-called optimal cut-off point, i.e., the value of from the interval that if , then the object is assigned to the class coded by −, otherwise, when , to the class coded by + [80].
The variables adopted for the model were quantitative and qualitative. The selection of the variables was based on the available database and the analysis of the research conducted so far in the field of diversification of crops of small farms and the analysis of correlation between the variables. The model uses a set of explanatory variables and cultivation diversification (Y) was assumed as the dependent variable. There were 17 explanatory variables used in the model and they related to the socio-economic and agronomic characteristics of a farm (Table 1).
The non-parametric Mann–Whitney U test was used to verify the research hypothesis (H2) adopted in the work. The essence of this test is to weaken the impact of atypical values on the result and to make this result independent of the type of distribution of the studied variables. The Mann–Whitney U test was used to verify the hypothesis about the compatibility of distributions in two compared populations, which have distributions with continuous distributions and . In this test, the hypotheses were formulated as follows:
Hypotheses 3 (H3).
The distributions of the selected variables in the two populations have the same distribution.
Hypotheses 4 (H4).
The distributions of the selected variables in the two populations do not have the same distribution.
This test is performed on the basis of the sum of the ranks of the variables, not their mean values [74]. The test for this test is the statistic defined by the formula:
or
where —sample sizes, —ranks sums for samples.
When the sample size for each sample is greater than 20, use the statistic that approximates the normal distribution:
where —total number of observations. The statistic has an approximately normal distribution.
The selection of diagnostic variables adopted for the analysis was based on the available database and the analysis of the research conducted so far in the field of economic efficiency of farms. The set of variables and their characteristics are presented in Table 2.
3. Results and Discussion
3.1. Characteristics of Small Farms Diversifying Crops
The average area of the analyzed group was 7.41 ha. In most farms, the land was owned by the farmer. On average, 10.91% was the share of leased agricultural land. The structure of agricultural land was dominated by cereals, fodder crops and other field crops such as potatoes, sugar beet, herbs, oilseed and fiber, hops, tobacco and other industrial crops. The soil valuation index was at the level of 0.79, which means arable soils of average quality, which may periodically be too dry or too moist and which are very susceptible to fluctuations in groundwater levels. The average value of fixed assets in the analyzed farms was PLN 372,100. These farms were characterized by a large diversification in terms of the value of fixed assets (coefficient change: 56.14%) and a very large differentiation (coefficient change: 108.82%) in terms of the farm’s ability to self-finance its activities and create savings as part of its operating activities. The amount of cash flows from operating activities averaged PLN 23,570. The increase in the value of goods produced in small farms (the so-called gross added value) was at the level of PLN 28,160. Income from a family farm amounted to PLN 12,830 on average. An important source of income for small farms were subsidies to operating activities, their value oscillated on average at the level of PLN 11,030. In the analyzed group, 21.33% of farmers obtained income from activities other than agriculture. 9.94% of small farmers had liabilities to financial institutions. Small farmers mainly used loans for day-to-day operations. The average level of current liabilities was PLN 89,90. On the other hand, loans taken for a period longer than one year amounted to PLN 42,670 on average. In the analyzed period, farmers did not have a valid crop insurance policy. The average number of people employed full-time in a farm was 1.42. The maximum number of full-time employees was 5.7. The average age of the farm manager was 48 years. One fourth of the surveyed farmers were over 56 years old. Experience in agricultural production is related to age. The farmer’s experience influences the effectiveness of decisions regarding the achieved income and its stability. Most of the small farmers had secondary (43.40%) and vocational (39.24%) education. The smallest group were farmers with primary education (6.50%). A total of 10.85% of the surveyed farmers had higher education. It should be noted that almost half of the farmers (47.20%) had agricultural education. The family of the analyzed farmers was mostly not very large. Two- (25.85%) and three-person (29.65%) households prevailed. The smallest group were farms where the number of family members was higher than 7 (1.08%). On average, two people of working age, who were members of the farmer’s family, worked on a farm. In 25.68% of farms, the farmer’s family members were of retirement age.
3.2. The Level of Crop Diversification
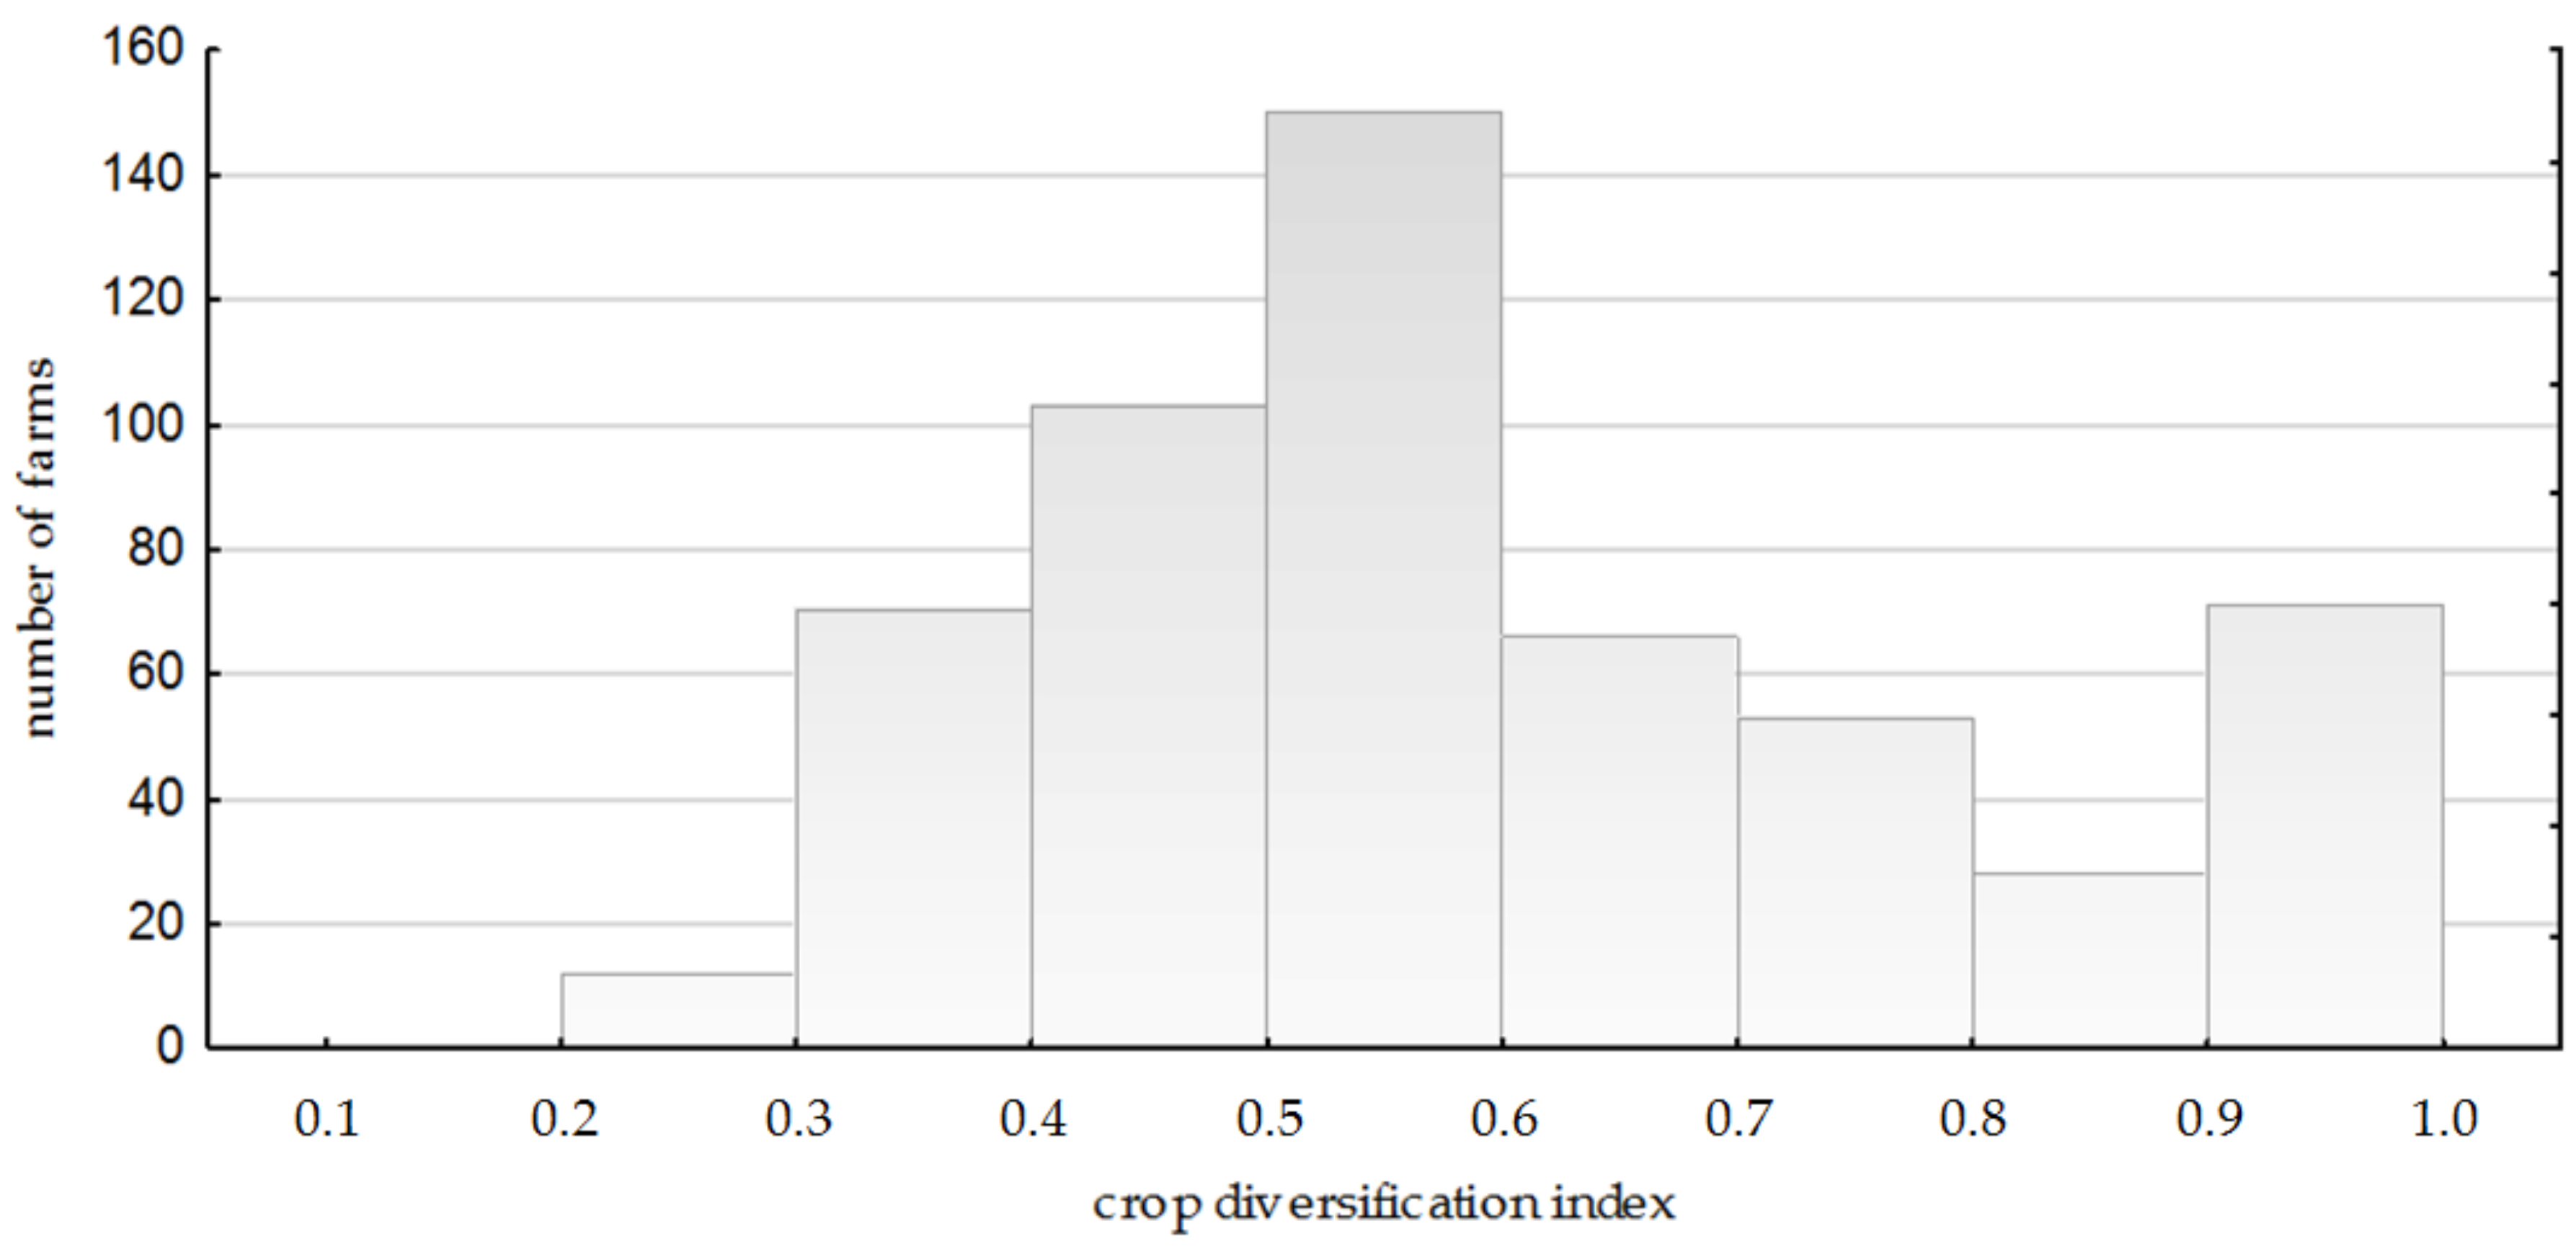
The intensity of diversification in the group of researched farms was low. The diversification index (HHI) averaged 0.59. In terms of the intensity of diversification of crops, agricultural holdings were characterized by an average differentiation (change: 32.67%). For comparison, in the group of other small farms, the HHI index was on average 0.70. Units with the HHI index equal to 1 prevailed. The minimum value of the HHI index in the analyzed group of small farms was 0.22, while the maximum value was 0.94. The median value of the HHI index was 0.55. However, small farms with the HHI value above the median prevailed slightly (Figure 1).
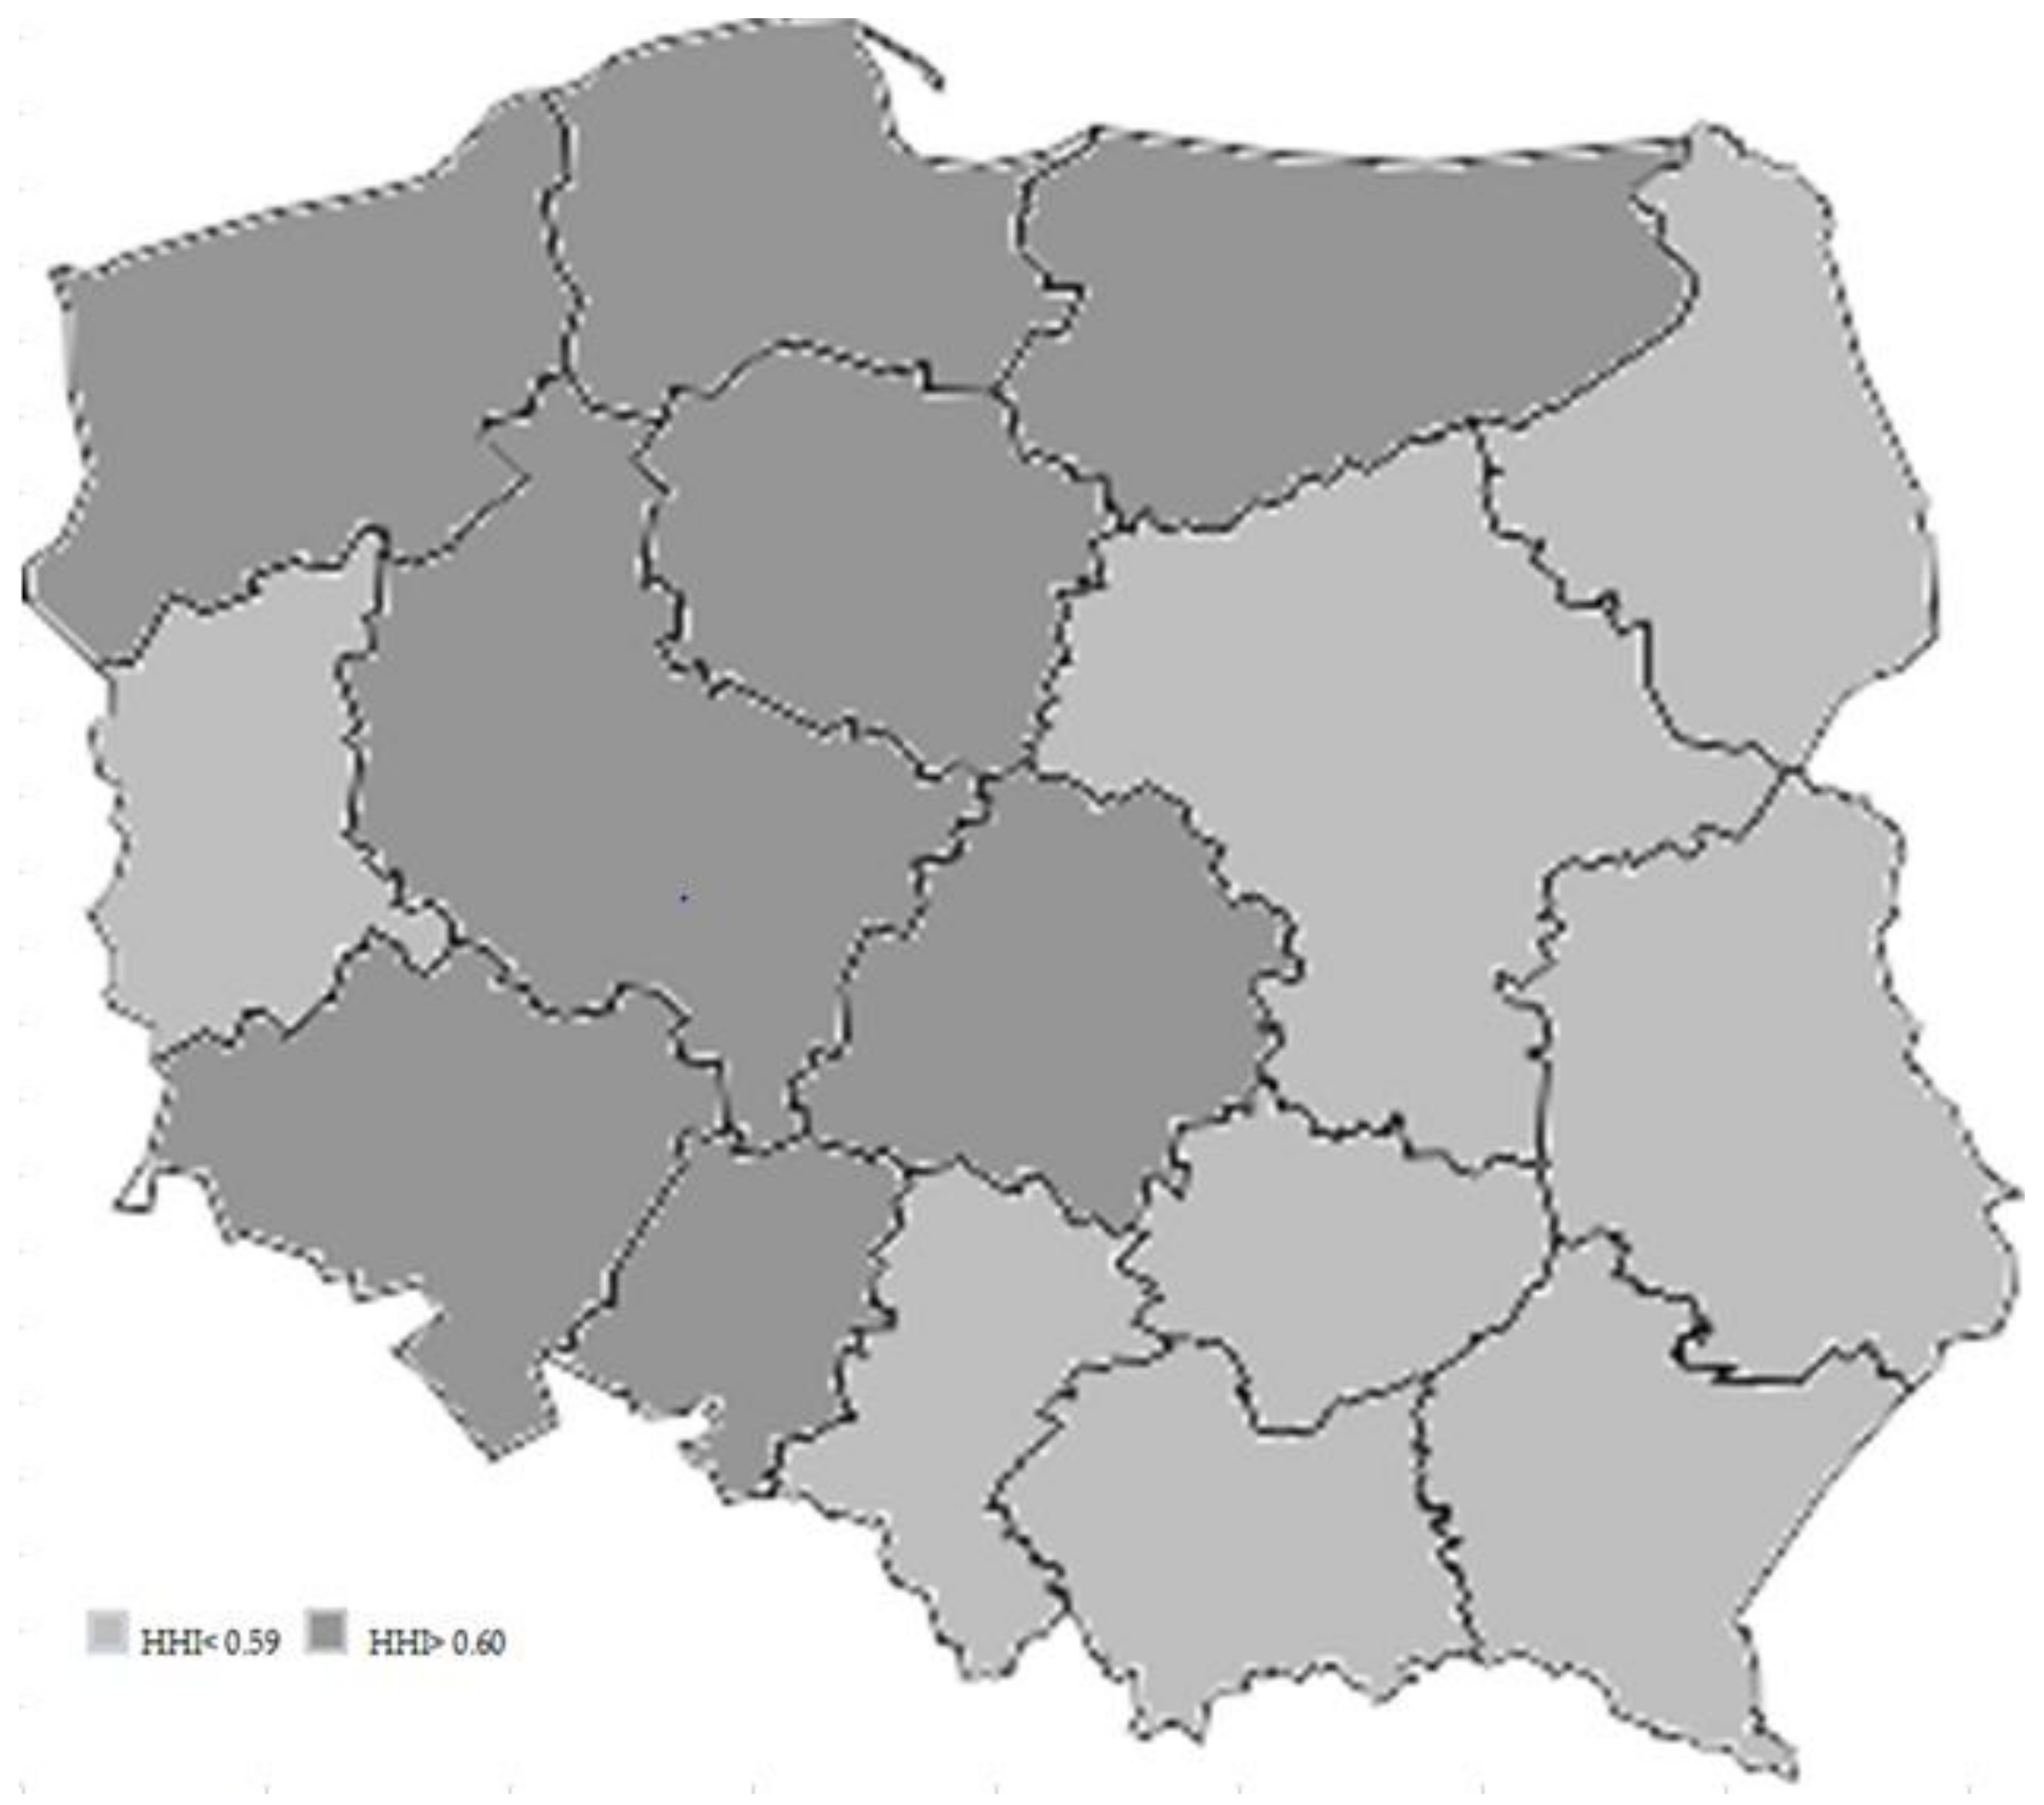
In terms of the size of the crop diversification index, Poland can be divided into two parts. In the north-western part there are small farms with a lower level of crop diversification. The HHI value in these regions of Poland exceeded the value of 0.60. Only in 25% of small farms the value of the HHI index oscillated between 0.40 and 0.59. In turn, in the rest of the country, the value of the cultivation diversification index in small farms was below 0.59 (Figure 2). In 25% of small farms in this part of the country, the HHI index fluctuated at the level of 0.60. In most of them (75%), it reached the value of 0.40. It should be noted that the regional differentiation of the cultivation diversification index in small farms is influenced by the organizational and economic conditions of farms, topography or natural conditions. Regions with a high diversity of crops are characterized by low land productivity and low labor productivity. These regions have high employment in agriculture. They are also characterized by worse production parameters, i.e., the predominance of weaker soils with low agricultural culture [81]. Greater crop diversity is rational behavior for farmers in these regions, as they have to adapt to the existing agrotechnical conditions, which can create many production niches.
3.3. Economic Results of Small Farms Diversifying Crops versus Others
Small farms diversifying crops were characterized by significantly lower productivity and profitability of land than farms focused on one production profile. This is evidenced by the lower average values of the analyzed indicators in both groups. The land productivity index showed the greatest differentiation in the group of small farms focused on one production profile. Small farms diversifying crops were characterized by much lower differentiation of land productivity. On the other hand, a significant dispersion indicates a high volatility of land profitability in this group of farms. The presented land profitability indicators indicate more efficient land use by small farms conducting targeted production. Considering the coefficient of variation, small farms diversifying crops were characterized by lower diversification of the increase in the value of goods produced on a farm. Comparing the average increase in the value of goods produced in a given farm in small farms diversifying crops, it was two times lower than in small farms focused on one production profile (Table 3). For all indices describing productivity and profitability will change, statistically significant (p < 0.05) differences in distribution have been demonstrated. As Katchova [82] suggests, diversified farms show lower efficiency because these farms support less profitable activities by cross-subsidizing them with more profitable activities or accept lower returns in exchange for risk reduction.
Labor profitability on a farm is an indicator that assigns all farm income to the labor factor used on a farm, while own labor profitability is an indicator that assigns all farm income to the involvement of a farmer and his family, excluding remuneration from land and capital. The farm owner is primarily interested in the total effect of his involvement in agricultural activity and he is the one who influences the decisions regarding the continuation or discontinuation of the activity [56]. It should be noted that the level of profitability of work is nowadays considered to be one of the basic factors determining the living standard of the agricultural population and one of the most important factors determining the competitive advantage of farms [83]. In the compared groups of small farms, labor profitability indicators were twice as high in the case of entities focused on one production profile, compared to farms diversifying crops. This is indicated by the average values of the discussed indicators of work profitability, as well as the results of the Mann–Whitney U test. In the group of small farms diversifying crops, the profitability indicators were characterized by relatively lower volatility, compared to small farms with targeted production.
The capital structure affects the economic results of entities from the agricultural sector. It is a fact, however, that farms are characterized by a high degree of self-financing and low propensity to incur debt [84]. This is especially true for small farms. It should be noted that the strategy of financing assets in farms is a function of many factors and in particular depends on the availability of a given source of capital, the cost of capital and production risk. As the analysis shows, in the group of small farms diversifying their production, the level of general debt was relatively low compared to the debt level of small farms with targeted production. Considering the coefficient of variation, small farms diversifying crops were characterized by lower differentiation of the average amount of total liabilities. The distribution of income from agricultural activity was similar, which also indicated the existence of significant differences in the average income values of both analyzed groups of small farms.
The income from agricultural activity of small farms diversifying their production was almost half lower in comparison to small farms targeting one production profile. The low level of profitability of small farms diversifying crops, with a relatively low level of use of financial leverage by this group of entities, may significantly inhibit the processes of technical modernization and thus reduce their effectiveness. In addition, as indicated by Wieliczko et al. [85], with low income, accumulation of capital from existing income is very difficult. The accumulation of capital as well as the development of the individual curve of the demand for agricultural production factors depend on the amount of economic surplus generated by agricultural activity.
Operating subsidies have a significant share in the income of farms, both in Poland and in other European Union countries [86]. Moreover, small farms in Poland are characterized by a higher production cost and a lower ability to generate income in the course of operating activities, compared to an average small farm in the European Union [22]. Kurdyś-Kujawska and Sompolska-Rzechuła [87] prove that agricultural subsidies affect not only an increase in farm income, but also an increase in the value of fixed assets and gross investments in farms. A large variation in the amounts of subsidies for rural development received by small farms and small differences in the amounts of subsidies received for operating activities were observed. The number of subsidies for rural development in small farms diversifying crops was three times higher than the number of subsidies received in the second of the analyzed groups of farms. As Wieliczko et al. [88] the possibility of using these subsidies allows small farms to adapt to EU requirements, improve the quality of agricultural products, or, as in the case of LFA (less favored areas) subsidies, compensate for lower incomes. Small farms are willing to use subsidies to improve overall farming performance, including increasing the productivity of agricultural activity. In small farms diversifying crops, a much higher value of received payments for operating production was also noted.
In both groups of small farms, the profitability ratios of total assets and the return on equity were negative. The distributions of the return on total assets and return on equity were significantly different. This is indicated by the average values of the discussed index, as well as the results of the Mann–Whitney U test. Small farms diversifying crops were characterized by much lower operating efficiency in terms of generating profits from owned assets. These entities were also characterized by a lower profitability growth potential. The ability of small farms to self-finance and create savings is an important aspect of the functioning of farms, as it allows farmers to have a direct impact on the development and changes in the field of activity, allowing, inter alia, to finance investments in future periods and is an important element of financial security in the event of unforeseen events [85,89]. Cash flow shows the farm’s ability to self-finance its activities and create savings as part of its operating activities. The distribution of cash flow values in both groups is not uniform. Small farms diversifying crops were characterized by a much lower ability to self-finance and create savings than farms focused on one production profile. In both groups of small farms there was a negative balance of cash flows from operating activities, while in farms diversifying production the negative balance of cash flows was much lower than in other farms.
The distributions of gross investment value in small farms diversifying crops and targeting one production profile differed significantly. In both groups of farms, the average value of gross investment was negative, which means that the value of sold and free of charge fixed assets was higher than the value of purchased and manufactured fixed assets in a given year. Small farms diversifying crops had a relatively lower average gross investment value.
Based on the results of the non-parametric Mann–Whitney U test, the null hypothesis (at the significance level p < 0.05) was rejected about the insignificance of differences between the economic results of both groups of small farms that were subjected to the study. Thus, there is a statistically significant difference between the economic results of small farms that diversify crops and small farms focused on one agricultural production profile.
3.4. Determinants of Crop Diversification
In the initial model of the probability of crop diversification in small farms in Poland, all variables listed in Table 1 were considered. In accordance with the adopted methodology, only those variables that have a significant impact on the variable Y—crop diversification, using backward stepwise regression analysis were left. This means that from the list of potential dependent variables, the variables from the full model were gradually eliminated in such a way as to obtain the model with the highest value of the determination coefficient, while maintaining the significance of the parameters. The analysis of the results of the estimation of the parameters of the probability model of crop diversification by small farms in Poland showed the statistical significance of three variables: —value of fixed assets; —the level of exposure to atmospheric and agricultural drought; —location in the frost resistance zone. The empirical results obtained from the estimation of the logit model are presented in Table 4.
The estimated logistic model is as follows:
The correctness of the estimated model was assessed by counting the accuracy of the classification of the logit model, which is presented in Table 5.
Model quality was assessed based on the value of the coefficient and the ROC curve. The degree of fit of the logistic model to empirical data is presented in Table 6.
Based on the results in Table 5, it can be concluded that the logistic regression model is characterized by a fairly good fit to the empirical data. The results of the Hosmer-Lemenshow test show no significant differences between the empirical and theoretical numbers, which result from the estimated logistic regression models.
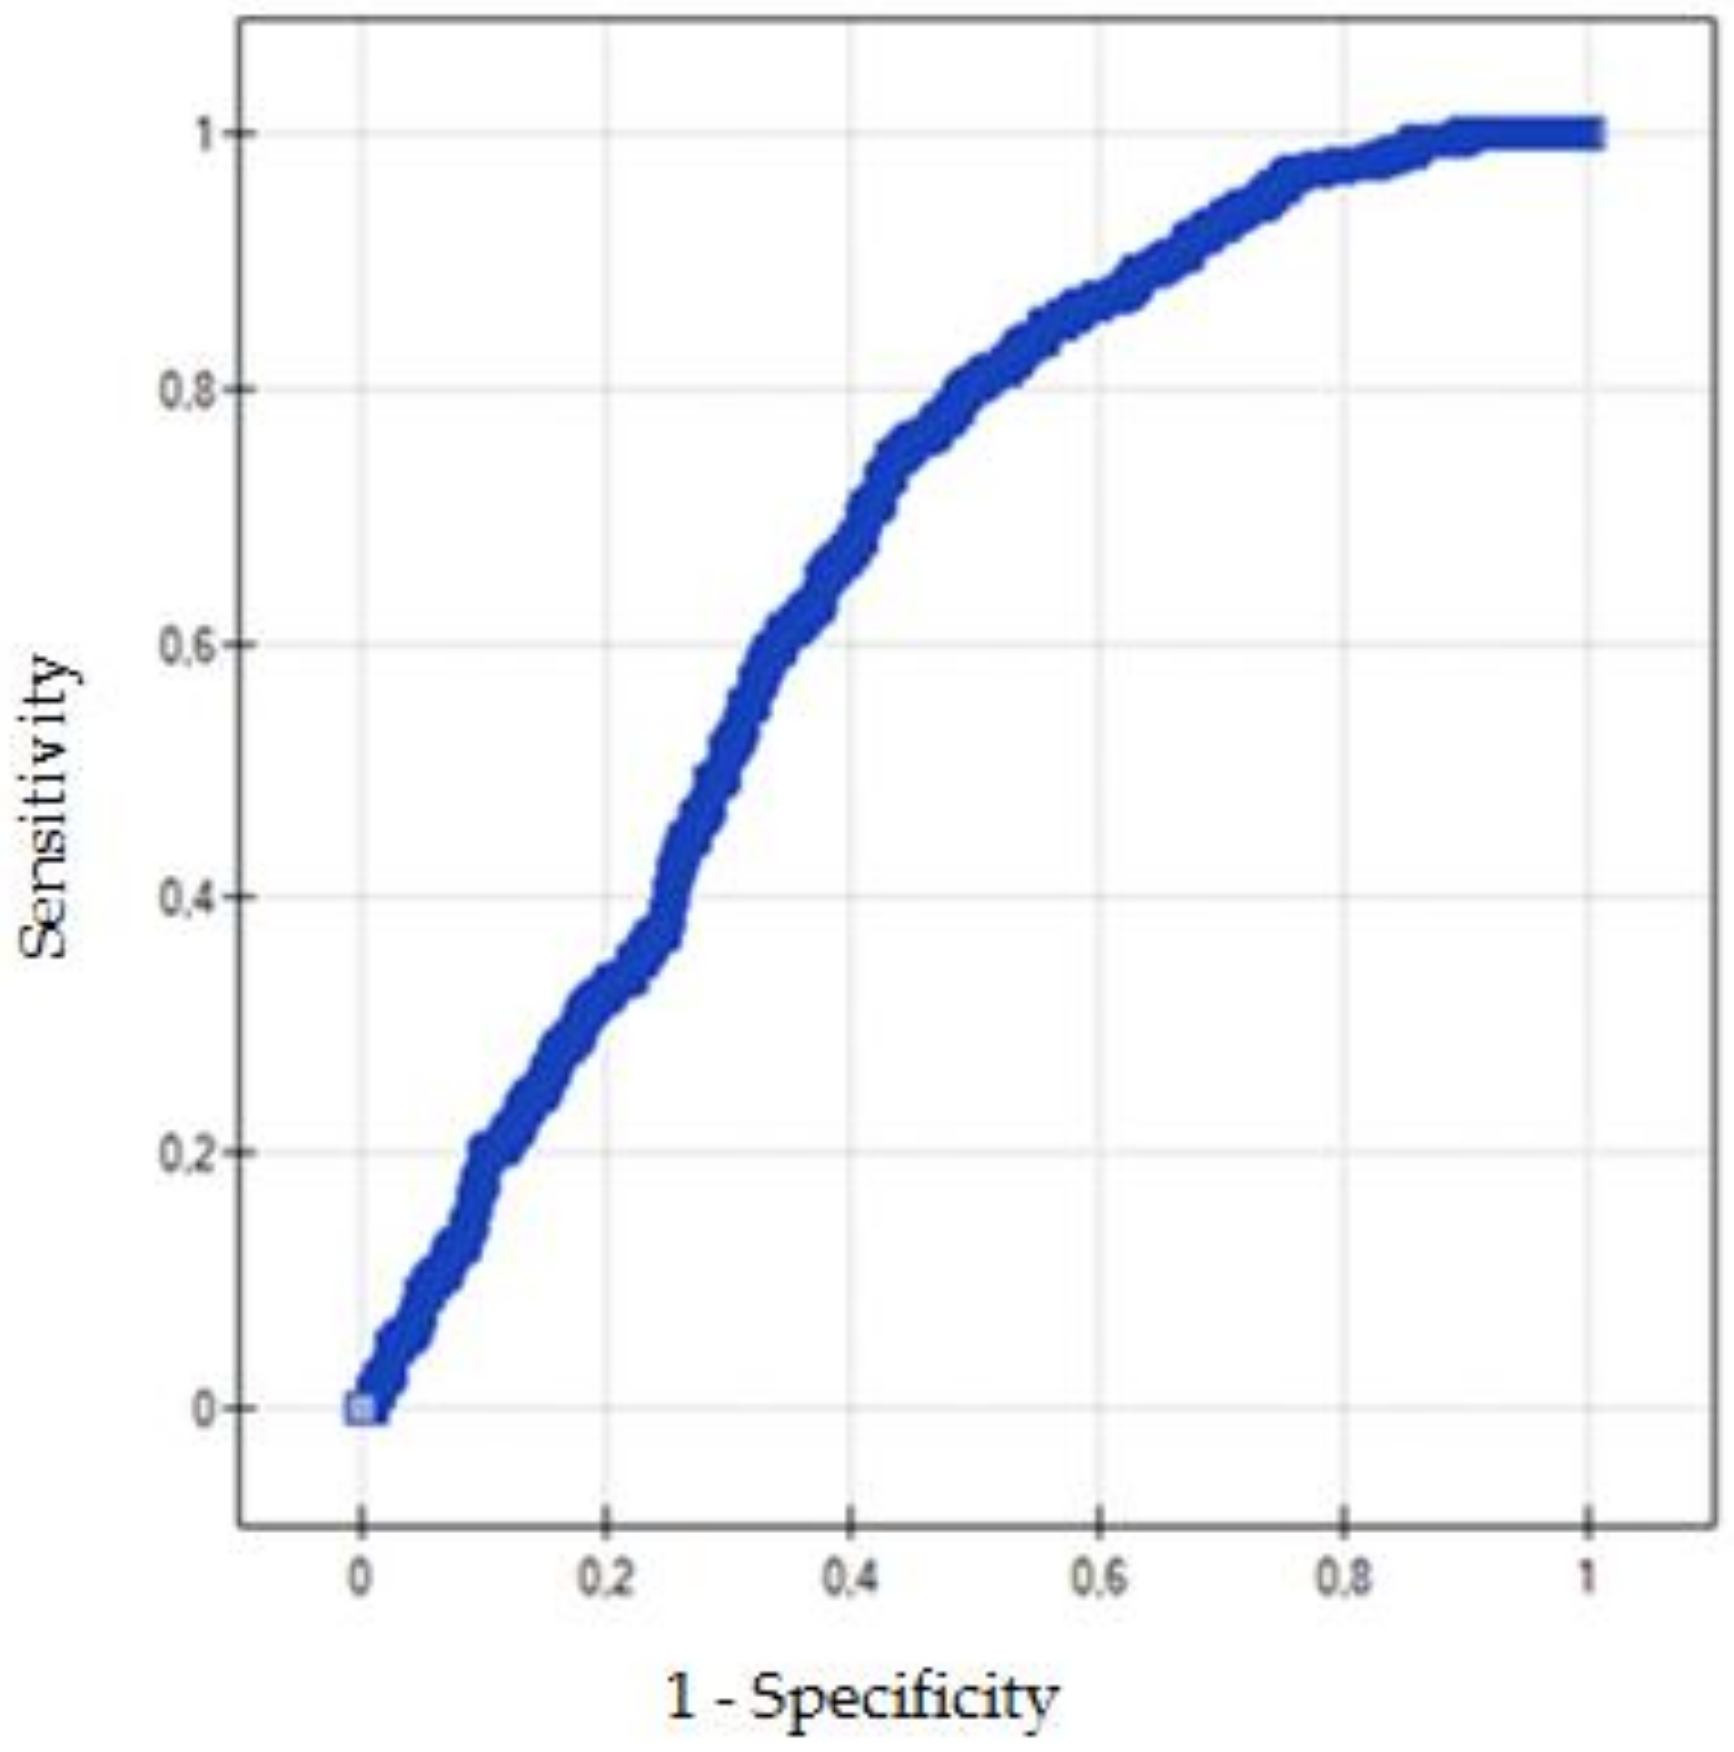
The field under the ROC curve is significantly greater than 0.5 (at the significance level greater than 0.000001), therefore, it is possible to classify farms on the basis of the constructed model (Figure 3).
In the model, the following factors have a positive, statistically significant influence on the dependent variable: —the level of exposure to atmospheric and agricultural drought and —the location of the farm in the hardiness zone. This means that the higher the values of these variables, the higher the probability of crop diversification. Interpreting the odds ratios for the i-th variable (assuming that the remaining variables included in the model remain unchanged), the following information is obtained: if the agricultural production is located in a region prone to atmospheric and agricultural drought, the chance for crop diversification will increase by 42.84%; the greater the likelihood of a harsher winter and, therefore, of frosts in the region where agricultural production is located, the greater the chance for crop diversification will increase by 69.55%. Similar results in terms of the influence of climatic factors on decisions regarding crop differentiation were obtained, among others, by Ashok et al. [63], Huang et al. [64], Kurdyś-Kujawska [65]. The adoption of a crop diversification strategy in the analyzed farms should be considered a rational behavior of farmers strongly exposed to weather uncertainty. Being highly dependent on rainfall or low temperatures, small farmers undertake ex ante actions minimizing losses resulting from the realization of production risk in the face of changing weather conditions. The results of the studies by Belay et al. [90] also prove that crop diversification is one of the strategies used by small farms to adapt to climate change. Climate change can cause large fluctuations in production and affect farmers’ incomes and diversification can effectively stabilize them. Weather shocks such as drought, for example, can trap households in poverty [91]. By diversifying crops, the overall shortfall in income is reduced, by spreading the effects of climate risk across different crops, there is also a reduction in the average annual income volatility resulting from highly seasonal agricultural income flows and there is a reduction in the inter-year income volatility that results from the instability of production and the market [92]. Wan et al. [93] indicate that crop diversification can be seen as a strategy for managing the risk of drought, which is the greatest challenge for farmers worldwide. It is a deliberate ex ante strategy aimed at anticipating possible negative events and counteracting the expected failure in various income streams in the future. Small farmers do not generate enough savings, most of them do not participate in the crop insurance scheme [85], which means that they are not able to mitigate their consumption through ex post mechanisms. Therefore, they can allocate farm resources in such a way as to ensure a more stable income. In addition, to using crop diversification to deal with the risk of climate and market volatility [94,95,96], crop diversification optimizes crop production under heterogeneous agroecological conditions in marginal areas with heavy rainfall [97,98] or irregular frequency. These phenomena weaken farm yields, reducing food availability and lowering incomes [99].
The following variable had a negative, statistically significant influence on the dependent variable: —value of non-current assets (PLN ‘000). If the value of fixed assets increases by PLN 1000, the chance for diversification of crops will decrease by 0.08%. This result shows that farmers with relatively larger fixed assets are less inclined to diversify their crops. Katchova [82] drew similar conclusions, indicating that farms with a high degree of diversification accumulate fewer assets than more specialized farms. This suggests that small farms with a higher value of fixed assets are better able to absorb or mitigate income shocks than farmers with fewer fixed assets. These farms may show greater ability and motivation to adopt new and improved production technologies necessary to increase and stabilize income. Since increasing the value of fixed assets is associated with investments, it can be concluded that small farms that do not diversify crops through investments in fixed assets, new technologies and innovative solutions may increase production and its efficiency. These smallholder farmers are most likely shifting from subsistence farming based on self-sufficiency to profit- and income-oriented decision making. Hence, the choice and degree of diversification may depend on the degree of commercialization of small farms [100].
4. Conclusions
This article presents the impact of crop diversification on the economic efficiency of small farms in Poland, as well as the factors conditioning crop diversification in these farms.
The results of our research indicate that, first of all, in the analyzed group of small farms in Poland 34.30% diversified their crops. The intensity of crop diversification was low. The majority of farms were farms with the HHI value above 0.55. Secondly, our research shows that the decisions of small farms in Poland in the field of crop diversification were determined by the value of fixed assets: the level of exposure to atmospheric and agricultural drought and location in the frost resistance zone. Farmers who have higher-value fixed assets are less likely to decide to diversify their crops. Furthermore, the location of a small farm in a region exposed to atmospheric and agricultural drought increases the chance of crop diversification by 42.84%, while severe winters and the risk of frost increase the probability of crop diversification by 69.55%. Diversification of crops was largely determined by the degree of exposure of small farms to climate risk, in particular to drought and frost. Thus, crop diversification helps increase farmers’ resilience to changing weather conditions caused by climate change and stabilize their incomes. Therefore, the H1 hypothesis should be adopted, according to which the factor determining crop diversification in small farms is the level of exposure to climate risk. Thirdly, small farms diversifying crops were characterized by significantly lower productivity and profitability of land than farms focused on one production profile. The average increase in the value of goods produced in small farms diversifying crops was twice lower than in small farms focused on one production profile. The income from agricultural activity of small farms diversifying their production was almost 50% lower in comparison to small farms focused on one production profile. It was noticed that in the group of farms diversifying crops, the operating efficiency in terms of generating profits from the assets held was much lower than in other farms. Small farms diversifying crops were characterized by a much lower ability to self-finance and create savings than farms focused on one production profile. It should be emphasized that the positive effect of diversification of production by the examined small farms in relation to the number of subsidies for rural development. In the group of farms diversifying crops, this amount was three times higher than the amount of payments received in other farms. Despite relatively higher income support for farmers diversifying crops, these farms were characterized by lower economic surpluses. The obtained research results allow us to adopt the H2 hypothesis. Finally, the results of the study suggest that the choice of crop diversification involves a compromise between the efficiency and resilience (income volatility) of small farms. Maintaining crop diversification in small farms in Poland will largely depend on whether small farms will be able to maximize interactions and resolve trade-offs between crop diversification and economic efficiency and its increase. Maintaining crop diversification in small farms in Poland will largely depend on whether small farms will be able to maximize interactions and resolve trade-offs between crop diversification and economic efficiency and its increase.
The future of agriculture and food production requires an integrated and coherent approach to risk prevention and management, complementary linking EU-level interventions with Member States’ strategies and private sector instruments that address income stability and climate risk [101]. It becomes necessary to look for such solutions and such support programs that will provide small farmers who diversify crops with an increase in productivity and income. More targeted public support and policy responses are needed for small farms diversifying crops to minimize all expected and inevitable negative consequences of market volatility and income uncertainty [102]. Agricultural policy should focus on increasing the access of farmers from small farms to external sources of financing, which will enable farmers to invest in new plant varieties, more productive, resistant to changes in climatic and environmental conditions. This will ensure their income growth and at the same time increase their stability. It is also important to create an appropriate program of advisory services so that farmers from small farms increase their knowledge of the cultivation of new plant varieties. As Mzyece and Ng’ombe [41] points out crop diversification should be better promoted in conjunction with other strategies to increase farm productivity. These strategies can help offset or reduce the negative impact of crop diversification on small farm productivity.
This issue of crop diversification requires further research in terms of national and international (quantitative) as well as qualitative. This task is particularly important in the conditions of high fragmentation of agriculture and a relatively low level of profitability of this sector. The question arises to what extent decisions in the field of crop differentiation are aimed at protecting the potential/current income from agricultural production (striving to keep the income at an unchanged level) and to what extent are they determined by the desire to maximize income from the factors of production owned. In order to thoroughly analyze the problem of economic efficiency of small farms diversifying crops, further research is planned to extend the previous research and to compare the economic efficiency of small farms specializing in field crops with mixed farms using an alternative sample (for instance, recurring to matching techniques). In addition, future research will focus on identifying how the level of crop differentiation affects the economic efficiency of small farms.
Author Contributions
Conceptualization, A.K.-K., A.S. and D.Z.; methodology, A.K.-K., A.S. and D.Z.; software, A.K.-K.; validation, A.K.-K., A.S. and D.Z.; formal analysis, A.K.-K.; investigation, A.K.-K., A.S. and D.Z.; resources, A.K.-K.; data curation, A.K.-K.; writing—original draft preparation, A.K.-K., A.S. and D.Z.; writing—review and editing, A.K.-K., A.S. and D.Z.; visualization, A.K.-K., A.S. and D.Z.; supervision, A.K.-K., A.S. and D.Z.; project administration, A.K.-K., A.S. and D.Z.; funding acquisition, A.K.-K., A.S. and D.Z. All authors have read and agreed to the published version of the manuscript.
Funding
This research received no external funding.
Institutional Review Board Statement
Not applicable.
Informed Consent Statement
Not applicable.
Data Availability Statement
The data presented in this study are available on request from the corresponding author. Data was obtained from Polish Farm Accountancy Data Network.
Conflicts of Interest
The authors declare no conflict of interest.
References
- Raj, T. Diversification of Small and Marginal Farms in Himachal Pradesh. J. Agric. Econ. 2010, 7, 7–16. [Google Scholar]
- Rural areas in Poland in 2018; Statistics Poland, Statistical Office in Olsztyn: Warszawa, Olsztyn, 2020.
- Lowder, S.K.; Skoet, J.; Raney, T. The Number, Size, and Distribution of Farms, Smallholder Farms, and Family Farms Worldwide. World Dev. 2016, 87, 16–29. [Google Scholar] [CrossRef] [Green Version]
- Strzelecka, A. Zmiany dochodów drobnych gospodarstw rolnych w Polsce. (Changes in the incomes of small farms in Poland). Probl. Small Agric. Hold. 2018, 1, 73–91. [Google Scholar] [CrossRef]
- Borychowski, M.; Poczta-Wajda, A.; Sapa, A. Small Farms in the World: Selected Issues. In Small Farms in the Paradigm of Sustainable Development. Case Studies of Selected Central and Eastern European Countries; Stępień, S., Maican, S., Eds.; Wydawnictwo Adam Marszałek: Toruń, Poland, 2020. [Google Scholar]
- Hornowski, A.; Parzonko, A.; Kotyza, P.; Kondraszuk, T.; Bórawski, P.; Smutka, L. Factors Determining the Development of Small Farms in Central and Eastern Poland. Sustainability 2020, 12, 5095. [Google Scholar] [CrossRef]
- Żmija, J.; Czekaj, M. Wspólna Polityka Rolna a rozwój drobnych gospodarstw rolnych. (Common Agricultural Policy and the Development of Small Farms). Sci. J. Wars. Univ. Life Sci. SGGW. Eur. Policies Financ. Mark. 2012, 8, 518–527. [Google Scholar]
- Forgacs, C. Is Specialization a Way for Small Farms in Central and Eastern European Countries to Adjust? In Proceedings of the International Scientific Conference Economic Science for Rural Development, Jelgava, Latvia, 21–22 April 2016; p. 42. [Google Scholar]
- Burkitbayeva, S.; Swinnen, J. Smallholder agriculture in transition economies. J. Agrar. Chang. 2018, 18, 882–892. [Google Scholar] [CrossRef]
- Beluhova-Uzunova, R.; Hristov, K.; Shishkova, M. Small Farms in Bulgaria—Trends and Perspectives. Agric. Sci. Agrar. Nauk. 2019, 11, 59–65. [Google Scholar] [CrossRef]
- Dzun, W. Drobne gospodarstwa w rolnictwie polskim—Próba definicji i charakterystyki. (Polish agricultures’ small farms. An effort to define this category and its characteristics). Village Agric. 2013, 2, 9–27. [Google Scholar]
- Hornowski, A.; Kryszak, Ł. Wyniki finansowe drobnych gospodarstw rolnych w świetle sprawozdań europejskiego FADN. (Financial results of small farms in the ligh to reports of European FADN). Ann. Pol. Assoc. Agric. Agribus. Econ. 2016, 18, 92–98. [Google Scholar]
- Strzelecka, A.; Zawadzka, D. Does Production Specialization Have an Impact on the Financial Efficiency of Very Small Farms? In Proceedings of the 36th International Business Information Management Association, Granada, Spain, 4–5 November 2020. [Google Scholar]
- Poczta-Wajda, A.; Sapa, A.; Stępień, S.; Borychowski, M. Food in security among Small-Scale Farmers in Poland. Agriculture 2020, 10, 295. [Google Scholar] [CrossRef]
- Czyżewski, B.; Sapa, A.; Kułyk, P. Human Capital and Eco-Contractual Governance in Small Farms in Poland: Simultaneous Confirmatory Factor Analysis with Ordinal Variables. Agriculture 2021, 11, 46. [Google Scholar] [CrossRef]
- Musiał, W.; Drygas, M. Dylematy procesu delimitacji drobnych gospodarstw rolnych. (Dilemmas in the Process of MarkingBoundries of Small Farms). Village Agric. 2013, 2, 55–74. [Google Scholar]
- Ardakani, Z.; Bartolini, F.; Brunori, G. New Evaluation of Small Farms: Implication for an Analysis of Food Security. Agriculture 2020, 10, 74. [Google Scholar] [CrossRef] [Green Version]
- Rodrigues Fortes, A.; Ferreira, V.; Barbosa Simões, E.; Baptista, I.; Grando, S.; Sequeira, E. Food Systems and Food Security: The Role of Small Farms and Small Food Businesses in Santiago Island, Cabo Verde. Agriculture 2020, 10, 216. [Google Scholar] [CrossRef]
- Rivera, M.; Guarín, A.; Pinto-Correia, T.; Almaas, H.; Arnalte-Mur, L.; Burns, V.; Czekaj, M.; Ellis, R.; Galli, F.; Grivins, M.; et al. Assessing the role of small farms in regional food systems in Europe: Evidence from a comparative study. Glob. Food Secur. 2020, 26, 100417. [Google Scholar] [CrossRef]
- Galli, F.; Grando, S.; Adamsone-Fiskovica, A.; Bjørkhaug, H.; Czekaj, M.; Duckett, D.G.; Almaas, H.; Karanikolas, P.; Moreno-Pérez, O.M.; Ortiz-Miranda, D.; et al. How do small farms contribute to food and nutrition security? Linking European small farms, strategies and out comes in territorial food systems. Glob. Food Secur. 2020, 26, 100427. [Google Scholar] [CrossRef]
- Guarín, A.; Rivera, M.; Pinto-Correia, T.; Guiomar, N.; Šūmane, S.; Moreno-Pérez, O.M. A new typology of small farms in Europe. Glob. Food Secur. 2020, 26, 100389. [Google Scholar] [CrossRef]
- Strzelecka, A.; Zawadzka, D. Production Potential and Income of Very Small Farms in the European Union and Poland. In Proceedings of the 36th International Business Information Management Association, Granada, Spain, 4–5 November 2020. [Google Scholar]
- Kurdyś-Kujawska, A.; Strzelecka, A.; Szczepańska-Przekota, A.; Zawadzka, D. Dochody Rolnicze. Determinanty-Zróżnicowanie- Stabilizacja. (Agricultural income. Determinants-Differentiation-Stabilization); Wydawnictwo Politechniki Koszalińskiej: Koszalin, Poland, 2019. [Google Scholar]
- Myeni, L.; Moeletsi, M.E. Factors Determining the Adoption of Strategies Used by Smallholder Farmers to Cope with Climate Variability in the Eastern Free State, South Africa. Agriculture 2020, 10, 410. [Google Scholar] [CrossRef]
- Aribi, F.; Sghaier, M. Determinants and strategies of farmers’ adaptation to climate change: The case of Medenine Governorate, Tunisia. Agrofor Int. J. 2020, 5, 122–129. [Google Scholar] [CrossRef]
- Mango, N.; Makate, C.; Mapemba, L.; Sopo, M. The role of crop diversification in improving household food security in central Malawi. Agric. Food Secur. 2018, 7, 7. [Google Scholar] [CrossRef]
- Iocola, I.; Angevin, F.; Bockstaller, C.; Catarino, R.; Curran, M.; Messéan, A.; Schader, C.; Stilmant, D.; VanStappen, F.; Vahove, P.; et al. An Actor-Oriented Multi-Criteria Assessment Framework to Support a Transition towards Sustainable Agricultural Systems Basedon Crop Diversification. Sustainability 2020, 12, 5434. [Google Scholar] [CrossRef]
- Figurek, A.; Rokvić, G.; Vaśko, Ž. Diversification of the rural economy as the function of the sustainability of rural areas. Agric. For. 2012, 58, 51–61. [Google Scholar]
- Ogundari, K. Crop diversification and technical efficiency in food crop production. Int. J. Soc. Econ. 2013, 40, 267–287. [Google Scholar] [CrossRef]
- Banerjee, D.; Bhattacharya, U. Problems of Crop Diversification in West Bengal. In Diversification of Agriculture in Eastern India. Indian Studies in Business and Economics; Ghosh, M., Sarkar, D., Roy, B., Eds.; Springer: New Delhi, India, 2015. [Google Scholar] [CrossRef]
- Salvioni, C.; Henke, R.; Vanni, F. The Impact of Non-Agricultural Diversification on Financial Performance: Evidence from Family Farms in Italy. Sustainability 2020, 12, 486. [Google Scholar] [CrossRef] [Green Version]
- Lakner, S.; Kirchweger, S.; Hoop, D.; Brümmer, B.; Kantelhardt, J. The Effects of Diversification Activities on the Technical Efficiency of Organic Farms in Switzerland, Austria, and Southern Germany. Sustainability 2018, 10, 1304. [Google Scholar] [CrossRef] [Green Version]
- McNamara, K.T.; Weiss, C. Farm Household Income and On-and Off-Farm Diversification. J. Agric. Appl. Econ. 2005, 37, 37–48. [Google Scholar] [CrossRef] [Green Version]
- Chavas, J.P.; Kim, K. Economies of diversification: A generalization and decomposition of economies of scope. Int. J. Prod. Econ. 2010, 126, 229–235. [Google Scholar] [CrossRef]
- Coelli, T.J.; Fleming, E. Diversification economies and specialization efficiencies in a mixed food and coffee small holder farming system in Papua New Guinea. Agric. Econ. 2004, 31, 229–239. [Google Scholar] [CrossRef] [Green Version]
- Nguyen, H.Q. Crop Diversification, Economic Performance and Household’s Behaviours: Evidence from Vietnam; MPRA Paper 59090; University Library of Munich: Munich, Germany, 2014. [Google Scholar]
- Manjunatha, A.V.; Anik, A.R.; Speelman, S.; Nuppenau, E.A. Impact of land fragmentation, farm size, land owners hip and crop diversity on profit and efficiency of irrigated farms in India. Land Use Policy 2013, 31, 397–405. [Google Scholar] [CrossRef]
- European Parliament Resolution of 27 October 2016 on How the CAP can Improve Job Creation in Rural Areas (2015/2226(INI). How the CAP can Improve Job Creation in Rural Areas. Available online: https://eur-lex.europa.eu/legal-content/EN/TXT/PDF/?uri=CELEX:52016IP0427&from=PL (accessed on 2 November 2020).
- Vanden Berg, M.M.; Hengesdijk, H.; Wolf, J.; Ittersum, M.K.V.; Guangho, W.; Roetter, R.P. The impact of increasing farm size and mechanization on rural income and rice production in Zhejiang province, China. Agric. Syst. 2007, 94, 841–850. [Google Scholar] [CrossRef]
- Haji, J. Production Efficiency of Smallholders’ Vegetable-dominated Mixed Farming System in Eastern Ethiopia: A Non-Parametric Approach. J. Afr. Econ. 2007, 1, 1–27. [Google Scholar] [CrossRef]
- Mzyece, A.; Ng’ombe, J.N. Does crop diversification involve a trade-off between technical efficiency and income stability for rural farmers? Evidence from Zombia. Agronomy 2020, 10, 1875. [Google Scholar] [CrossRef]
- Mazzocchi, C.; Orsi, L.; Ferrazzi, G.; Corsi, S. The Dimensions of Agricultural Diversification: A Spatial Analysis of Itali Municipalities. Rural Sociol. 2020, 85, 316–345. [Google Scholar] [CrossRef]
- Rehima, M.; Belay, K.; Dawit, A.; Rashid, S. Factors affecting farmers’ crops diversification: Evidence from SNNPR, Ethiopia. Int. J. Agric. Sci. 2013, 3, 558–565. [Google Scholar]
- Makate, C.; Wang, R.; Makate, M.; Mango, M. Crop diversification and livelihoods of smallholder farmers in Zimbabwe: Adaptive management for environmental change. Springer Plus 2016, 5, 1–18. [Google Scholar] [CrossRef] [Green Version]
- Dembele, B.; Bett, H.K.; Kariuki, I.M.; LeBars, M.; Ouko, K.O. Factors influencing crop diversification strategies among smallholder farmers in cotton production zone in Mali. Adv. Agric. Sci. 2018, 6, 1–16. [Google Scholar]
- Nayak, C.; Kumar, C.R. Crop diversification in Odisha: An analysis based on panel data. Agric. Econ. Res. Rev. 2019, 32, 67–80. [Google Scholar] [CrossRef]
- Anuja, A.R.; Kumar, A.; Saroj, S.; Singh, K.N. The impact of crop diversification towards high-value crops on economic welfare of agricultural households in Eastern India. Curr. Sci. 2020, 118, 1575–1582. [Google Scholar] [CrossRef]
- Geethu, P.G.; Sharma, H.O. Determinants of crop diversification in Kerala-a temporal analysis. J. Trop. Agric. 2020, 58, 99–106. [Google Scholar]
- Bansal, H.; Sharma, S.; Kumar, R.; Singh, A. The Factors Influencing and Various Technological and Socio-Economic Constraints for Crop Diversification in Haryana. Econ. Aff. 2020, 65, 409–413. [Google Scholar] [CrossRef]
- Kumar, C.R. Crop Diversification And Its Determinants: A Comparative Study Between Cuttack And Kandhamal Districts Of Odisha, India. J. Glob. Resour. 2020, 6. [Google Scholar] [CrossRef]
- Mulwa, C.K.; Visser, M. Farm diversification as an adaptation strategy to climatic shocks and implications for food security in northern Namibia. World Dev. 2020, 129, 104906. [Google Scholar] [CrossRef]
- Dries, L.; Pascucci, S.; Gardebroek, C. Diversification in Italian Farm Systems: Are Farmers Using Interlinked Strategies? New Medit 2012, 4, 7–15. [Google Scholar]
- Cramerm, J.S. Logit Models from Economics and Other Fields; Cambridge University Press: Cambridge, UK, 2003. [Google Scholar]
- Hosmer, D.W.; Lemeshow, S. Applied Logistic Regression; John Wiley & Sons: New York, NY, USA, 2000. [Google Scholar]
- Hoo, Z.H.; Candlish, J.; Teare, D. What is an ROC curve? Emerg. Med. J. 2017, 34, 357–359. [Google Scholar] [CrossRef]
- Wojewodzic, T.; Jezowit-Jurek, M.; Rachwał, P. Remuneration for labour on agricultural commodity farms in the Małopolska and Pogórze macroregion. Probl. Small Agric. Hold. 2015, 1, 73–87. [Google Scholar] [CrossRef]
- Kołoszko-Chomentowska, Z. Efektywność wykorzystania środków trwałych w gospodarstwach rolnych. (Efficiency in theuse of fixed assets on farm holdings). Rocz. Nauk. Stowarzyszenia Ekon. Rol. I Agrobiz. 2016, 18/3, 178–183. [Google Scholar]
- Mańko, S.; Płonka, R. Struktura aktywów a wyniki działalności gospodarstw rolnych w świetle danych polskiego FADN. (The structure of assets vs performance of agricultural holdings in the light of Polish FADN Data). Zagadnienia Ekon. Rolnej 2010, 4, 134–145. [Google Scholar]
- Strzelecka, A. Zmiany w strukturze majątkowo-kapitałowej przedsiębiorstw rolniczych w Polsce w latach 2004-2009. (Changes in the capital and asset structure of agricultural enterprises in Poland in the years 2004-2009). Pr. Nauk. Uniw. Ekon. we Wrocławiu 2011, 166, 702–715. [Google Scholar]
- Mishra, H.S. El-Osta; Sandretto, C.L. Factors Affecting Farm Enterprise Diversification. Agric. Financ. Rev. 2004, 64, 151–166. [Google Scholar] [CrossRef] [Green Version]
- Sarwosri, A.W.; Mußhoff, O. Are Risk Attitudes and Time Preferences Crucial Factors for Crop Diversification by Smallholder Farmers? J. Int. Dev. 2020, 32, 922–942. [Google Scholar] [CrossRef]
- Auffhammer, M.; Carleton, T.A. Regional Crop Diversity and Weather Shocks in India. Asian Dev. Rev. 2018, 35, 113–130. [Google Scholar] [CrossRef]
- Ashok, K.M.; Meti, S.K.; Vimenuo, S.K. Agricultural diversification and its impact on livelihood security of farmers. J. Nutr. Health Sci. 2017, 1, 1–10. [Google Scholar]
- Huang, J.; Jiang, J.; Wang, J.; Hou, L. Crop diversification in coping with extreme weather events in China. J. Integr. Agric. 2014, 13, 677–686. [Google Scholar] [CrossRef]
- Kurdyś-Kujawska, A. Dywersyfikacja upraw: Strategia zarządzania ryzykiem gospodarstw rolnych z Regionu Pomorza Środkowego. (Diversification of Crops: Risk Management Strategy of Farms Located in Central Pomerania). Zarządzanie I Przedsiębiorczość 2018, 4, 179–190. [Google Scholar]
- DiFalco, S.; Mintewab, B.; Yesuf, M. Seeds for livelihood: Crop Biodiversity and Food Production in Ethiopia. Ecol. Econ. 2010, 69, 1695–1702. [Google Scholar] [CrossRef]
- Dasmani, I.; Darfor, K.; Karakara, A. Farmers’ choice of adoptation strategy against weather variation: Empirical evidence from the three agro-ecological zones in Ghana. Cogent Soc. Sci. 2020, 6, 1–17. [Google Scholar] [CrossRef]
- Brenda, B.L. Resilience in Agriculture through Crop Diversification: Adaptive Management for Environmental Change. Bio Sci. 2011, 61, 183–193. [Google Scholar]
- De Gioia, G. A Decomposition of the Herfindahl Index of Concentration. Munich Personal RePEc Archive; Paper No. 80360; University Library of Munich: Munich, Germany, 2017. [Google Scholar]
- Nauenberga, E.; Basua, K.; Chandb, H. Hirschman-Herfindahl index determination under in complete information. Appl. Econ. Lett. 1997, 4, 639–642. [Google Scholar] [CrossRef]
- Naldi, M.; Flamini, M. Dynamics of the Hirschman-Herfindahl Index uder new market entries, Economic Papers. J. Appl. Policy 2018, 37. [Google Scholar] [CrossRef]
- Hosmer, D.W.; Lemenshow, S.; May, S. Applied Survival Analysis: Regression Modeling of Time to Event Data; John Wiley & Sons, Inc.: New York, NY, 2008. [Google Scholar]
- Strzelecka, A.; Kurdyś-Kujawska, A.; Zawadzka, D. Application of logistic regression models to assess household financial decisions regarding debt. Procedia Comput. Sci. 2020, 176, 3418–3427. [Google Scholar] [CrossRef]
- Stanisz, A. Modele Regresji Logistycznej. Zastosowanie w Medycynie, Naukach Przyrodniczych i Społecznych. (Logistic Regression Models. Application in Medicine, Natural and Social Sciences); Statsoft Polska: Kraków, Poland, 2016. [Google Scholar]
- Maddala, G.S. Introduction to Econometrics, 3rd ed.; John Wiley & Sons, Inc.: New York, NY, 2001. [Google Scholar]
- Stare, J.; Maucort-Boulch, D. Odds ratio, hazard ratio and relative risk. Metodoloski Zv. 2016, 13, 59–67. [Google Scholar]
- Bland, J.M.; Altman, D.G. The Odds Ratio. Br. Med J. 2020, 320, 1468. [Google Scholar] [CrossRef] [Green Version]
- Kleinbaum, D.G.; Klein, M. Logistic Regression; Springer: New York, NY, USA, 2002. [Google Scholar]
- Sompolska-Rzechuła, A.; Świtłyk, M. Czynniki wpływające na prawdopodobieństwo poprawy przychodów gospodarstw rolnych specjalizujących się w produkcji mleka. (Factors affecting probability of income increase in agricultural holdings specialised in milk production). Zagadnienia Ekon. Rolnej 2016, 4, 107–121. [Google Scholar] [CrossRef]
- Zweig, M.H.; Campbell, G. Receiver-operating characteristic (ROC) plots: A fundamental evaluation tool in clinical medicine. Clin. Chem. 1993, 39, 561–577. [Google Scholar] [CrossRef] [PubMed]
- Kiryluk-Dryjska, E.; Więckowska, B. Territorial Clusters of Farmers’ Interest in Diversification in Poland: Geospatial Location and Characteristics. Sustainability 2020, 12, 5276. [Google Scholar] [CrossRef]
- Katchova, A.L. The farm diversification discount. Am. J. Agric. Econ. 2005, 87, 984–994. [Google Scholar] [CrossRef]
- Gołaś, Z. Wydajność i dochodowość pracy w rolnictwie w świetle rachunków ekonomicznych dla rolnictwa. (Productivity and Profitability of Labour in Agriculture in the Light of the Economic Accounts for Agriculture). Zagadnienia Ekon. Rolnej 2010, 3, 19–42. [Google Scholar]
- Strzelecka, A.; Kurdyś-Kujawska, A.; Zawadzka, D. Kapitał obcy a potencjał wytwórczy i wyniki produkcyjno-ekonomiczne towarowych gospodarstw rolnych. (Debt versus production potential as well as production and economic results of commodity farms). Zesz. Nauk. Szkoły Głównej Gospod. Wiej. Warszawie. Probl. Rol. Światowego 2019, 19, 110–119. [Google Scholar] [CrossRef] [Green Version]
- Wieliczko, B.; Kurdyś-Kujawska, A.; Sompolska-Rzechuła, A. Savings of Small Farms: Their Magnitude, Determinants and Role in Sustainable Development. Example of Poland. Agriculture 2020, 10, 525. [Google Scholar] [CrossRef]
- Runowski, H. Ekonomika rolnictwa—przemiany w gospodarstwach rolnych. (Economics of agriculture—Changes in farms). In Rolnictwo, Gospodarka żywnościowa, obszarywiejskie—10 lat w Unii Europejskiej; Drejerska, N., Ed.; Agriculture, food economy, rural areas—10 years in the European Union; SGGW: Warszawa, Poland, 2014. [Google Scholar]
- Kurdyś-Kujawska, A.; Sompolska-Rzechuła, A. Public support for agriculture of EU countries under the CAP. Scale, dynamics and trends of changes. In Subsidies versus Economics, Finance and Income of Farms (4); Monographs of Multi-annual Programme 2015–2019, 77.1; Soliwoda, M., Ed.; IAFE-NRI: Warsaw, Poland, 2018. [Google Scholar]
- Wieliczko, B.; Sompolska-Rzechuła, A.; Kurdyś-Kujawska, A. Determinants of the Use of Subsidies for the Development of Rural Areas by Small Agricultural Holdings: Case of Poland. In Proceedings of the 2019 International Conference Economic Science For Rural Development, Jelgava, Latvia, 9–10 May 2018; p. 50. [Google Scholar]
- Zawadzka, D.; Strzelecka, A.; Szafraniec-Siluta, E. Ukierunkowanie produkcji gospodarstwa rolnego a zdolność do samofinansowania nakładów inwestycyjnych—ujęcie porównawcze. (The type of farm’s production and the ability to self-finance of investments—A comparative approach). J. Manag. Financ. 2014, 12, 289–305. [Google Scholar]
- Belay, A.; Recha, J.W.; Woldeamanuel, T.; Morton, J.F. Small holder farmers’ adaptation to climate change and determinants of their adaptation decisions in the Central Rift Valley of Ethiopia. Agric. Food Secur. 2017, 6, 1–13. [Google Scholar] [CrossRef] [Green Version]
- Carter, M.R.; Cheng, L.; Sarris, A. Where and how index insurance can boost the adoption of improved agricultural technologies. J. Dev. Econ. 2016, 118, 59–71. [Google Scholar] [CrossRef]
- Ellis, F. Household strategies and rural livelihood diversification. J. Dev. Stud. 1998, 35, 1–38. [Google Scholar] [CrossRef]
- Wan, J.; Li, R.; Wang, W.; Liu, Z.; Chen, B. Income Diversification: A Strategy for Rural Region Risk Management. Sustainability 2016, 8, 1064. [Google Scholar] [CrossRef] [Green Version]
- Asfaw, S.; Scognamillo, A.; DiCaprera, G.; Sitko, N.; Ignaciuk, A. Heterogenous impact of livelihood diversification on household welfare: Cross-country evidence from Sub-Saharan Africa. World Dev. 2019, 117, 278–295. [Google Scholar] [CrossRef]
- McCord, P.F.; Cox, M.; Schmitt-Harsh, M.; Evans, T. Crop diversification as a livelihood strategy within semi-arid agricultural systems near Mount Kenya Land. Use Policy 2015, 42, 738–750. [Google Scholar] [CrossRef]
- Bellon, M.R.; Kotu, B.H.; Azzarri, C.; Caracciolo, F. To diversify or not to diversify, that is the question. Pursuing agricultural development for smallholder farmers in marginal areas of Ghana. World Dev. 2020, 125, 104682. [Google Scholar] [CrossRef] [PubMed]
- DiFalco, S.; Chavas, J.P. On crop biodiversity, risk exposure, and food security in the High lands of Ethiopia. Am. J. Agric. Econ. 2009, 91, 599–611. [Google Scholar] [CrossRef] [Green Version]
- Kawa, N.C.; Clavijo-Michelangeli, J.A.; Clement, C.R. Household agrobiodiversity management on Amazonian Dark Earths, Oxisols, and Floodplain soils on the lower Madeira River, Brazil. Braz. Hum. Ecol. 2015, 43, 339–353. [Google Scholar] [CrossRef]
- Guido, Z.; Zimmer, A.; Lopus, S.; Hannah, C.; Gower, D.; Waldman, K.; Krell, N.; Sheffield, J.; Caylor, K.; Evans, T. Farmer forecasts: Impact soft seasonal rainfall expectations on agricultural decision making in Sub-Saharan Africa. Clim. Risk Manag. 2020, 30, 100247. [Google Scholar] [CrossRef]
- Ahmadzai, H. Crop Diversification and Technical Efficiency in Afghanistan: Stochastic Frontier Analysis; CREDIT Research Paper, No. 17/04; The University of Nottingham, Centre for Research in Economic Development and International Trade (CREDIT): Nottingham, UK, 2017. [Google Scholar]
- European Union. Assessing How Policies Enable or Constrain the Resilience of Farming System in the European Union: Case Study Results. 2019. Available online: https://www.eca.europa.eu/ (accessed on 25 May 2020).
- Giampietri, E.; Trestini, S.; Boatto, V. Toward the implementation of the Income Stabilization Tool: An analysis of factors affecting the probability of farm income losses in Italy. New Medit 2017, 16, 24–30. [Google Scholar]
Figure 1.
Distribution of the crop diversification index. Source: the authors’ own analysis based on FADN data.
Figure 1.
Distribution of the crop diversification index. Source: the authors’ own analysis based on FADN data.

Figure 2.
Regional differentiation of the cultivation diversification index (HHI) of small farms in Poland. Source: the authors’ own analysis based on FADN data.
Figure 2.
Regional differentiation of the cultivation diversification index (HHI) of small farms in Poland. Source: the authors’ own analysis based on FADN data.

Figure 3.
The ROC curve for the model.


Table 1.
Set of variables adopted to determine the factors determining diversification in small farms.
Table 1.
Set of variables adopted to determine the factors determining diversification in small farms.
| Variables | Category | Expected Impact of the Variable |
|---|---|---|
| age (years) | +/− | |
| farmer’s education level: 0—primary education, vocational education | +/− | |
| 1—secondary education, tertiary education | ||
| farmer’s education: 0—nonagricultural | +/− | |
| 1—agricultural | ||
| size of the family (number) | + | |
| number of family members working on the farm | + | |
| utilized agricultural area (UAA) (ha) | + | |
| share of leased land in total UAA (%) | + | |
| soil valuation index | − | |
| value of non-current assets (PLN ‘000) | − | |
| access to credits (1—yes; 0—no) | + | |
| gross value added (PLN ‘000/ha) | − | |
| income from non-agricultural activities: | − | |
| 0—primary education | ||
| 1—nonagricultural basic vocational education | ||
| cash flows from operating activities (PLN ‘000/ha) | + | |
| labor profitability (PLN ‘000/AWU) | - | |
| land productivity (PLN ‘000/ha) | - | |
| the level of exposure to atmospheric and agricultural drought [based on data IMWM-NRI] (1—yes; 0—no) | + | |
| location in the hardiness zone [according to USDA zone] (number: 1—low chance of frost; ...; 4—greatest chance of frost) | + |
Table 2.
Diagnostic variables included in the study of economic results of small farms.
| Variables | Category |
|---|---|
| Productivity and Profitability of the Land | |
| Land productivity [PLN ‘000/ha] | The variable defining the productivity will change the agricultural use. The index level was established as the relation of the total production produced by an agricultural holding to the area of agricultural land. |
| Land profitability [PLN ‘000/ha] | Variable specifying profitability of agricultural land. The indicator was calculated as the relation of the family farm income to the arable land area. |
| Gross farm income [PLN ‘000] | Includes total production less intermediate consumption and adjusted for the balance of subsidies and taxes related to operating activities. |
| Work Efficiency and Profitability | |
| Total labor profitability [PLN ‘000/AWU] | The variable defining the total profitability of work. The level of the indicator was established as the relation of the net value added to the number of full-time employees. |
| Own labor profitability [PLN/h] | The variable determining the profitability of own work. The level of the indicator was established as the relation of the family farm income to the working time as part of the operating activities of unpaid persons (mainly family members). |
| Asset Financing Sources | |
| Total liabilities [PLN ‘000] | The value of all outstanding debt obligations and short-term. |
| Farm net income [PLN ‘000] | The fee for the involvement of own factors of production in the operational activity of the farm and the fee for the risk taken by the farm operator in the accounting year. |
| Total subsidies—excluding on investments [PLN ‘000] | Value of operating subsidies less investment subsidies. |
| Total support for rural development [PLN ‘000] | Value of agri-environmental subsidies, subsidies to areas with unfavorable conditions for agricultural production and other subsidies for rural development. |
| Financial Indicators | |
| Return on assets [%] | The variable describing the profitability of total assets. The level of the index was established as the relation of the family farm income (reduced by own labor costs) to the average total assets. |
| Return on equity [%] | This ratio allows to assess the effectiveness of using equity in the enterprise. The level of the index was established as the relation of the family farm income (less own labor costs) to the average equity. |
| Total assets debt ratio [%] | The variable specifying the share of all liabilities in financing the property. It provides the most general picture of the financing structure of an agricultural holding’s assets. The ratio was set as the ratio of total liabilities to the average total assets. A low level of the ratio indicates financial independence, while a high level indicates excessive credit risk. |
| Cash flow (1) [PLN ‘000] | They show the ability of an agricultural holding to self-finance its activities and create savings within operating activities. Cash flow is the sum of products sold, other income, sales of animals less o the cost of purchasing animals, the balance of subsidies and taxes relating to operating activities and the balance of subsidies and taxes relating to investments. |
| Gross investments [PLN ‘000] | Value of purchased and produced commodity assets, less the value of fixed assets sold and transferred free of charge in the accounting year + change in the value of the livestock. |
Table 3.
Economic results of small farms due to crop diversification.
| Specification | Median | Min | Max | Lower Quartile | Upper Quartile | Gap | SD | CV [%] |
|---|---|---|---|---|---|---|---|---|
| Productivity and profitability of the land | ||||||||
| Land productivity [PLN/ha] | ||||||||
| F_CD | 5320 | 360 | 70,090 | 3620 | 8220 | 69,720 | 6610 | 92.61 |
| F_N_CD | 7640 | −250 | 810,900 | 4050 | 16,290 | 811,150 | 6360 | 271.69 |
| Land profitability [PLN/ha] | ||||||||
| F_CD | 1000 | −5730 | 111,680 | −40 | 2590 | 117,410 | 7600 | 316.83 |
| F_N_CD | 2250 | −179,700 | 1,078,070 | 300,630 | 6680 | 1,257,780 | 71,330 | 451.59 |
| Gross farm income [PLN] | ||||||||
| F_CD | 2740 | 50 | 119,800 | 1630 | 4640 | 119,750 | 8310 | 179.87 |
| F_N_CD | 4830 | 30 | 3,398,460 | 2370 | 11,620 | 3,398,450 | 146,120 | 477.12 |
| Profitability of labor | ||||||||
| Total labor profitability [PLN/AWU] | ||||||||
| F_CD | 6350 | −39,690 | 124,520 | 130 | 17,360 | 164,210 | 20,750 | 183.66 |
| F_N_CD | 14,830 | −132,990 | 1,585,450 | 3810 | 35,500 | 1,718,440 | 78,540 | 255.63 |
| Own labor profitability [PLN/h] | ||||||||
| F_CD | 2630 | −18,430 | 58,480 | −90 | 7280 | 76,920 | 9400 | 198.09 |
| F_N_CD | 5690 | −74,040 | 344,730 | 760 | 13,590 | 418,770 | 26,090 | 231.61 |
| Income and sources of financing the property | ||||||||
| Total liabilities [PLN] | ||||||||
| F_CD | 0 | 0 | 338,000 | 0 | 0 | 338,000 | 20,580 | 534.04 |
| F_N_CD | 0 | 0 | 5,129,920 | 0 | 0 | 5,129,920 | 270,930 | 704.22 |
| Farm net income [PLN] | ||||||||
| F_CD | 7940 | −40,070 | 179,170 | −310 | 19,090 | 219,240 | 25,240 | 196.59 |
| F_N_CD | 15,500 | −416,120 | 1,823,860 | 2220 | 41,160 | 2,239,980 | 102,880 | 269.82 |
| Total subsidies - excluding on investments [PLN] | ||||||||
| F_CD | 9940 | 0 | 111,160 | 7420 | 12,810 | 111,160 | 8900 | 80.64 |
| F_N_CD | 8430 | 0 | 97,460 | 5590 | 11,980 | 97,460 | 9370 | 94.76 |
| Total support for rural development [PLN] | ||||||||
| F_CD | 1120 | 0 | 100,000 | 0 | 1710 | 100,00 | 7460 | 365.63 |
| F_N_CD | 370 | 0 | 81,580 | 0 | 1580 | 81,580 | 7060 | 387.86 |
| Financial indicators | ||||||||
| Return on assets [%] | ||||||||
| F_CD | −9.94 | −62.21 | 48.04 | −16.27 | −5.94 | 110.25 | 10.48 | 91.95 |
| F_N_CD | −7.09 | −91.59 | 93.38 | −14.00 | −1.54 | 184.97 | 14.56 | 199.39 |
| Return on equity [%] | ||||||||
| F_CD | −10.03 | −62.21 | 57.56 | −16.35 | −5.94 | 119.77 | 10.66 | 92.90 |
| F_N_CD | −7.26 | −91.59 | 475.66 | −14.19 | −1.55 | 567.25 | 21.33 | 315.21 |
| Total assets debt ratio [%] | ||||||||
| F_CD | 0.00 | 0.00 | 68.67 | 0.00 | 0.00 | 68.78 | 4.55 | 632.76 |
| F_N_CD | 0.00 | 0.00 | 95.72 | 0.00 | 0.00 | 95.72 | 8.13 | 400.94 |
| Cash flow (1) [PLN] | ||||||||
| F_CD | 17,260 | −39,530 | 174,410 | 8690 | 30,220 | 213,940 | 25,660 | 108.82 |
| F_N_CD | 27,320 | −88,200 | 1,922,020 | 13,440 | 58,880 | 2,010,230 | 114,950 | 196.24 |
| Gross investments [PLN] | ||||||||
| F_CD | −223,830 | 579,000 | −330 | 6500 | 802,830 | 34,880 | 342,550 | −223.83 |
| F_N_CD | −320,000 | 2,206,510 | 0 | 9890 | 2,526,510 | 106,880 | 585,500 | −320.00 |
Note: F_CD—farms diversifying crops; F_N_CD—agricultural holdings without crop diversification. Source: the authors’ own analysis based on FADN data.
Table 4.
Evaluation of logit model parameters.
| Variable | Variable Name | Parameter Evaluation | p-Value | Odds Ratio |
|---|---|---|---|---|
| Constant | 0.3213 | 0.0083 | - | |
| value of fixed assets | −0.0008 | 0.0006 | 0.9992 | |
| the level of exposure to atmospheric and agricultural drought | 0.5593 | 0.0001 | 0.5716 | |
| location in the hardiness zone | 1.1891 | 0.0001 | 0.3045 |
Source: the authors’ own analysis based on FADN data.
Table 5.
Accuracy of classification of the logit model.
| Qualification of Small Farms Based on the Logit Model | Actual Affiliation | Overall Validity of the Classification | |
|---|---|---|---|
| 72 | 85 | 64.89% | |
| 481 | 974 | ||
| Sensitivity, specificity | 13.02% | 91.97% | |
Source: the authors’ own analysis based on FADN data.
Table 6.
The degree of fit of the logistic model to empirical data.
| Hosmer-Lemenshow Test | Area Under the ROC Curve | ||
|---|---|---|---|
| 64.89% | x2 | p | 67.01% |
| 11.99 | 0.152 | ||
Source: the authors’ own analysis based on FADN data.
Publisher’s Note: MDPI stays neutral with regard to jurisdictional claims in published maps and institutional affiliations. |
© 2021 by the authors. Licensee MDPI, Basel, Switzerland. This article is an open access article distributed under the terms and conditions of the Creative Commons Attribution (CC BY) license (http://creativecommons.org/licenses/by/4.0/).
Share and Cite
MDPI and ACS Style
Kurdyś-Kujawska, A.; Strzelecka, A.; Zawadzka, D. The Impact of Crop Diversification on the Economic Efficiency of Small Farms in Poland. Agriculture 2021, 11, 250. https://0-doi-org.brum.beds.ac.uk/10.3390/agriculture11030250
AMA Style
Kurdyś-Kujawska A, Strzelecka A, Zawadzka D. The Impact of Crop Diversification on the Economic Efficiency of Small Farms in Poland. Agriculture. 2021; 11(3):250. https://0-doi-org.brum.beds.ac.uk/10.3390/agriculture11030250
Chicago/Turabian StyleKurdyś-Kujawska, Agnieszka, Agnieszka Strzelecka, and Danuta Zawadzka. 2021. "The Impact of Crop Diversification on the Economic Efficiency of Small Farms in Poland" Agriculture 11, no. 3: 250. https://0-doi-org.brum.beds.ac.uk/10.3390/agriculture11030250
Note that from the first issue of 2016, this journal uses article numbers instead of page numbers. See further details here.