Article

Detection of Oil Palm Disease in Plantations in Krabi Province, Thailand with High Spatial Resolution Satellite Imagery

by
Rachane Malinee
1,
Dimitris Stratoulias
2,3 and
Narissara Nuthammachot
1,*
1
Faculty of Environmental Management, Prince of Songkla University (PSU), Songkhla 90110, Thailand
2
Informetrics Research Group, Ton Duc Thang University, Ho Chi Minh City 758307, Vietnam
3
Faculty of Applied Sciences, Ton Duc Thang University, Ho Chi Minh City 758307, Vietnam
*
Author to whom correspondence should be addressed.
Submission received: 18 February 2021 / Revised: 13 March 2021 / Accepted: 14 March 2021 / Published: 16 March 2021

Abstract

:
Oil palm (Elaeis guineensis) trees are an important contributor of recent economic development in Southeast Asia. The high product yield, and the consequent high profitability, has led to a widespread expansion of plantations in the greater region. However, oil palms are susceptible to diseases that can have a detrimental effect. In this study we use hyper- and multi-spectral remote sensing to detect diseased oil palm trees in Krabi province, Thailand. Proximate spectroscopic measurements were used to identify and discern differences in leaf spectral radiance; the results indicate a relatively higher radiance in visible and near-infrared for the healthy leaves in comparison to the diseased. From a total of 113 samples for which the geolocation and the hyperspectral radiance were recorded, 59 and 54 samples were healthy and diseased oil palm trees, respectively. Moreover, a WorldView-2 satellite image was used to investigate the usability of traditional vegetation indices and subsequently detecting diseased oil palm trees. The results show that the overall maximum likelihood classification accuracy is 85.98%, the Kappa coefficient 0.71 and the producer’s accuracy for healthy and diseased oil palm trees 83.33 and 78.95, respectively. We conclude that high spatial and spectral resolutions can play a vital role in monitoring diseases in oil palm plantations.

1. Introduction

Oil palm (Elaeis Guineensis Jacq.) is a plant species suitable for growth in the tropical climate of South-East Asia and especially for the regions of southern Thailand, Malaysia and Indonesia. They are plants that yield the highest produce per unit area when compared to other cultivated oil crops [1]. They provide palm oil as the main byproduct [2], a commodity that is valued over USD 50 billion annually [3], for edible consumption or energy production [4]. However, oil palm trees are susceptible to diseases such as the Ganoderma boninense (G. boninense) [5], and there are no efficient methods to manage such infections without extensive use of chemicals, damage in the produce and consequent economic losses [6,7,8]. The underlying causes of the disease may vary and can be related to soil conditions (namely temperature and shading as described in [9]), preternatural changes in weather [10] or even climate change [11].
In the context of disease manifestation, one major disease affecting the health of oil palm plants is the basal stem rot (BSR), a fungal disease that occurs in oil palms in Southeast Asia and an early detection of G. boninense infection. G. boninense infection symptoms can be identified in the field by observing the condition of the fronds and trunk. Commonly, BSR disease symptoms manifest in the leaves of oil palm trees and include more than two of the youngest leaves not opening and necrosis of older leaves [12], the chlorosis of the leaves from below and the appearance of yellow and green spots on the top of the leaves. These symptoms are not homogeneous throughout the vertical structure of the tree as the photophysiology of the leaves, and consequently the exhibition in the hyperspectral reflectance, depends on the amount of available solar radiation [13]. Other symptoms include the chlorosis of leaves that have not unfolded yet and sometimes rot at the apex, later on the slow growth of the tree and the beginning of rot of the roots and the stem. There is currently no effective treatment other than relief actions which only extends the life of the tree [14]. In the current study, we focused on detecting diseases (such as curvularia seedling blight, crown disease, helminthosporium leaf spot, sudden wilt) in the leaves of oil palm trees that manifest in the early stages of the disease. This is the basis for identifying symptoms and classifying the severity of diseases of the oil palm and other plants in the future with remote sensing.
Remote sensing has proven a valuable tool for detecting diseases and assessing damage severity while precision agriculture is a technology with specific demands and challenges for the diagnosis and detection of crop diseases. Therefore, there is a need to develop non-destructive management methods in which plant disease detection is automated for site-specific control. The method of detection must be rapid and cover a large geographical area, which are prerequisites satisfied by remote sensing. Generally, crop diseases cause certain changes in the spectral reflection of plants. Therefore, spectral differences between healthy and diseased plants can be captured from remote sensors which quantify the solar light reflected from terrestrial objects. Various types of sensors can measure the amount of reflected solar radiation from low to high spatial resolution, multispectral to hyperspectral and ground-based to aircraft or even satellite-based sensors.
Several studies have been compiled that typically employed hyperspectral and multispectral remote sensing data for the discrimination between healthy and diseased oil palm trees. For instance, ref. [15] used leaf spectroscopy to detect infected oil palm trees while [16] in a study using airborne-derived hyperspectral indices to detect diseased oil palms, obtained a classification accuracy of 86%. A few other studies have used hyperspectral data in the context of oil palm disease detection, such as [17] who used canopy hyperspectral measurements and report a 98% confidence level in discriminating healthy from ill trees and [18]) who used a k-nearest neighbour model on hyperspectral data on the visible and near infrared (NIR) domain (325–1075 nm) to predict the disease with a high average overall classification accuracy of 97%. Refs. [19,20] concluded that hyperspectral techniques can offer significant potential in such applications and especially in agriculture and vegetation monitoring. Multispectral satellite data have also been used in this context, with notable examples those of [14,21] who used, in both cases, Quickbird satellite images to detect BSR disease on oil palms from satellite data. Last but not least, ref. [22] used WorldView-3 imagery and machine learning to classify the severity of BSR disease symptoms in four classes; as a solution, they proposed a methodology based on thresholding the reflectance values of band 4 of the WorldView-3 satellite.
Another popular technique used in identifying plant diseases in remote sensing is the construction of vegetation indices from hyperspectral or multispectral data [23,24,25]. Typically, popular vegetation indices are used to assess vegetation traits in agriculture and forestry [25,26]. Most of the indices require information from the visible and NIR spectral region. For instance, ref. [21] researched the detection of oil palm contamination causing BSR and found low reflectivity in the NIR and higher reflectivity in the visible regions. Ref. [27], in a study detecting oil palm trees with high spatial resolution images, found that the Normalized Difference Index (NDI) yielded the highest metric compared to other vegetation indices. The accuracy was approximately 90 percent detection rate when compared with manual labeling. Nevertheless, the most popular vegetation indices are the Normalized Difference Vegetation Index (NDVI) and the Normalized Difference Red Edge (NDRE). Other frequently encountered indices in the literature are the Green Blue Normalized Difference Vegetation Index (GBNDVI), Simple Ratio (SR), Green Normalized Difference Vegetation index (GNDVI), Soil Adjusted Vegetation Index (SAVI) and Atmospherically Resistant Vegetation Index (ARVI). Once the vegetation index is constructed, it can be used as an individual layer of information combining the data of several spectral bands, which most often are the visible and NIR for the vegetation related applications. This is especially useful in analyzing multiband data, as an alternative to considering isolated bands or resorting to data reduction techniques such as Principal Component Analysis (PCA).
The current study focuses on the detection of plant diseases in oil palms based on high spatial resolution WorldView-2 satellite imagery and proximate spectroscopic data. A field survey was conducted to identify oil palms infected by the disease and judged against remotely sensed data. We investigated the usability of the vegetation indices by demonstrating the discriminatory power between diseased and healthy oil palm trees. The results from the current research can be useful for providing information to agriculturists when evaluating the damage caused by the disease in oil palms and develop a geolocation-based monitoring system of infection.

2. Materials and Methods
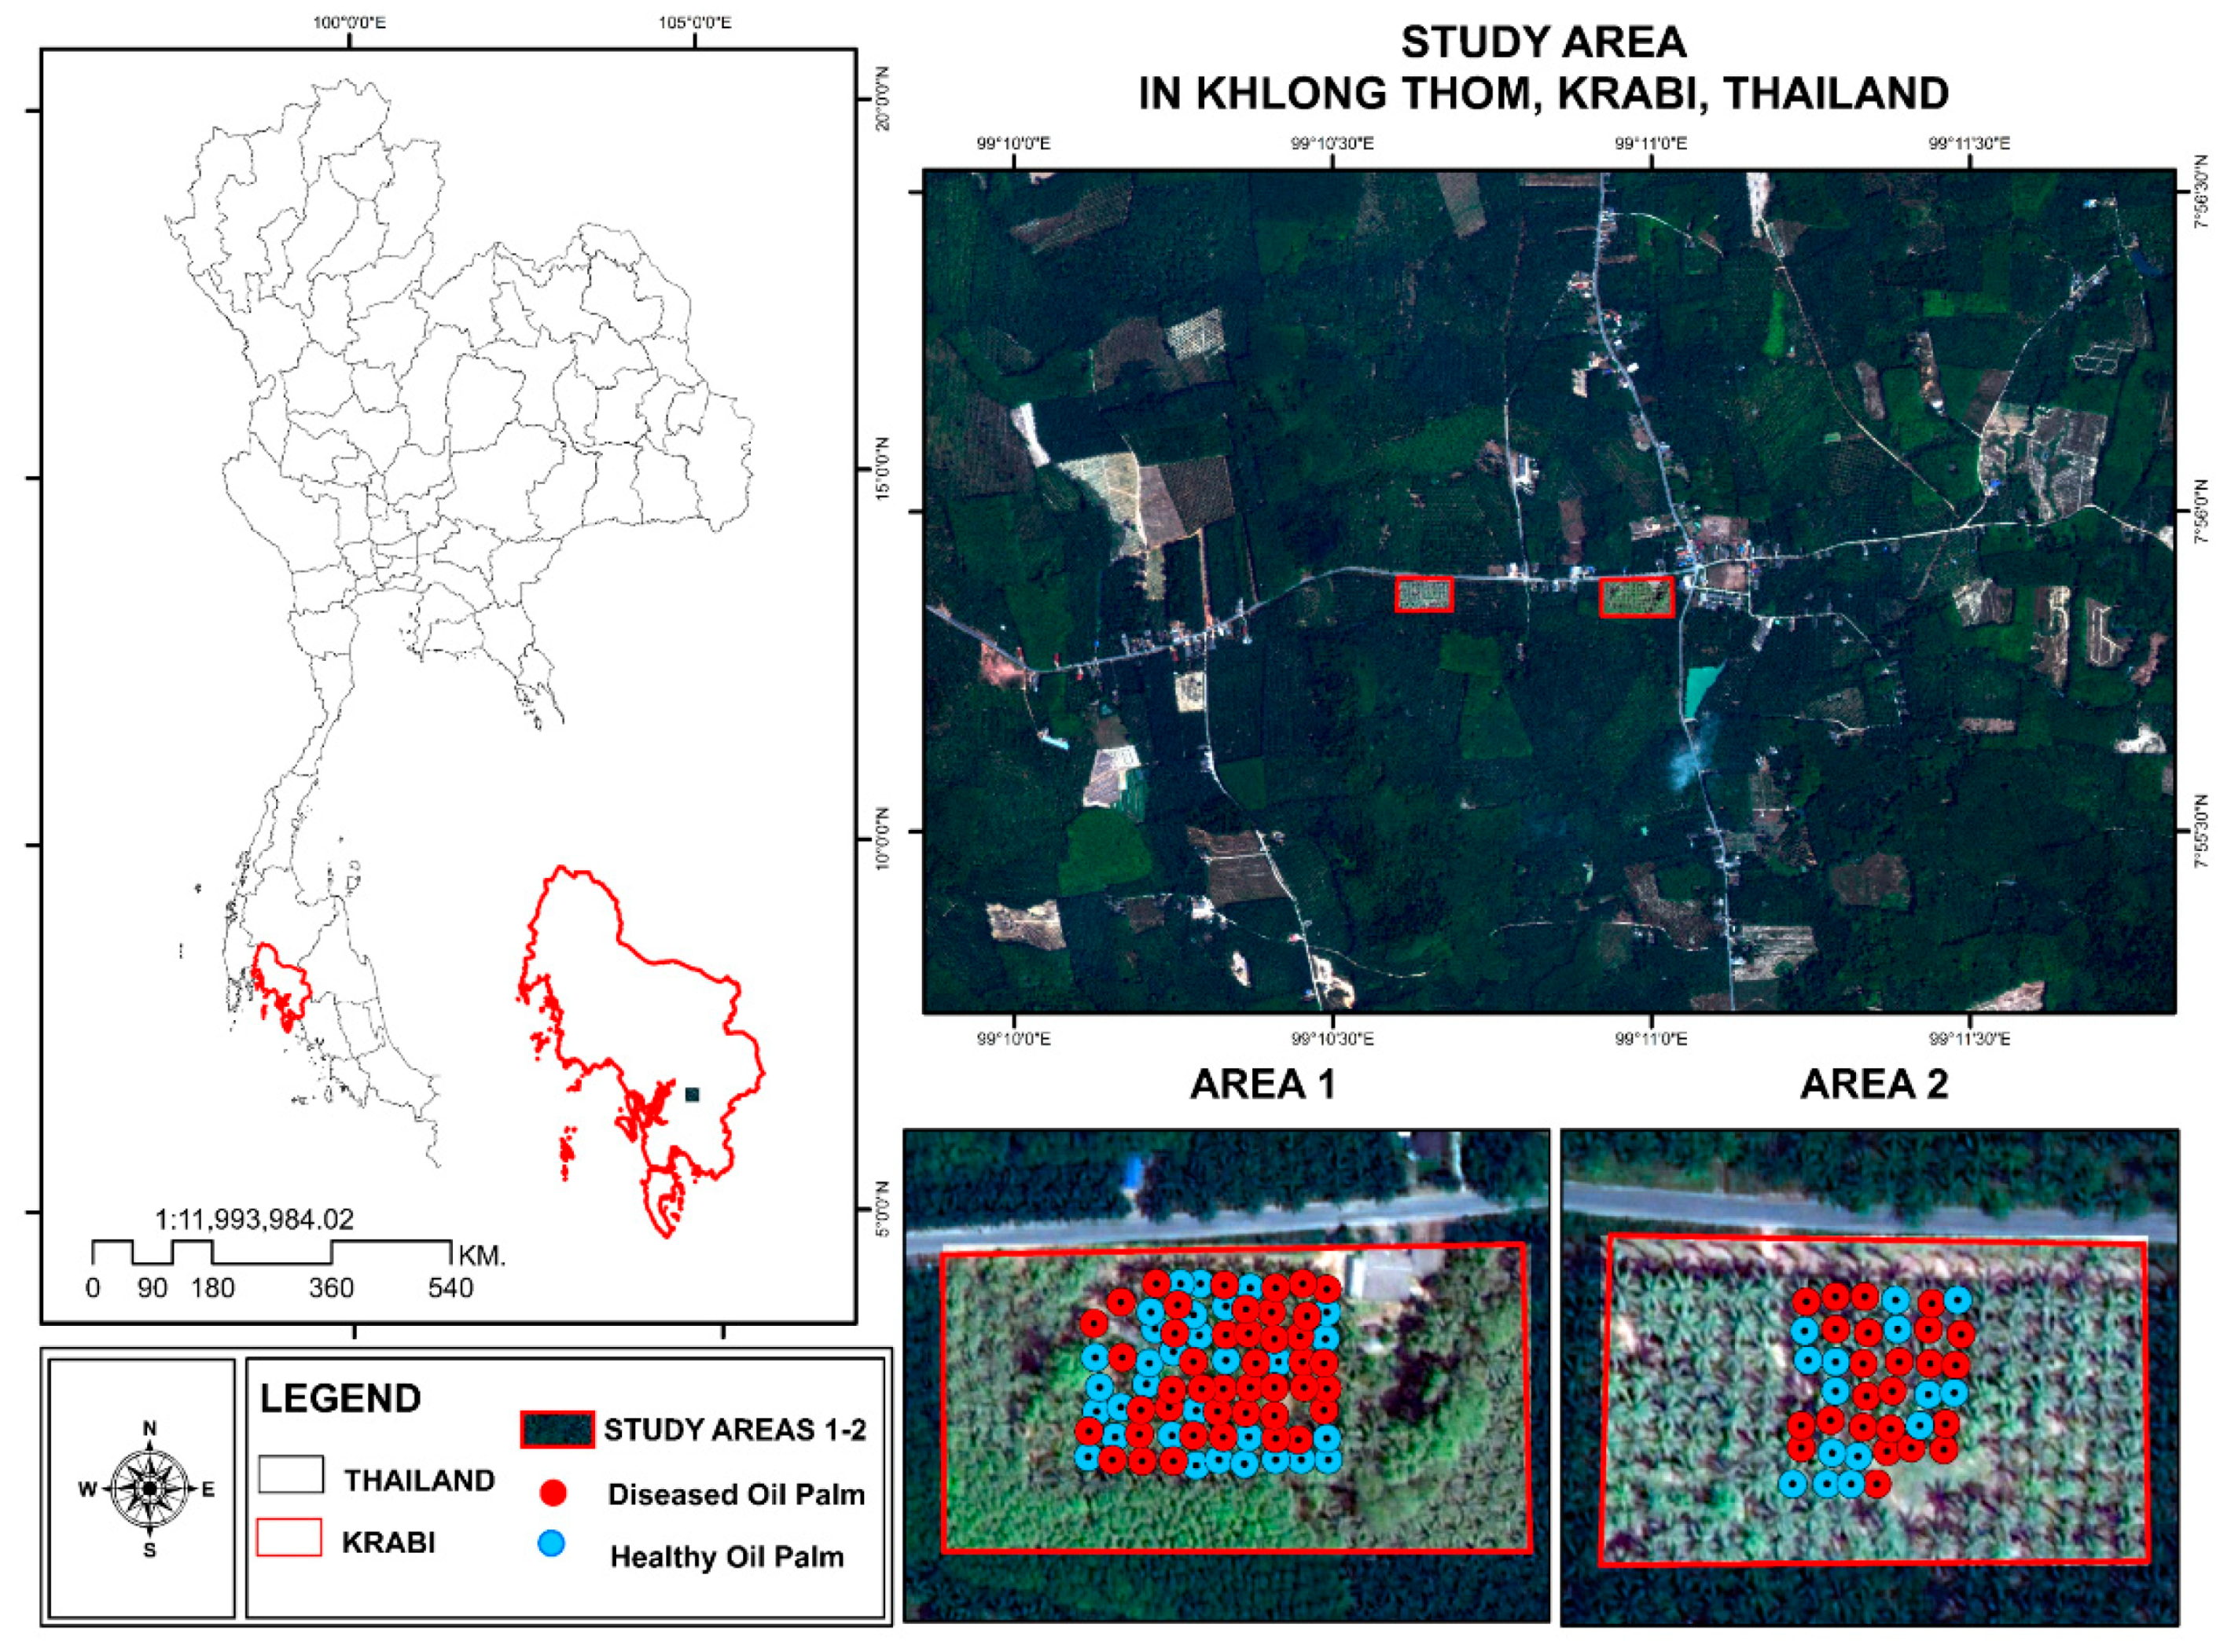
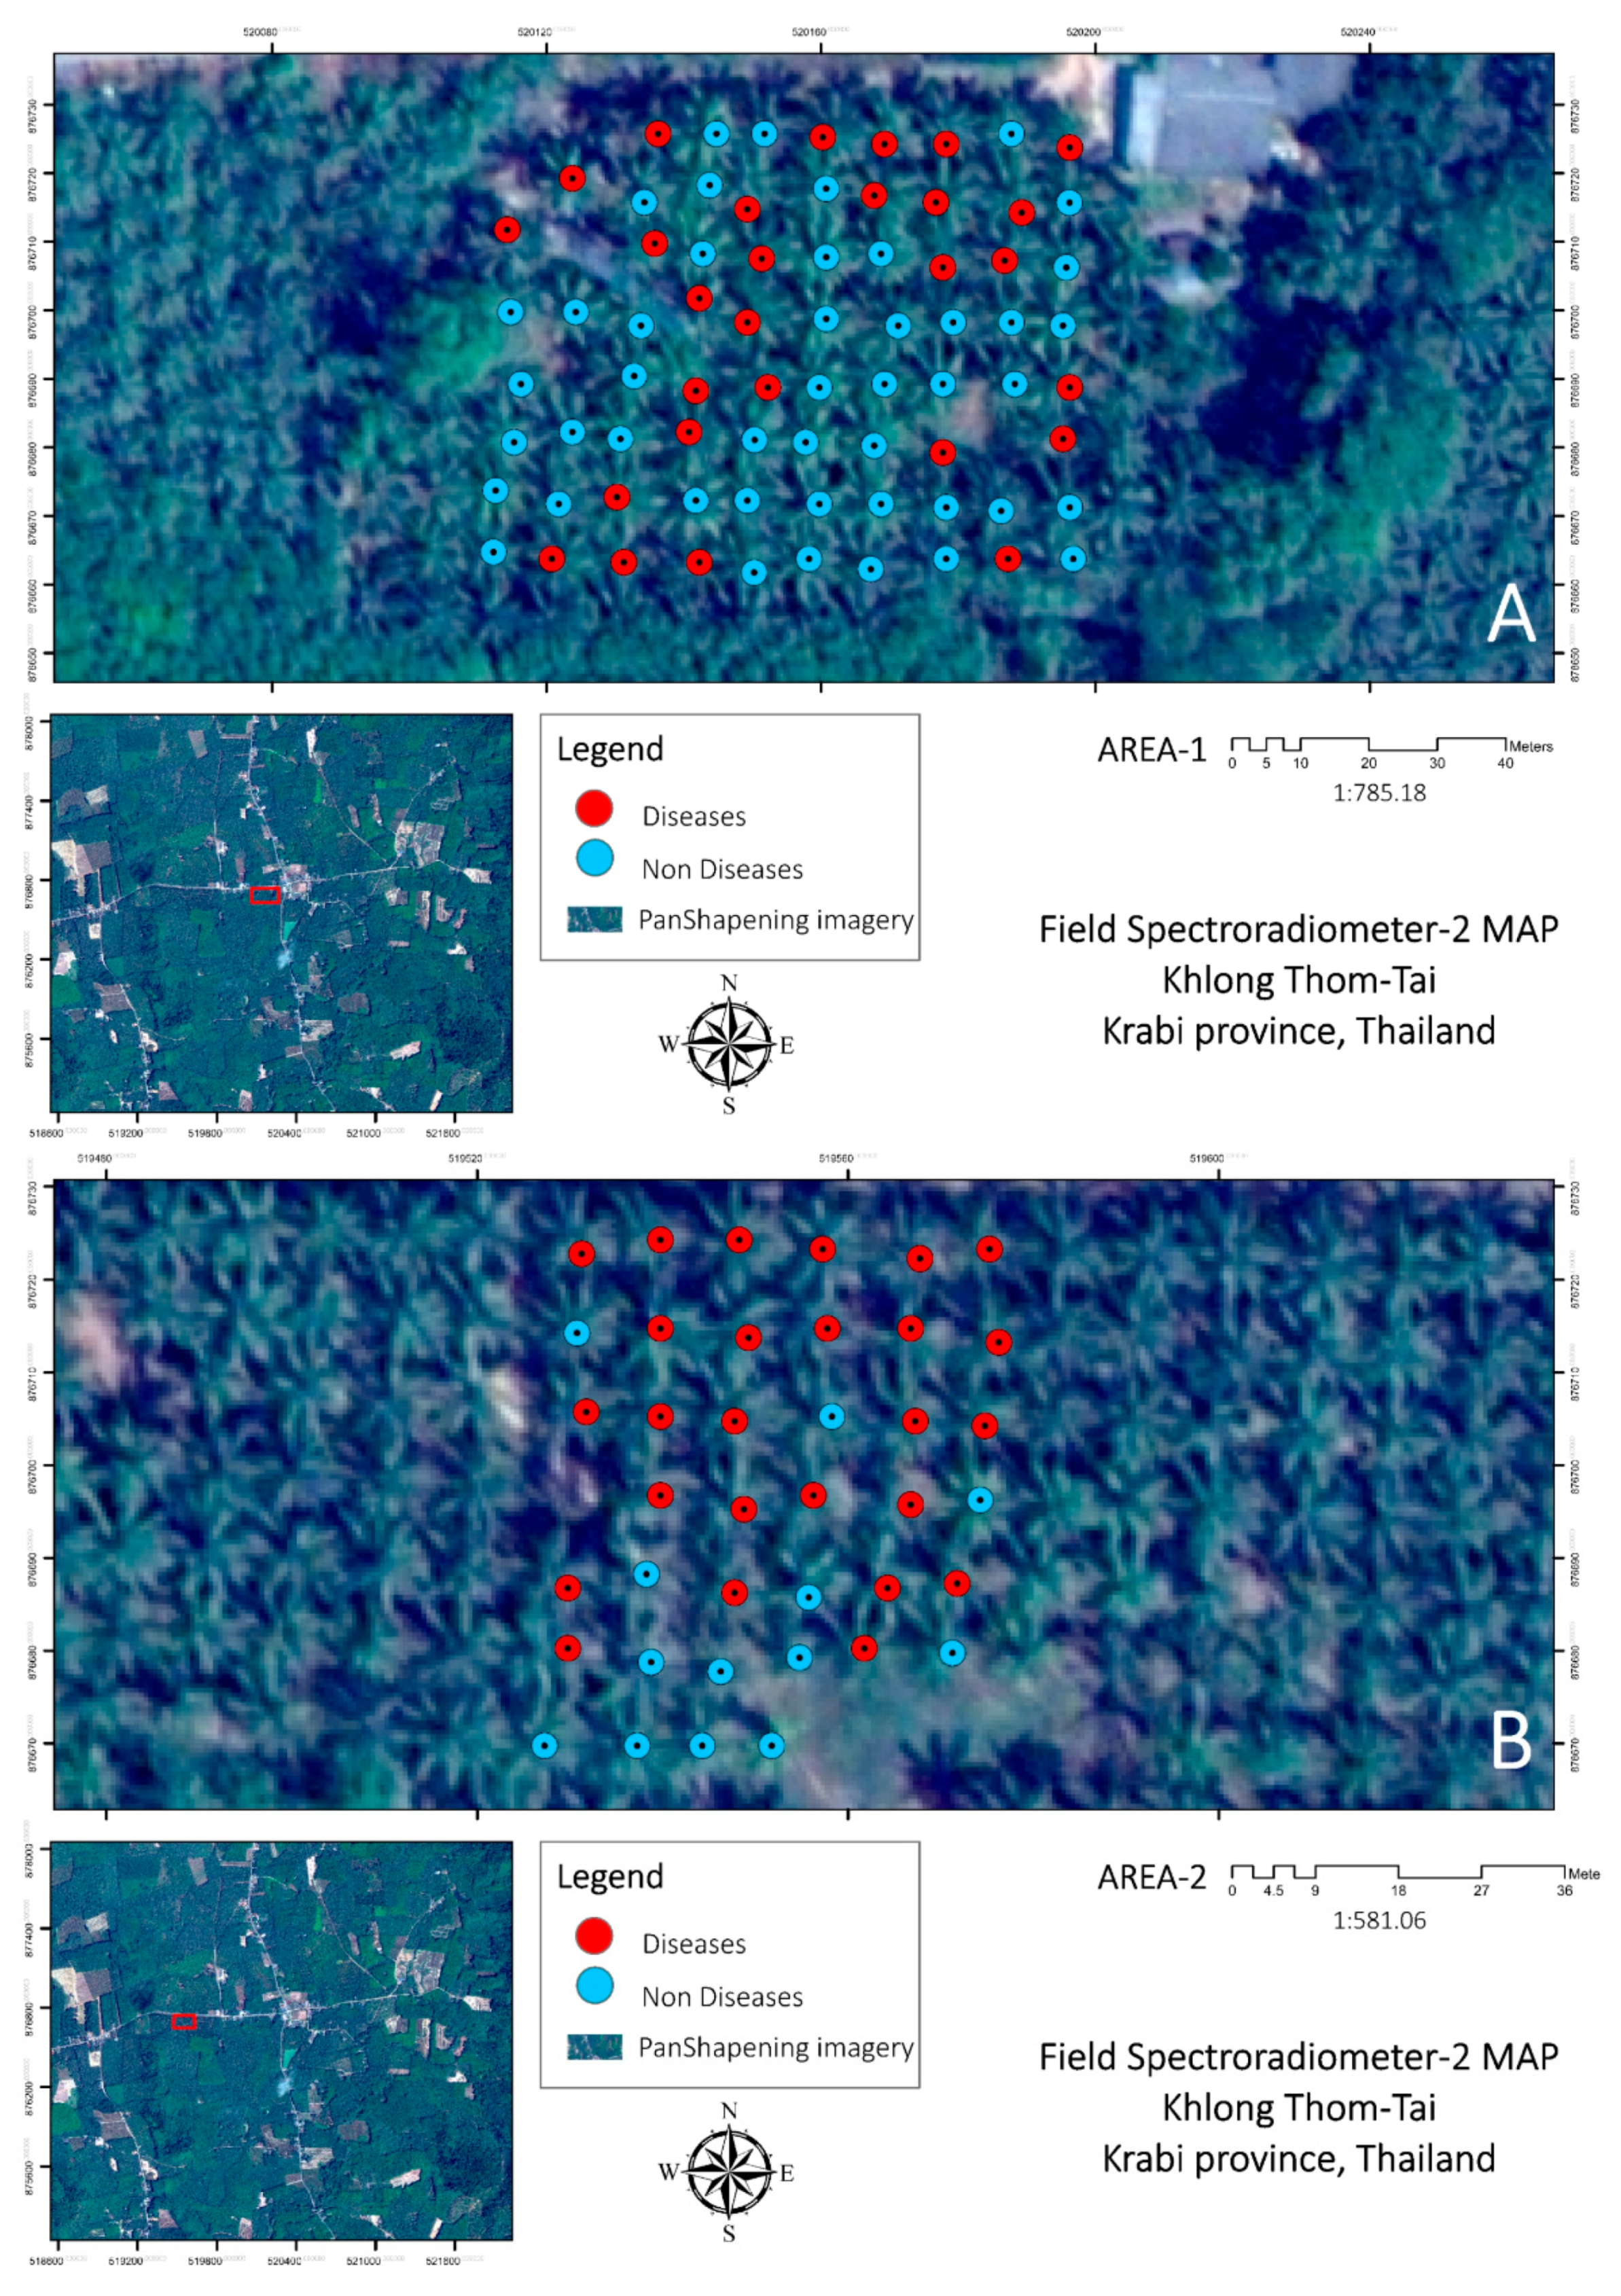
2.1. Study Area

The study area is situated in Khlong Thom-Tai, Krabi province, Thailand and located between the geographical coordinates 7.954347° W and 99.160417° N (northwest corner) and 7.909062° W and 99.205856° N (southeast corner) as depicted in Figure 1. The climate of southern Thailand is characterized by a rainy season (May–January). The average annual temperature is approximately 26.8° Celsius and the average annual rainfall is 1622 mm; these conditions are suitable for oil palm [28], which is the dominant plantation in the greater area. Oil palms prefer a wet climate with consistent rainfall throughout the year, high humidity, optimum temperature between 25° to 28° Celsius, sufficient amount of sunlight and relative humidity of the air of at least 75 percent [28,29].

2.2. Satellite Imagery
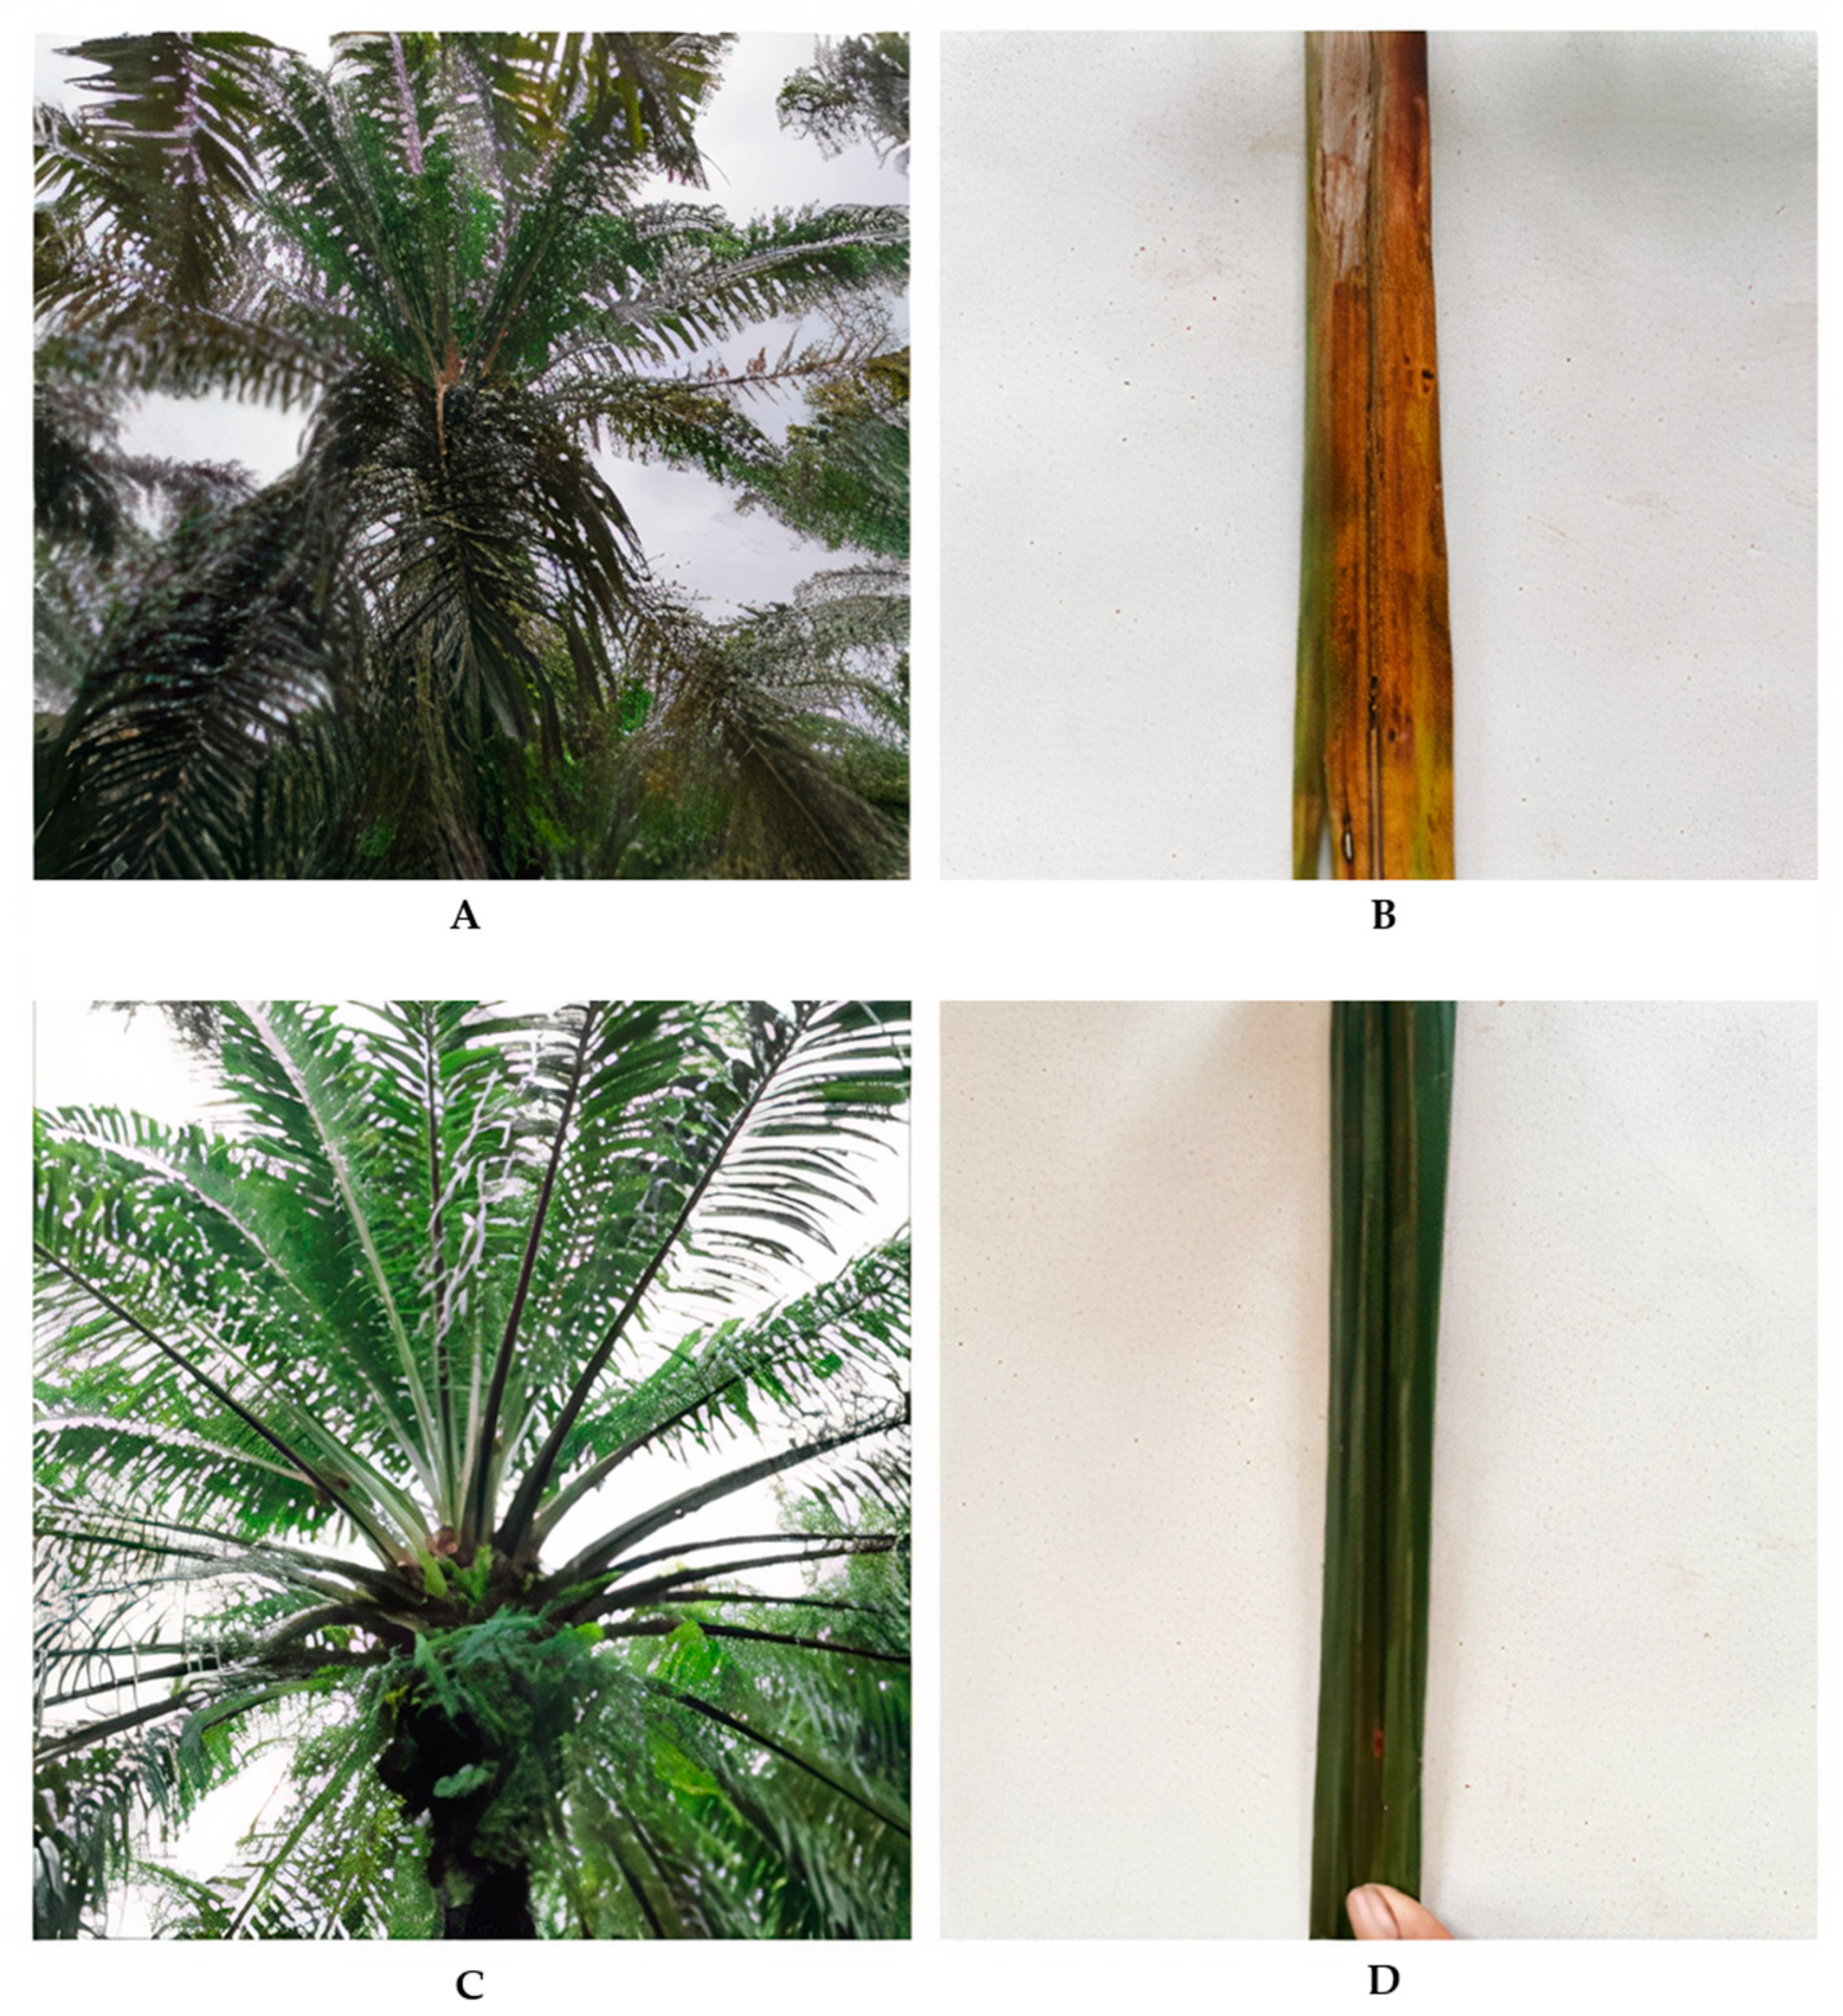
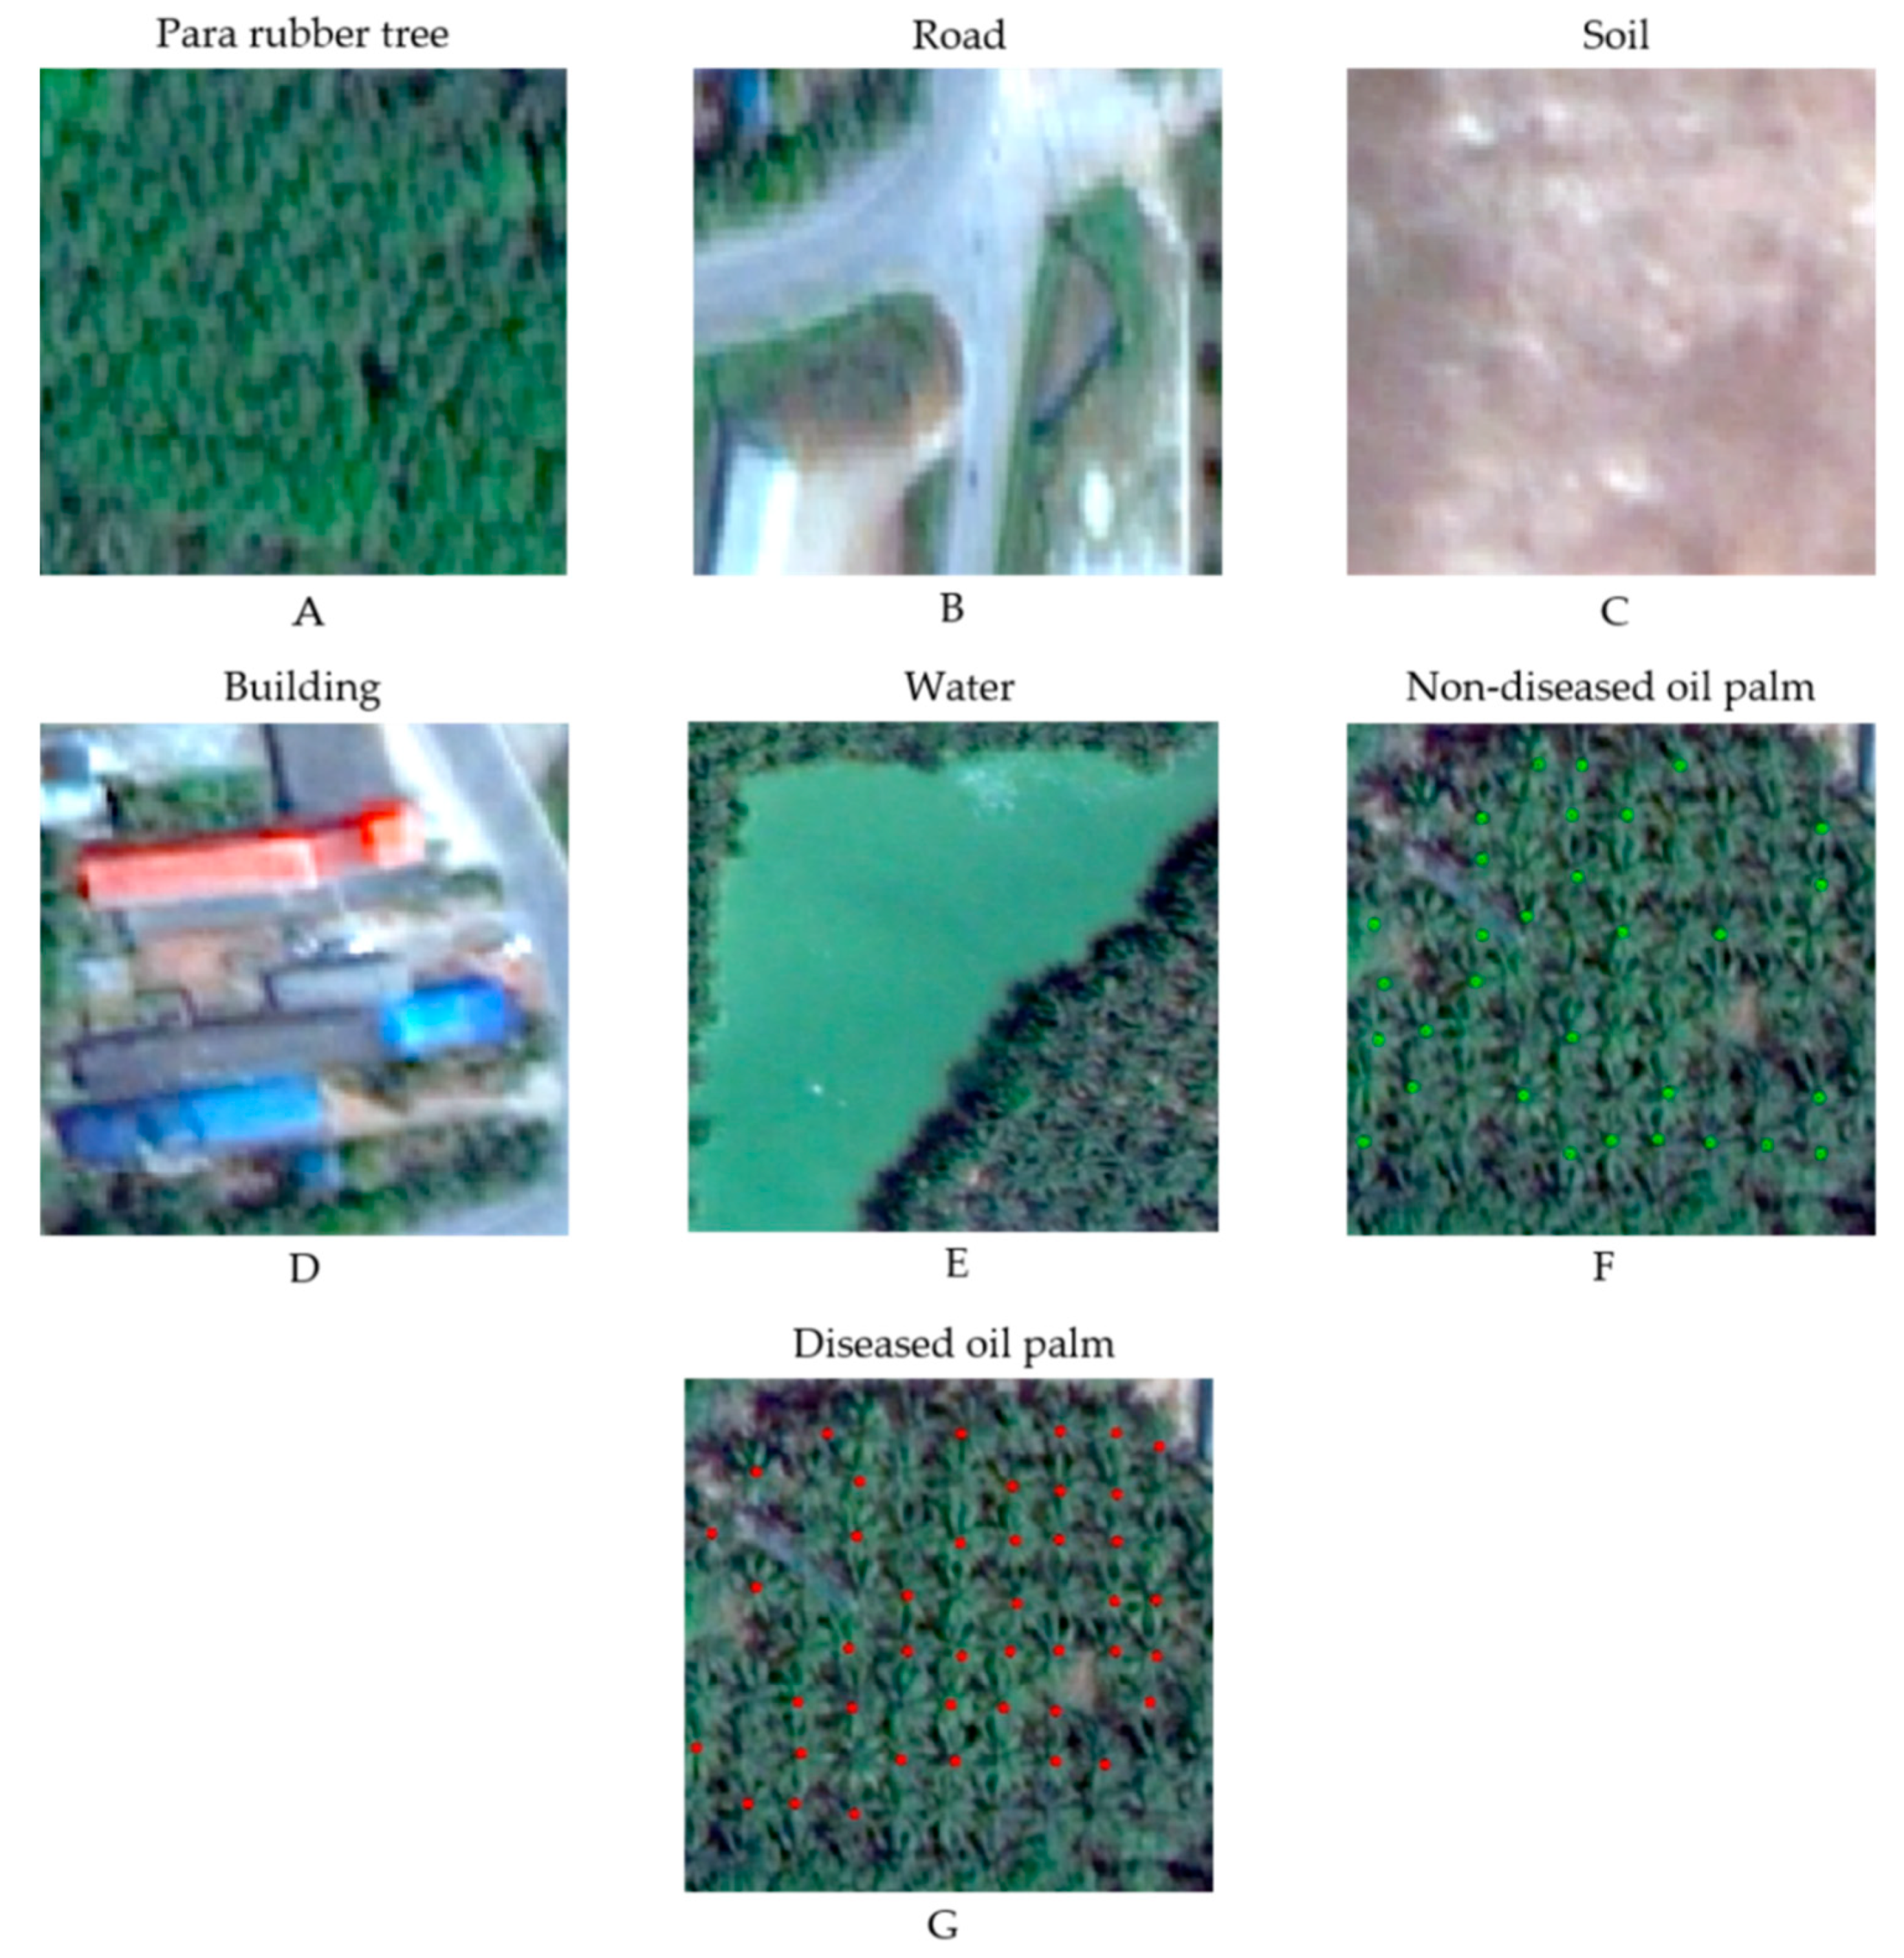
Very high spatial resolution (VHSR) satellite imagery has proven to be an imperative data source in agriculture [30] and is a requirement for mapping oil palms at individual tree level. Hence, in this study we used a WorldView-2 satellite image with 1 panchromatic and 8 multispectral bands (Table 1), spatial resolutions of 0.5 m and 2 m, respectively, 16-bits of dynamic range and acquired at 25.8° off-nadir look angle on 21 March 2019 at 04:16:19. The scene contains approximately 1% cloud coverage and a relatively clear atmosphere [31,32].

2.3. Field Data

A field survey was undertaken between 19 and 21 April 2019. Two sample plots were identified (Area 1 and Area 2 as in Figure 1), which belong to the same geographical area; nevertheless, they are separate and inherit different structural characteristics; in Area 1, the age of the trees was 12 years while in Area 2, it was 15 years at the time of the survey. Moreover, their spectral characteristics differ as the proportion of the healthy and diseased oil palm trees and the distance between trees is different in the two plots; consequently, it is anticipated that the spectral characteristics as recorded from nadir-looking sensors such as satellites, will differ. Therefore, these two sample plots represent different plantation structures within the same geographical area and underpin the robustness of the methodology.
The geolocation of the trees was recorded with a Global Positioning System (GPS) device (Figure 2) and the health status of each oil palm was evaluated by an arborist on site. A diseased tree was identified as such if there were signs of health deterioration, disregarding the actual cause. A systematic sampling methodology was followed by selecting all adjacent trees in the predefined regions of interest for each sample plot as depicted in Figure 1. Water palm samples could not be obtained. In total, 113 samples were collected, out of which 74 samples in the Area 1 and 39 samples in the Area 2. A subset of 70 samples was used as training data for classification and 43 samples were used as validation data. It is worth noting at this point that the motivation for this survey was the receipt of farmers’ inquiries regarding the pathogenesis of oil palm trees that affected their crops in the greater area. In general, manifestation of the disease usually occurs throughout the season for several consecutive months to the changing climate [29].

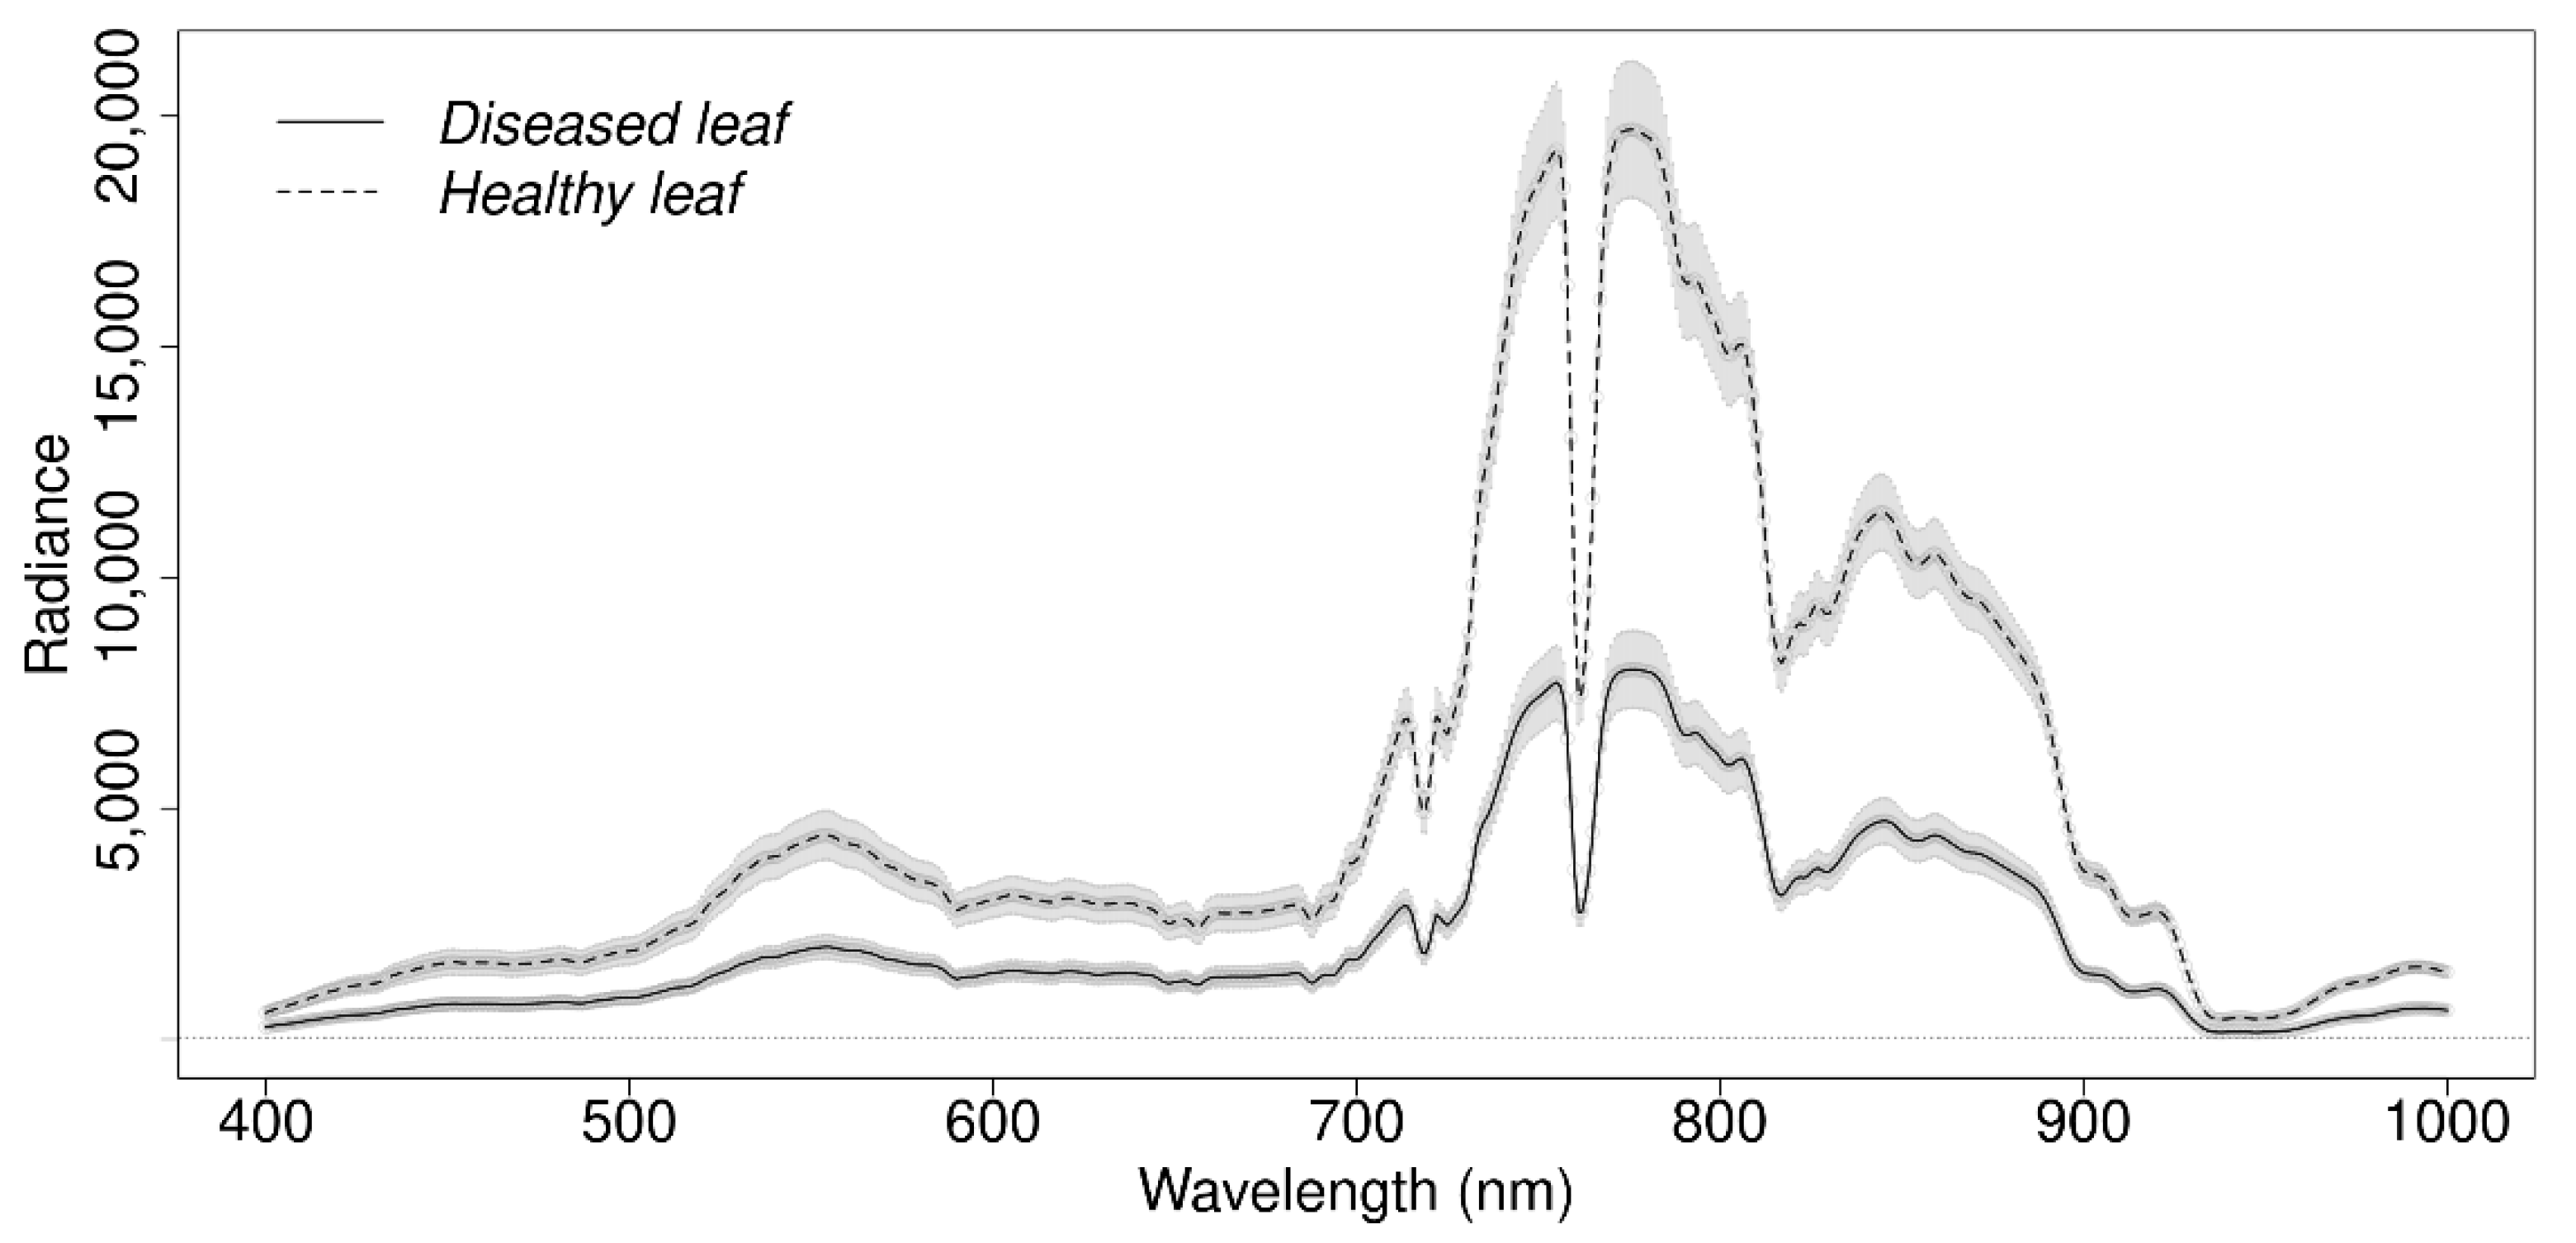
2.4. Spectroscopic Data
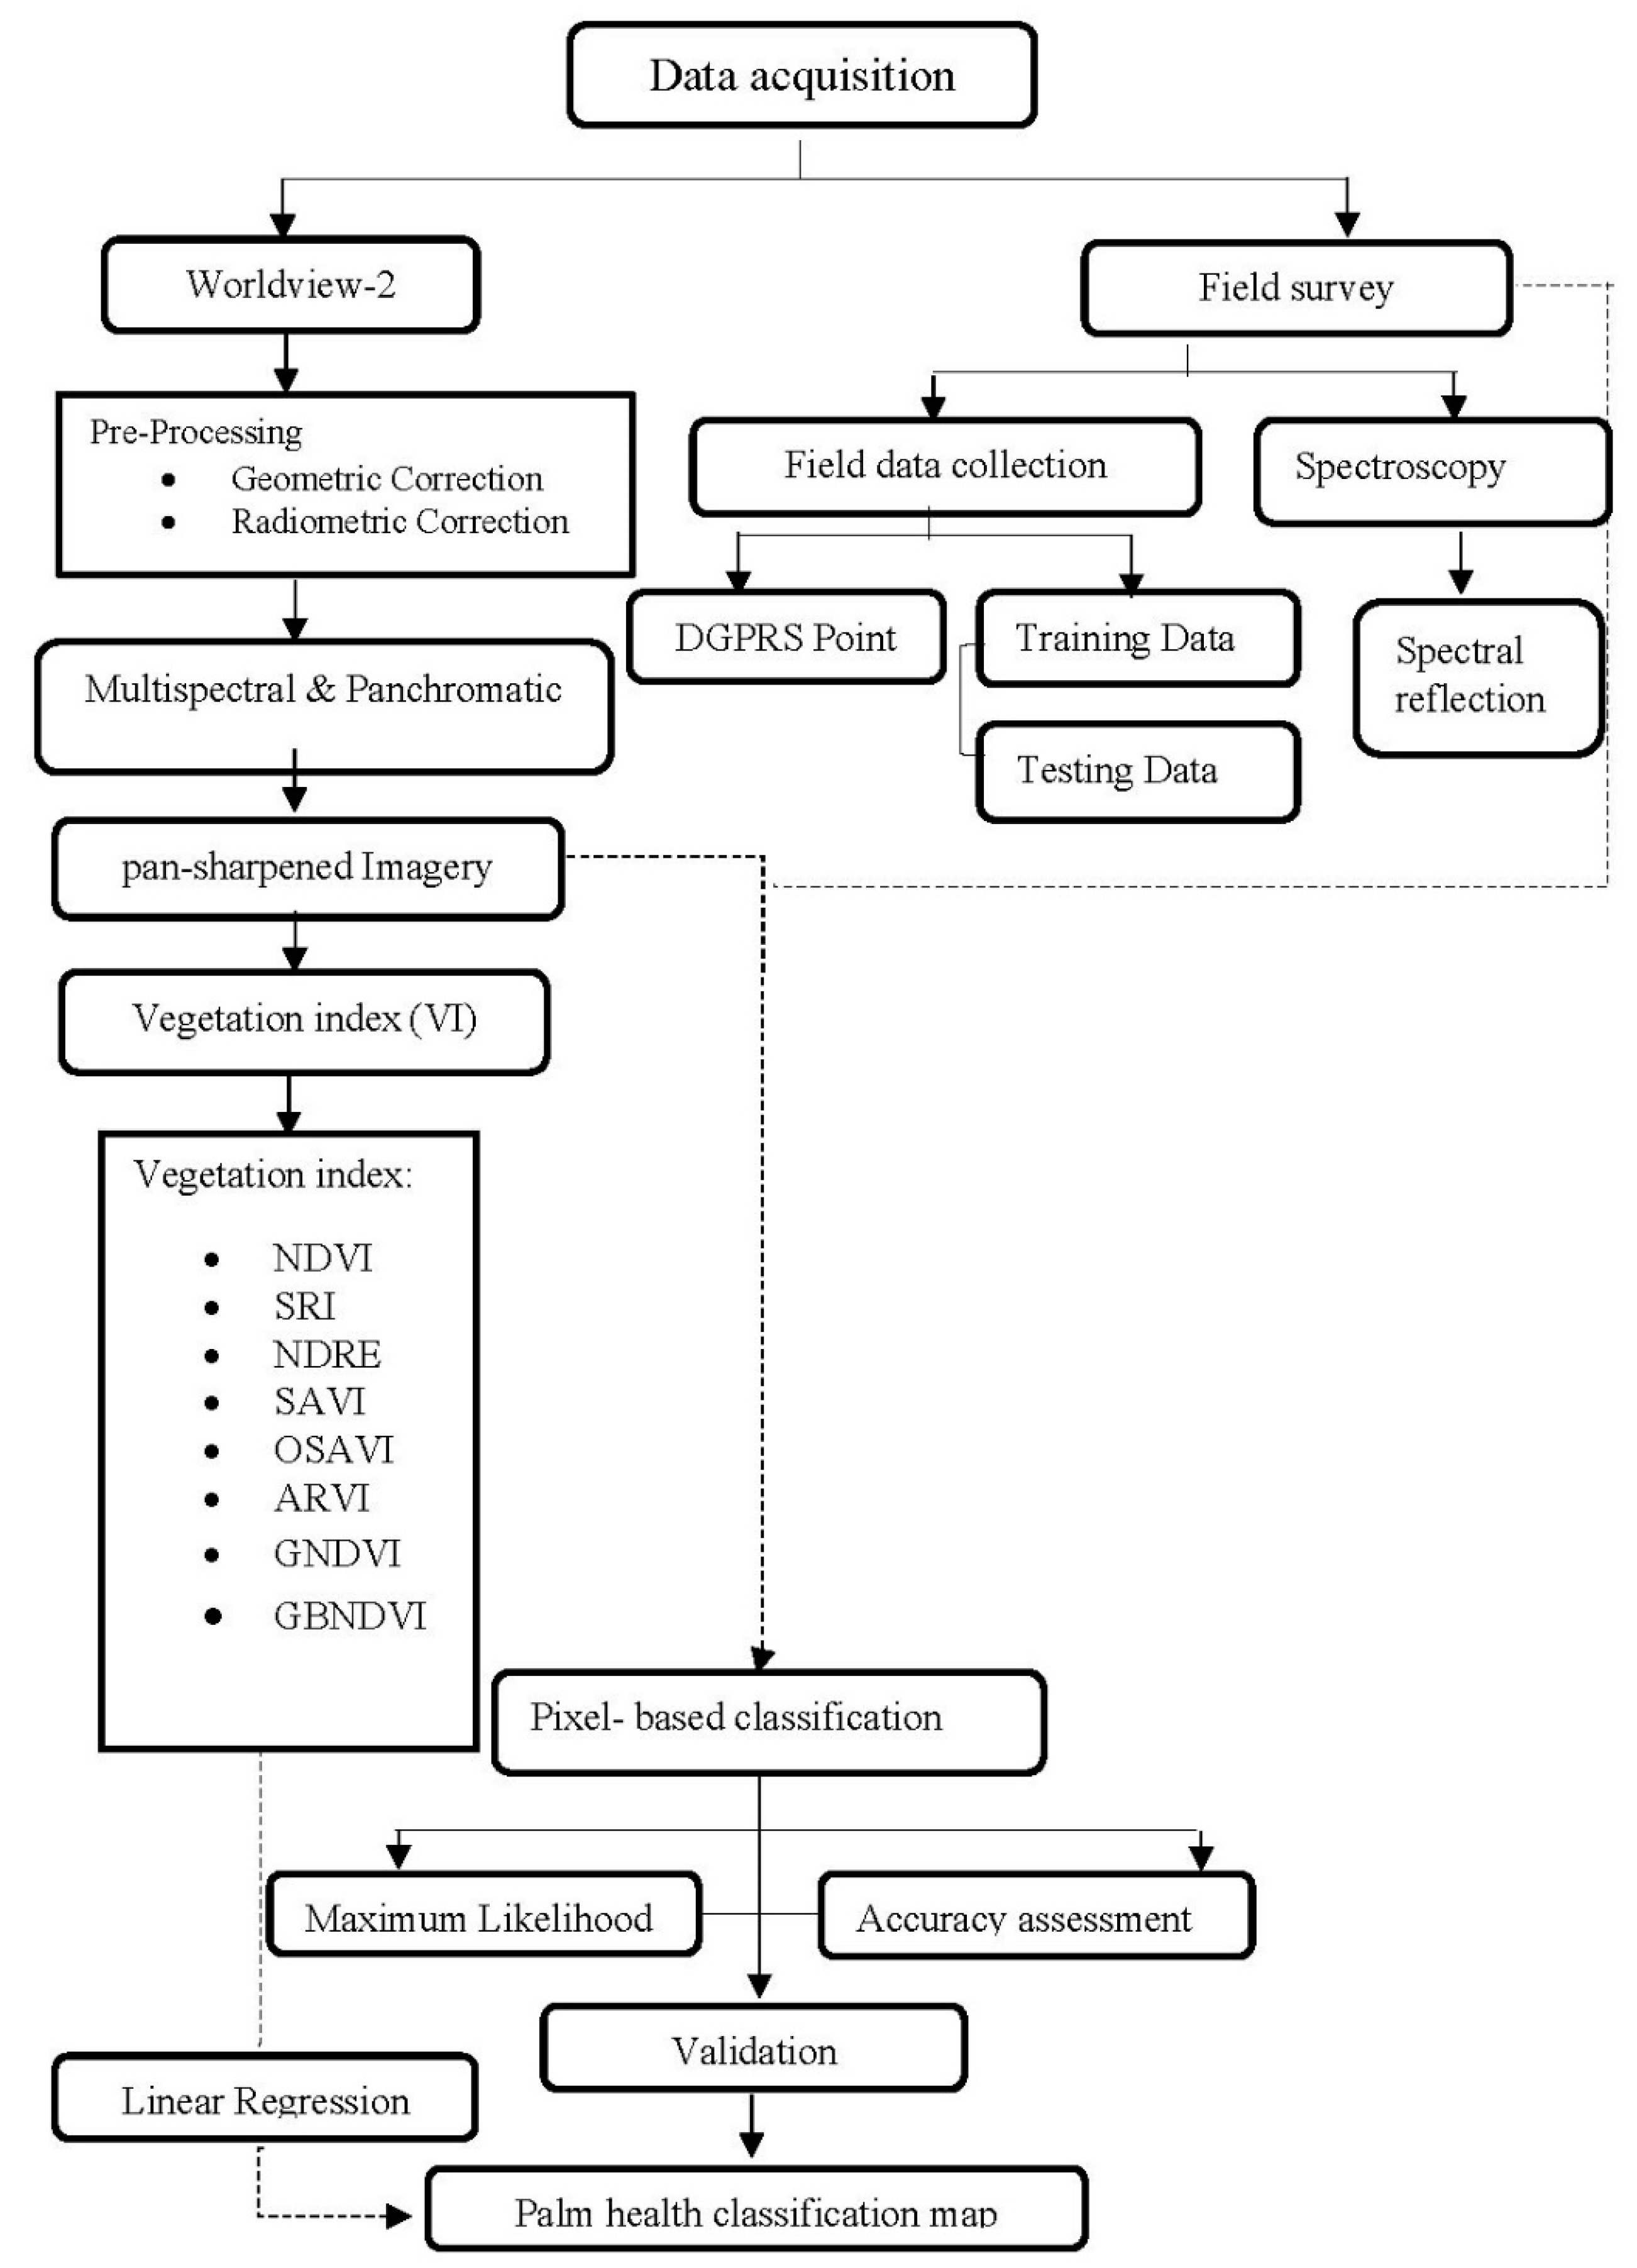
Hyperspectral reflectance measurements were acquired at the sample locations using a FieldSpec HandHeld spectroradiometer which records radiation intensity in the 325–1075 nm spectral range, an accuracy of ± 1 nm and a spectral resolution of <3 nm at 700 nm [33]. The integration time for each measurement was 544 ms and the distance between the hyperspectral device and each leaf sample was 30 cm. The latter distance between the device and each leaf sample depends primarily on the field-of-view of the device. Ideally, a tradeoff is found where the distance is long enough to cover a large part of the leaf and avoid shadows and short enough to avoid inclusion of surrounding objects; this allows for pure leaf spectral measurements. The data were collected under clear sky conditions between 13:00 and 16:00 local time between 19 and 21 April 2019. A total of 113 samples were recorded, 54 spectra of diseased and 59 spectra of healthy oil palm trees.

2.5. Methodology

2.5.1. Radiometric Correction

Relative radiometric correction is a key step in producing high-quality information and is an indispensable processing procedure for improving the quality of high-resolution optical satellite imagery. The multispectral pixels of the WorldView image were delivered in radiance and through the radiometric correction they were converted to reflectance. The Fast Line-of-sight Atmospheric Analysis of Spectral Hypercubes (FLAASH), an atmospheric correction module of the ENVI software [34] was used for this purpose. FLAASH is a first-principles atmospheric correction software and a modified version of the MODTRAN4 radiation transfer code and caters to wavelengths in the visible through NIR and shortwave infrared spectral regions.

2.5.2. Geometric Correction

The next step of the pre-processing was to eliminate potential geometry distortions. The terrain correction processing geocoded the image based on a topographic map L7017 with scale 1:50,000 provided by the Royal Thai Survey Department, and projected it into map coordinates. The method of Doppler Range Terrain Correction (DRTC) was used to eliminate geometry distortion. This process produced data with pixel size of 2 × 2 m and projected map based on the datum WGS-1984 and the Universal Transverse Mercator (UTM) projection system on 47 N Zone.

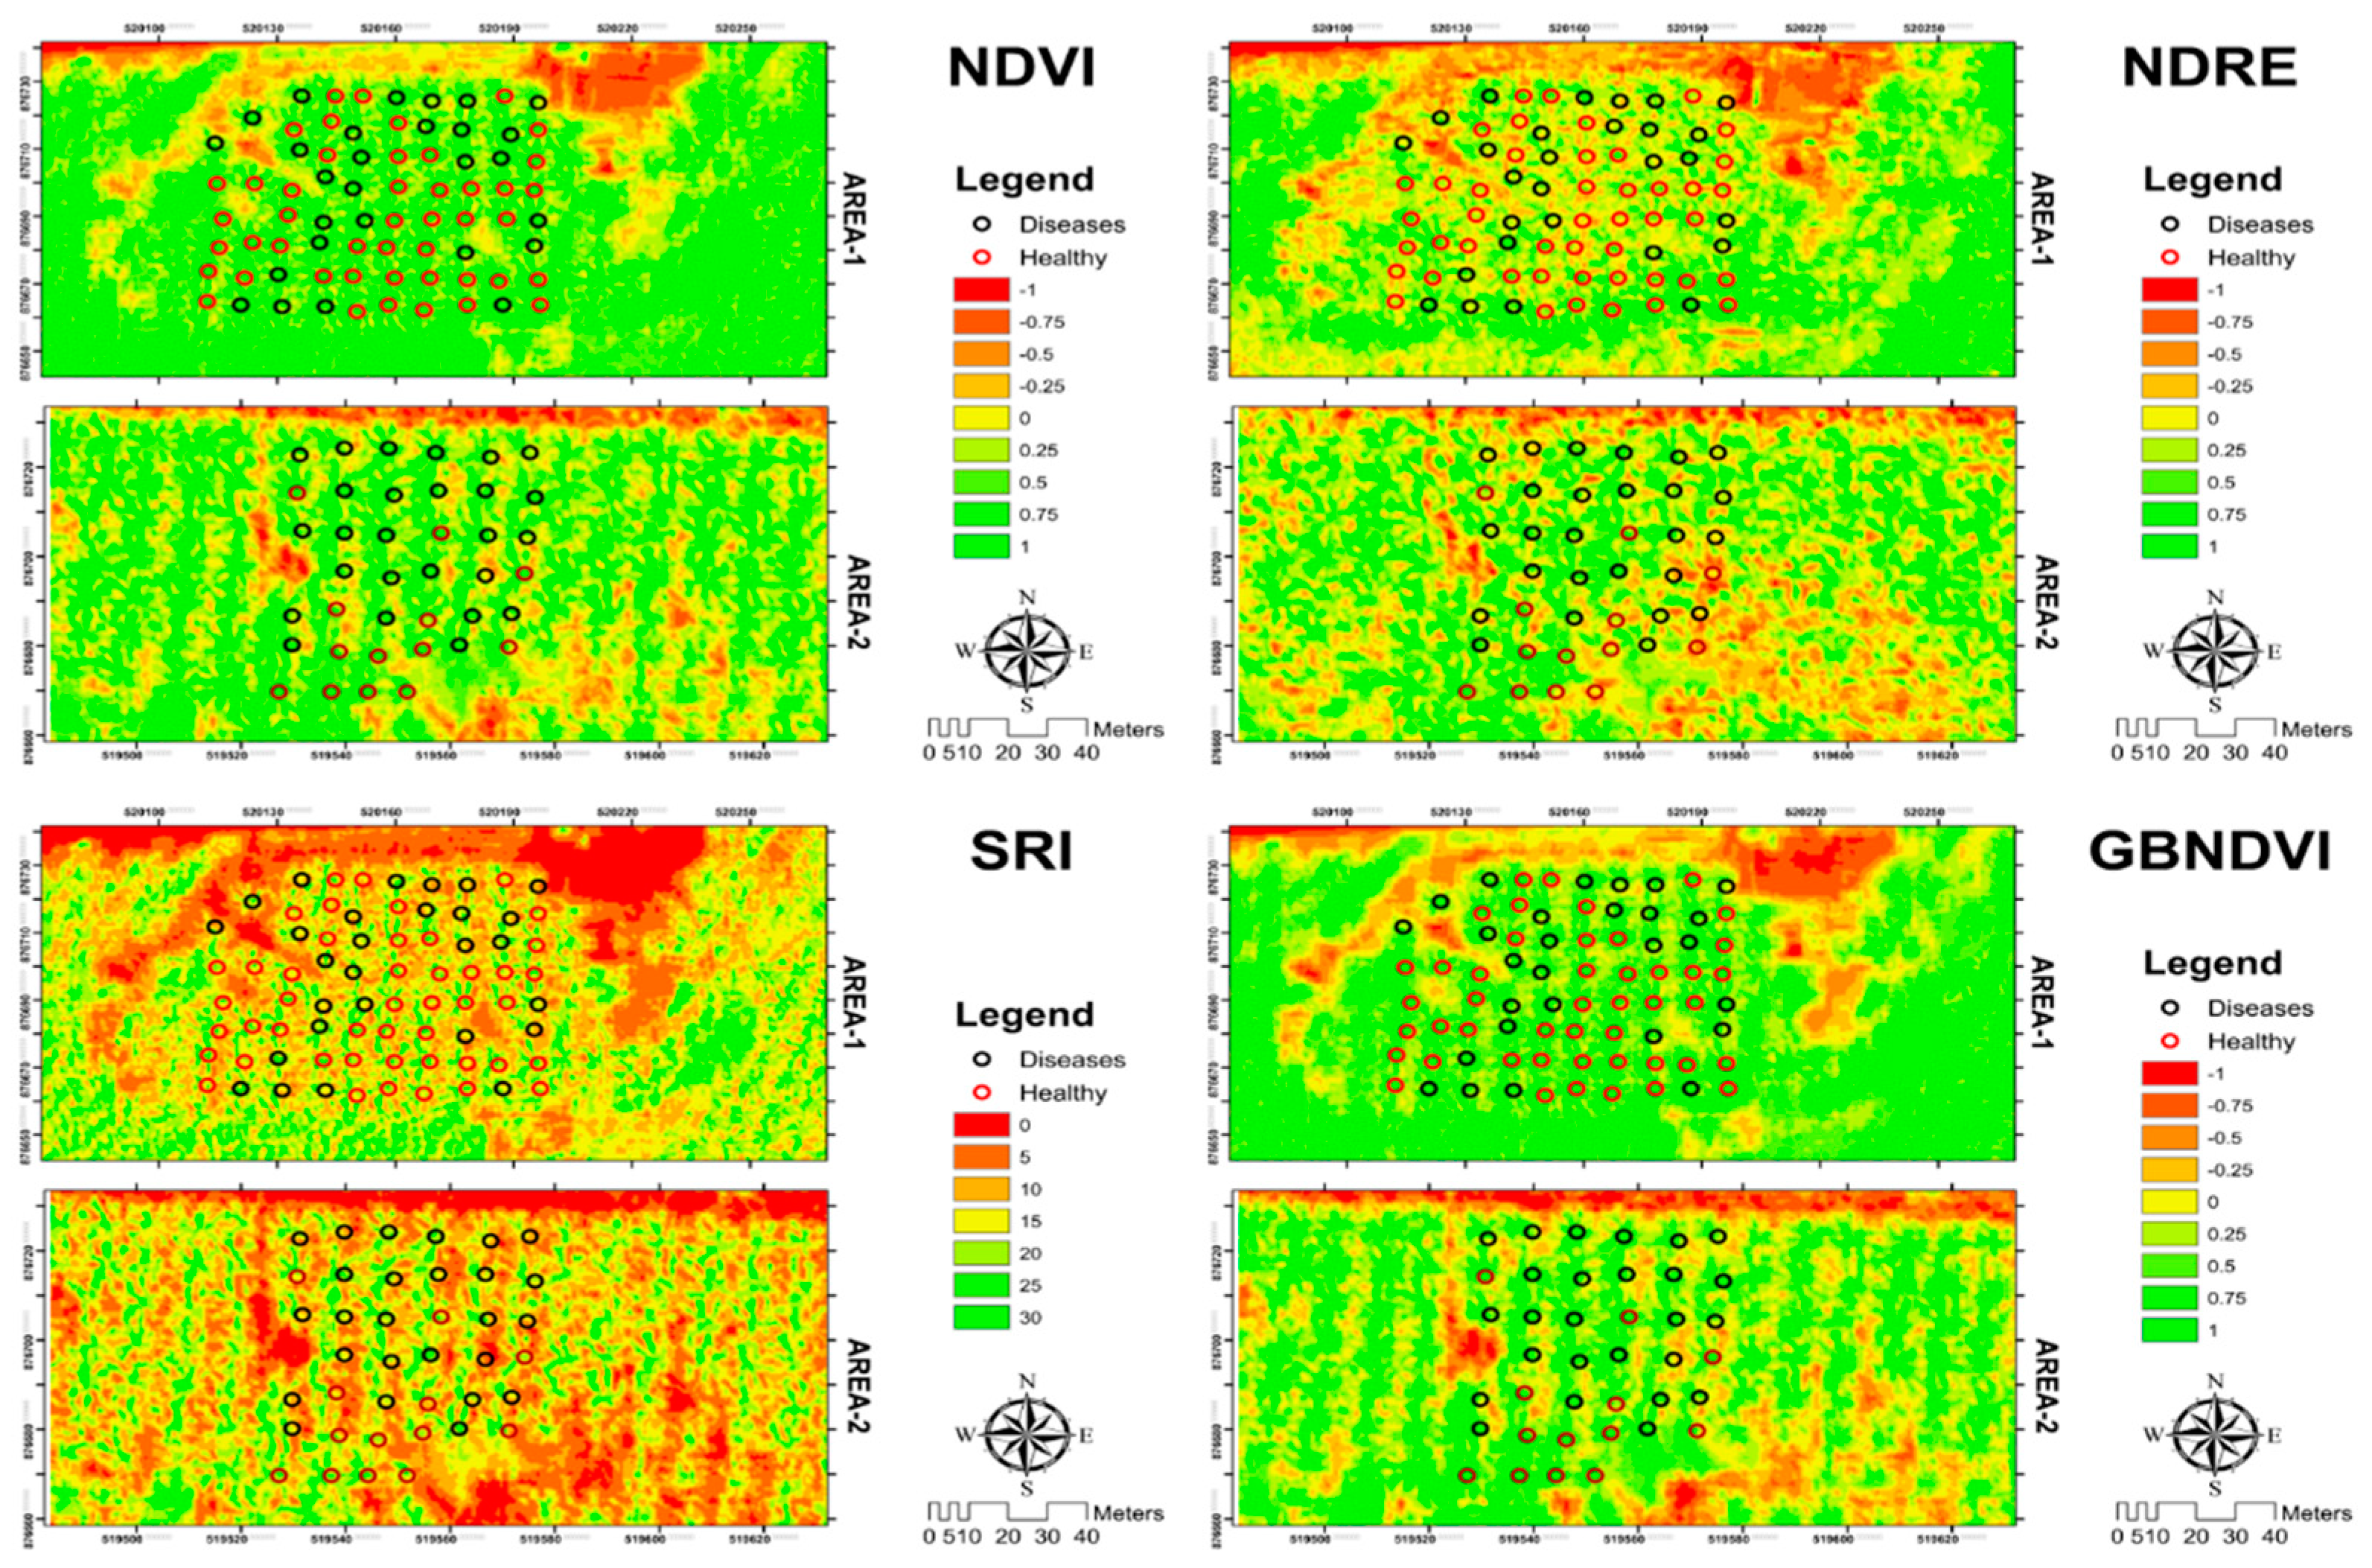
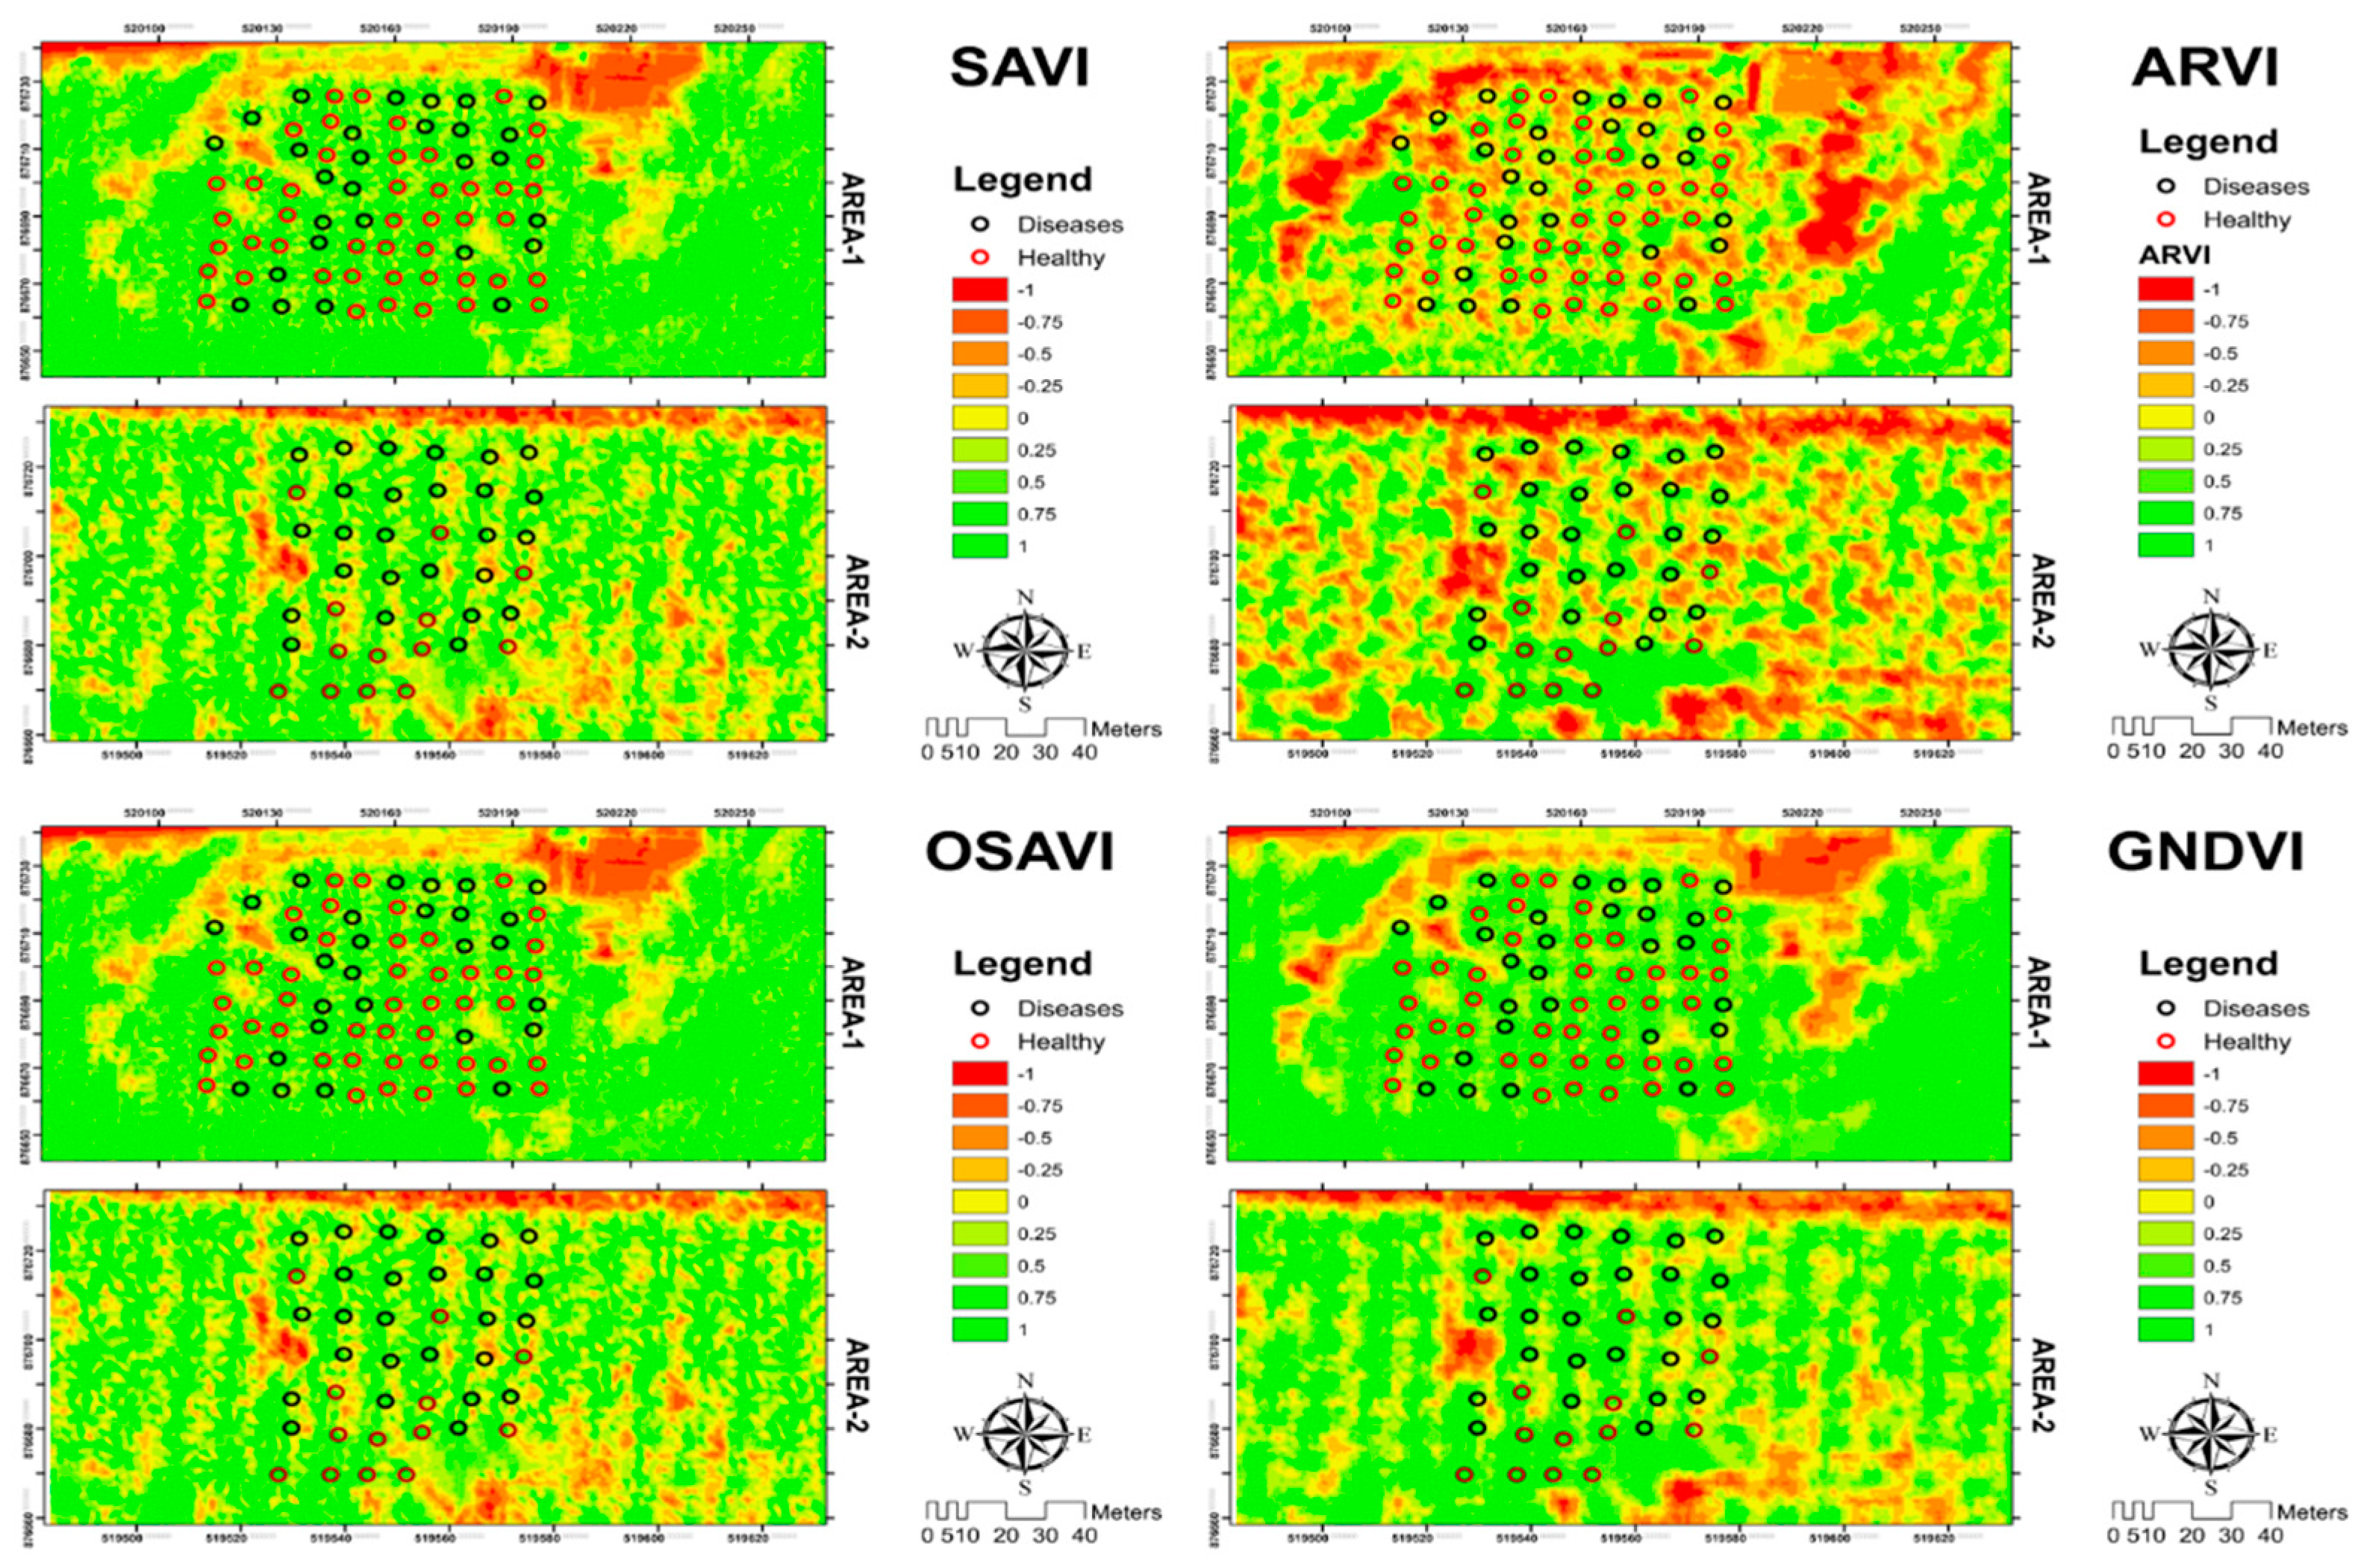
2.5.3. Vegetation Indices

Popular vegetation indices were extracted from the multispectral bands of visible and NIR [15,35]. The empirical vegetation indices were calculated according to the equations in Table 2 [21,36,37]. In order to assess the accuracy of various indices, the classification results were compared with the ground survey data [15]. Moreover, the values of the pixels for each vegetation index encompassing the sampled palm oil trees was extracted and the statistical distribution of the healthy and diseased categories was investigated. All 113 samples from Areas 1 and 2 were taken into account cumulatively for each vegetation index.
Table 2. The empirical vegetation indices used in this study and their mathematical formulas. Blue (445–517 nm), Green (507–586 nm), Red (626–696 nm), Red Edge (698–749 nm), NIR (765–899 nm) and L is the soil background adjustment factor with 0.5 commonly used for medium density vegetation [38,39].
IndexFormulaReference
Normalized Difference Vegetation Index (NDVI)(NIR − Red)/(NIR + Red)[40]
Simple Ratio Index (SRI)(NIR/Red)[41]
Soil Adjusted Vegetation Index (SAVI)(1 + L) × (NIR − Red)/(NIR + Red + L)[38]
Optimized Soil Adjusted Vegetation Index (OSAVI)(1.16) × (NIR − Red)/(NIR + Red + 0.16)[42]
Atmospherically Resistant Vegetation Index (ARVI)[NIR − (2Red − Blue)]/[NIR + (2Red − Blue)][43]
Green Normalized Difference Vegetation Index (GNDVI)(NIR − Green)/(NIR + Green)[44]
Green Blue Normalized Difference Vegetation Index (GBNDVI)[NIR − (Green + Red)]/[NIR + Green + Red][36]
Normalized Difference Red Edge (NDRE)[NIR − Red edge]/[NIR + Red edge][45]

2.5.4. Maximum Likelihood Classification

First, the multispectral image was pansharpened with the panchromatic image in order to produce a high spatial resolution image with fine spectral resolution that can consequently capture spectra of pure pixels of individual oil palms. In pan-sharpening, the coarse spatial multispectral resolution band is merged with the higher spatial resolution panchromatic band [46]. The GRAM Schmidt (GS) resolution merge algorithm was used. The pan-sharpened product has a spatial resolution of 50 cm and the native spectral resolution of the multispectral data. The WorldView-2 satellite pan-sharpened image was subsequently classified on the false color composite and based on visual interpretation of 7 categories, namely rubber tree field, road, soil, water, building, healthy oil palms and diseased oil palm. A total of 70 samples of palm oil plants were used as a representative set for the training of the algorithm. For the rest of classes, the representative sample points considered were 57, 27, 52, 15 and 5 for the classes of para rubber tree, road, soil, buildings and water, respectively. The Maximum Likelihood classification algorithm was used for the supervising classification scheme. The assignment of healthy oil palm and diseased oil palm trees on the satellite images was defined from the ground field data. Each type of data categories from ground field data collection was used in the calculation of statistics. Indicative samples of true color images of representative classes are presented in Figure 3.

2.5.5. Accuracy Assessment

A comparison between the field samples and the WorldView-2 pixels was undertaken to verify the accuracy of the plant health classification results [29,47]. The assessment of the accuracy was based on the Confusion Matrix and Kappa Statistics (K) as in similar studies [15,37,48,49]. The field data collected during the ground survey were considered the actual class while the information extracted from the satellite image were the predicted class. The pixel encompassing the geographical coordinates of each oil palm tree (as recorded during the field campaign) was considered as the pixel value corresponding to the center of each oil palm plant and, thus, the representative value of the earth observation data associated to each plant. The results were reinterpreted based on the ground survey. By assessing the accuracy for each type in the row and column of the error table, the overall accuracy was estimated as per Equations (1) and (2) below.
Overall   Accuracy = i = 1 k n n × 100
To determine the accuracy of the information from the classification of each category, the K was used according to the following formula.
K = ( ( N × d ) q ) N 2 q
The similarities or differences of the healthy and diseased oil palm trees were judged against the results obtained from the accuracy calculations for each image [16,37,50,51].

2.5.6. Validation

The validation was based on 43 samples, out of which 19 were associated with diseased and 24 with healthy oil palm trees. The sample data sets of diseased and healthy oil palm trees that have been collected during fieldwork were overlaid to the classification results of the WorldView-2 satellite imagery in order to compare the accuracy of the supervised classification. A total of 24 healthy oil palm trees have an accuracy of classification results of 21 sample and 19 diseased oil palm trees had the accuracy of classification results in 14 sample, the rest 8 sample were found misclassified. The methodological workflow is depicted in Figure 4.

3. Results

3.1. Spectral Separability

The results from the proximate spectroscopic data showed that the two sampling classes, namely, the diseased and healthy oil palm leaves, differed in their hyperspectral reflection curve characteristics. Samples from healthy oil palm leaves demonstrated a higher radiance compared to the diseased oil palm leaves across the whole visible and NIR spectrum as depicted in Figure 5. From a total of 113 samples, 59 samples corresponded to healthy oil palm and 54 to diseased samples as in Figure 6 after the analysis of the ground data. The standard deviation (shaded area in Figure 5) is comparatively larger for the diseased samples; however, not as large as to allow for confusion between the two classes. Therefore, there is a clear separation of the two classes based solely on proximate hyperspectral point measurements.

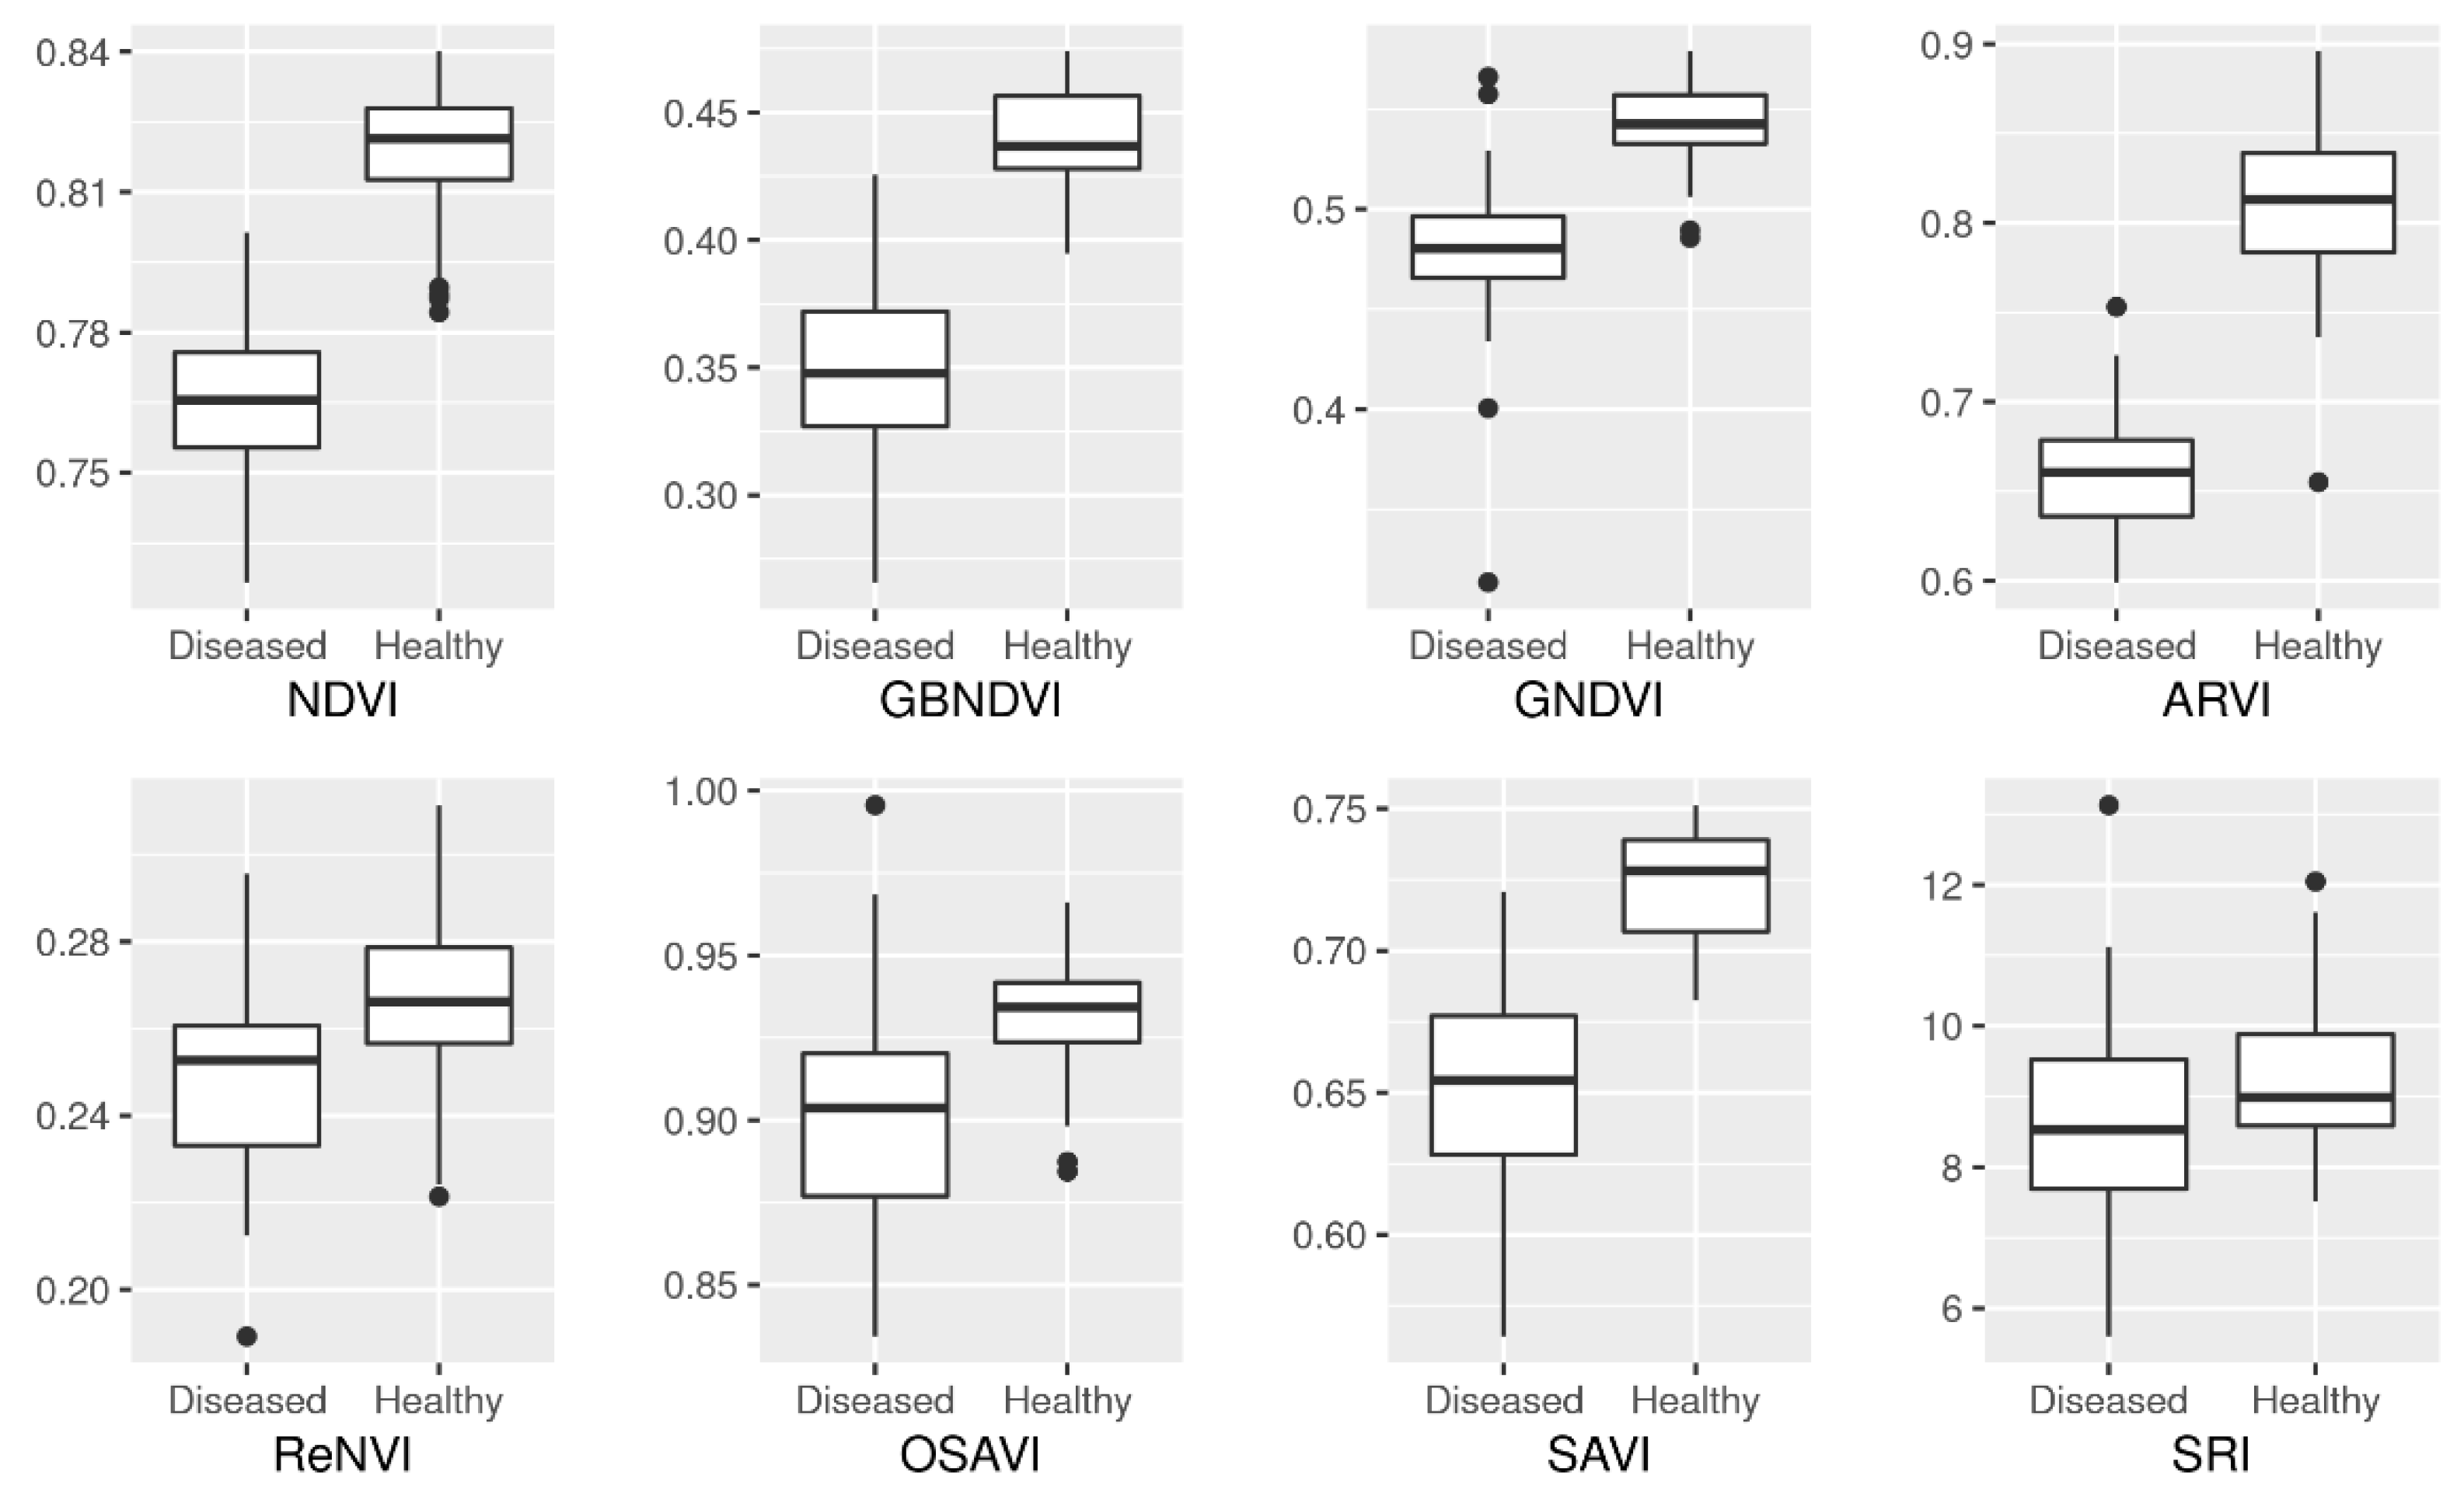
3.2. Vegetation Indices

Vegetation indices are combinations of reflectance measurements that are sensitive to the combined effects of foliage traits [52]. These indices can relate to the vigor and health of green vegetation. The following indices were compiled to estimate the amount and quality of photosynthetic material in vegetation: NDVI, SRI, SAVI, OSAVI, ARVI, GNDVI, GBNDVI, NDRE [16,21,53]. The associated maps presented in Figure 7 and Figure 8 depict the spatial distribution of each index within each of the two oil palm plantations. The location of individual oil palm trees is overlaid in order to evaluate the index value above the tree judged against the surrounding environment. Several of the indices are providing similar results, which is expected given the fact that most of the popular indices are constructed based on a band combination of the red and NIR bands. Last, the statistical distribution of the vegetation indices values of the pixels encompassing the palm oil trees sampled is presented in Figure 9. The value range for SRI is from 0 to 30 [41] while for the rest of the vegetation indices is −1 to 1 [36,38,40,42,43,44].

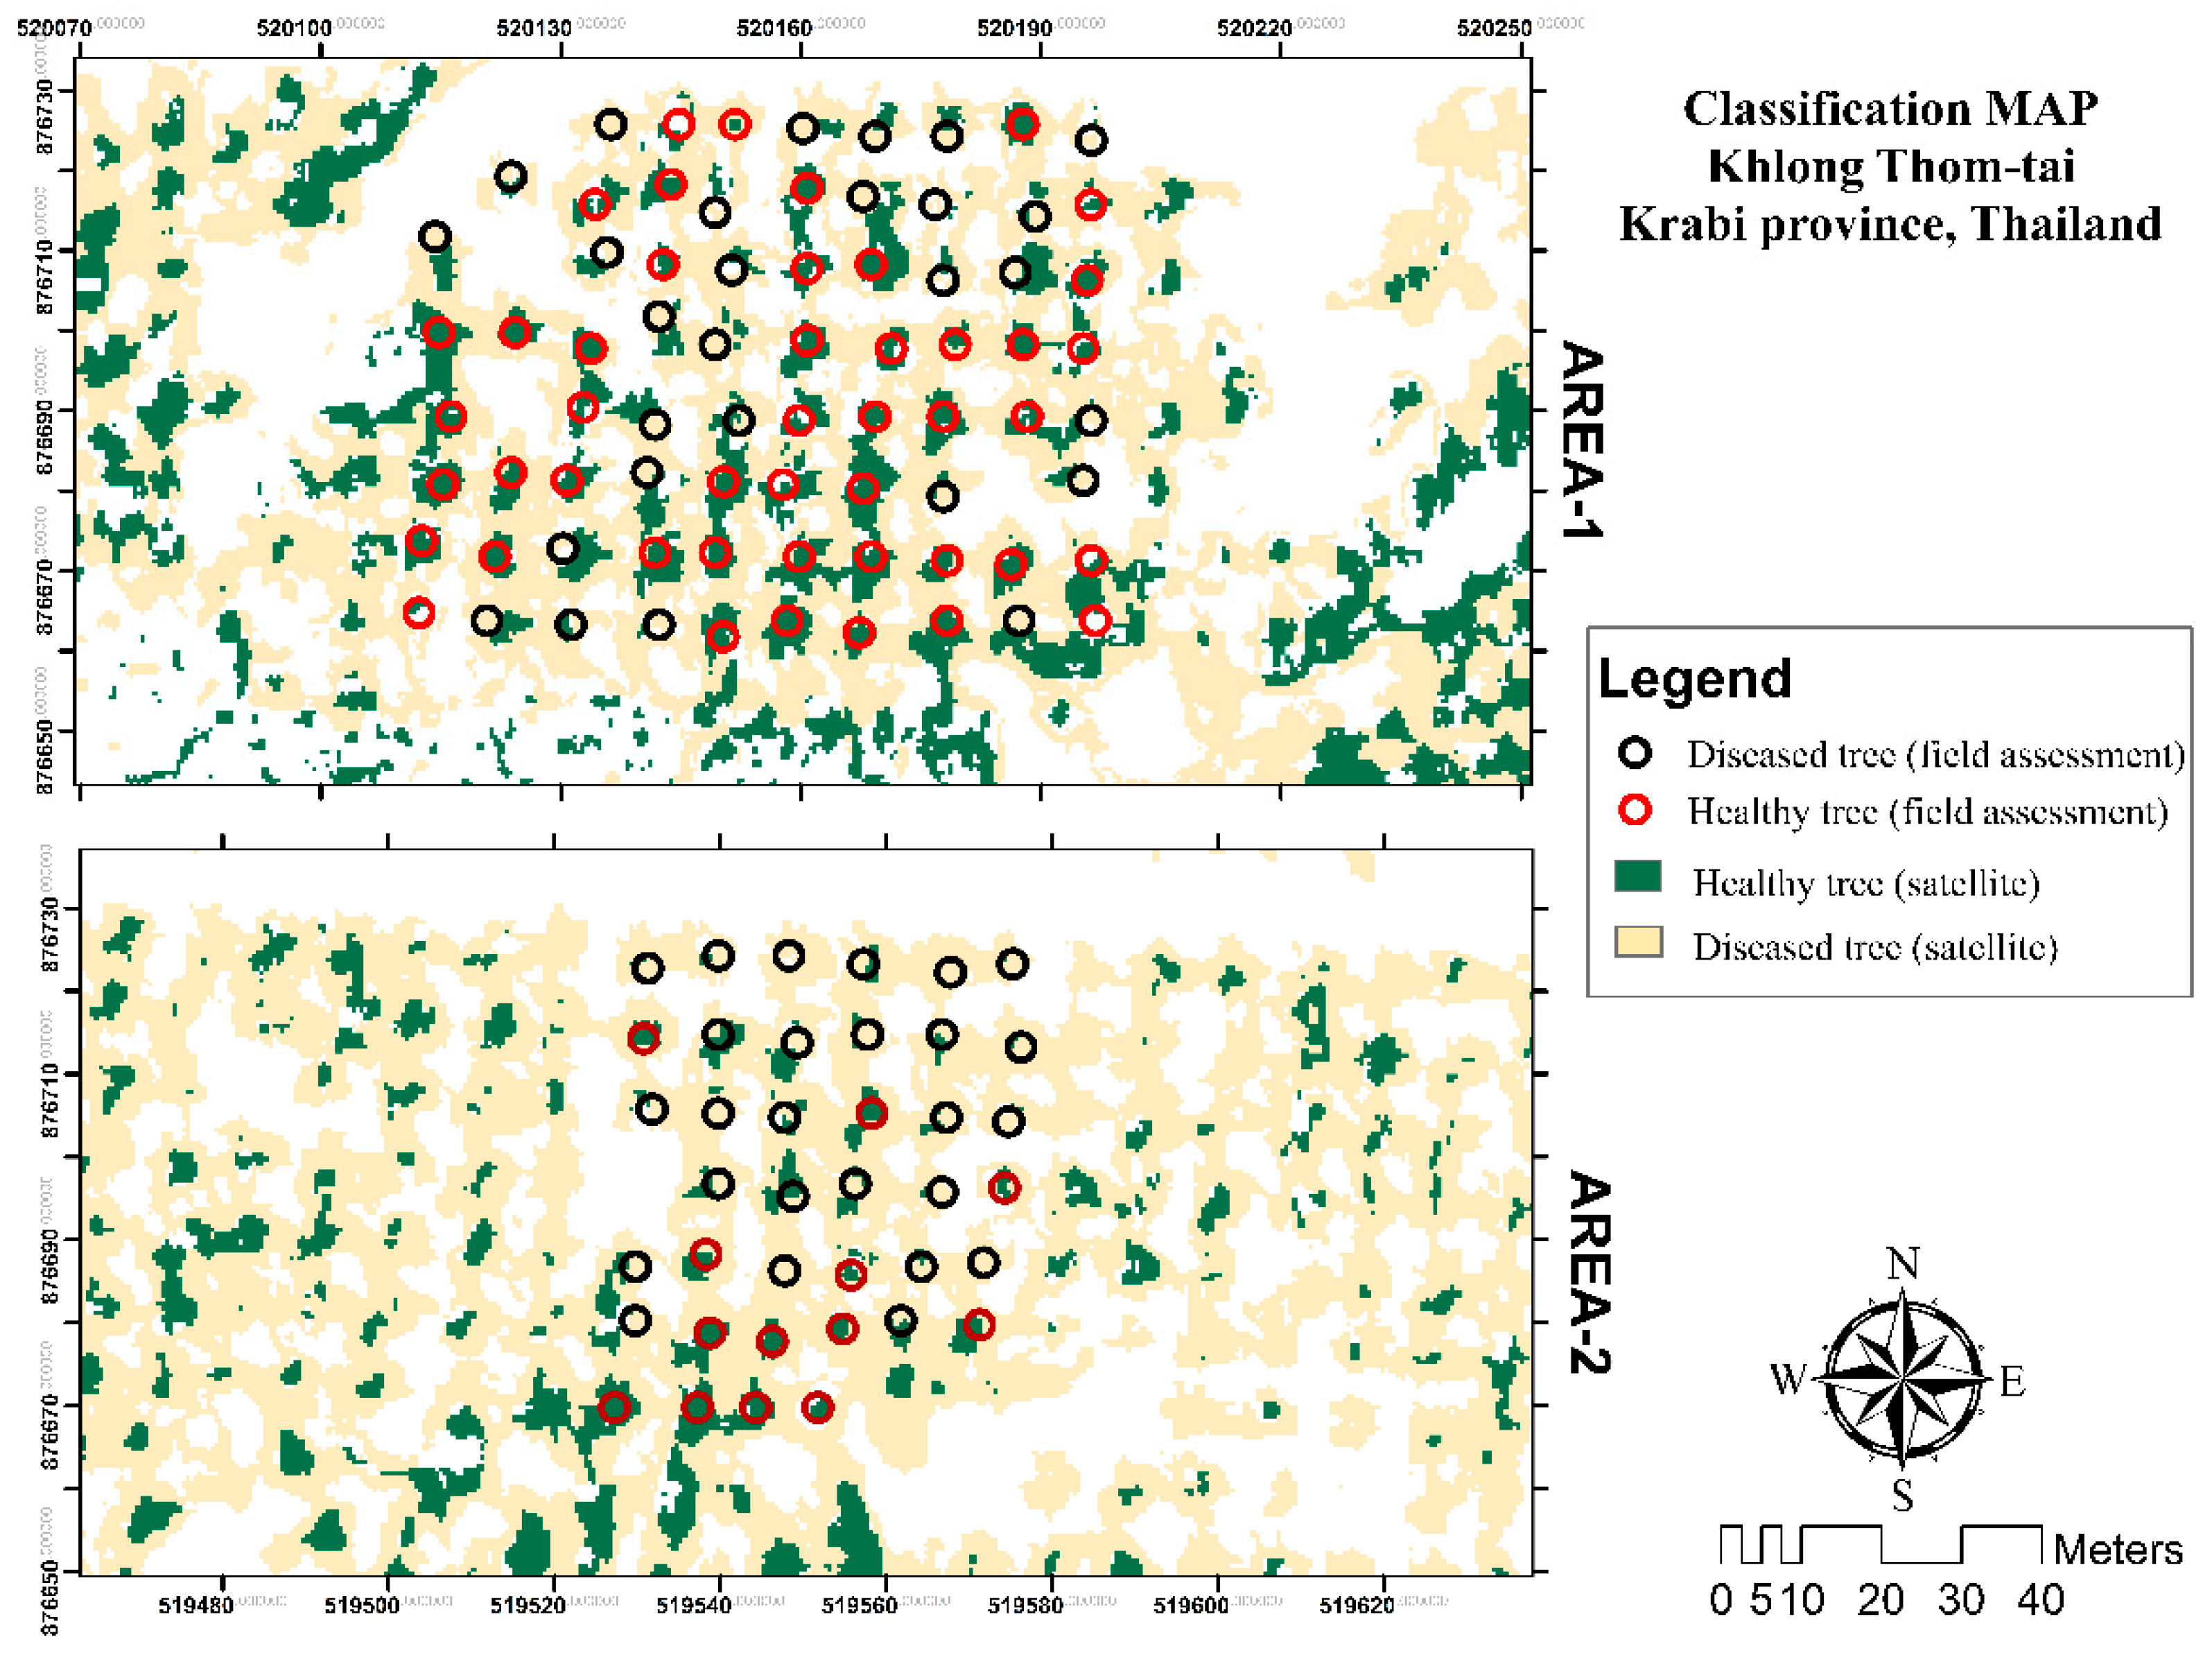
3.3. Maximum Likelihood Classification and Accuracy Assessment

The results from the maximum likelihood classification in the study area for Areas 1 and 2 are depicted as thematic map in Figure 10. This classification provides pixel-based spatial data [54,55]. The healthy and diseased oil palm classes of the in-situ evaluation are also indicated with circles at the center of each oil palm canopy coverage. This allows for the visual evaluation of the coexistence and judge against the two data sources. For the accuracy assessment, the error matrix was used as the method for the validation of the pixel-based supervised classification. In Table 3 the accuracy of the Maximum Likelihood Classification is provided. The total percentage of correctly classified healthy oil palm is 83.33%, which means that 83.33% classified as the healthy oil palm are indeed the healthy oil palm. Similarly, 78.95% was classified as diseased oil palms are indeed diseased oil palms. The overall accuracy of the Maximum Likelihood Classification is 85.98% and the kappa coefficient is 0.71. The results from the comparison of the classification data are presented in Table 3. The analysis in the pixel based spatial data was based on the characteristics of the reflectance value for each pixel image that is evaluated during the process.

4. Discussion

Spectroscopy was used to analyze diseased and healthy oil palm trees conditions [56]. The clear distinction between the hyperspectral curves of the two classes is apparent in Figure 5. This separability has also been observed in other studies using proximate hyperspectral data on infected oil palm leaves, such as [17,18] who report overall classification accuracy of 98% and 97%, respectively. Diseased oil palm leaves have a relatively lower chlorophyll content than the healthy leaves, and there is a decrease in incident solar radiation absorption in the visible and NIR region [16,48,56,57,58]. The latter fact is normally observed with visual evaluation of diseased tree leaves. For instance, in Figure 2 it is apparent that the diseased oil palm leaf sample does not exhibit significant greenness and vigor compared to its healthy counterpart, and this is the reason of the overall reduction in the visible and NIR spectral regions. Oil palm diseases are manifested through chlorosis of the leaves from the bottom surface and the appearance of yellow and green spots on the top of the leaves as well as necrosis of older leaves [12], and this is the underlying reason of the visual yellowness and the reduced reflected radiance observed.
Vegetation indices have been widely applied to high-resolution WorldView-2 satellite images to quantify vegetation properties and especially in agricultural applications. Based on the visual interpretation of the eight vegetation indices and associated ground truth data, the suitability of the indices for detecting infected palms was evaluated. The satellite vegetation indices could not discriminate among different levels compared to the spectral reflectance measured with a spectroradiometer, the latter showing more accurate reflectance values. This is an indication that popular vegetation indices used in remote sensing, such as the ones derived in the current study, are not suitable for assessing oil palm tree diseases at the spectral and spatial resolution of the WorldView-2 satellite specifications. Vegetation indices may apply for simpler infestation problems (e.g., crops and plantations which demonstrate stronger manifestation of diseases other than leaves chlorosis), which obviously is not the case for the specific problem. It is obvious in Figure 6 that the spectral characteristics of diseased and healthy oil palm trees do not differ considerably based on visual evaluation of the natural-color representation of the WorldView-2 satellite image. This study is a preliminary effort to assess the potential of the WorldView-2 imagery; however, there are still limitations with satellite images. There was also a 1-month time lag between the acquisition of the satellite images and the field survey, which is critical in such studies as the disease may spread rapidly; this fact may have introduced associated errors in the accuracy assessment. Therefore, it is crucial that the field survey be conducted as close as possible to the day of image acquisition.
With regard to the accuracy of the classification of the two classes of specific interest, namely diseased and healthy oil palm trees, the error matrix, the omission and commission errors as well as the producer’s and user’s accuracies were calculated and listed in Table 3. The results of the current study conclude that the overall accuracy is 85.98% and the Kappa coefficient 0.71 (71%). Comparing with the results proposed in other similar studies which used high spatial resolution satellite imagery (namely QuickBird and WorldView-2) the results proposed in the current work provided detection accuracy of approximately 90%, which is slightly higher than the results from similar past studies [27]. A study from Santoso et al. (2017) used QuickBird imagery to classify oil palm disease and report an overall accuracy of 91%, which is slightly higher compared to our research outcome, perhaps attributed to the fact that the QuickBird satellite sensor has higher resolution than the Worldview-2.
It is evident that remote sensing can play a vital role in identifying diseased oil palm trees and, therefore aid in the sustainable development of oil palm plantations. According to our findings, hyperspectral remote sensing inherits the highest spectral resolution and radiometric accuracy, based on which accurate information on diseases leaves can be derived. Moreover, the high spatial resolution of WorldView-2 provides the opportunity to map vegetation, and associated traits, at the level of individual trees and therefore is suitable for palm oil plantations inventorying and monitoring. Nevertheless, it is worth noting that both data sources are expensive during the data collection for the case of field spectroscopy (time consuming for in-situ data collection) or the purchase of proprietary VHSR satellite imagery which satisfies the spatial resolution of mapping individual trees.

5. Conclusions

The current study attempted to identify diseased trees in oil palm plantations in Khlong Thom-Tai, Krabi province, Thailand with proximate spectroscopy and multispectral WorldView-2 imagery. The main finding indicates that the pixel-based maximum likelihood classification yielded an overall accuracy of 85.98% and Kappa coefficient of 0.71. The classification results of the pansharpened satellite WorldView-2 imagery and popular vegetation indices indicated that separation between plants and other objects, as well as leaves from healthy oil palm and leaves from diseased oil palm are satisfactory. Nevertheless, the superiority of the hyperspectral information in separating vegetation traits more accurately should be stressed, a fact that is attributed to the finer and higher wavelength range of a spectroradiometer. In the current study, reflectance in the NIR and red wavebands for both hyperspectral ground samples showed distinctive patterns that can aid in detecting and identifying the infestation in the leaves of diseased oil palm trees. The results are accurate and consistent with other field survey data [6] and confirm the possibility of using remote sensing for the detection of diseased oil palms trees. Imaging and spectroscopy when used in tandem, can provide supplementary information to surveying and forecasting information on diseases and pests.
It is worth noting that natural forests are often cleared to accommodate oil palm plantations expansion and it has been evident that most of the ecosystem functions in these areas are considerably decreased [59]. Hence, it is important to develop strategies for monitoring plantations to avoid environmental degradation. The current study dealt with the detection of diseased and healthy oil palm trees and has listed suitable control methodologies that can act as a guide in the development of further measures. The usability of hyperspectral remote sensing, despite being an already established practice in sciences, has not yet penetrated into operational use and future adoption of spectroradiometric measurements from practitioners could provide early warnings of such infestations. Moreover, VHSR satellite image analysis can provide information at a large spatial extent and, therefore, aid in the designation and monitoring of cooperatives, local and regional policies. It is anticipated that the findings will help farm advisories to guide farmers in effective disease management practices. Future research directions include, first, the deployment of Unmanned Aerial Vehicle (UAV) in the context of VHSR mapping and, second, the application of the methodology in larger geographic areas to benchmark the robustness of the current approach.

Author Contributions

R.M. and N.N. wrote and edited the manuscript; D.S. revised the manuscript. All authors have read and agreed to the published version of the manuscript.

Funding

The present work received funding from the Faculty of Environmental Management, Prince of Songkla University, Hatyai, Songkhla, Thailand.

Institutional Review Board Statement

Not applicable.

Informed Consent Statement

Not applicable.

Data Availability Statement

Data sharing not applicable.

Acknowledgments

The authors deeply appreciate the financial support received from the Faculty of Environmental Management, Prince of Songkla University, Thailand.

Conflicts of Interest

The authors declare no conflict of interest.

References

  1. Corley, R.H.; Tinker, P.B. The Oil Palm; John Wiley & Sons: Oxford, UK, 2008. [Google Scholar]
  2. Theerapong, J. The Path to Success is the Production of Palm Oil. Oil Palm Research and Development Center, Faculty of Natural Resources, Prince of Songkla University, 2016. Available online: http://www.natres.psu.ac.th/researchcenter/Palm-Research/menu/pic-book/2559-palmbook.pdf (accessed on 13 September 2019).
  3. Murphy, D.J. The future of oil palm as a major global crop: Opportunities and challenges. J. Oil Palm Res. 2014, 1, 1–24. [Google Scholar]
  4. Nutongkaew, P.; Waewsak, J.; Riansut, W.; Kongruang, C.; Gagnon, Y. The potential of palm oil production as a pathway to energy security in Thailand. Sustain. Energy Technol. Assess. 2019, 1, 189–203. [Google Scholar] [CrossRef]
  5. Naher, L.; Yusuf, U.K.; Ismail, A.; Tan, S.G.; Mondal, M.M. Ecological status of’Ganoderma’and basal stem rot disease of oil palms (‘Elaeis guineensis’ Jacq.). Aust. J. Crop Sci. 2013, 7, 1723. [Google Scholar]
  6. Agricultural Research Development Agency. Diseases and Pests of Economic Importance. Regional Information Library (Southern Region) Office of Agricultural Research Development. 2007. Available online: http://www.arda.or.th/kasetinfo/south/palm/controller/01-05.php (accessed on 22 October 2019).
  7. Office of Agricultural Economics. “Thailand Agricultural Statistics 2016”. Office of Agricultural Economics: Ministry of Agriculture and Cooperatives. 2017. Available online: http://organic.dit.go.th/FILE/CONTENT_FILE/256010251137581209704.pdf (accessed on 18 September 2019).
  8. Agricultural Research Development Agency. Oil Palm. 2018. Available online: http://www.arda.or.th/kasetinfo/south/palm/controller/01-13.php (accessed on 26 September 2018).
  9. Rees, R.W.; Flood, J.; Hasan, Y.; Cooper, R.M. Effects of inoculum potential, shading and soil temperature on root infection of oil palm seedlings by the basal stem rot pathogen Ganoderma boninense. Plant Pathol. 2007, 56, 862–870. [Google Scholar] [CrossRef]
  10. Kamil, N.N.; Omar, S.F. Climate variability and its impact on the palm oil industry. Oil Palm Ind. Econ. J. 2016, 16, 18–30. [Google Scholar]
  11. Paterson, R.R.; Sariah, M.; Lima, N. How will climate change affect oil palm fungal diseases? Crop Prot. 2013, 46, 113–120. [Google Scholar] [CrossRef] [Green Version]
  12. Hushiarian, R.; Yusof, N.A.; Dutse, S.W. Detection and control of Ganoderma boninense: Strategies and perspectives. SpringerPlus 2013, 2, 555. [Google Scholar] [CrossRef] [Green Version]
  13. Stratoulias, D.; Tóth, V.R. Photophysiology and Spectroscopy of Sun and Shade Leaves of Phragmites australis and the Effect on Patches of Different Densities. Remote Sens. 2020, 12, 200. [Google Scholar] [CrossRef] [Green Version]
  14. Santoso, H.; Tani, H.; Wang, X. Random Forest classification model of basal stem rot disease caused by Ganoderma boninense in oil palm plantations. Int. J. Remote Sens. 2017, 38, 4683–4699. [Google Scholar] [CrossRef]
  15. Shafri, H.Z.; Anuar, M.I.; Seman, I.A.; Noor, N.M. Spectral discrimination of healthy and Ganoderma-infected oil palms from hyperspectral data. Int. J. Remote Sens. 2011, 32, 7111–7129. [Google Scholar] [CrossRef]
  16. Shafri, H.Z.; Hamdan, N.; Izzuddin Anuar, M. Detection of stressed oil palms from an airborne sensor using optimized spectral indices. Int. J. Remote Sens. 2012, 33, 4293–4311. [Google Scholar] [CrossRef]
  17. Lelong, C.C.; Roger, J.M.; Brégand, S.; Dubertret, F.; Lanore, M.; Sitorus, N.A.; Raharjo, D.A.; Caliman, J.P. Evaluation of oil-palm fungal disease infestation with canopy hyperspectral reflectance data. Sensors 2010, 10, 734–747. [Google Scholar] [CrossRef] [PubMed]
  18. Liaghat, S.; Ehsani, R.; Mansor, S.; Shafri, H.Z.; Meon, S.; Sankaran, S.; Azam, S.H. Early detection of basal stem rot disease (Ganoderma) in oil palms based on hyperspectral reflectance data using pattern recognition algorithms. Int. J. Remote Sens. 2014, 35, 3427–3439. [Google Scholar] [CrossRef]
  19. Niphadkar, N.P.; Burks, T.F.; Qin, J.; Ritenour, M.A. Estimation of citrus canker lesion size using hyperspectral reflectance imaging. Int. J. Agric. Biol. Eng. 2013, 6, 41–51. [Google Scholar]
  20. Stratoulias, D.; Keramitsoglou, I.; Burai, P.; Csaba, L.; Zlinszky, A.; Tóth, V.R.; Balzter, H. A framework for lakeshore vegetation assessment using field spectroscopy and airborne hyperspectral imagery. Earth Obs. Land Emerg. Monit. 2017, 14, 159. [Google Scholar]
  21. Santoso, H.; Gunawan, T.; Jatmiko, R.H.; Darmosarkoro, W.; Minasny, B. Mapping and identifying basal stem rot disease in oil palms in North Sumatra with QuickBird imagery. Precis. Agric. 2011, 12, 233–248. [Google Scholar] [CrossRef]
  22. Santoso, H.; Tani, H.; Wang, X.; Prasetyo, A.E.; Sonobe, R. Classifying the severity of basal stem rot disease in oil palm plantations using WorldView-3 imagery and machine learning algorithms. Int. J. Remote Sens. 2019, 40, 7624–7646. [Google Scholar] [CrossRef]
  23. Huang, W.; Wang, J.; Wan, H.; Liu, L.; Huang, M.; Wang, J. Monitoring of wheat yellow rust with dynamic hyperspectral data. In Proceedings of the 2004 IEEE International Geoscience and Remote Sensing Symposium, Anchorage, AZ, USA, 20–24 September 2004; Volume 6, pp. 4056–4058. [Google Scholar]
  24. Vigier, B.J.; Pattey, E.; Strachan, I.B. Narrowband vegetation indexes and detection of disease damage in soybeans. IEEE Geosci. Remote Sens. Lett. 2004, 25, 255–259. [Google Scholar] [CrossRef]
  25. Huang, W.; Lamb, D.W.; Niu, Z.; Zhang, Y.; Liu, L.; Wang, J. Identification of yellow rust in wheat using in-situ spectral reflectance measurements and airborne hyperspectral imaging. Precis. Agric. 2007, 8, 187–197. [Google Scholar] [CrossRef]
  26. Xie, C.; Yang, C.; He, Y. Hyperspectral imaging for classification of healthy and gray mold diseased tomato leaves with different infection severities. Comput. Electron. Agric. 2017, 135, 154–162. [Google Scholar] [CrossRef]
  27. Srestasathiern, P.; Rakwatin, P. Oil palm tree detection with high resolution multi-spectral satellite imagery. Remote Sens. 2014, 6, 9749–9774. [Google Scholar] [CrossRef] [Green Version]
  28. Thai Meteorological Department (TMD). Krabi Climate. 2019. Available online: www.krabi.go.th%2Fkrabi2015%2Fmfile%2Fsummary%2Fsummary59.pdf&pdf=true.pdf (accessed on 9 April 2019).
  29. Walaiporn, S.; Supachai, A.; Isiwat, B.; Wit, N.; Kitkamol, P.; Jaruwan, C. Using Remote Sensing for Tangerine (Citrus reticulata Blanco). Thai Agric. Res. J. 2008, 26, 9. [Google Scholar]
  30. Stratoulias, D.; De By, R.A.; Zurita-Milla, R.; Bijker, W.; Tolpekin, V.; Schulthess, U.; Ahmed, Z.U. The potential of very high spatial resolution remote sensing in applications in smallholder agriculture. In Proceedings of the 36th Asian Conference on Remote Sensing, ACRS 2015: Fostering Resilient Growth in Asia, Quezon City, Philippines, 24–28 October 2015. [Google Scholar]
  31. GISTDA. Worldview-2. 2020. Available online: https://www.gistda.or.th/main/system/files_force/satellite/104/file/2534-m-worldview2-datasheet.pdf?download=1.pdf (accessed on 9 September 2019).
  32. WorldView-2. WorldView-2 Satellite Sensor. 2019. Available online: https://www.satimagingcorp.com/satellite-sensors/worldview-2/ (accessed on 4 April 2019).
  33. ASD. ASD Inc HandHeld 2: Hand-Held VNIR Spectroradiometer. 2020. Available online: http://www.labwrench.com/?equipment.view/equipmentNo/28709/ASD-Inc/HandHeld-2--Hand-held-VNIR-Spectroradiometer/ (accessed on 2 February 2020).
  34. ENVI. Atmospheric Correction Module: QUAC and Flaash User Guide v. 4.7; ITT Visual Information Solutions Inc.: Boulder, CO, USA, 2009. [Google Scholar]
  35. Wu, J.; Wang, D.; Rosen, C.J.; Bauer, M.E. Comparison of petiole nitrate concentrations, SPAD chlorophyll readings, and QuickBird satellite imagery in detecting nitrogen status of potato canopies. Field Crop. Res. 2007, 101, 96–103. [Google Scholar] [CrossRef]
  36. Wang, F.M.; Huang, J.F.; Tang, Y.L.; Wang, X.Z. New vegetation index and its application in estimating leaf area index of rice. Rice Sci. 2007, 14, 195–203. [Google Scholar] [CrossRef]
  37. Harjotedjo, S.; Sahari, B.; Palgoenadi, B. Management of oil palm pests and diseases in Indonesia: Learning from the past, adapting for the future. In Proceedings of the 5th MPOB-IOPRI International Seminar, Kuala Lumpur, Malaysia, 16–18 November 2013; pp. 2–23. [Google Scholar]
  38. Huete, A.; Huete, A.R. A soil-adjusted vegetation index (SAVI). Remote Sensing of Environment. Remote Sens. Environ. 1988, 25, 295–309. [Google Scholar] [CrossRef]
  39. Qi, J.; Chehbouni, A.; Huerte, A.R.; Kerr, Y.H.; Sorooshian, S. A Modified Soil Adjusted Vegetation Index: Remote Sensing Environment, v. 48. Available online: http://europepmc.org/article/AGR/IND20402188 (accessed on 4 November 2019).
  40. Tucker, C.J. Red and photographic infrared linear combinations for monitoring vegetation. Remote Sens. Environ. 1979, 8, 127–150. [Google Scholar] [CrossRef] [Green Version]
  41. Jordan, C.F. Derivation of leaf-area index from quality of light on the forest floor. Ecology 1969, 50, 663–666. [Google Scholar] [CrossRef]
  42. Rondeaux, G.; Steven, M.; Baret, F. Optimization of soil-adjusted vegetation indices. Remote Sens. Environ. 1996, 55, 95–107. [Google Scholar] [CrossRef]
  43. Kaufman, Y.J.; Tanre, D. Atmospherically resistant vegetation index (ARVI) for EOS-MODIS. IEEE Trans. Geosci. Remote Sens. 1992, 30, 261–270. [Google Scholar] [CrossRef]
  44. Gitelson, A.A.; Kaufman, Y.J.; Merzlyak, M.N. Use of a green channel in remote sensing of global vegetation from EOS-MODIS. Remote Sens. Environ. 1996, 58, 289–298. [Google Scholar] [CrossRef]
  45. Barnes, E.M.; Clarke, T.R.; Richards, S.E.; Colaizzi, P.D.; Haberland, J.; Kostrzewski, M.; Waller, P.; Choi, C.; Riley, E.; Thompson, T.; et al. Coincident detection of crop water stress, nitrogen status and canopy density using ground based multispectral data. In Proceedings of the Fifth International Conference on Precision Agriculture, Bloomington, MN, USA, 16 July 2000; Volume 1619. [Google Scholar]
  46. Jawak, S.D.; Luis, A.J. A spectral index ratio-based Antarctic land-cover mapping using hyperspatial 8-band WorldView-2 imagery. Polar Sci. 2013, 7, 18–38. [Google Scholar] [CrossRef] [Green Version]
  47. Jensen, J.R. Remote Sensing of the Environment: An Earth Resource Perspective 2/e; Pearson Education India: Delhi, India, 2009. [Google Scholar]
  48. Shafri, H.Z.; Anuar, M.I. Hyperspectral signal analysis for detecting disease infection in oil palms. In Proceedings of the 2008 International Conference on Computer and Electrical Engineering, Phuket, Thailand, 20 December 2008; pp. 312–316. [Google Scholar]
  49. Chemura, A.; van Duren, I.; van Leeuwen, L.M. Determination of the age of oil palm from crown projection area detected from WorldView-2 multispectral remote sensing data: The case of Ejisu-Juaben district, Ghana. ISPRS J. Photogramm. Remote Sens. 2015, 100, 118–127. [Google Scholar] [CrossRef]
  50. Nagaraja, A. Predicting Susceptible Areas of Mango Malformation through Remote Sensing and GIS. Ph.D. Thesis, Indian Agricultural Research Institute, an Institutional Repository of Indian National Agricultural Research System, New Delhi, India, 2009. [Google Scholar]
  51. Thirada, Y.; Anan, K.; Krerkchai, T. Application of THEOS Satellite Images in Age-classified Estimation of Rubber Wood Stock: A Case Study of Utapao Basin, Songkhla Province. J. Remote Sens. GIS Assoc. Thail. 2011, 12, 28–42. [Google Scholar]
  52. Apan, A.; Datt, B.; Kelly, R. Detection of pests and diseases in vegetable crops using hyperspectral sensing: A comparison of reflectance data for different sets of symptoms. In Proceedings of the 2005 Spatial Sciences Institute Biennial Conference 2005: Spatial Intelligence, Innovation and Praxis (SSC2005), Melbourne, Australia, 12–16 September 2005; pp. 10–18. [Google Scholar]
  53. Shafri, H.Z.; Hamdan, N. Hyperspectral imagery for mapping disease infection in oil palm plantationusing vegetation indices and red edge techniques. Am. J. Appl. Sci. 2009, 6, 1031. [Google Scholar]
  54. Dehvari, A.; Heck, R.J. Comparison of object-based and pixel based infrared airborne image classification methods using DEM thematic layer. J. Geogr. Reg. Plan. 2007, 2, 086–096. [Google Scholar]
  55. Sunsai, S.; Kampanart, P.; Janjira, P. Comparison Classification Procedure between Pixel-Based and Object-Based Image Classification Methods Using Thaichote Satellite Pan-Sharpening Imagery. In Proceedings of the 4th Naresuan Conference on Natural Resources, Geoinformation, Phitsanulok, Thailand, 14–16 January 2014. [Google Scholar]
  56. González-Fernández, A.B.; Rodríguez-Pérez, J.R.; Marcelo, V.; Valenciano, J.B. Using field spectrometry and a plant probe accessory to determine leaf water content in commercial vineyards. Agric. Water Manag. 2015, 156, 43–50. [Google Scholar] [CrossRef]
  57. Gausman, H.W. Reflectance of leaf components. Remote Sens. Environ. 1977, 6, 1–9. [Google Scholar] [CrossRef]
  58. Slaton, M.R.; Raymond Hunt, E., Jr.; Smith, W.K. Estimating near-infrared leaf reflectance from leaf structural characteristics. Am. J. Bot. 2001, 88, 278–284. [Google Scholar] [CrossRef] [PubMed]
  59. Dislich, C.; Keyel, A.C.; Salecker, J.; Kisel, Y.; Meyer, K.M.; Auliya, M.; Barnes, A.D.; Corre, M.D.; Darras, K.; Faust, H.; et al. A review of the ecosystem functions in oil palm plantations, using forests as a reference system. Biol. Rev. 2017, 92, 1539–1569. [Google Scholar] [CrossRef] [PubMed]
Figure 1. Geographical location and map of the study area in Khlong Thom-Tai district, Krabi province, Thailand. Areas 1 and 2 are the sampling areas and contain both healthy and diseases oil palm trees.
Agriculture 11 00251 g001
Figure 2. Canopy and leaf samples of a diseased oil palm tree (generalized symptoms independent of the disease) (upper insets) (A,B) and healthy oil palm tree (i.e., no foliar symptoms) (lower insets) (C,D). Photo credit: Rachane Malinee.
Agriculture 11 00251 g002
Figure 3. Samples of the 7 classes selected for the supervised classification scheme; (A) Para rubber tree, (B) Road, (C) Soil, (D) Building, (E) Water, (F) Non-diseased oil palm, (G) Diseased oil palm.
Agriculture 11 00251 g003
Figure 4. Flowchart of the methodology followed in the current study.
Agriculture 11 00251 g004
Figure 5. Mean (curved line) and standard deviation (shaded area) radiance of diseased (solid curve) and healthy (dashed curve) oil palm tree samples. In total, 49 diseased and 60 healthy samples were used to derive the statistics.
Agriculture 11 00251 g005
Figure 6. Geo-location of diseased (red circle) and healthy oil palm trees (blue circle) on which hyperspectral samples with an Field Spec Handheld spectroradiometer were collected in Area 1 (A) and Area 2 (B) in Khlong Thom-Tai Krabi, Thailand.
Agriculture 11 00251 g006
Figure 7. Visualization of the spectral vegetation indices (NDVI, NDRE, SRI and GBNDVI).
Agriculture 11 00251 g007
Figure 8. Visualization of the spectral vegetation indices (SAVI, ARVI, OSAVI and GNDVI).
Agriculture 11 00251 g008
Figure 9. Statistical distribution of the vegetation indices values of the pixels encompassing the palm oil trees sampled. All 113 samples from Areas 1 and 2 were taken into account cumulatively for each case. Boxes encompass the 25% and 75% quartiles of each dataset, the bars represent the 95% confidence intervals, the central solid line represents the median, and the dots represent outliers.
Agriculture 11 00251 g009
Figure 10. Thematic map of the maximum likelihood supervised classification result.
Agriculture 11 00251 g010
Table 1. Spectral, spatial and radiometric characteristics of the sensors onboard WorldView-2 satellite.
Band No.Band Wavelength Range (nm)Central Wavelength (nm)Spatial Resolution (m)
Panchromatic
Panchromatic450–8006250.5
Multispectral
1Coastal397–4544252
2Blue445–5174812
3Green507–5865462
4Yellow580–6296042
5Red626–6966612
6Red Edge698–7497232
7Near-IR1765–8998322
8Near-IR2857–10399482
Table 3. Error matrix of the maximum likelihood classification. Percentage comparing results of data mixing in each data type by pixel based classification technique.
ClassRoadWaterBuildingPará Rubber TreeSoilHealthy Oil PalmDiseased Oil PalmTotalAccuracy
Commission
(%)
Omission
(%)
Producer’s Accuracy (%)User’s Accuracy (%)
Road97.440.3934.660.003.450.000.002.3855.972.5697.4444.03
Water0.0098.460.000.000.000.000.000.490.001.5498.46100
Building1.011.1561.570.012.060.000.001.4832.3138.4361.5767.69
Pará rubber tree0.000.000.2584.340.3816.6710.5363.000.1415.6684.3499.86
Soil1.560.003.460.2992.480.000.0020.831.387.5292.4898.62
Healthy oil palm0.000.000.008.160.0683.3310.536.1099.9816.6783.330.02
Diseased oil palm0.000.000.057.211.570.0078.955.7399.9921.0578.950.01
Overall accuracy85.98%
Kappa coefficient0.71 (71%)
Publisher’s Note: MDPI stays neutral with regard to jurisdictional claims in published maps and institutional affiliations.

