1. Introduction
Chinese cabbage (
Brassica rapa, Chinensis group), featuring high nutritional quality and mild flavor, has long been popular in China [
1,
2]. To protect the crop from pests and to increase the yield, farmers have long been using pesticides. In the past century, pyrethroids, including lambda-cyhalothrin, have been common pesticides to raise cabbage and other crops’ production [
3,
4]. However, excess pyrethroid residue is harmful to mammals [
4]. Researchers have found that there is a higher risk for children, ages 3–11, to develop neurological and developmental diseases if they consumed foods with excess pyrethroid residues frequently [
4,
5].
Detection of pesticide residues in food has long been in demand [
6]. Traditionally, gas chromatography [
7], liquid chromatography and its modified version, combined with another extraction method [
8], were used. For higher sensitivity, tandem mass spectrometry is preferred [
9]. Solid phase microextraction (SPME) was employed to determine 10 triazole fungicides in grapes [
10]. Gas chromatography–mass spectrometry (GC-MS) was employed to quantitatively detect pesticides in propolis, and triadimefon was found in most samples [
11]. Although these methods are relatively sensitive and accurate, they require multistep sample preparation, and the processes are time-consuming as well as expensive [
12].
In order for foods to be widely tested for pesticide residues, it is important that the methods used are fast and economical. At present, enzymatic inhibition methods and spectroscopy technologies are most often used. Based on an enzyme inhibition and heat generation method, a multilayer paper chip was proposed to detect organophosphorus and carbamate residues on vegetables and fruits [
13]. Spectroscopy technologies have great potential in the field of food pesticide residue detection due to their low cost and ease of quantification [
14]. Each pesticide has unique spectra in the near-infrared (NIR) and mid-infrared (MIR) wavelength ranges. The unique spectra are due to the pesticides’ molecular structure induced vibration and rotation modes. Mid-infrared spectroscopy or Raman spectroscopy are often used to identify specific chemical components [
15]. The information collected by the spectrometer can be used for qualitative and quantitative analyses [
16]. Near infrared spectroscopy, transmission spectroscopy, polarization spectral detection technology, chlorophyll fluorescence spectra, and hyperspectral technique were demonstrated to detect triadimefon in propolis [
11], fenvalerate and triazoline on lettuce leaves [
17], five different types of organophosphorus pesticides on lettuce leaves [
18], dimethoate on lettuce [
19] and fenvalerate as well as triazoline on lettuce [
20], respectively. To process the near infrared hyperspectral image information, researchers employed chemical molecular structure coupled with wavelet transform to find the most influential wavelength [
21]. Then, these authors were able to detect five kinds of pesticides (dimethoate, acephate, phoxim, dichlorvos, and avermectin) [
21]. Mid-infrared spectroscopy has also been applied to identify tea varieties, and the accuracy rate was 96.3% because of its high specificity [
16]. In the following, we apply MIR spectroscopy, for the first time, to the detection of lambda-cyhalothrin residues on Chinese cabbages.
Fuzzy Foley-Sammon transformation (FFST), fuzzy linear discriminant analysis (FLDA), and fuzzy uncorrelated discriminant transformation (FUDT) are used in processing data and resolving component information of samples. FFST combined with an E-nose system has been employed to classify Chinese vinegar and reached an identification accuracy rate as high as 96.92% [
22]. FLDA was efficient in classifying some Romanian and German mineral waters with an accuracy as high as 88% [
23]. FUDT was applied to extract the feature information in images of synthetic aperture radar (SAR) [
24]. In this study, FLDA, FFST, and FUDT were applied to detect lambda-cyhalothrin on Chinese cabbages and the performance of these different algorithms was compared.
In this work, the MIR technique, combined with the pattern recognition algorithms, was evaluated for the qualitative analysis of lambda-cyhalothrin residues on Chinese cabbages. The specific objectives are as follows: (1) to establish the feature extraction model FLDA, FFST, and FUDT and the supervised classification model kNN of the spectroscopic analysis; (2) to compare the performance of the three different pattern recognition algorithms, FLDA, FFST, and FUDT in detecting lambda-cyhalothrin residues on Chinese cabbage.
2. Materials and Methods
2.1. Sample Preparation
Fresh Chinese cabbage samples were bought from a supermarket in Zhenjiang, China. All samples were first washed with water (45 °C) to remove pesticide residues left on the sample surfaces. This was done to prevent the data from being contaminated, and to eliminate the possible presence of pesticides other than lambda-cyhalothrin on the Chinese cabbage. The samples were divided into four groups.
Lambda-cyhalothrin pesticide (5% EC, Shandong Shenda Crop Science Co. Ltd., Shouguang, China) was used. The lambda-cyhalothrin was mixed with water at ratios of 1:500, 1:100, and 1:20. Lambda-cyhalothrin pesticide mixtures at each dilution ratio were sprayed onto the surfaces of one group of Chinese cabbage leaves. One group that did not have any pesticide sprayed on it served as the reference group. Samples that were sprayed with the 1:500 mixture were called the mildly contaminated group. Similarly, the samples sprayed with the 1:100 mixture and the 1:20 mixture were called the moderately contaminated and the seriously contaminated groups, respectively.
Each group of samples was measured with a spectrometer.
2.2. Spectral Data Acquisition
An Agilent Cary 630 FTIR Spectrometer with data collection software (Microlab PC and Resolutions Pro) was used in this study. The prepared samples were well ventilated and cooled for 24 h so that the influence of water on the spectra could be minimized. Afterwards, the samples of Chinese cabbage leaves were cut into pieces of about 2 mm × 2 mm. Each group had about 40 pieces (total 160 pieces) for spectra collection.
The spectrometer was set to ATR (attenuated total reflection) mode and was calibrated with the scanning times at 64. The wavenumber range was between 590–4289 cm−1 with a resolution of 8 cm−1. The diamond crystal surface was cleaned with anhydrous alcohol. The background spectra were collected first. The samples’ spectra were collected after subtracting the background spectra. We collected 40 spectra from 40 pieces of cabbage leaves in each group. Each spectrum had 971 points. Among the spectra collected, 22 spectra in each group were picked to train the supervised model (total 88 spectra) and another 18 spectra were picked to test the model’s performance of feature extraction and classification (total 72 spectra).
2.3. Spectral Processing Method
By analyzing the spectra of the Chinese cabbage samples, we can resolve the component information. However, the original spectra can be easily influenced by the physical properties of the samples. Because of scatter, the baseline may drift and this exerts a negative influence on the performance of classification results [
25]. In order to eliminate physical light scatter and raise the signal to noise ratio, multiplicative scatter correction (MSC) was used in previous work [
26]. As in this prior research, we used MSC to correct each experimental spectrum by subtracting the reference spectrum. This minimized the influence of baseline drift.
2.4. Principle Component Analysis
Principle component analysis (PCA) is an unsupervised method used to decrease the dimensions of data and obtain primary features. Although some information may be lost in the reduction, the most important information can be retained and noise can be eliminated. Meanwhile, the curse of dimensionality can be avoided, and the processing speed can be increased because of the fewer dimensions. When PCA is conducted on the data, it is common practice to select principle components that make larger contributions to the spectra. The larger the contribution is, the more component information can be reserved [
22]. Considering the advantages of PCA, we employed it to process the spectral data after conducting SNV and MSC.
2.5. Feature Extraction Algorithms
In this study, three feature extraction algorithms (FFST, FLDA, and FUDT) combined with fuzzy theory were used to obtain the component information in the samples’ spectral data. We introduce the concept of fuzzy membership value to represent the degree that one sample belongs to a certain class. Although one sample can be related to two or more classes because its fuzzy membership values of the related classes do not equal zero, the class of the sample is defined by the highest fuzzy membership value it possesses. Let
, be a set of q-dimensional samples. The fuzzy membership value can be calculated as follows:
In this equation, is the fuzzy membership value of the k-th sample belonging to the i-th class and c is the number of classes. here is the mean value of samples in class i.
2.5.1. Fuzzy Linear Discriminant Analysis
FLDA aims to minimize the distances between samples in the same class while maximizing the distances between samples in different classes. Computers can achieve this by projecting the spectra data to a lower dimension through the equations below [
23].
The Fisher optimal discriminant function is:
Equation (2) can be solved as an eigenvalue problem:
where
is the fuzzy between-class scatter matrix:
is the fuzzy within-class scatter matrix:
In Equations (4) and (5),
n is the number of training samples and
m (
m > 1) is the weight index, while
is the mean of the training samples:
Based on the calculations above, the discriminant values and their corresponding discriminant vectors can be obtained. The bigger the discriminant value is, the better it can represent the whole data. Hence, with the data projected to the selected discriminant vectors, most information can be reserved for further processing.
Fuzzy linear discriminant analysis can be described in the following steps:
1. Fuzzify the data and determine membership values with Equation (1).
2. Obtain the discriminant values and their corresponding discriminant vectors, and then sort them in descending order
. The following linear transformation projects the data from
to
:
2.5.2. Fuzzy Foley-Sammon Transformation
In contrast to LDA, orthogonal and unitization constrains were added when maximizing the Fisher optimal discriminant function [
27]. Using the method of Lagrange multipliers, a recursive expression can be obtained. Discriminant vectors on which the data are projected can be calculated from the recursive expression. Combined with fuzzy theory, FFST was developed based on FST [
22].
In fuzzy linear discriminant analysis, the vector
can be obtained by solving the following equation:
Equation (8) can be solved as an eigenvalue problem:
where
is the fuzzy total class scatter matrix:
is the eigenvector corresponding to maximum eigenvalue
. Let the unit vector
be the first vector of the set of fuzzy Foley-Sammon optimal discriminant vectors. Suppose the first
optimal discriminant vectors of FFST
(
≥ 1) are obtained. The next vector
which maximizes Equation (8), can be computed with the following orthogonality constraint and recursive expression:
where
.
I is a unit matrix.
and
are the eigenvector and corresponding eigenvalue, respectively.
Fuzzy Foley-Sammon transformation can be described in the following steps:
1. Fuzzify the data and determine membership values with Equation (1).
2. Obtain the FLDA vector corresponding to the maximum discriminant value of Equation (9). This is the first vector in the set of fuzzy Foley-Sammon optimal discriminant vectors.
3. Suppose the first optimal discriminant vectors of FFST ( ≥ 1) are obtained. The next step is to calculate the following vector according to Equation (13).
4. Based on the above calculations, the optimal discriminant vectors
can be obtained. The following linear transformation projects the data from
to
:
2.5.3. Fuzzy Uncorrelated Discriminant Analysis
After the data are projected onto the directions of the discriminant vector set using FST, it is proven that any two features are statistically correlated [
28]. In order to obtain uncorrelated features after projection (better classification results can be obtained using uncorrelated features), extra constrains were proposed in uncorrelated discriminant transformation (UDT) [
28]. It was found that UDT was more effective than FST during classification [
29]. In light of the previous work, FUDT was used to extract the fuzzy features of synthetic aperture radar images [
24].
Fuzzy discriminant analysis is also used to find the vector
by solving Equation (8) as an eigenvalue problem.
is the eigenvector corresponding to maximum eigenvalue
. Let the unit vector
be the first vector of the set of fuzzy uncorrelated optimal discriminant vectors. Suppose the first
optimal discriminant vectors of FUDT
(
≥ 1) are obtained. The next vector
,which maximizes Equation (8), can be computed with the following constraints and the recursive expression:
where
.
I is a unit matrix.
and
are the eigenvector and corresponding eigenvalues, respectively.
Fuzzy uncorrelated discriminant transformation (FUDT) can be described in the following steps:
1. Fuzzify the data and determine membership values and centroids with Equation (1).
2. Obtain the FLDA vector corresponding to the maximum eigenvalue of Equation (9). This is the first vector in the set of fuzzy uncorrelated optimal discriminant vectors.
3. Suppose the first optimal discriminant vectors of FUDT ( ≥ 1) are obtained. The next vector can be calculated in light of Equation (17).
4. Based on the above calculations, the optimal discriminant vectors
can be obtained. The following linear transformation projects the data from
to
:
2.6. Classification Algorithm
In this study,
k-nearest neighbor (
kNN) was employed as the classifier because of its simplicity and good performance. Given a data space in which all the data points are labeled, the class of an unknown sample is determined by the classes of its
k nearest neighbors. The Euclidian distance is used to define the distances between the unknown sample and the labeled data points. The class of the unknown sample depends on the majority class of its nearest neighbors, while
k is always set to odd to avoid the same votes from different classes [
30].
3. Results
3.1. Spectral Data Processing
In this study, the wavenumber range of collected spectra was 590–4289 cm
−1 and the whole spectra data were used. In
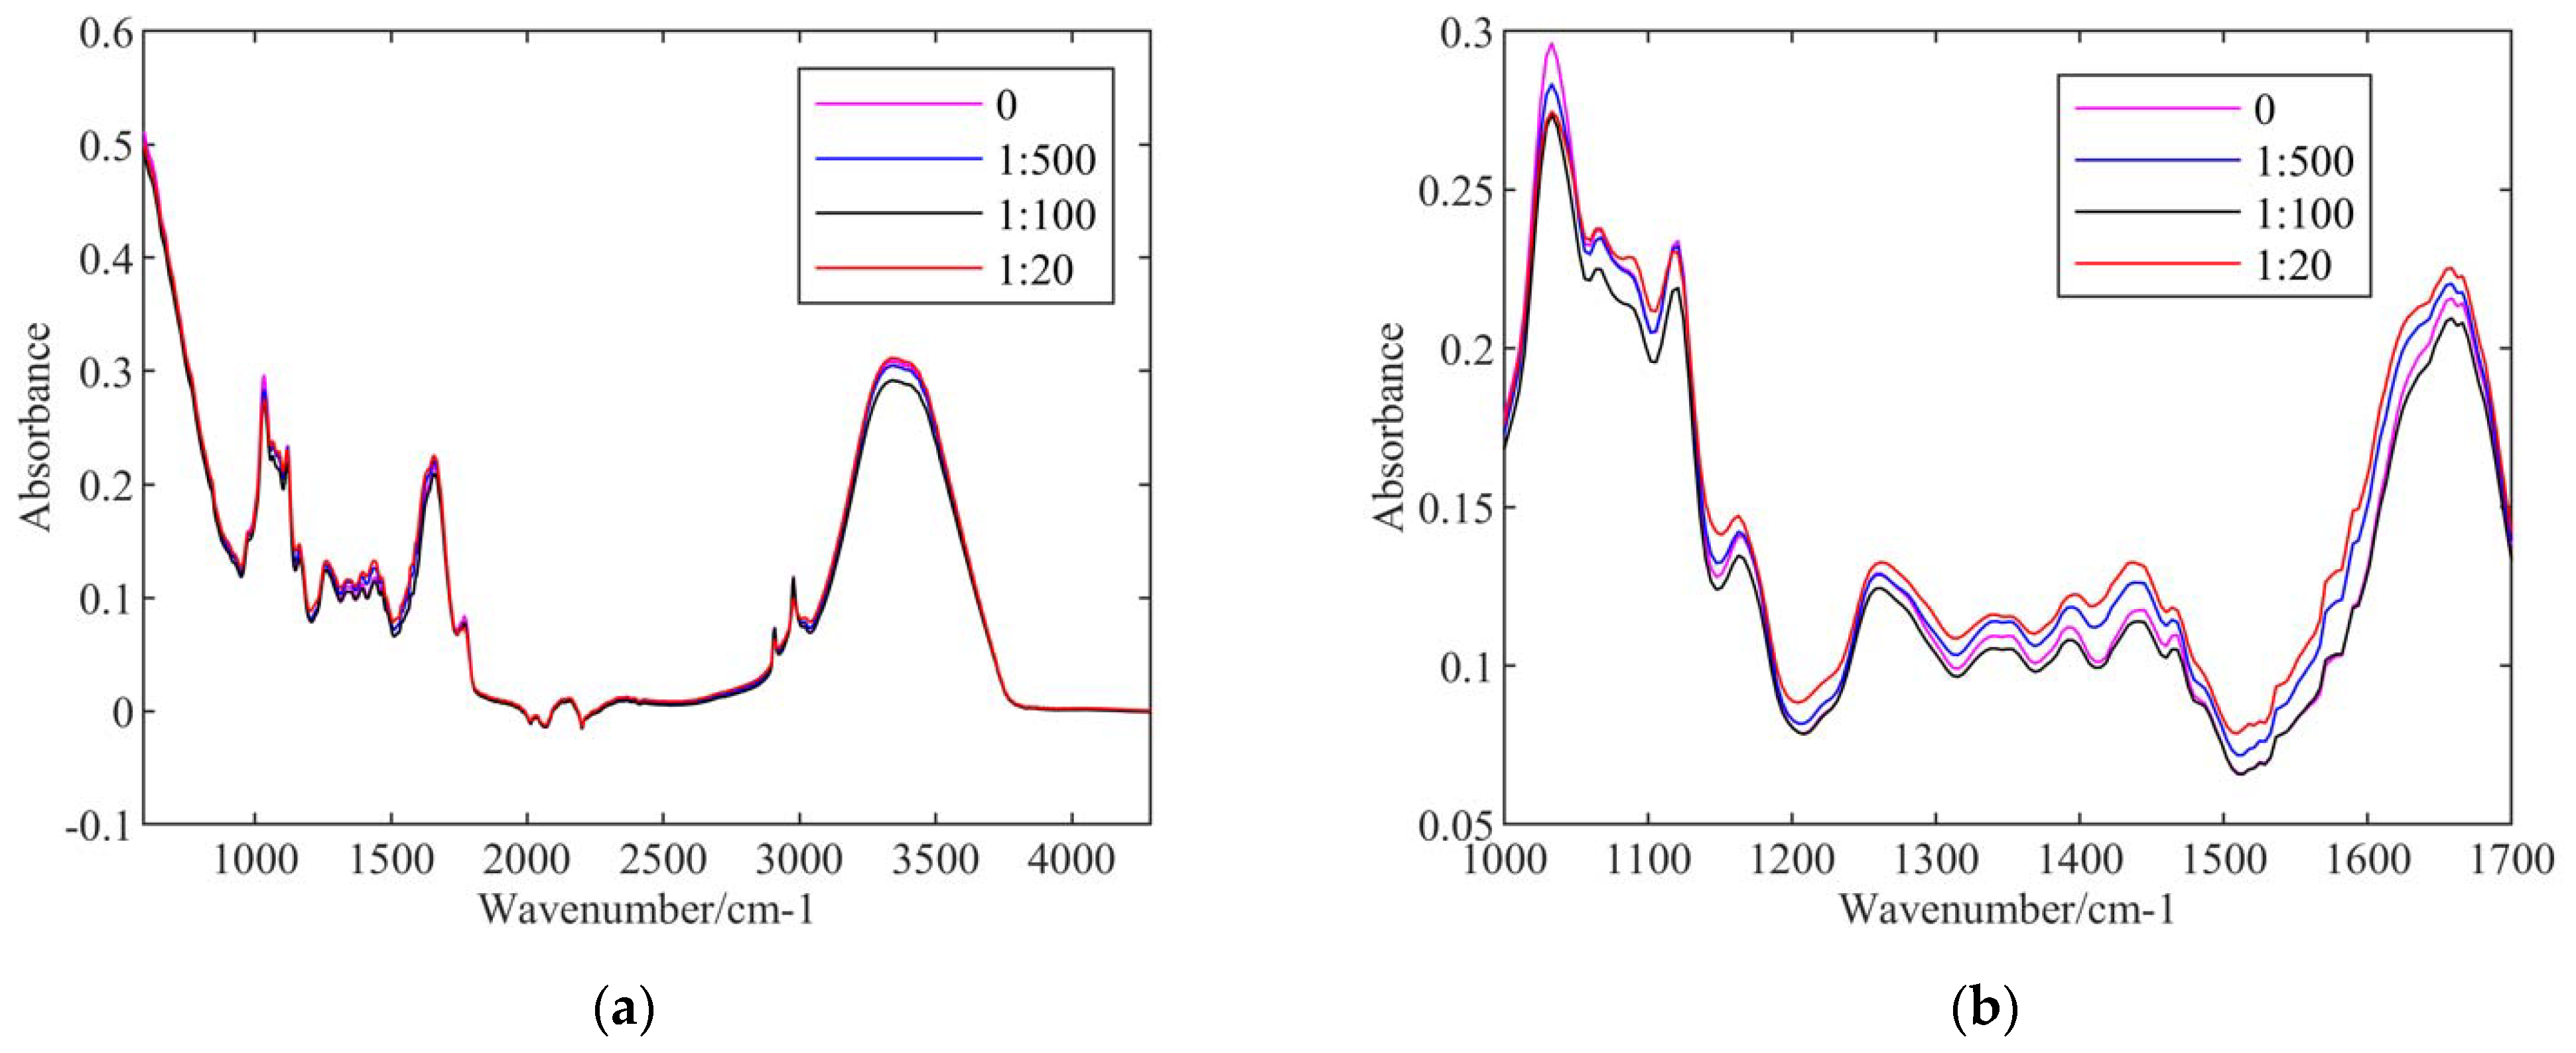
Figure 1, the first group of samples was the control, which were not sprayed with lambda-cyhalothrin. The other three groups of samples were sprayed with lambda-cyhalothrin/water ratios of 1:500, 1:100, and 1:20.
Figure 1a shows the average spectra of these four groups of samples. They show the most differences among themselves in the range of wavelengths from 1000 cm
−1 to 1700 cm
−1, and from 3000 cm
−1 to 3500 cm
−1. To improve visualization, we enlarged the average spectra in the range of wavelengths from 1000 cm
−1 to 1700 cm
−1 in
Figure 1b. The differences in the spectral data made it possible to classify samples with different concentrations of lambda-cyhalothrin residues.
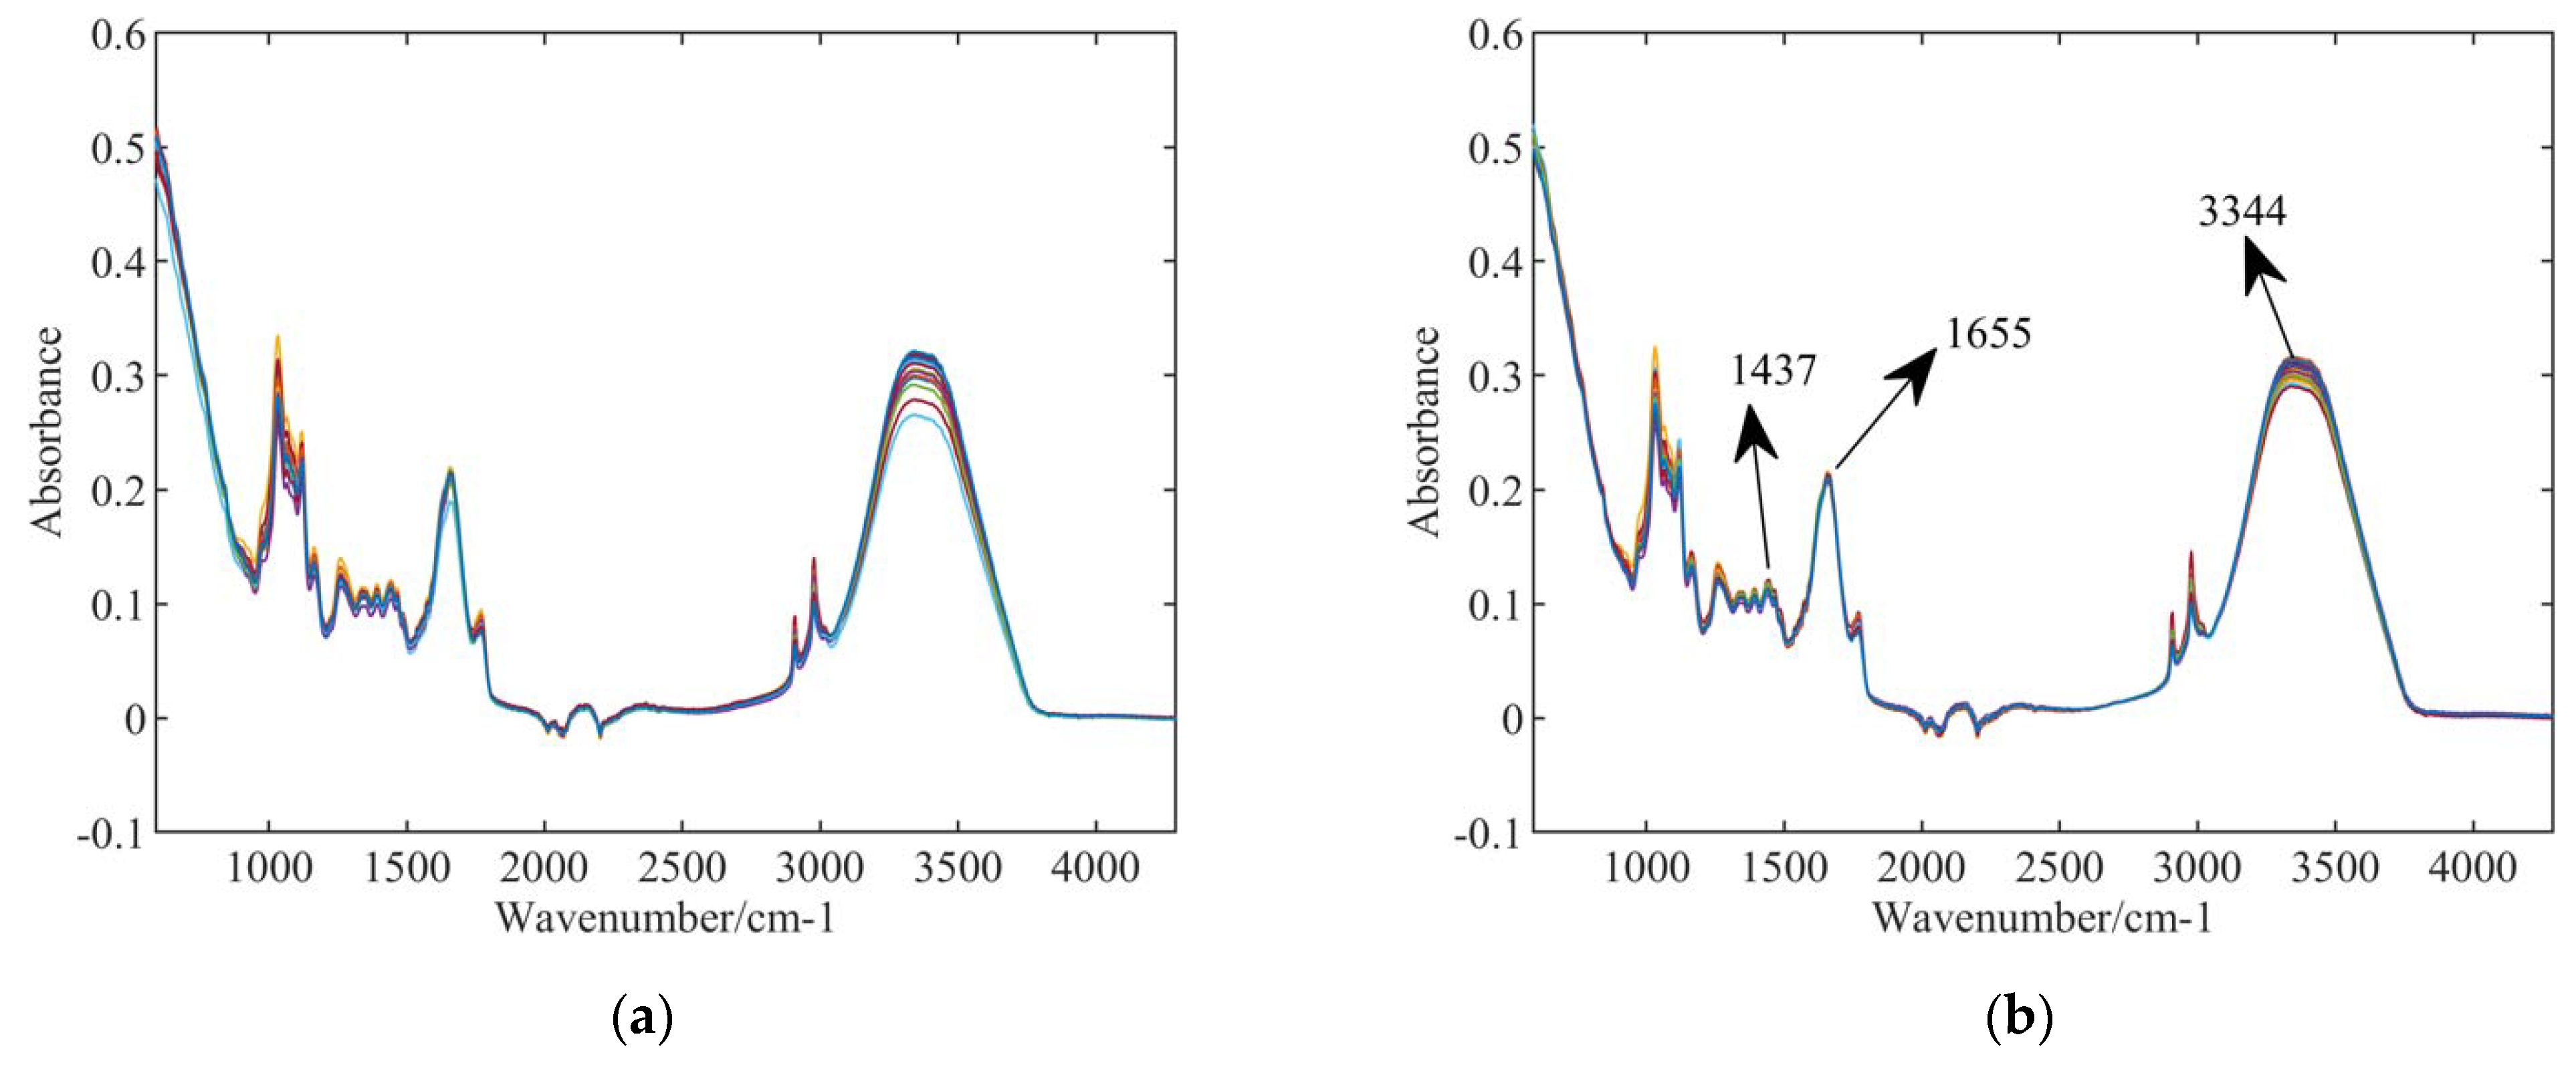
Figure 2 compares the original data and the data processed by MSC.
Figure 2a,b show the spectra of samples in the first group (samples without pesticide) without and with MSC processing method. Compared to the raw spectra, the within-class variance was decreased, especially at the locations of the absorption peaks (1437 cm
−1, 1655 cm
−1, 3344 cm
−1, etc.). This improves the recognition rate of the spectra.
After MSC processing, standard normal variate (SNV) was used. The data were first subtracted by the mean value of the whole data, and then divided by their standard deviations, which makes the mean value zero and moves the central point of the data to the original point. This process was used in preparation for PCA, in order to avoid the disparity between magnitudes and ensure the significance of principle components.
3.2. Principle Component Analysis
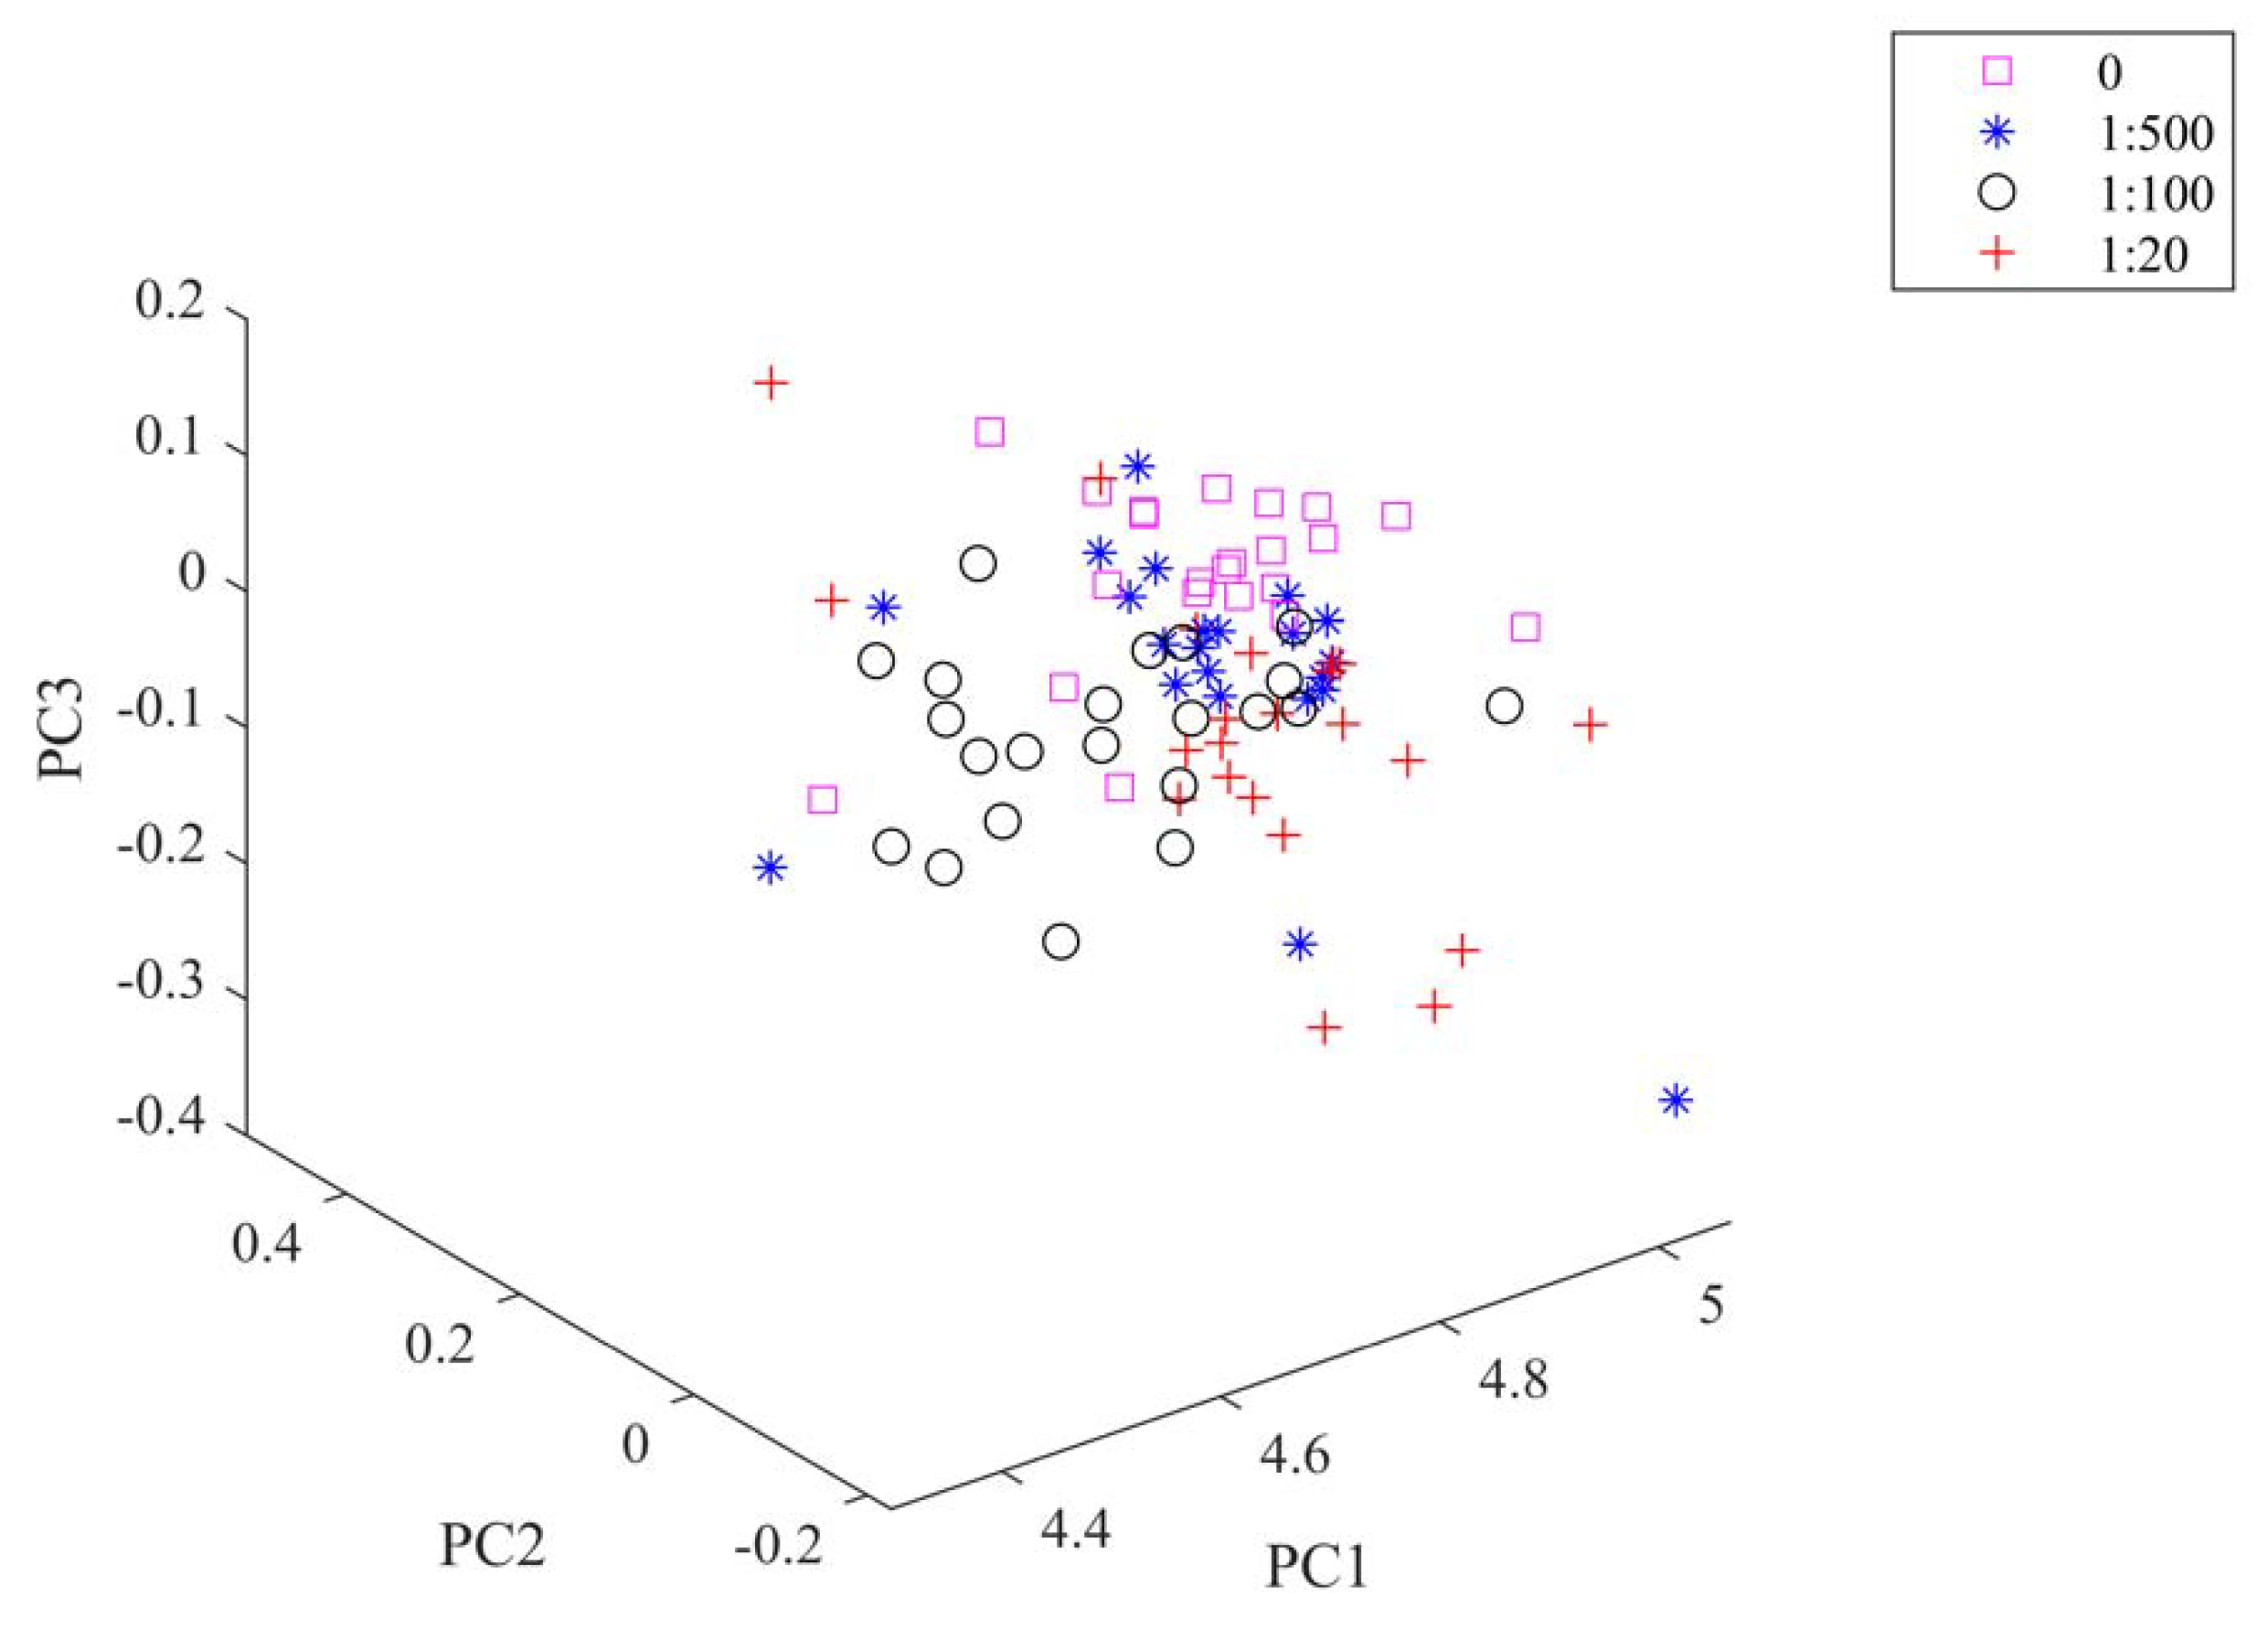
To carry out the analysis, eigenvalues and corresponding eigenvectors of the covariance matrix were calculated. After that, eigenvalues were sorted in descending order. According to the input number of eigenvalues, the eigenvectors corresponding to the selected eigenvalues became the direction in which the training and test data were projected. In this study, the number of eigenvalues was 27 and the data dimensions were compressed from 971 to 27. The total contribution of the 27 principle components is 99.67%. This indicates that almost all of the spectra information is included in the compressed data. Meanwhile, this compression increases the computing speed. In
Figure 3, the first principle component (PC1), the second principle component (PC2), and the third principle component (PC3) explained 57.55%, 22.81%, and 10.98% of the total variance. These three accounted for 91.34% of the total variance.
3.3. Calculation of Fuzzy Membership
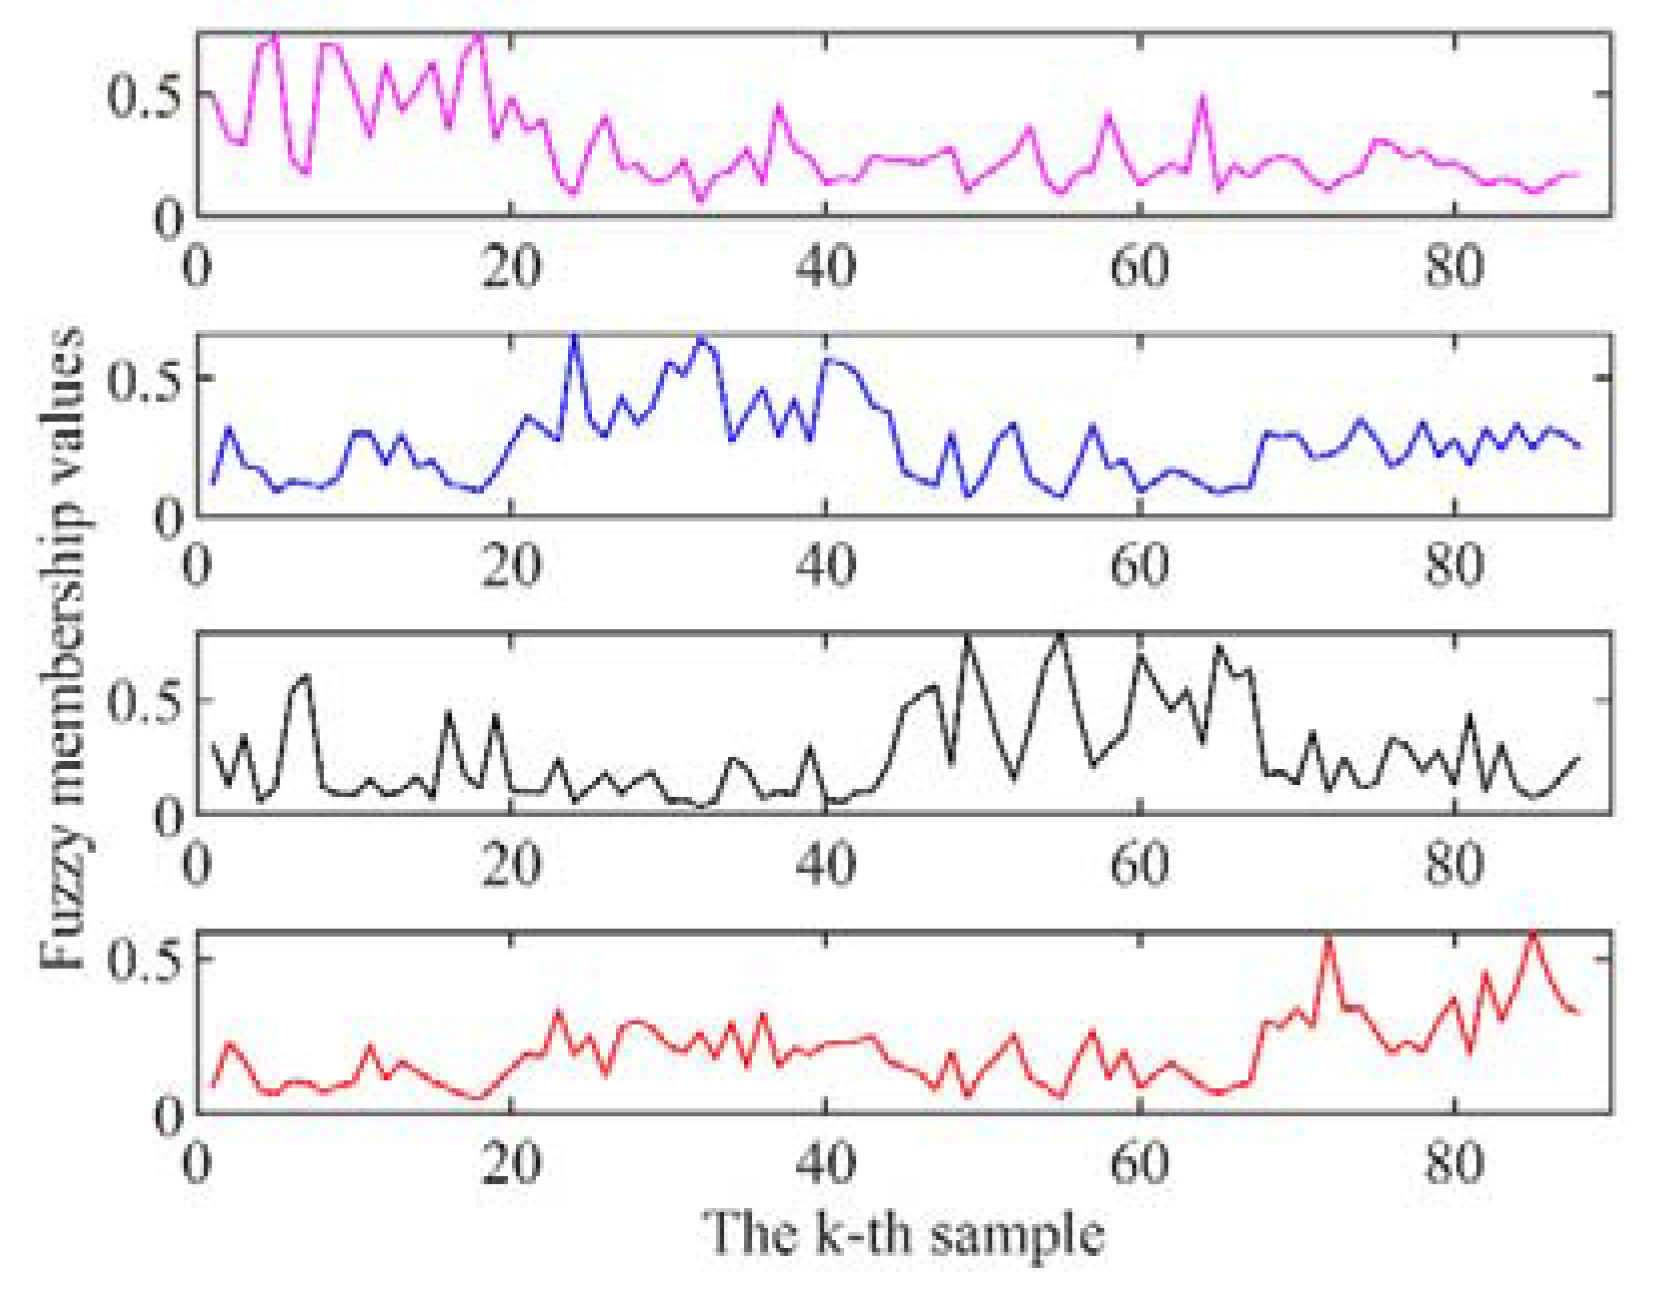
Before applying FFST, FLDA, and FUDT, the fuzzy membership values were calculated according to Equation (1) and plotted in
Figure 4.
From top to bottom, the four subplots represent the samples’ membership values belonging to the four classes. The top (control group) does not have any pesticide residues on the cabbage leaf sample. The ratio of lambda-cyhalothrin and water is 1:500, 1:100, and 1:20, respectively, from the second to the fourth rows. The abscissa is the
k-th sample in the training set and the ordinate is the fuzzy membership value of samples. The class of a sample depends on its maximum membership value. If the maximum membership value of a sample belongs to the
i-th class, this sample belongs to the
i-th class. Thus, the most important differences among the plots is in which interval on the abscissa they have the highest value compared to the other three. This is important for the accurate classification of each sample. In
Figure 4, it is shown that most samples’ fuzzy membership values match with the class they belong to correctly. This can be helpful when conducting the classification algorithms FFST, FLDA, and FUDT.
3.4. Feature Extraction and Data Classification
FFST, FLDA, and FUDT were used to extract the features in the fuzzified training data. The basic idea of these algorithms is to maximize the between-class distances and to minimize the within-class distances. Through mathematical transformation, the training data were projected to a new space. In this space, the distances between samples with the same amount of pesticide were smaller, while the space between samples with different amounts of pesticide were larger. Then, the data in the test set were projected to the same space. Finally, kNN was applied to determine the amount of pesticide on samples in the test set. For an unknown sample, its amount of pesticide residue depends on that of its k nearest known training set samples. The performance of FLDA-kNN, FFST-kNN, and FUDT-kNN models were evaluated by calculating the proportion of samples in the test set (72 spectra) that were correctly classified. To establish the FLDA, FFST, and FUDT models and the kNN model, several parameters have to be determined. These parameters are the number of eigenvectors, the weight exponent m when computing the center of clustering, the number of discriminant vectors, and the value of k. The number of eigenvectors when applying PCA influences the amount of information retained and the same is true with the number of discriminant vectors in FFST and FUDT. The weight exponent m affects the center of clustering. Usually, the number of discriminant vectors is set to c-1, while c is the number of sample classes. Since the calculation was not complex, the enumeration method was employed. Fixing two parameters, m and k, we changed the number of eigenvectors to learn how the classification accuracy rate changes. Then the same method was used with m and k. To reduce the computational load, we created a plot to explore how the classification accuracy rates change when the parameters are changed.
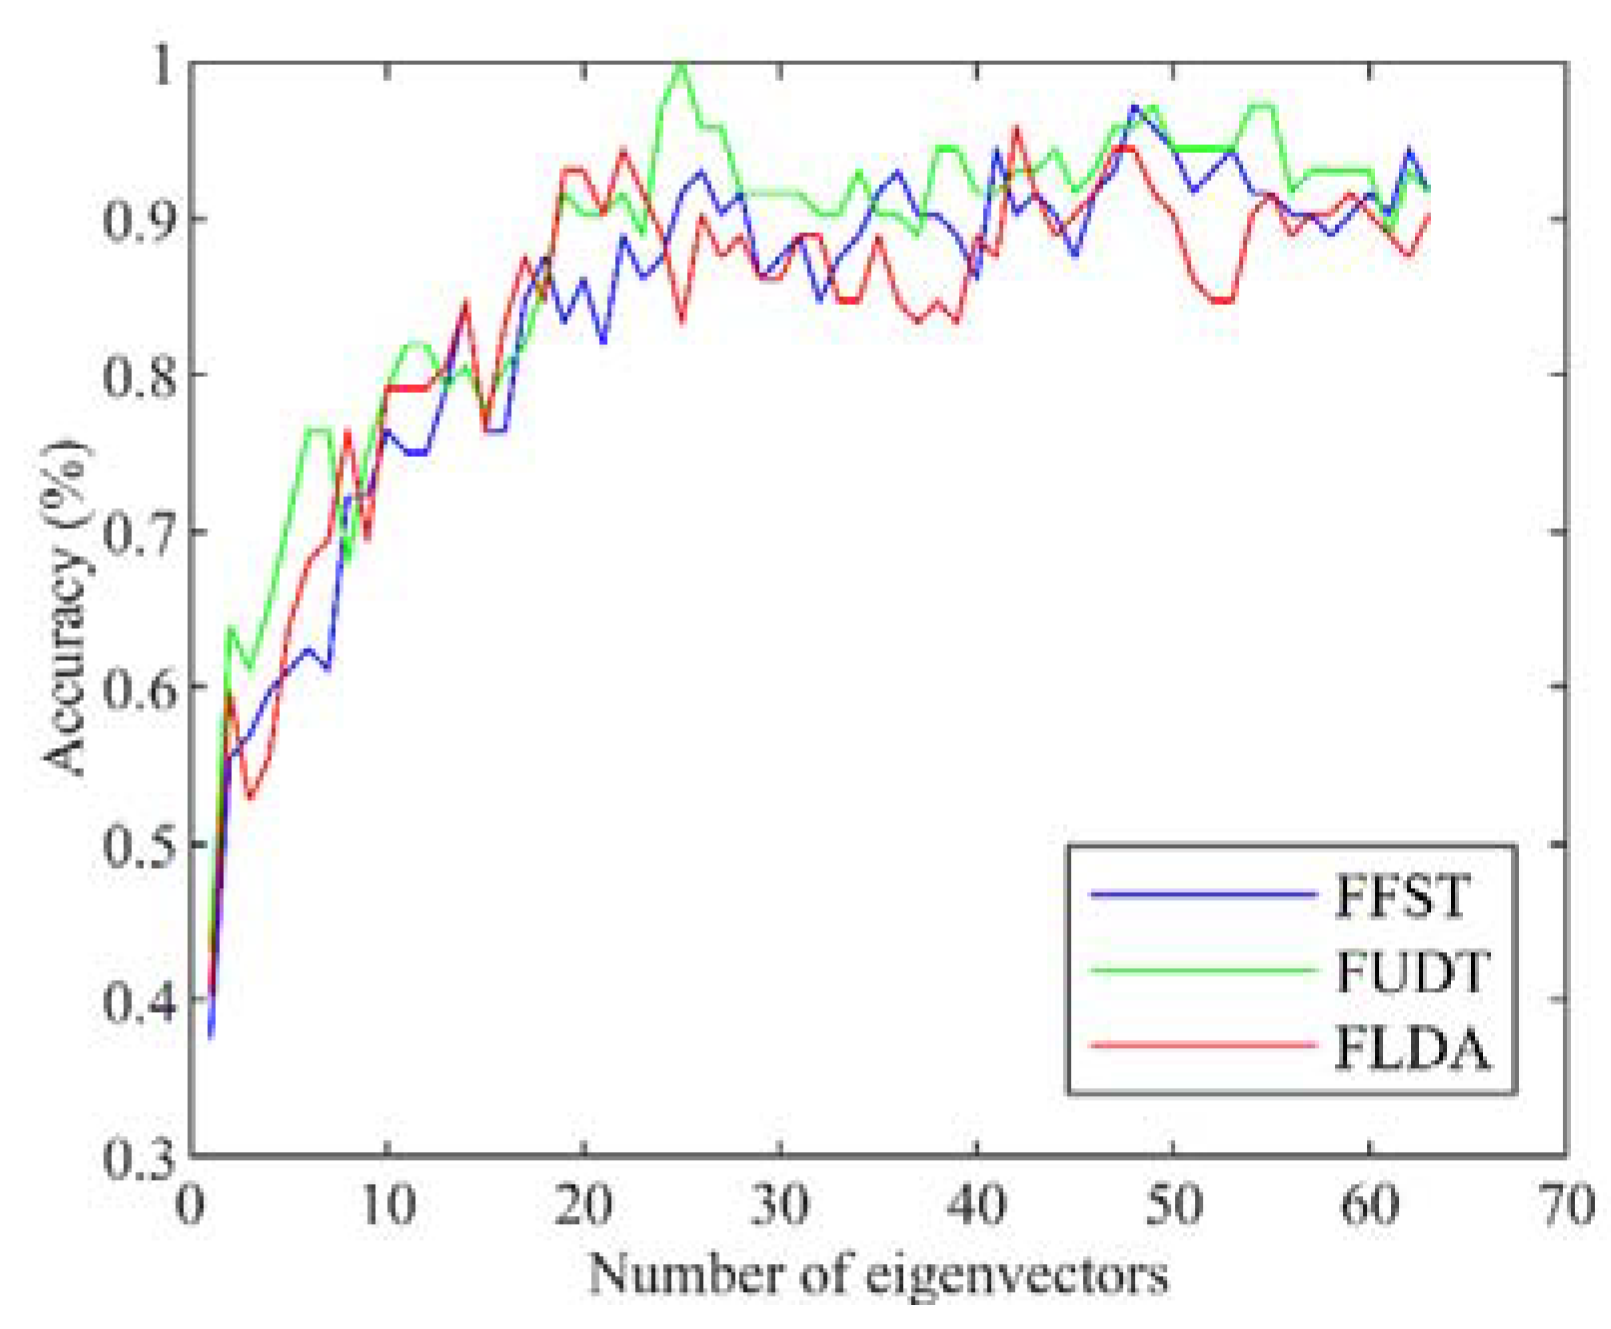
Figure 5 illustrates the performance of FFST, FUDT, and FLDA combined with
kNN on the test set. Although the lines fluctuate, the graph shows that the accuracy rates keep rising rapidly before reaching a plateau. This can be explained by the principle of PCA. Since several eigenvectors associated with bigger eigenvalues make a higher contribution, and usually the space formed by such eigenvectors can represent the data very well, those computed from smaller eigenvalues are meaningless and have low influence on the results of classification. Thus, the figure implies that only the first 30 eigenvectors are meaningful in the enumeration process.
When it comes to the influence of
m and
k on the results, the accuracy rates decrease when
m and
k increase.
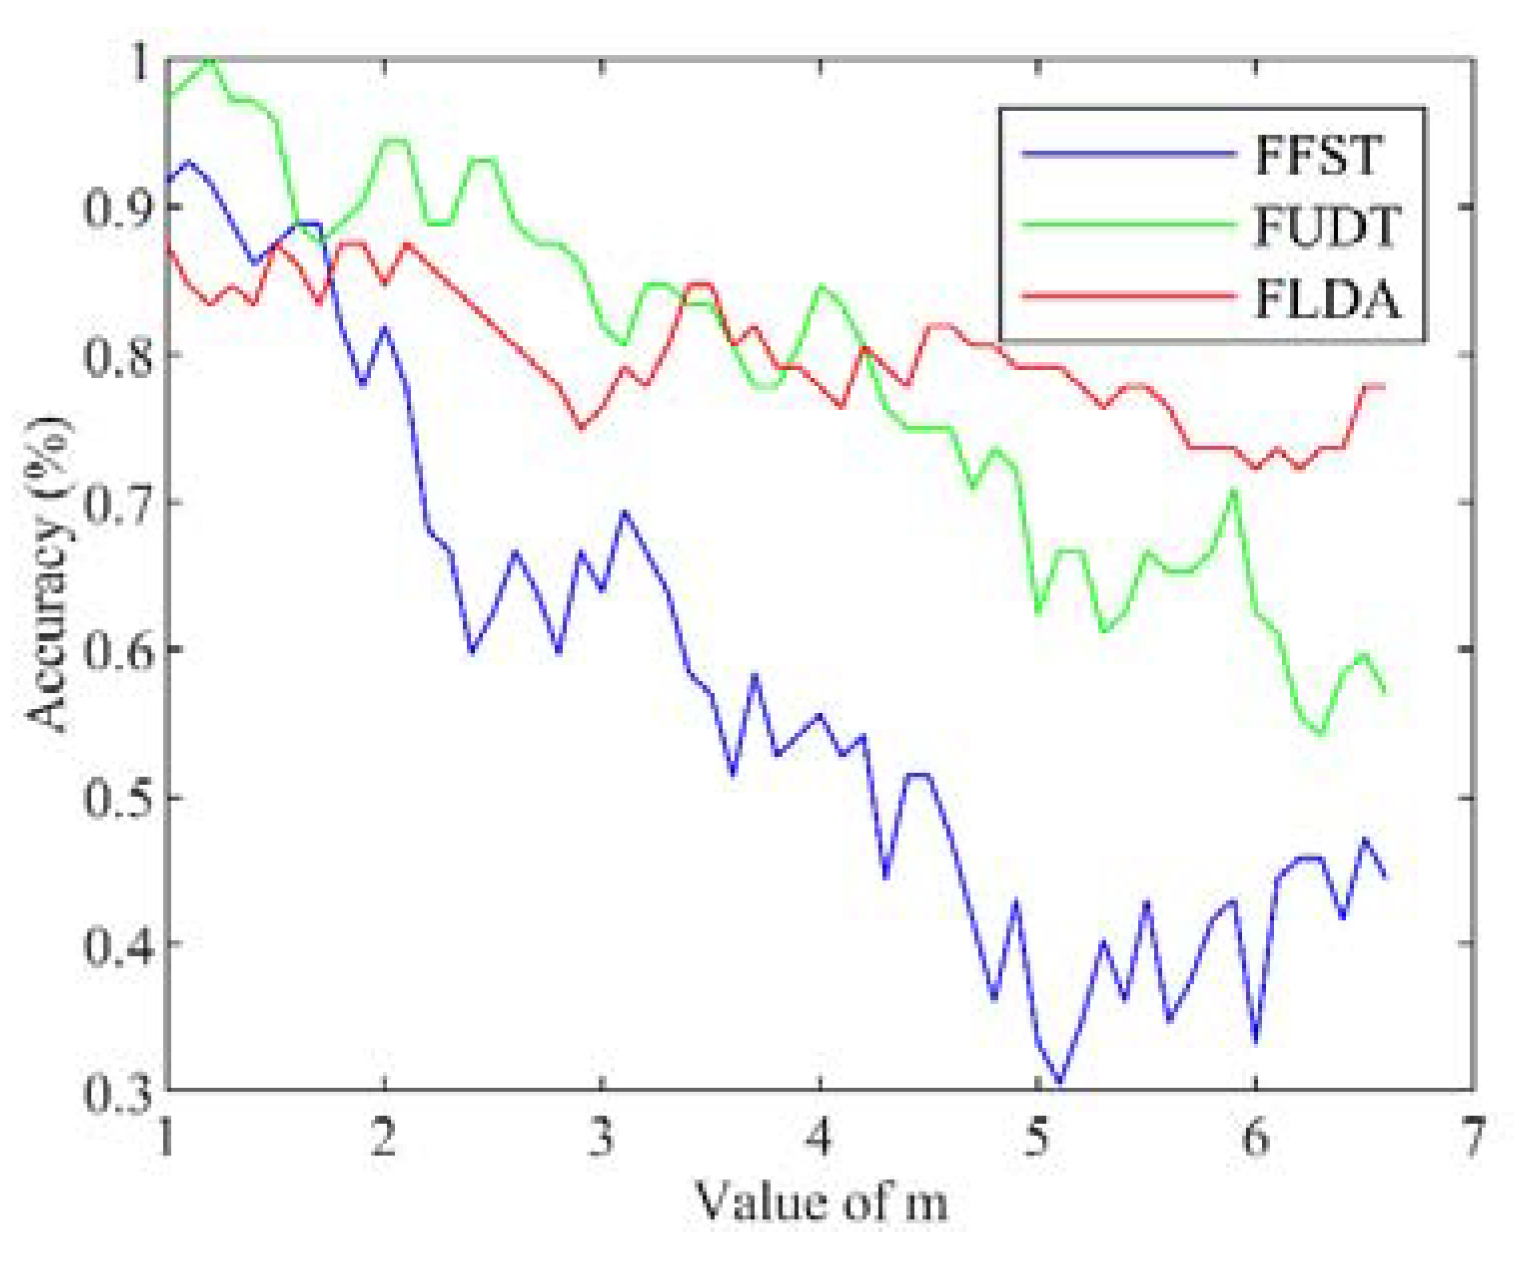
Figure 6 demonstrates how the classification accuracy rates change with the rise of the value of
m. All three feature extraction algorithms perform the best when the value of
m nears 1. The accuracy rates using FUDT and FLDA decline relatively slowly as
m increases. However, the accuracy rates of FFST fall sharply after the value of
m reaches 3.
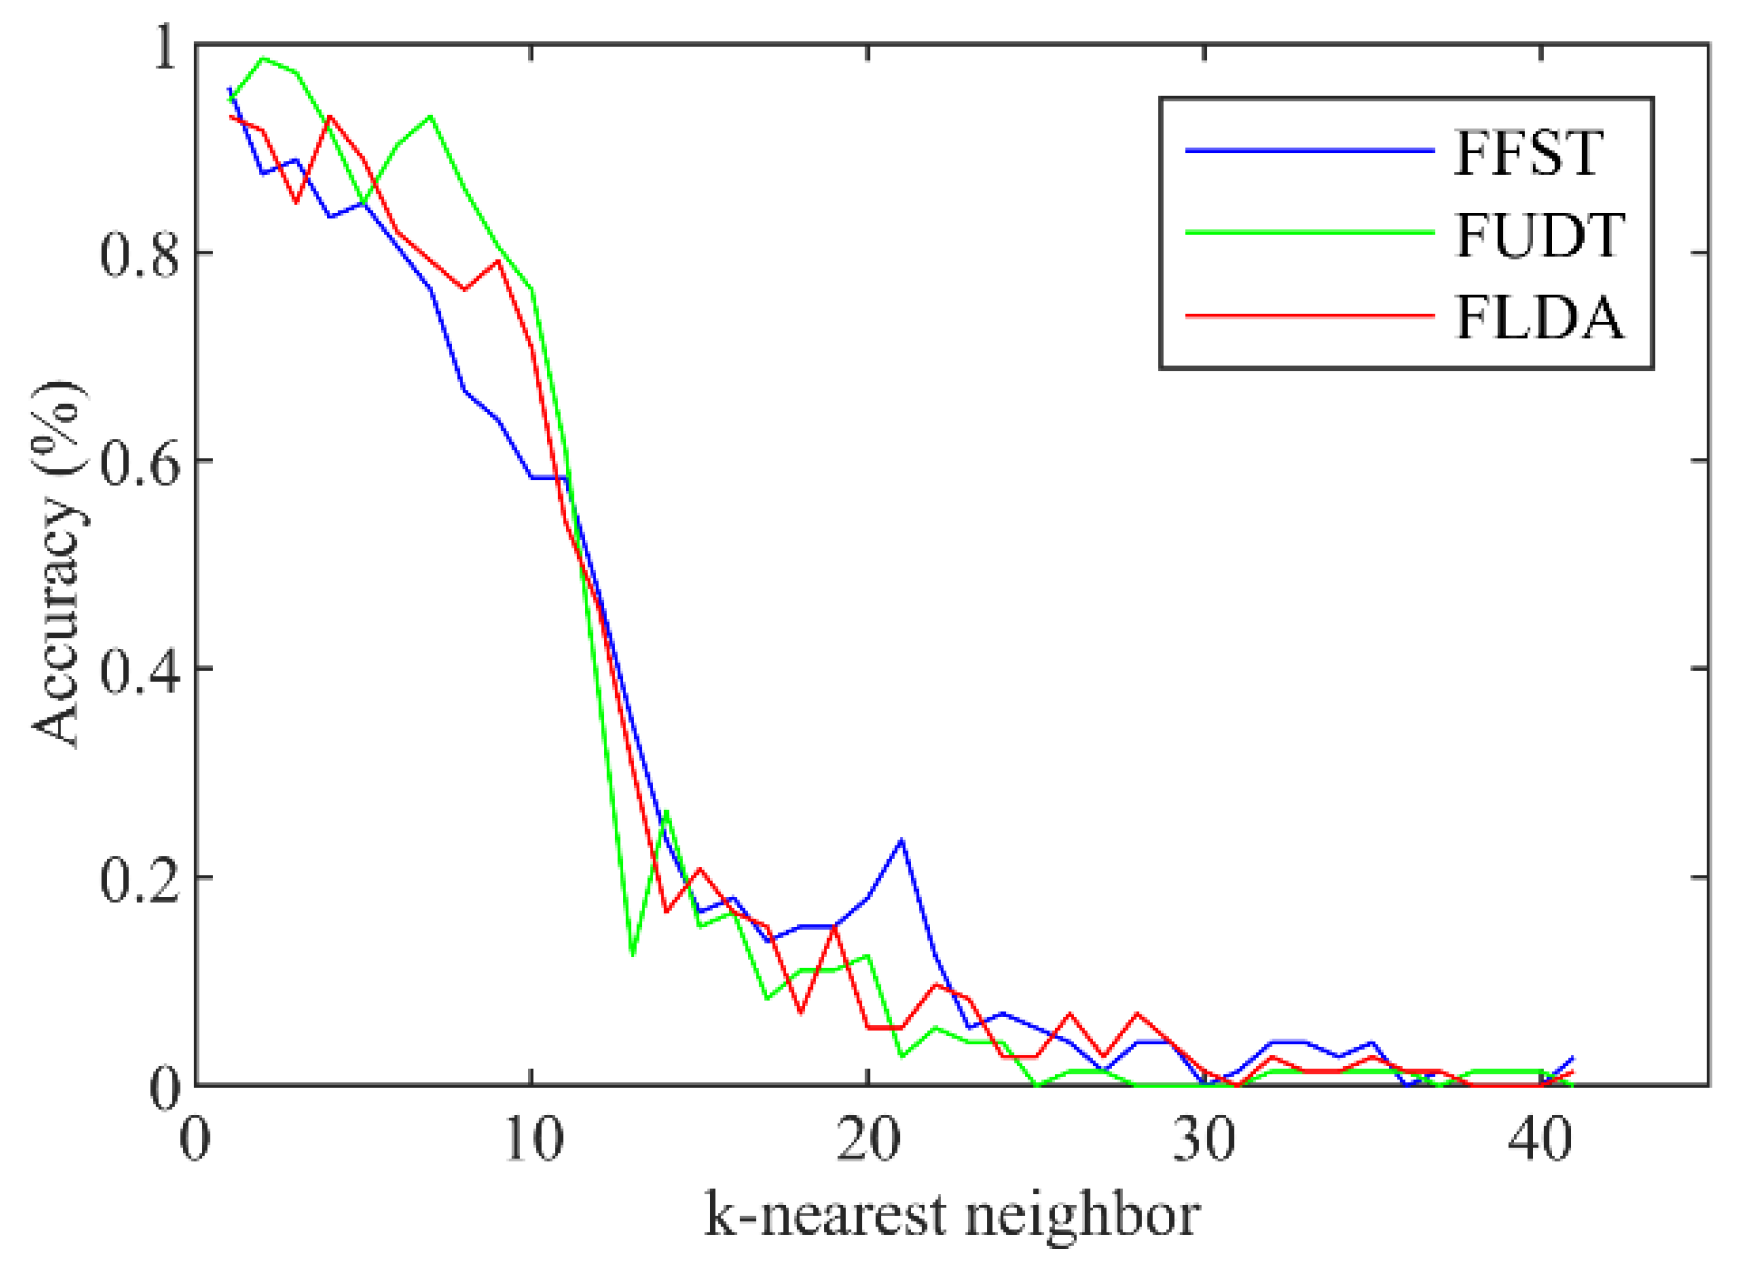
Figure 7 illustrates the changing trend of classification accuracy rates when
k differs. Different from the results shown in
Figure 6, the accuracy rates of the three algorithms change similarly, and their accuracy drops quickly after
k reaches 9.
In light of the three above figures, the search range for optimizing the algorithms’ use for pesticide residue detection can be narrowed. The search range for the number of eigenvectors was set from 3 to 65, and that of
m was set from 1 to 3, with the step size set at 0.1, while the range of odd number
k was set from 1 to 9. We used 22 spectra data in each group (88 total spectra from samples in the training set) to build the training set and 18 spectra in each group to test the performance of the feature extraction and classification model. Using these parameters, the final highest classification accuracy rates of FFST, FUDT, and FLDA are 100%, 100%, and 97.22%, respectively. The parameter settings and computer running times at the accuracy rate peaks are shown in
Table 1.
According to the results, using these three pattern recognition algorithms to extract the component information and kNN as the classifier is effective when processing the mid-infrared spectra data of Chinese cabbage leaf sample. Among these feature extraction methods, the time cost of FFST is about four times that of FUDT and about ten times that of FLDA. Compared to FLDA, FUDT performs better in terms of classification accuracy, even though FUDT requires twice the amount of computer time as that used by FLDA to complete the calculation. To conclude, FUDT performs the best on the test set of Chinese cabbage samples, considering both the classification accuracy rate and the computational time required.
4. Discussion
This study explored the performance of FLDA-
kNN, FFST-
kNN, and FUDT-
kNN to qualitatively detect lambda-cyhalothrin on cabbage leaves. Some researchers used
kNN to classify different kinds or concentrations of pesticide residues on vegetables after feature extraction [
17,
18]. In both of these publications,
kNN and support vector machine (SVM) were employed as the classifier after extracting the feature. When classifying different concentrations of fenvalerate and triazoline on lettuce surfaces, accuracy rates on the test set using deep brief network-
kNN (DBN-
kNN) and DBN-SVM were 76.66% and 95%, respectively [
17]. Using SVM as the classifier also outperformed
kNN when classifying different kinds of pesticide residues. Accuracy rates on the test set using Competitive adaptive reweight sampling-
kNN (CARS-
kNN) and CARS-SVM were 84.44% and 97.78%, respectively [
18].
kNN, as the classifier, performed unsatisfactorily in these publications. This might be related to the feature extraction algorithm, and could be studied in future research. In some cases,
kNN could perform satisfactorily. When classifying four kinds of Chinese vinegar based on the electronic nose system, the highest identification rate using FFST-
kNN was 96.92%. [
22]. Additionally, it is easy to build the
kNN model [
30]. We can add samples with new labels into the training set directly, then an unknown sample is decided by its
k nearest neighbors. The SVM model needs to be retrained when new kinds of samples appear. However,
kNN is not suitable when the training set is large since the distances between the unknown sample and all objects in the training set are calculated [
30]. Future work could address the balance between the computing time required and the size of the training set.
The method proposed in this article can be used for on-site and nondestructive detection of pesticide residues. Even though some of the traditional methods might be more sensitive [
7,
8,
9,
10,
11], they require multistep sample preparation, are time-consuming and can only be conducted in the laboratory [
12]. The spectroscopy method that we used could realize on-site detection of pesticide residues with portable spectrometers [
31]. Moreover, there is no requirement for the use of chemical reagents for detection, which reduces the cost and effect on the environment. This method might also be utilized to inspect pesticide residues on other vegetables, or even be used for large scale residue detection on an automated production line. If such a system were placed in the factory, the mid-infrared spectrum of each product might be collected by a portable spectrometer. These data could then be sent for computation and classification using computers. Thus, products with excess pesticide residue could be sent for further processing. As more products were detected before going to the market, the pesticide concentration on the food could be maintained under the safety threshold. The public would be better protected from food poisoning by pesticide. This will also incentivize farmers to follow the standard of pesticide usage during the growth of vegetables.
Future work could be done to better distinguish lambda-cyhalothrin and other pyrethroid products (cypermethrin, deltamethrin), since they have very similar molecular structures. In comparison to cypermethrin and deltamethrin, lambda-cyhalothrin has a unique group (C-F bond) that has a unique absorption peak in the mid-infrared spectrum. By modifying the feature extraction algorithm to the unique absorption peak, the technology can be made more accurate in lambda-cyhalothrin detection. Additionally, full spectra were used for classification in our work. This might lead to interference and longer computational times. He et al. applied interval partial least squares (
iPLS) to select a range of wavelengths containing the most useful information in the laser-induced breakdown spectroscopy (LIBS) spectra [
32]. If combined with a region selection method, our method might be faster and more sensitive when interference exists.
5. Conclusions
In this study, mid-infrared spectroscopy combined with SNV, MSC, PCA, kNN, and three fuzzy feature extraction methods were successfully used to qualitatively analyze lambda-cyhalothrin residues on Chinese cabbage leaf samples. Under certain parameter settings, we achieved a classification accuracy of 100%.
When processing the spectra, SNV and MSC were used to eliminate the noise and prepare for PCA. Conducting PCA reduced the dimensionality of the data for faster processing speed. Using fuzzy theory, FFST, FLDA, and FUDT were employed to find spectra features. When classifying Chinese cabbages leaf samples with different amounts of lambda-cyhalothrin residues, the results showed that the highest classification accuracy rates of FFST, FUDT, and FLDA were 100%, 100%, and 97.22%, respectively. Among these methods, FUDT performed the best, considering the accuracy rate and computational time required.
This study describes a promising approach to realize fast and nondestructive detection of lambda-cyhalothrin residues on Chinese cabbage leaves using mid-infrared spectroscopy and fuzzy uncorrelated discriminant transformation (FUDT). This method can be applied to qualitatively detect different levels of pesticide residues in other vegetables as well.


