
Simulation of Fuel Consumption Based on Engine Load Level of a 95 kW Partial Power-Shift Transmission Tractor

 ,
,  , , , ,
Abstract
:1. Introduction
2. Materials and Methods
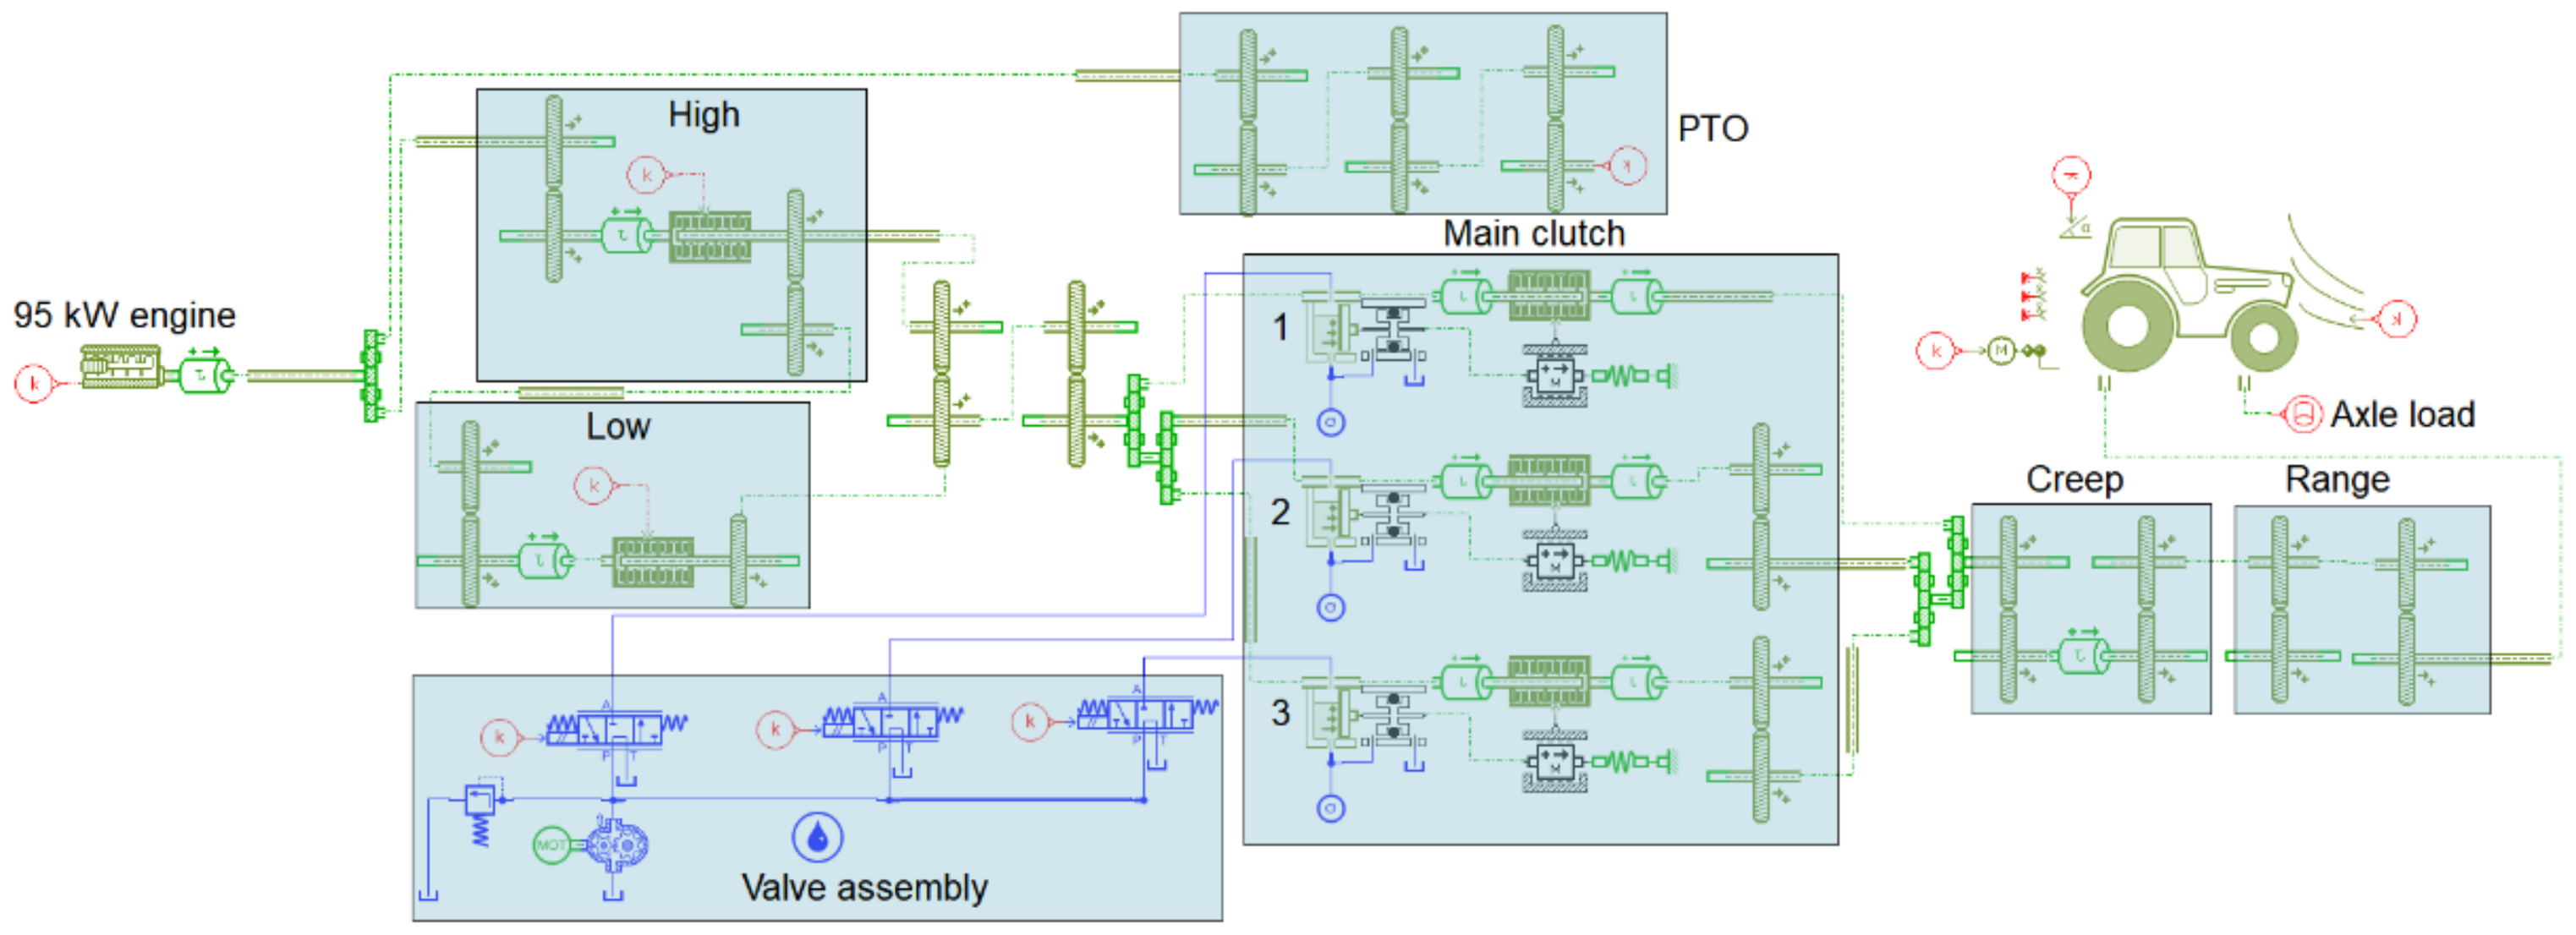
2.1. Tractor Transmission Configurations
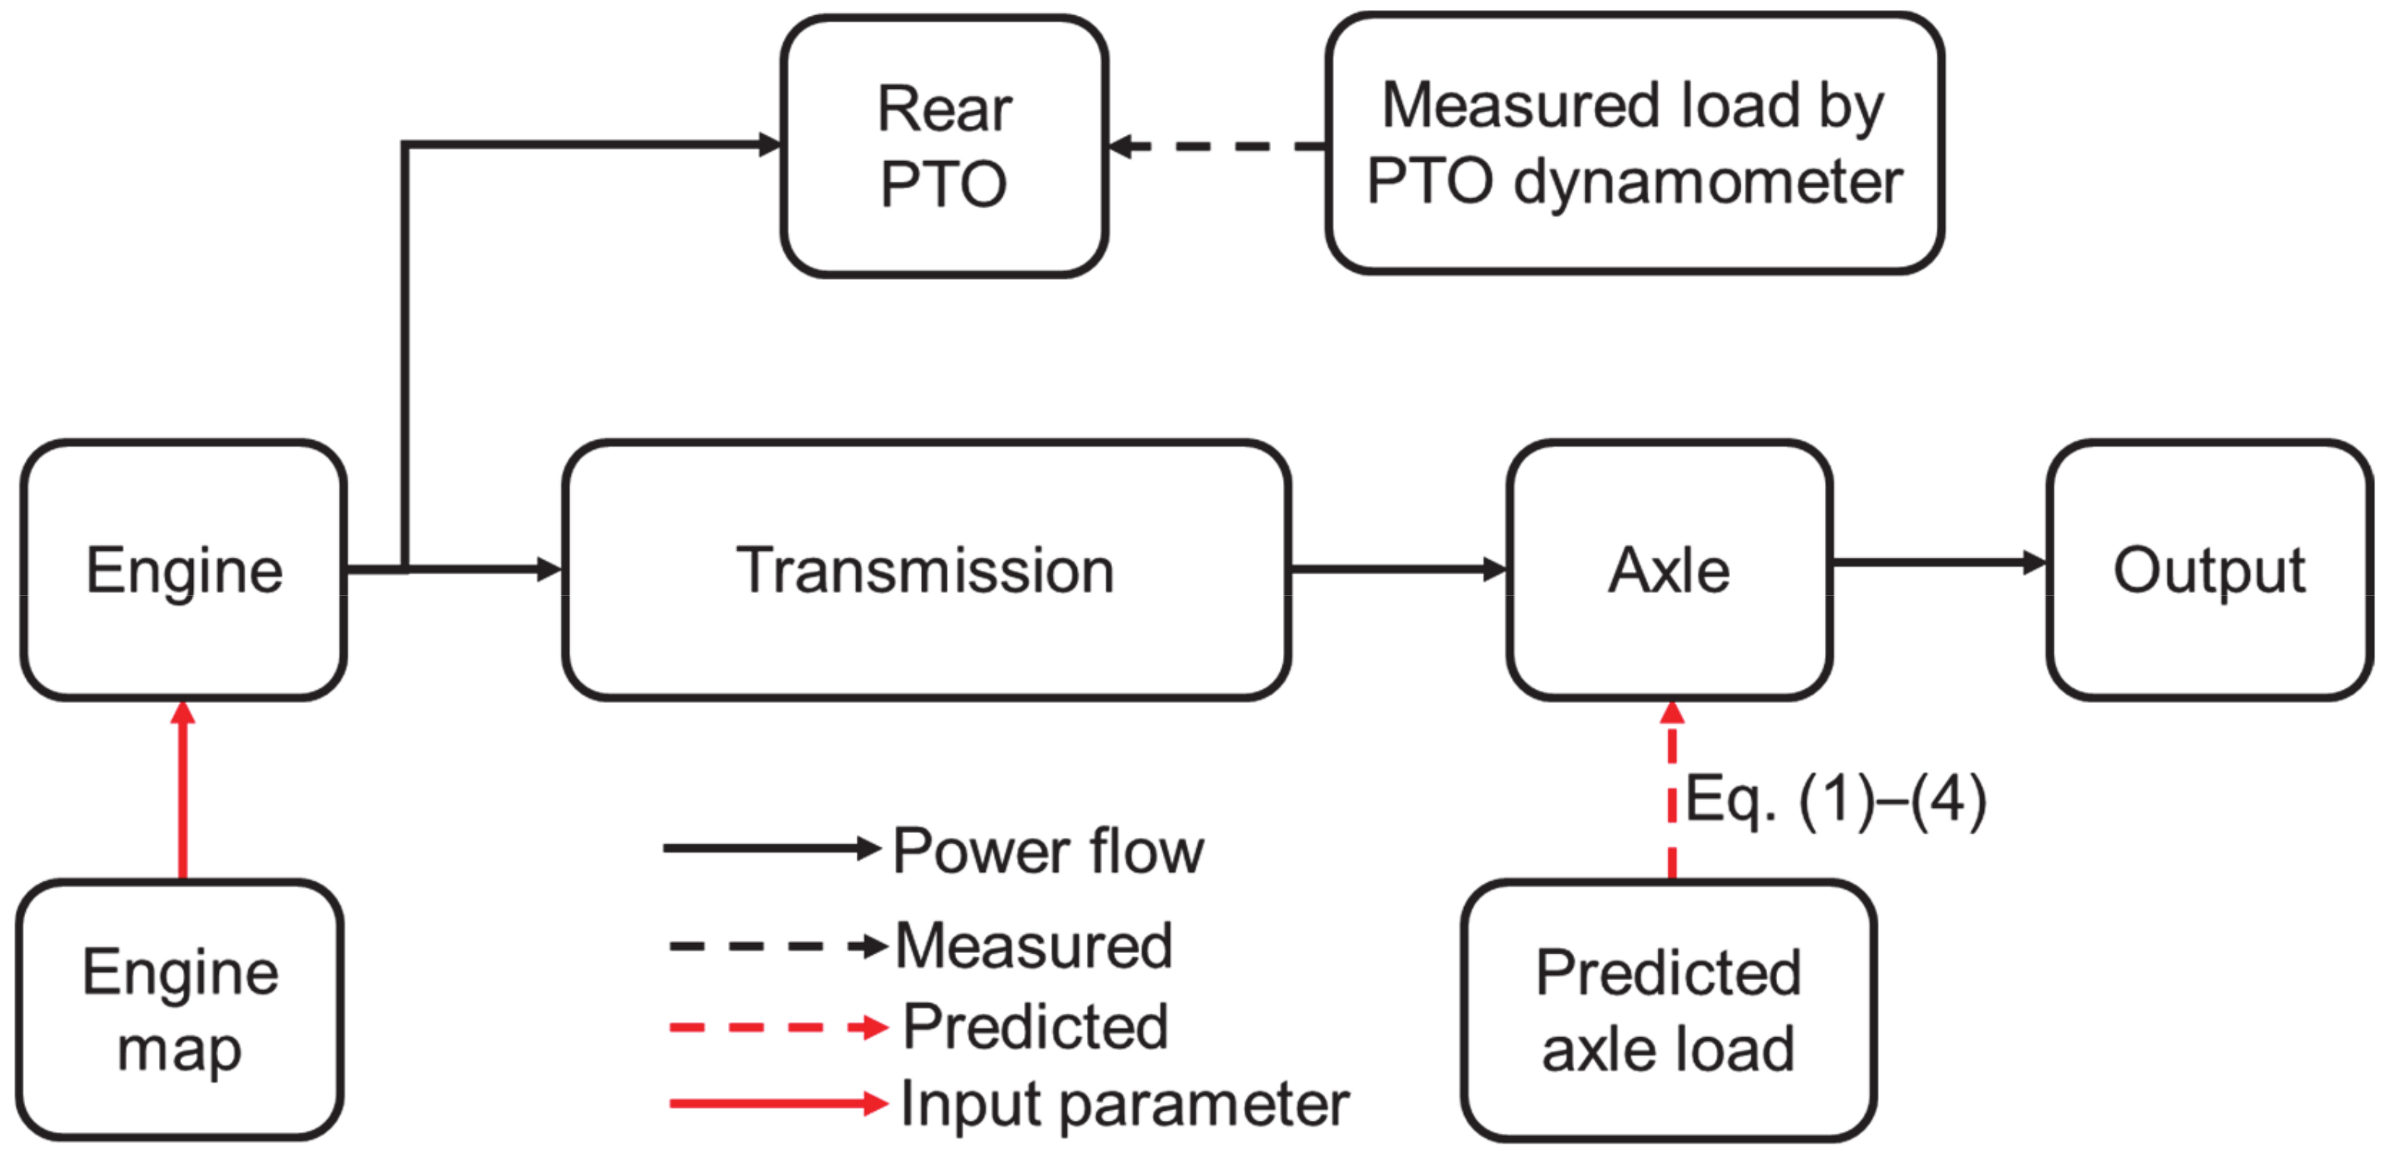
2.2. Tractor Dynamic Model
2.2.1. Axle Load Prediction
2.2.2. Specific Fuel Consumption (SFC)
2.3. Simulation Model of PST Tractor
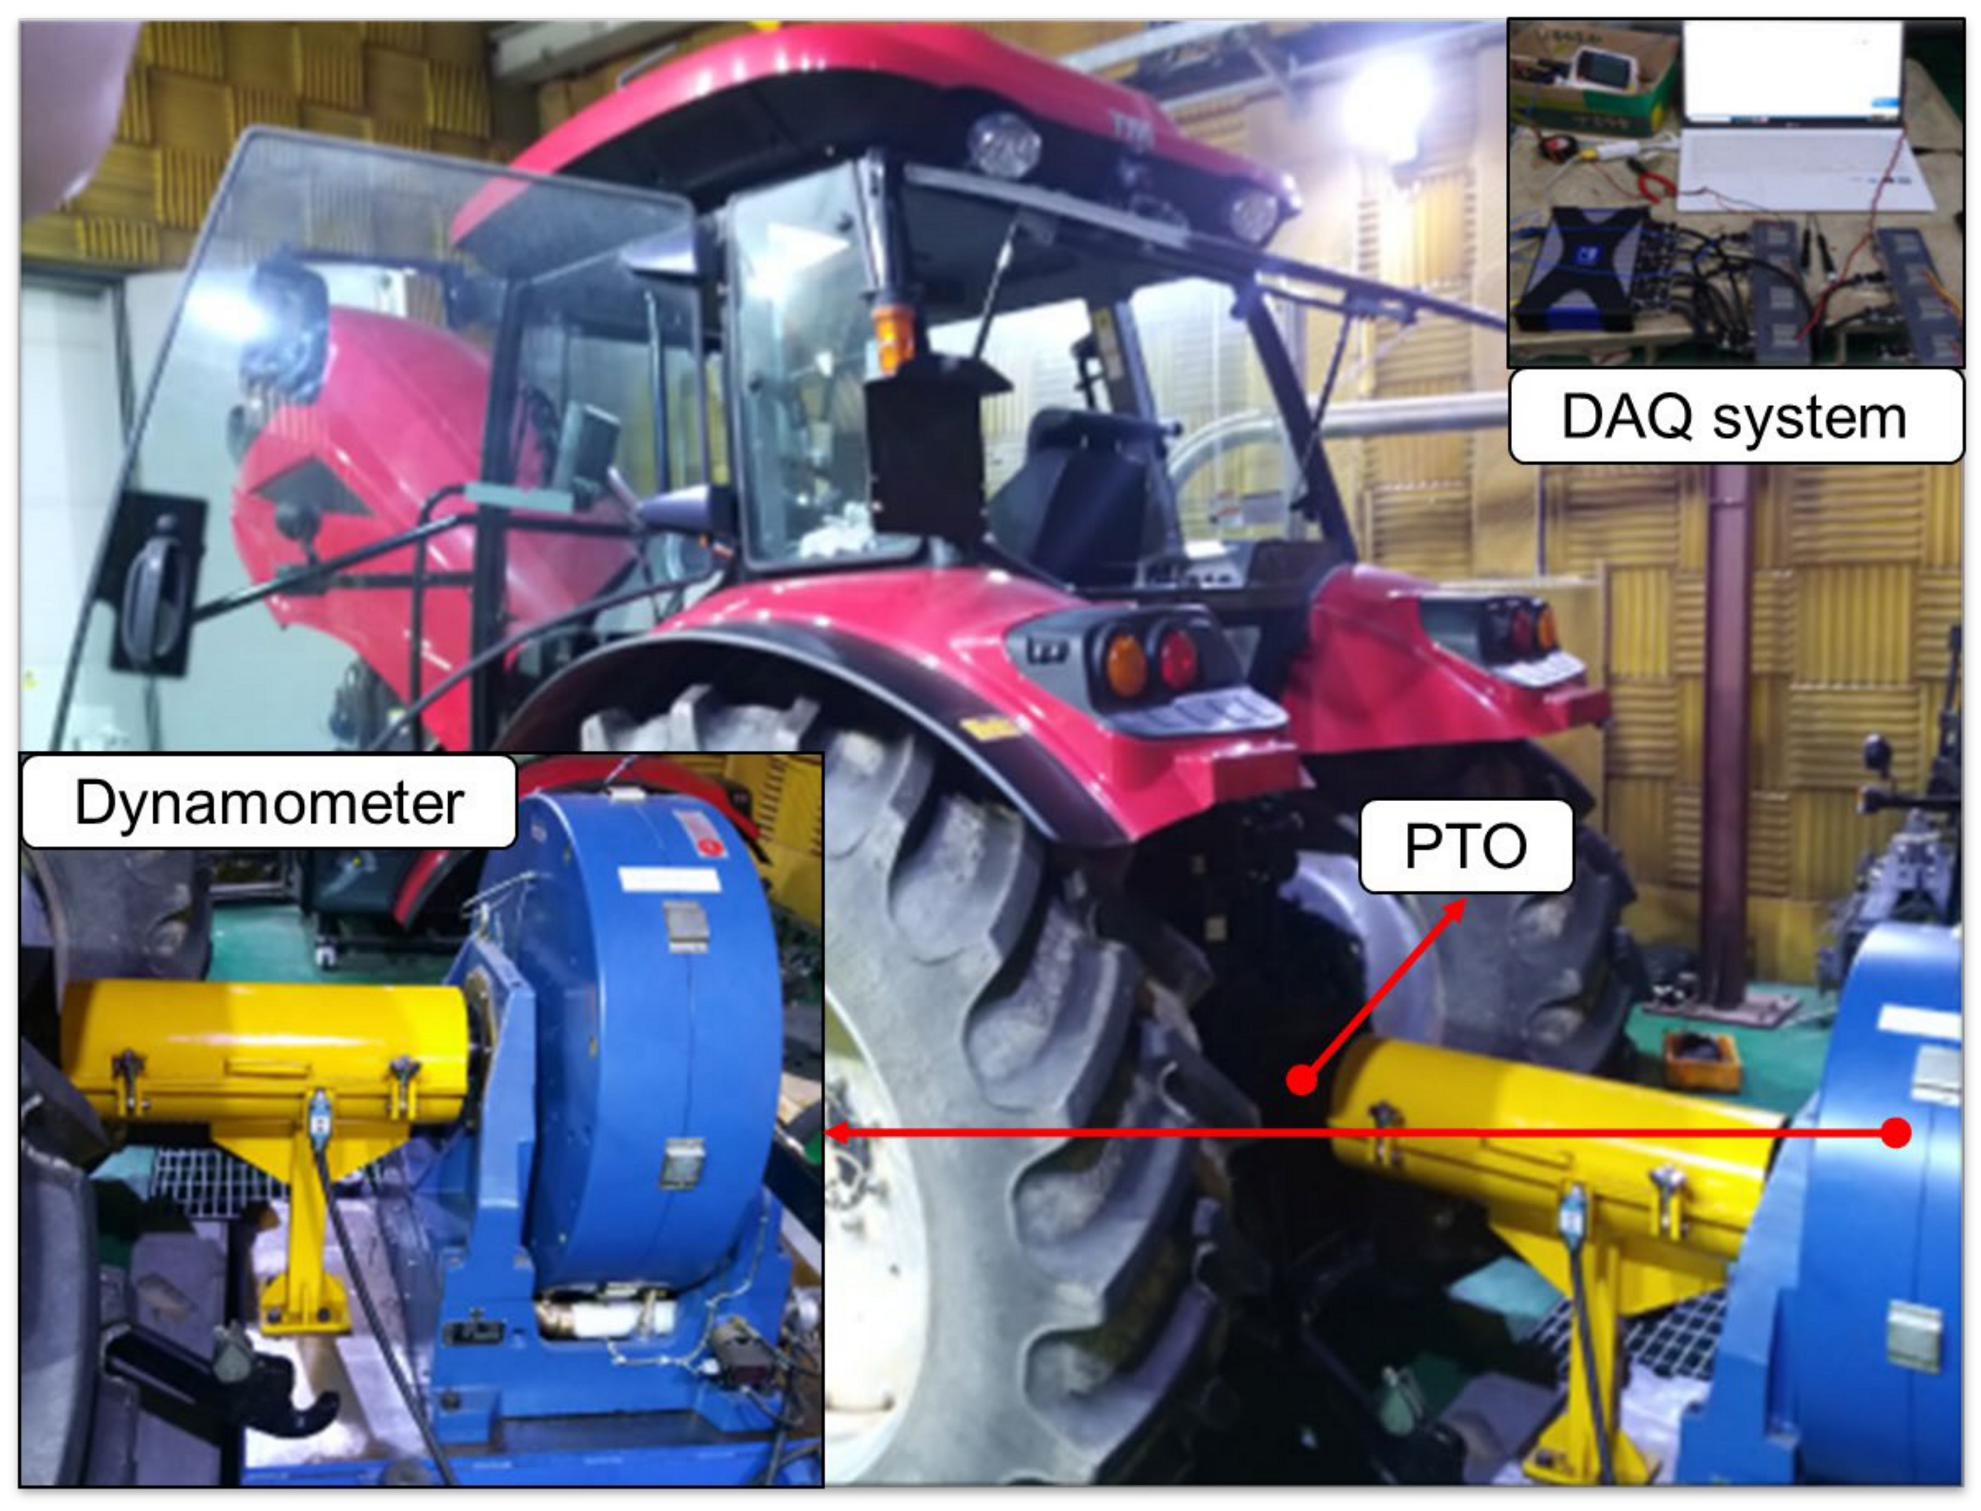
2.4. Dynamometer Test Bench and Specifications
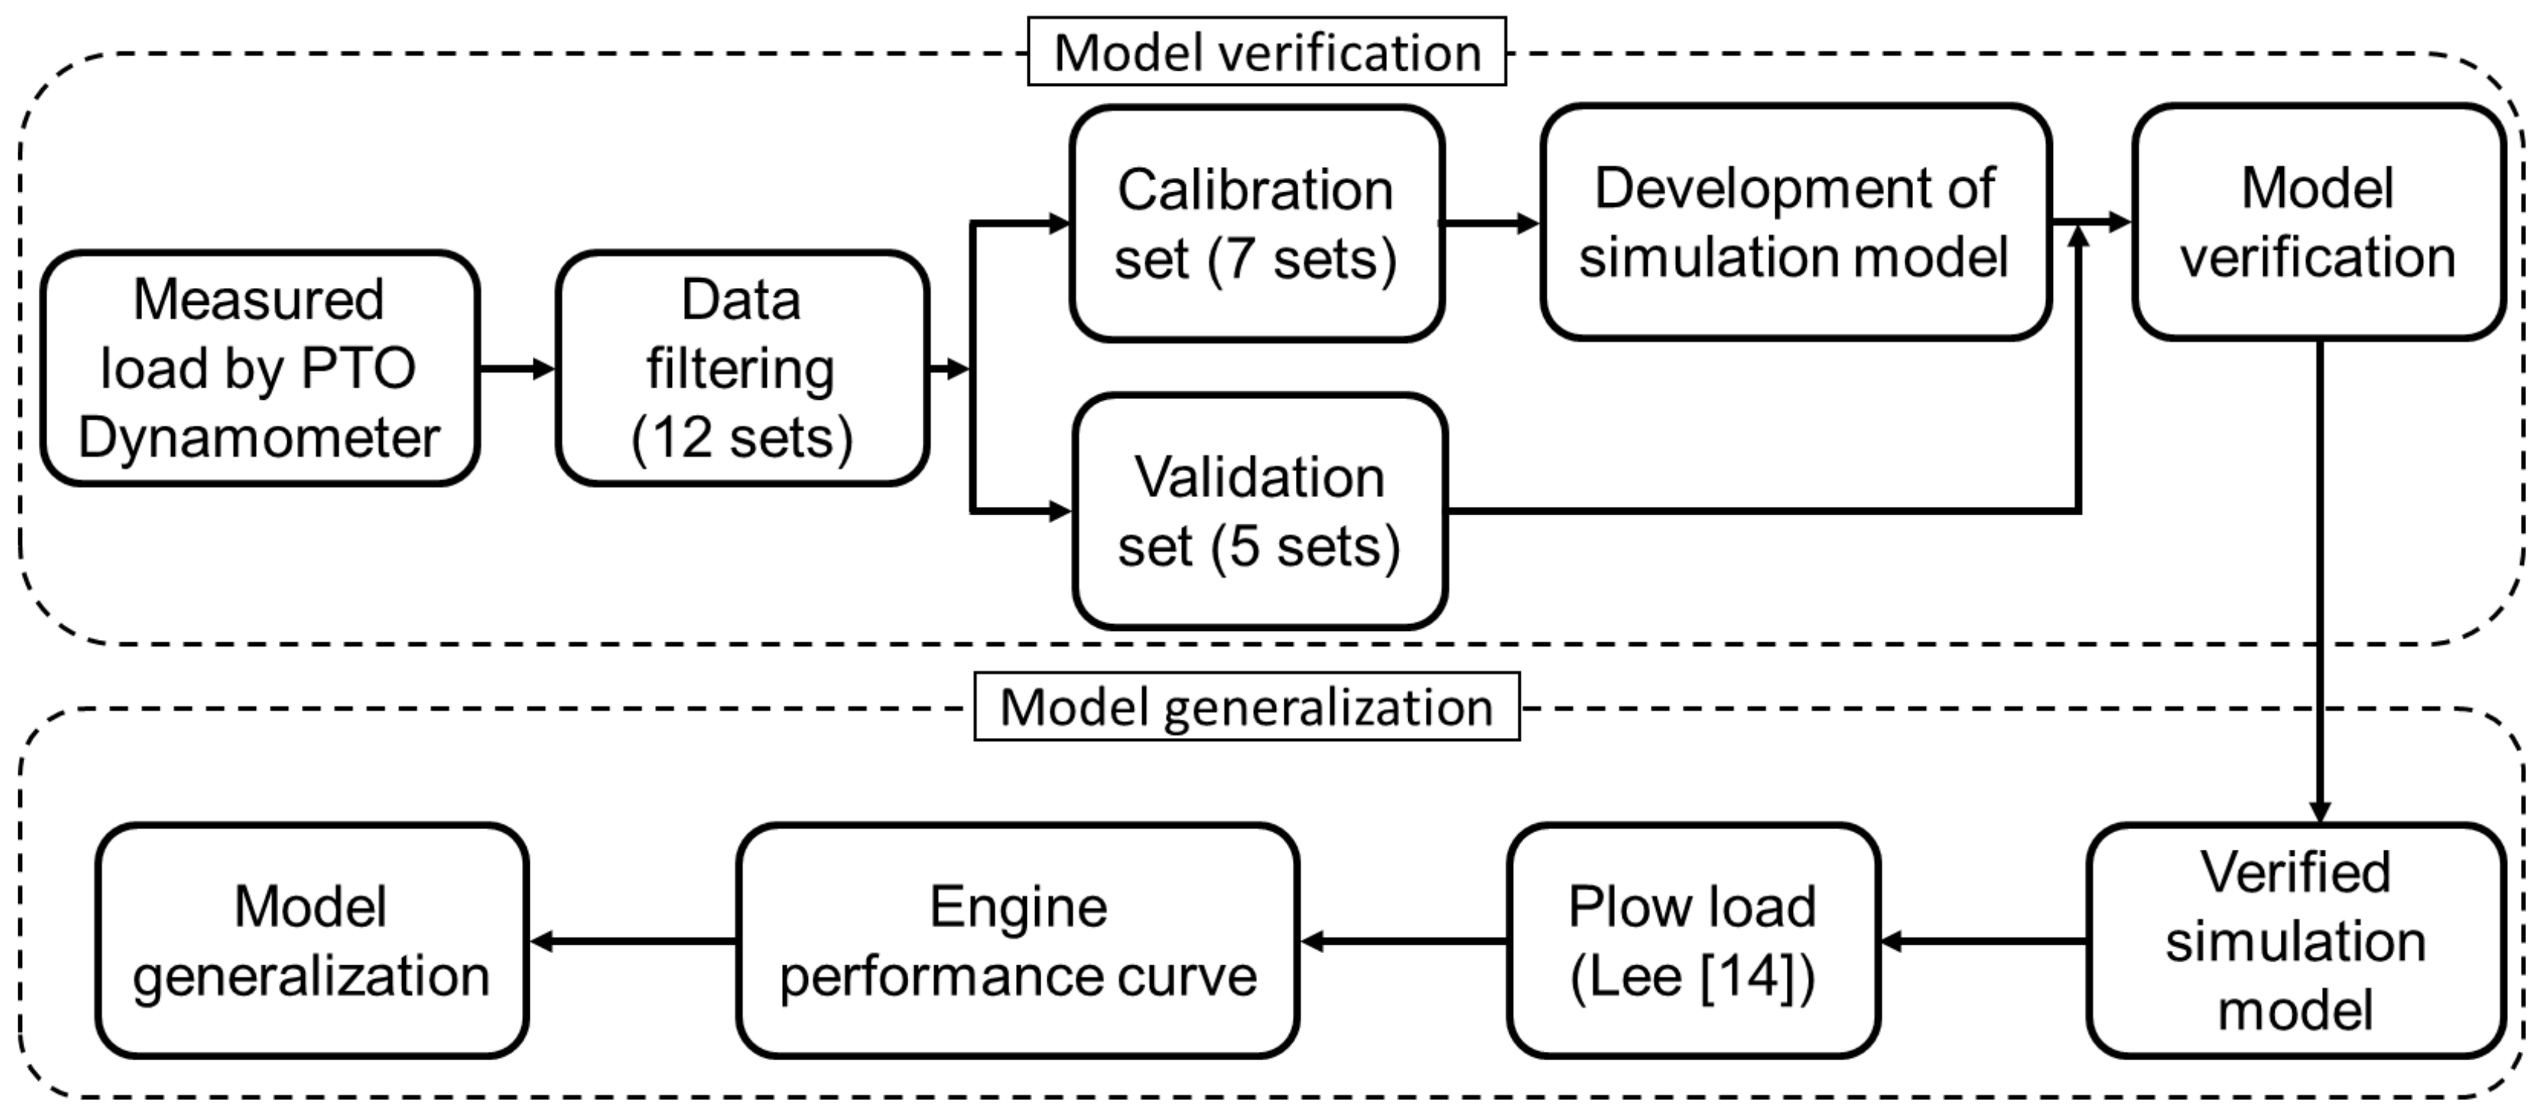
2.5. Simulation Procedures
2.5.1. Model Verification and Generalization
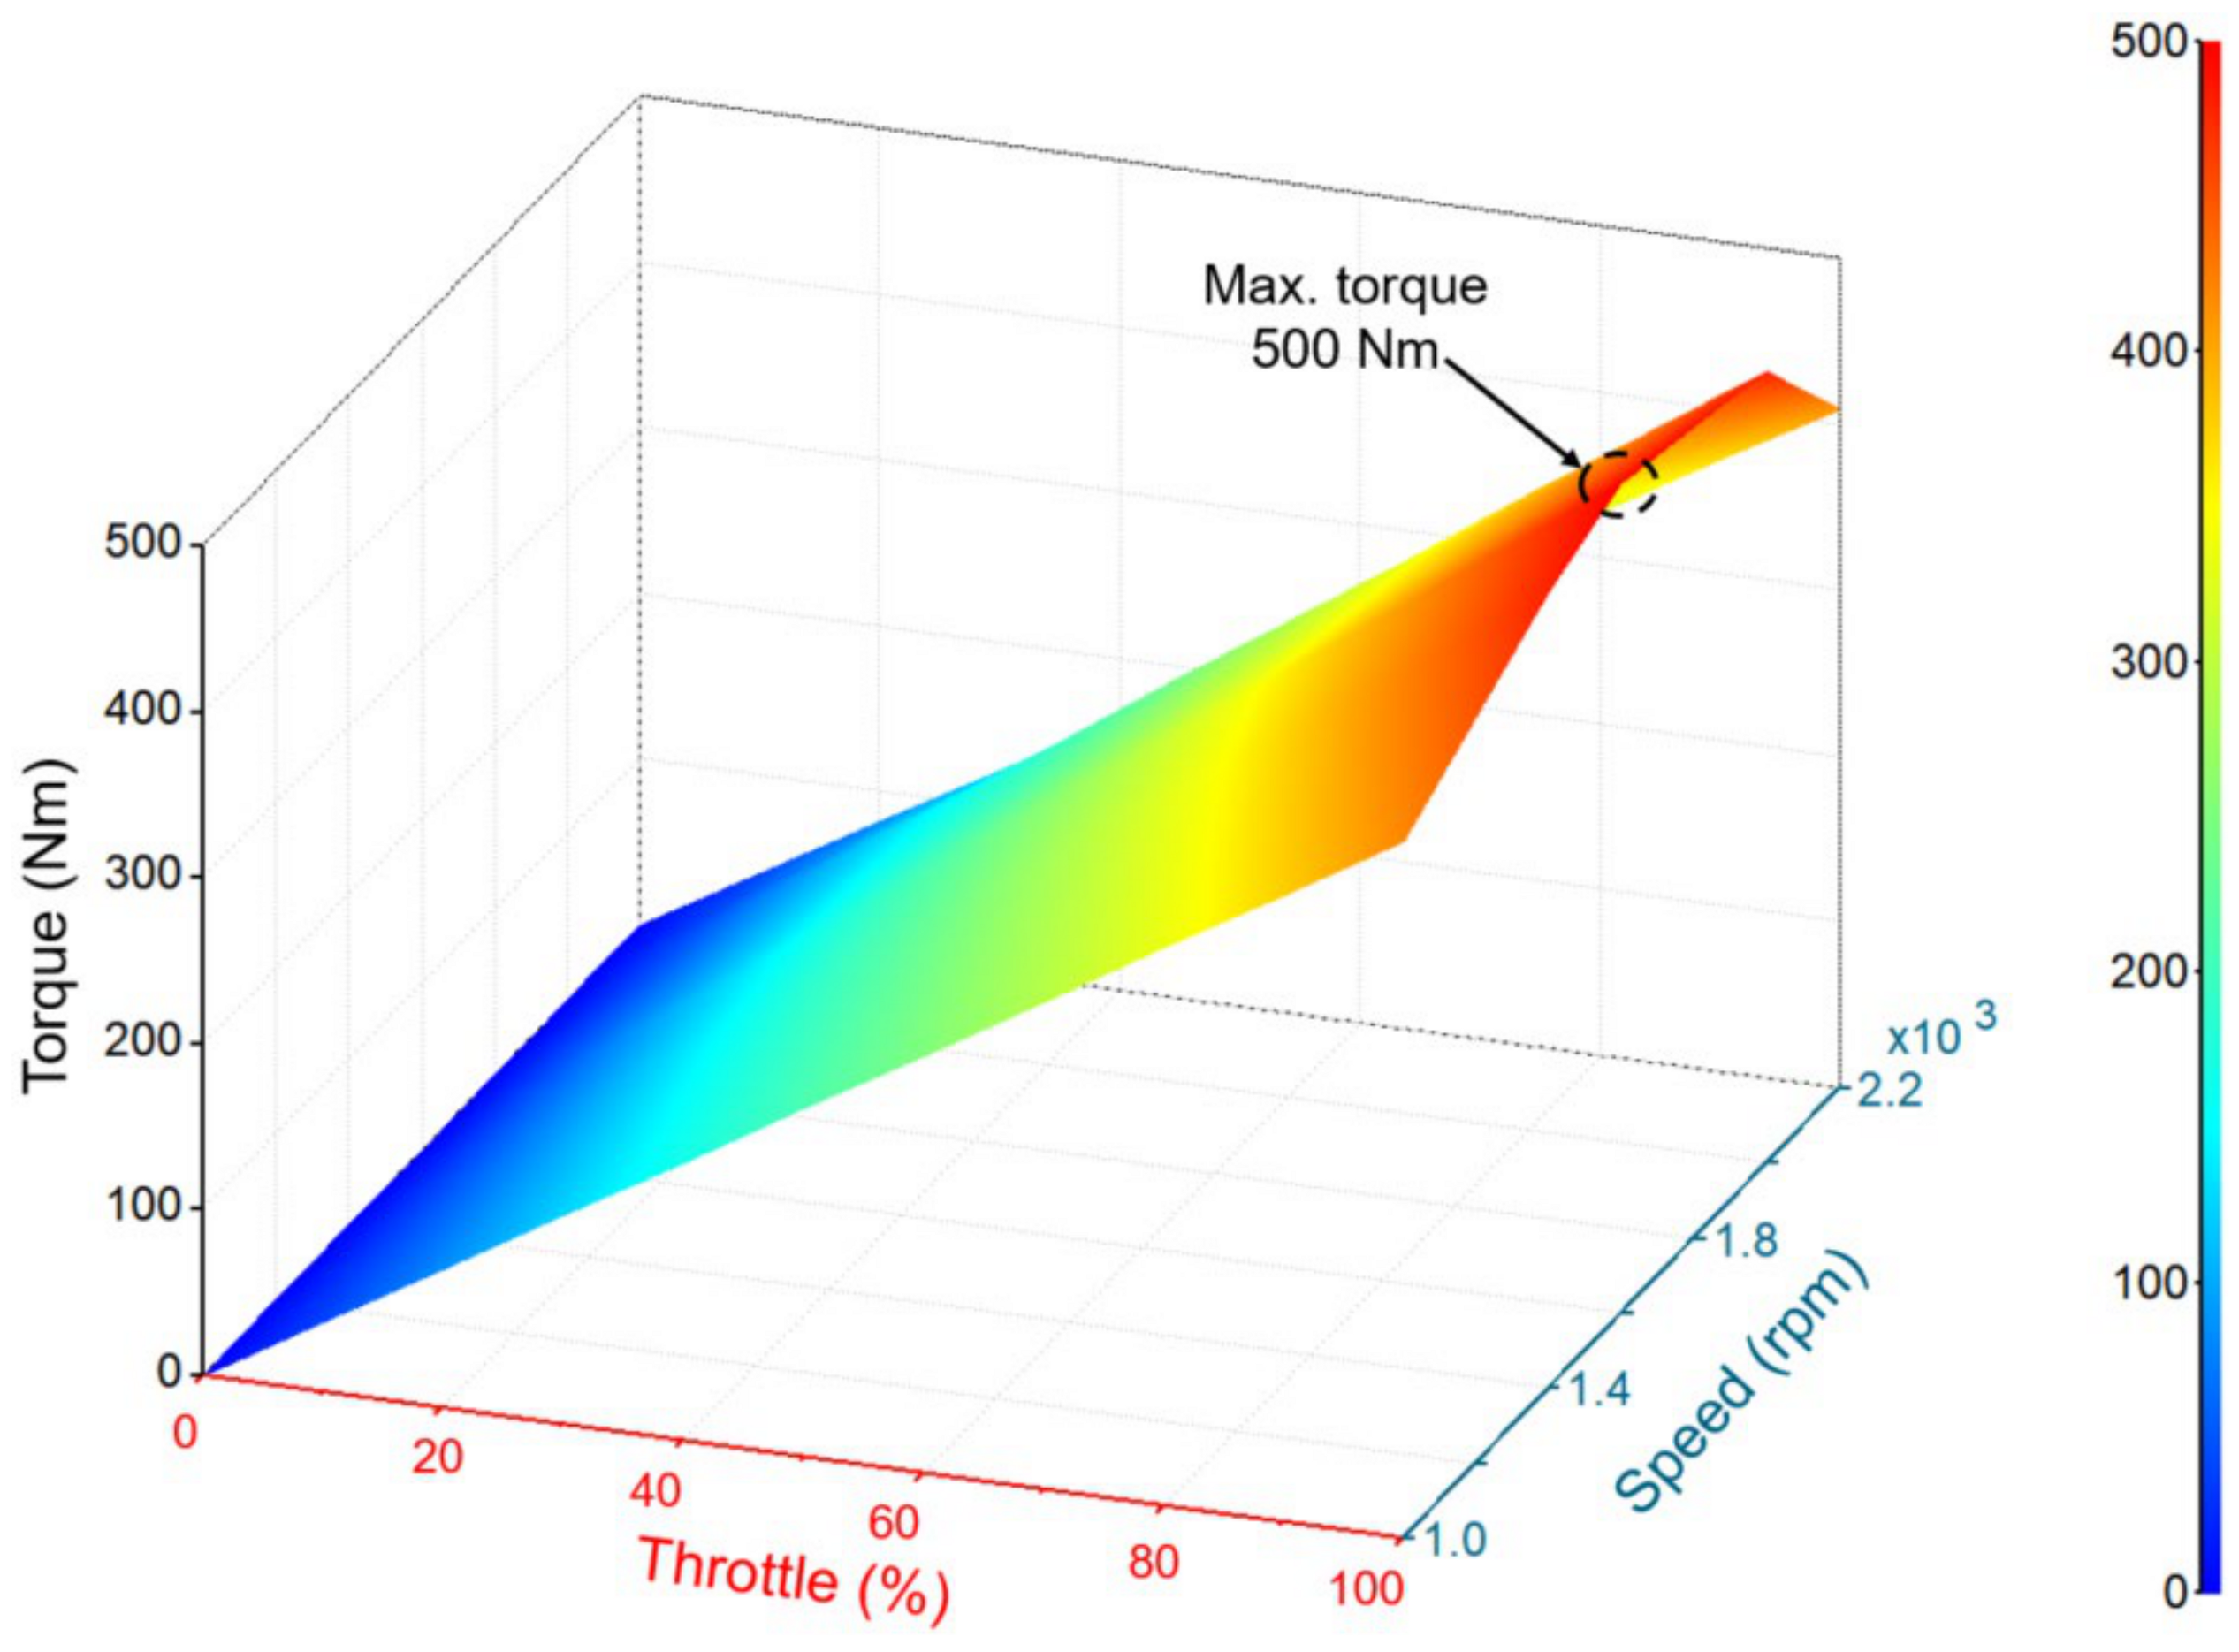
2.5.2. Engine Characteristics Map
2.5.3. Simulation Parameters
2.6. Analysis Method
3. Results
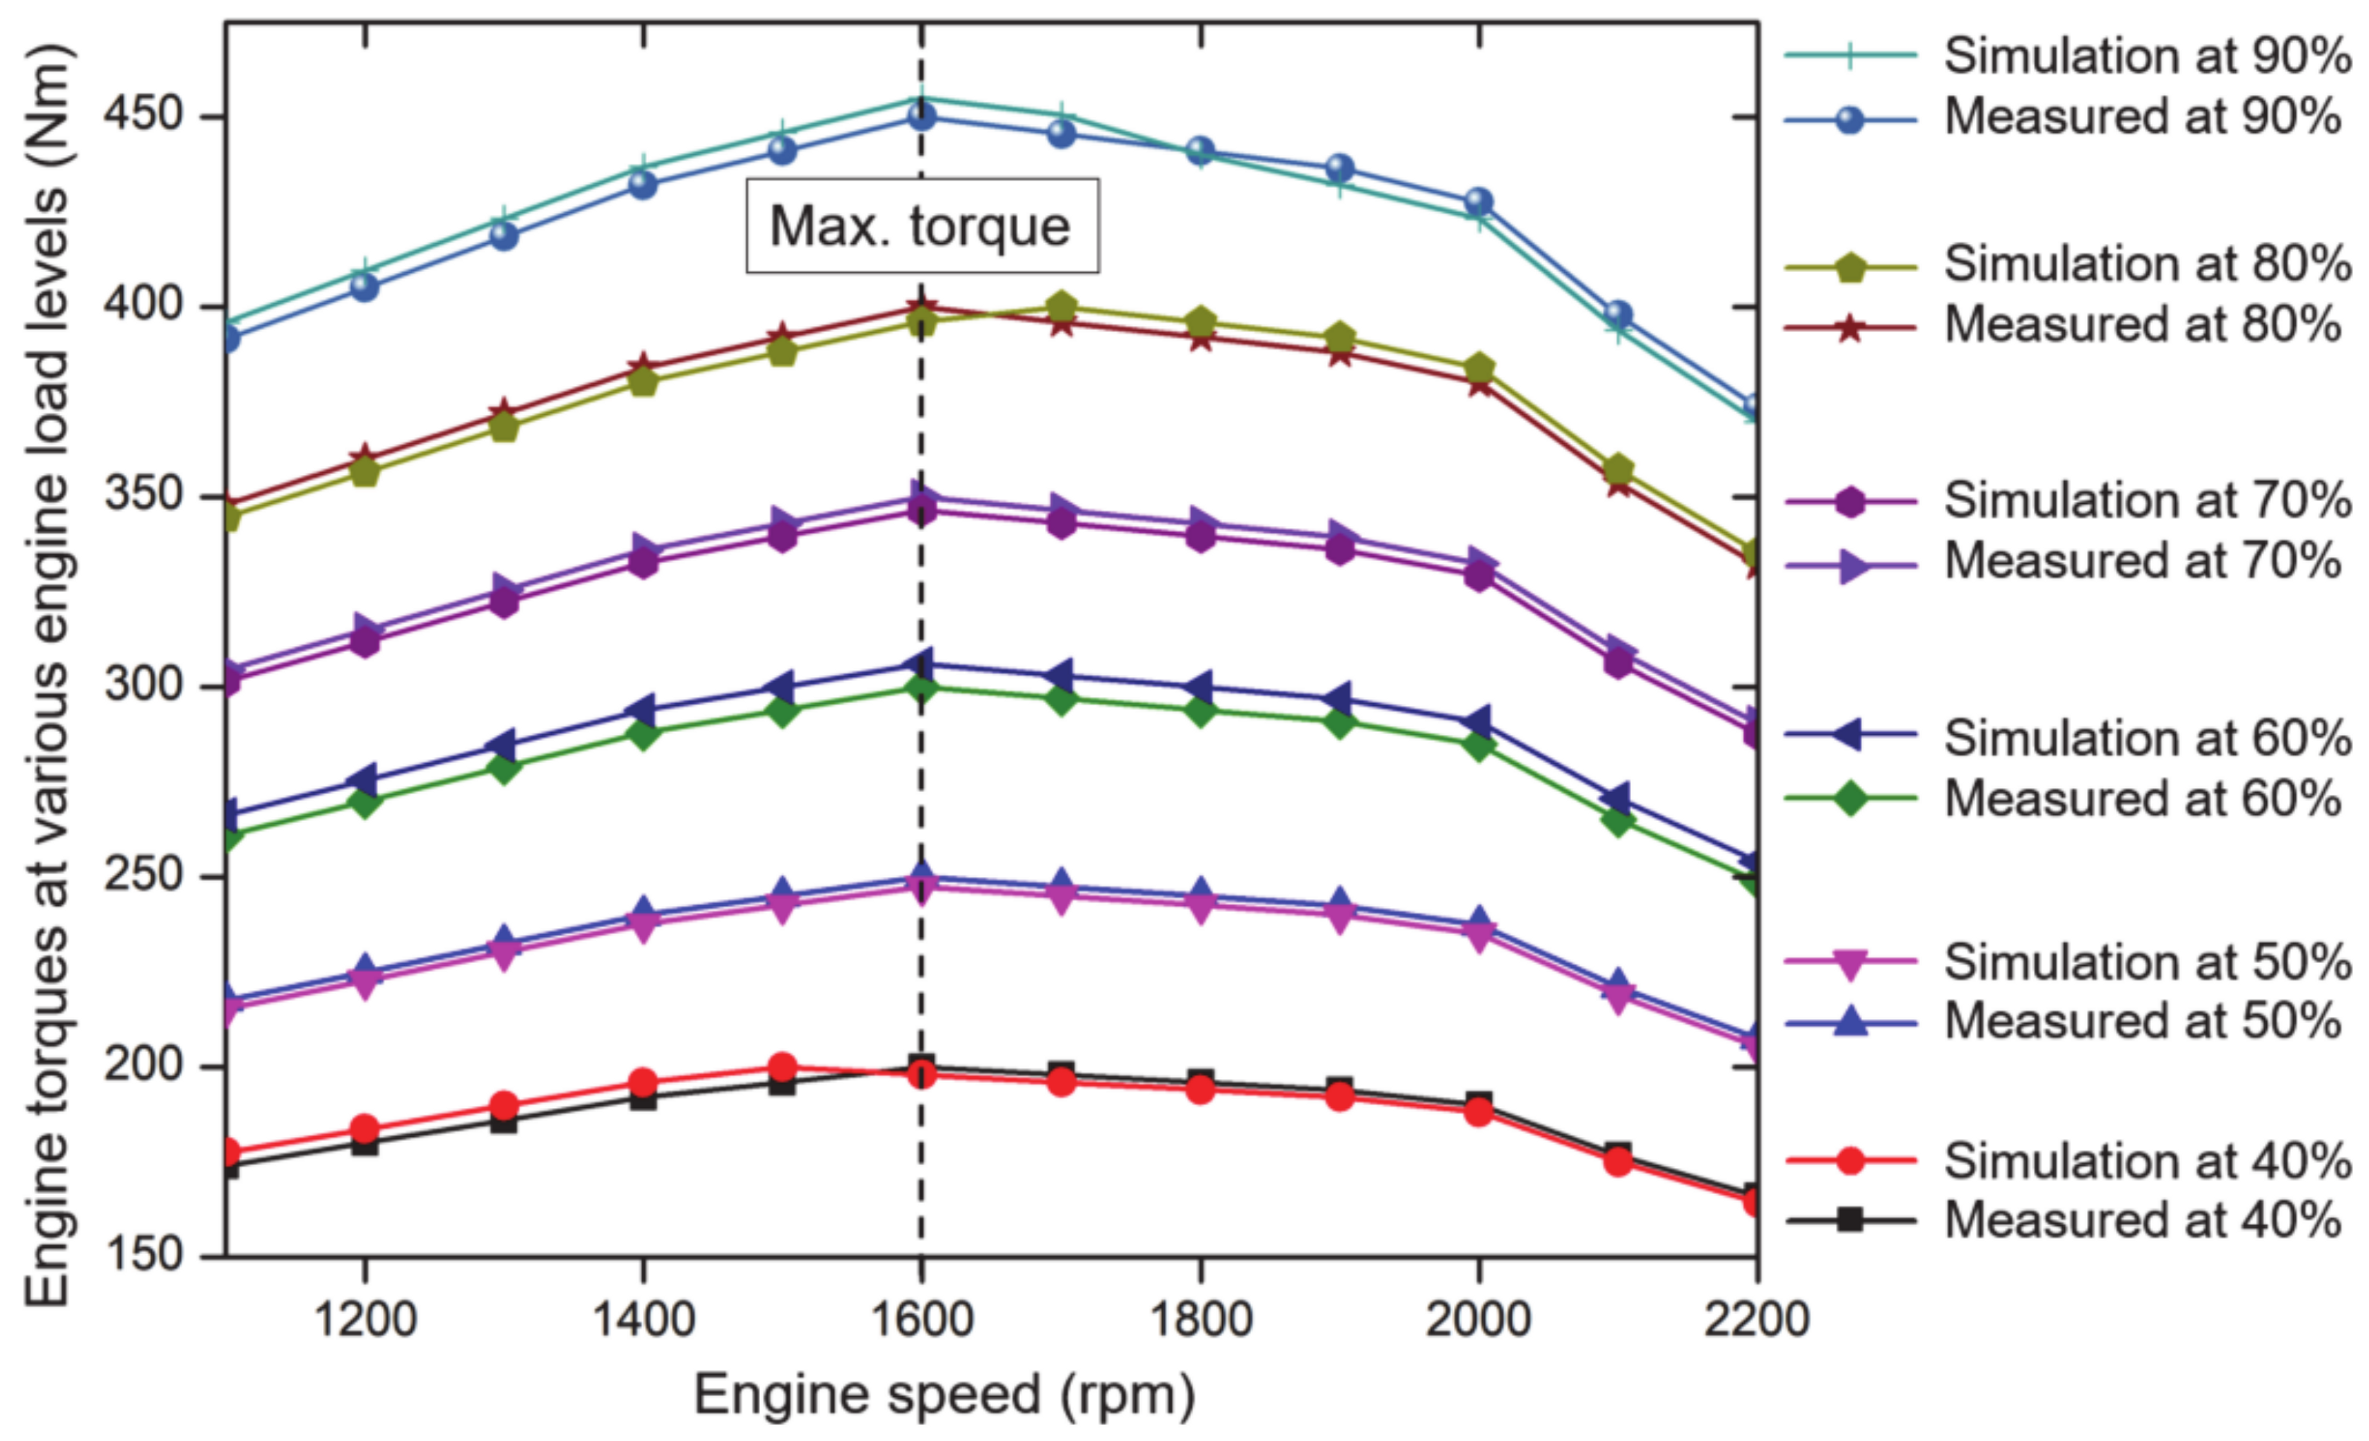
3.1. Engine Torque
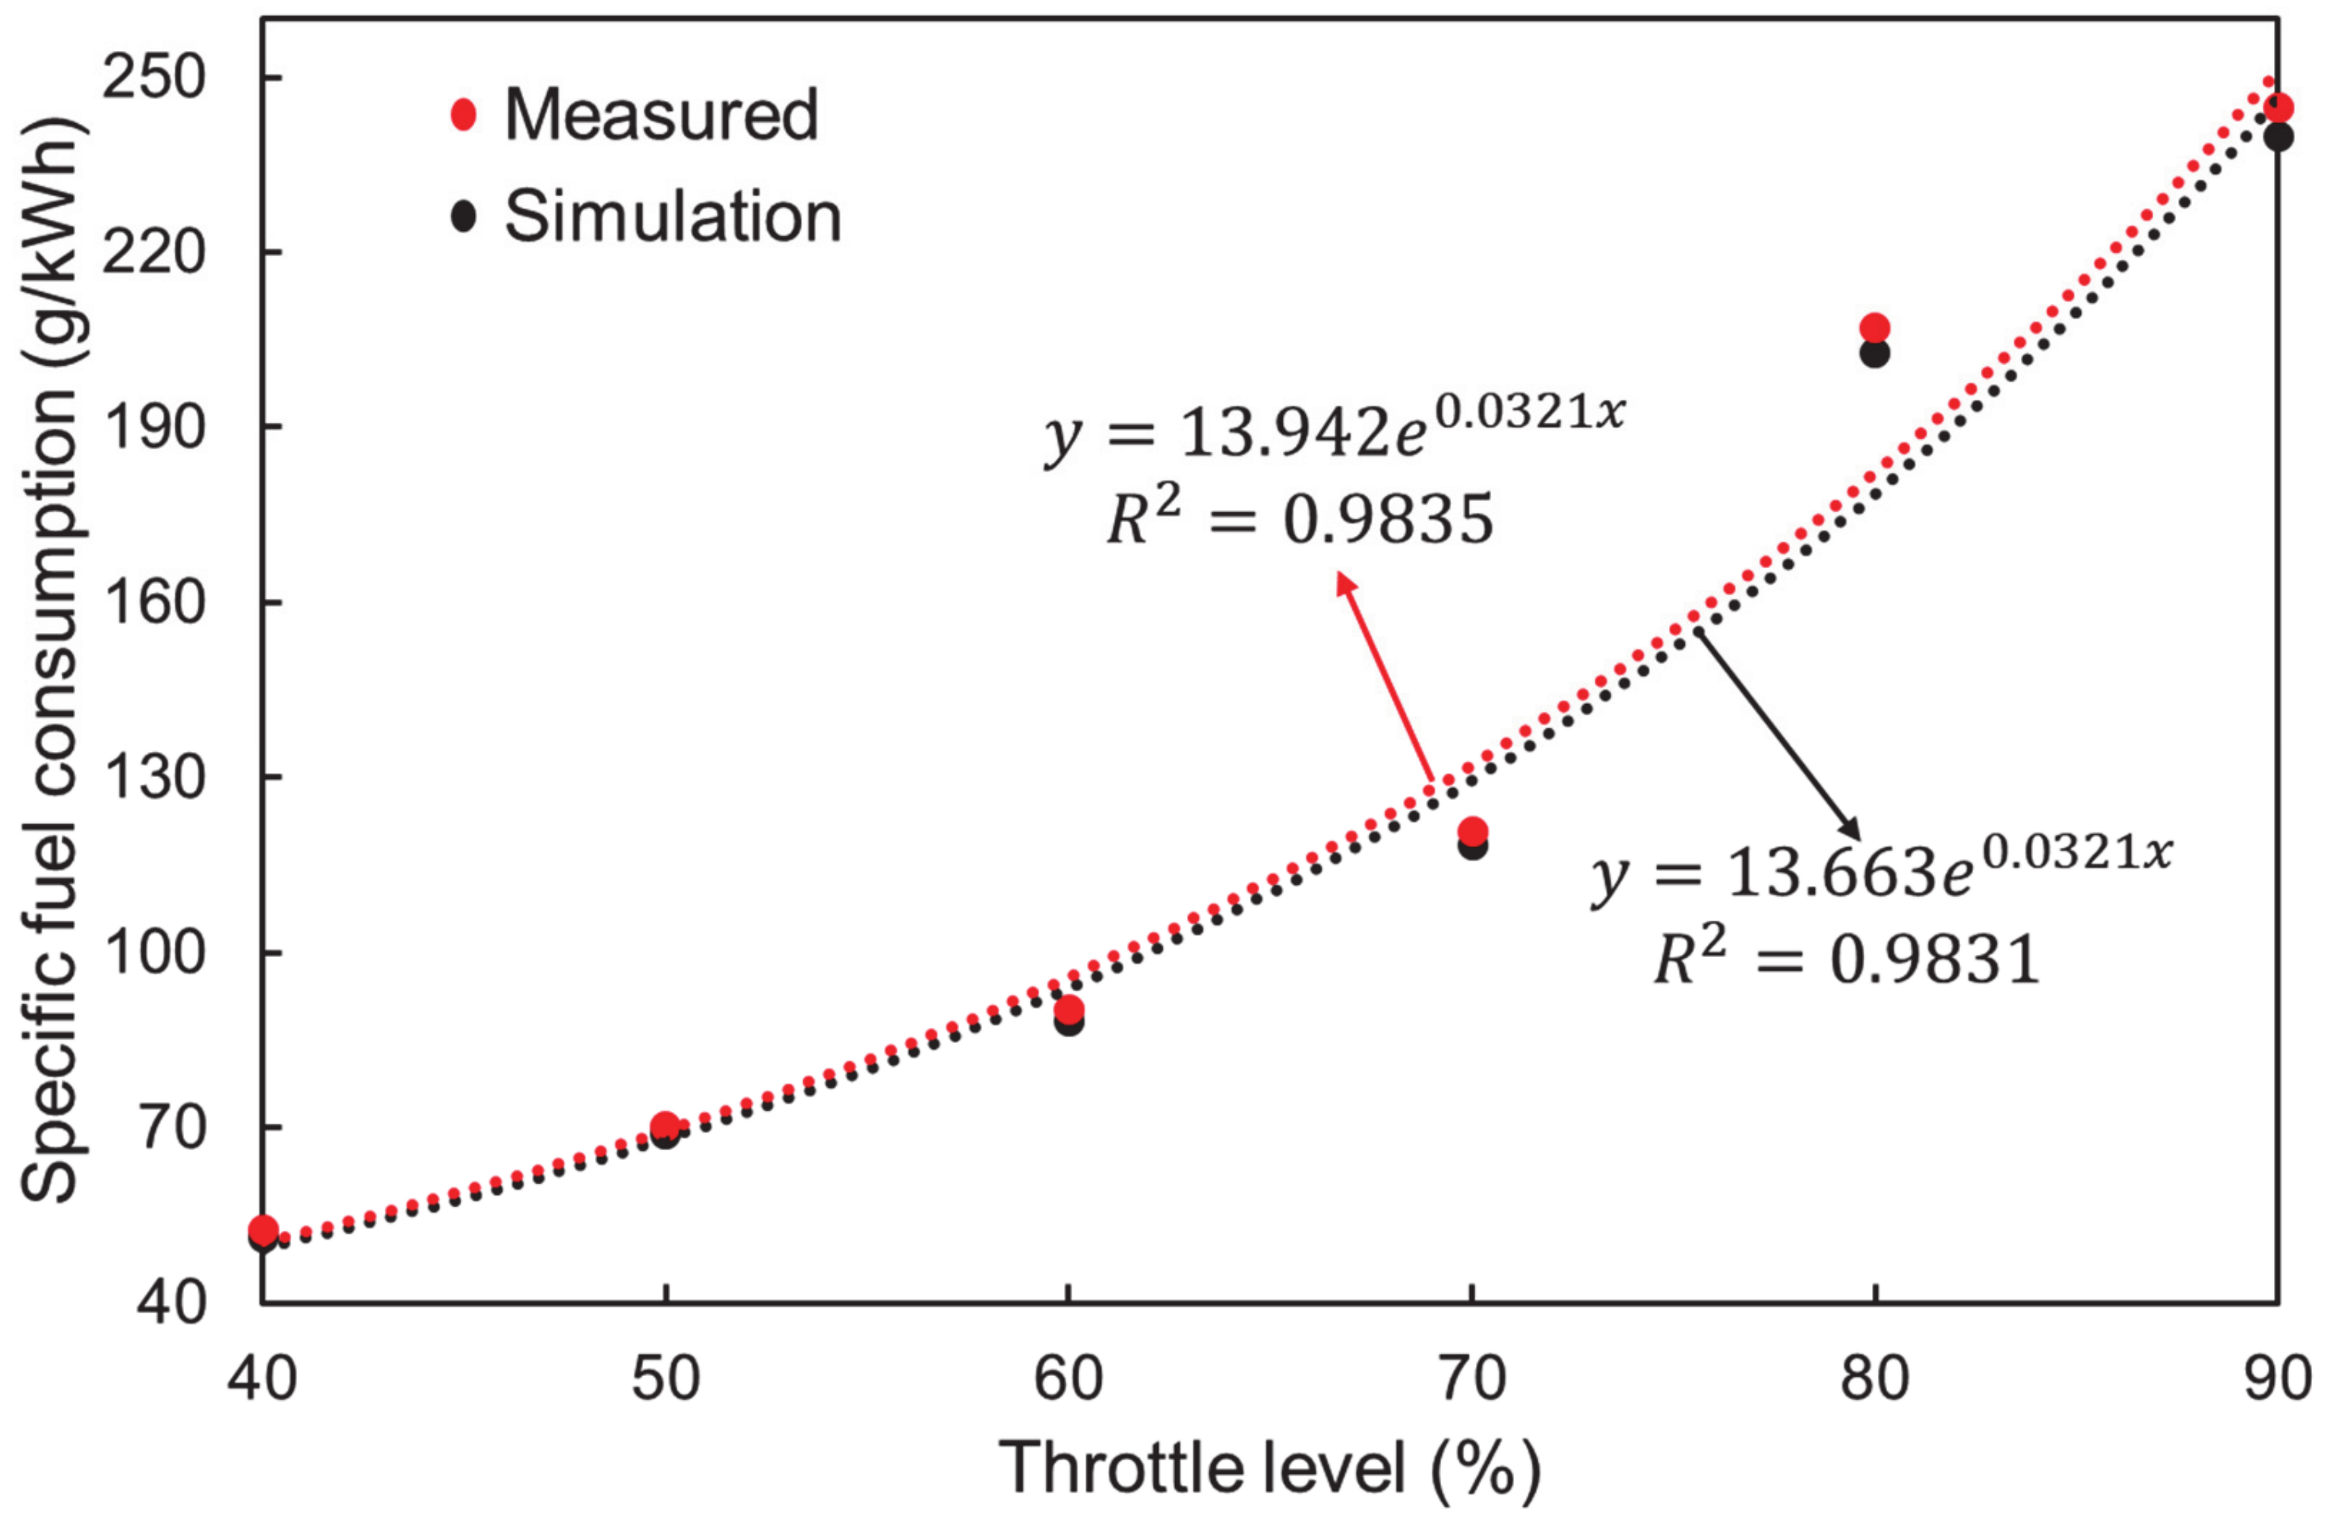
3.2. Specific Fuel Consumption (SFC)
4. Discussion
- (1)
- It was noted that the engine torques for both simulation and measured were directly proportional to the engine load level. The statistical analysis (DMRT) proved that there was no significant difference between the simulation and measured engine torque at each load level. Kolator and Bialobrzewski [32] reported that engine load condition has a highly significant effect on tractor performance.
- (2)
- It was observed that the increasing rates of the fuel consumptions were parallel with each other and sharply increased with respect to the engine speed. Only for 70% of engine load level, the fuel consumption was dramatically increased after 2000 rpm of engine speed. It might be caused by an excessive flow that is the main reason for fuel losses [33]. Those results indicate that the hourly fuel consumptions were also directly proportional to the engine load levels. The SFCs at various engine load levels were analyzed statistically. The statistical analysis showed that there was no significant difference between the simulation and measured SFC as the significant level of 5%. The regression analysis with respect to throttle level showed that the increasing rate for both the simulation and measured SFCs at each load level. The results indicated that the engine load levels have a highly significant effect on the SFC of the PST tractor. Shafaei [31] reported over 0.90 of R-squared value will be reliable to verify the relationship. From the regression equation, it is clear that there was an exponential relationship between the SFC and engine load levels.
- (3)
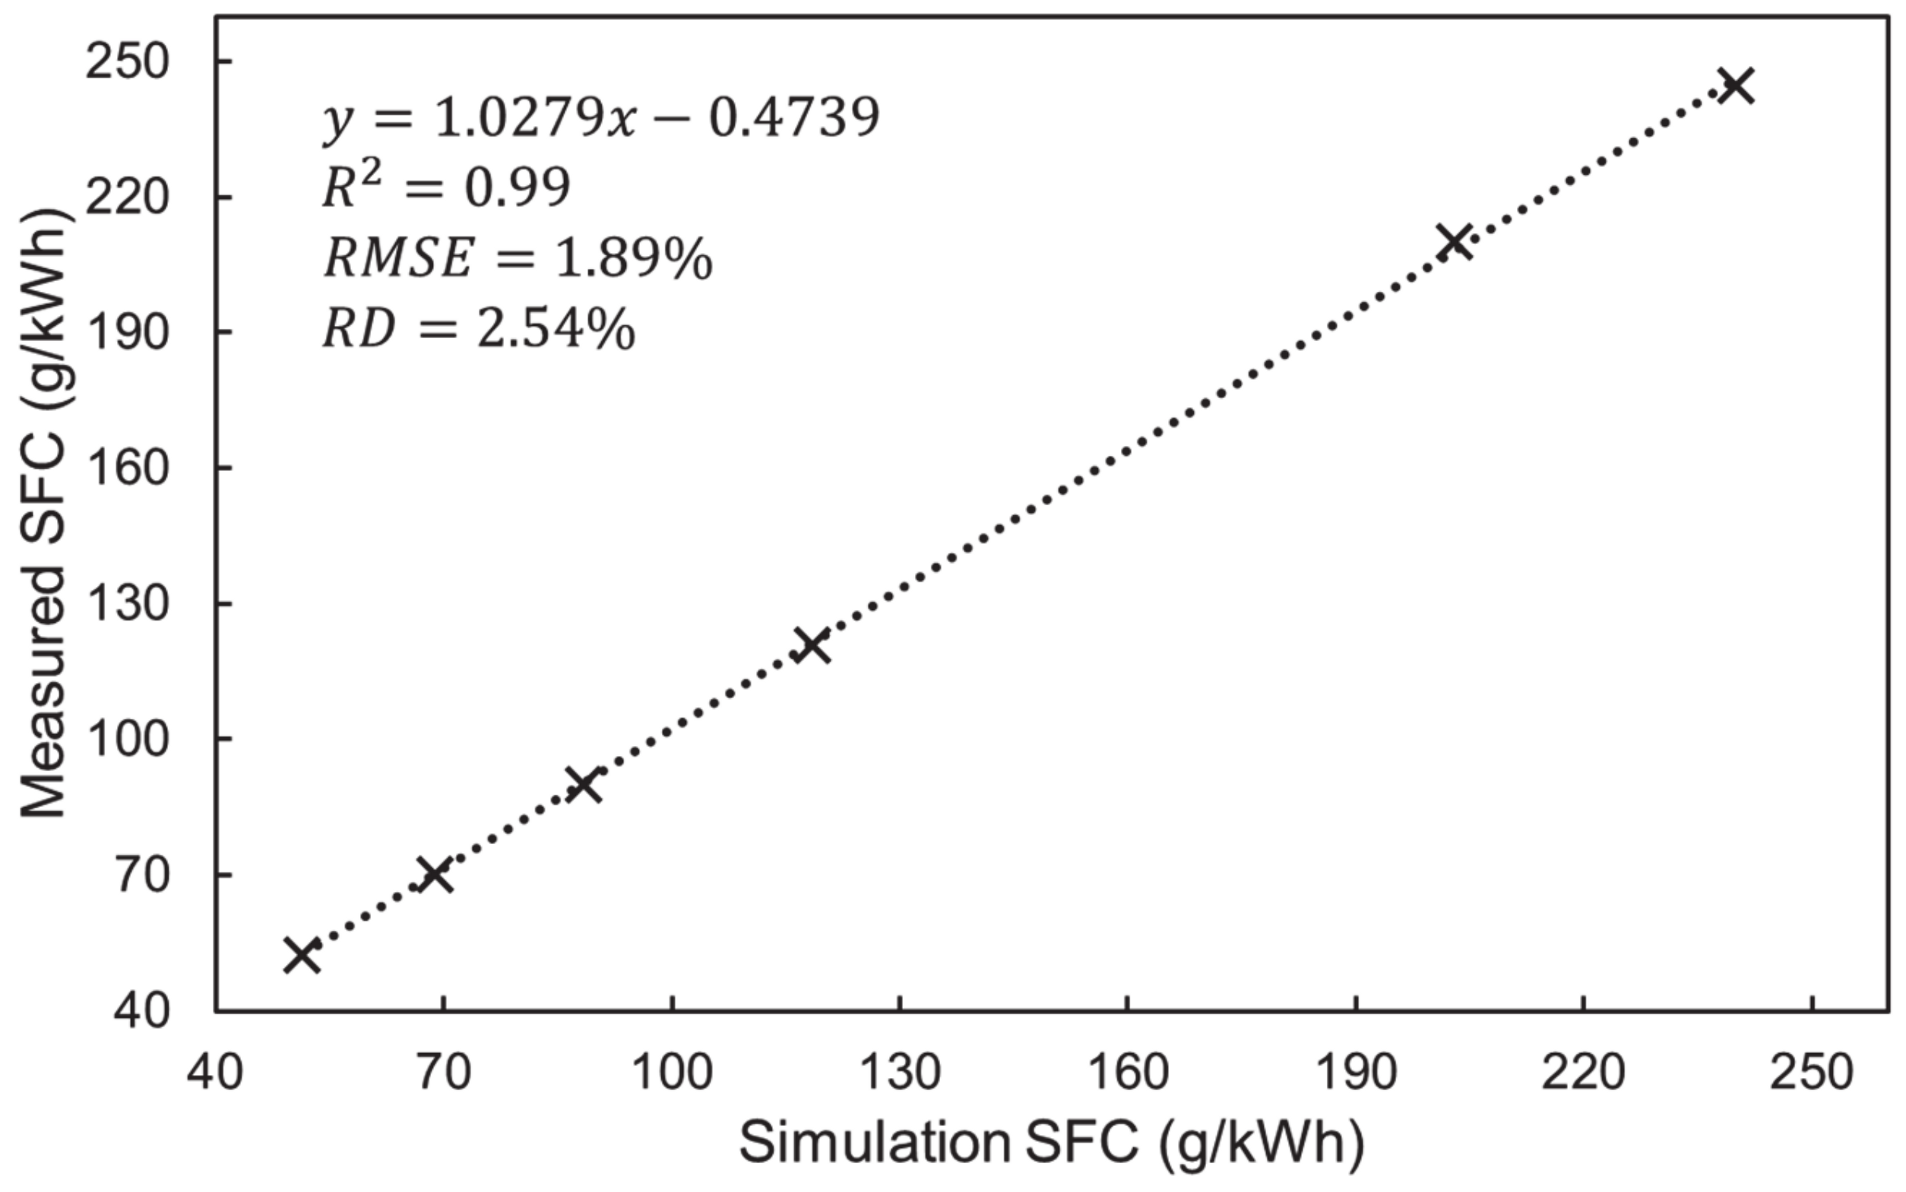
- To distinguish the similarity, accuracy, and error between the simulation and experimental methods to estimate the SFC, statistical tests (R-squared, RMSE, and RD) were also conducted. From the regression equation, it was clear that there was a linear relationship between the simulation and measured SFC. The statistical results proved that the simulation SFC was similar to the measured SFC.
- (4)
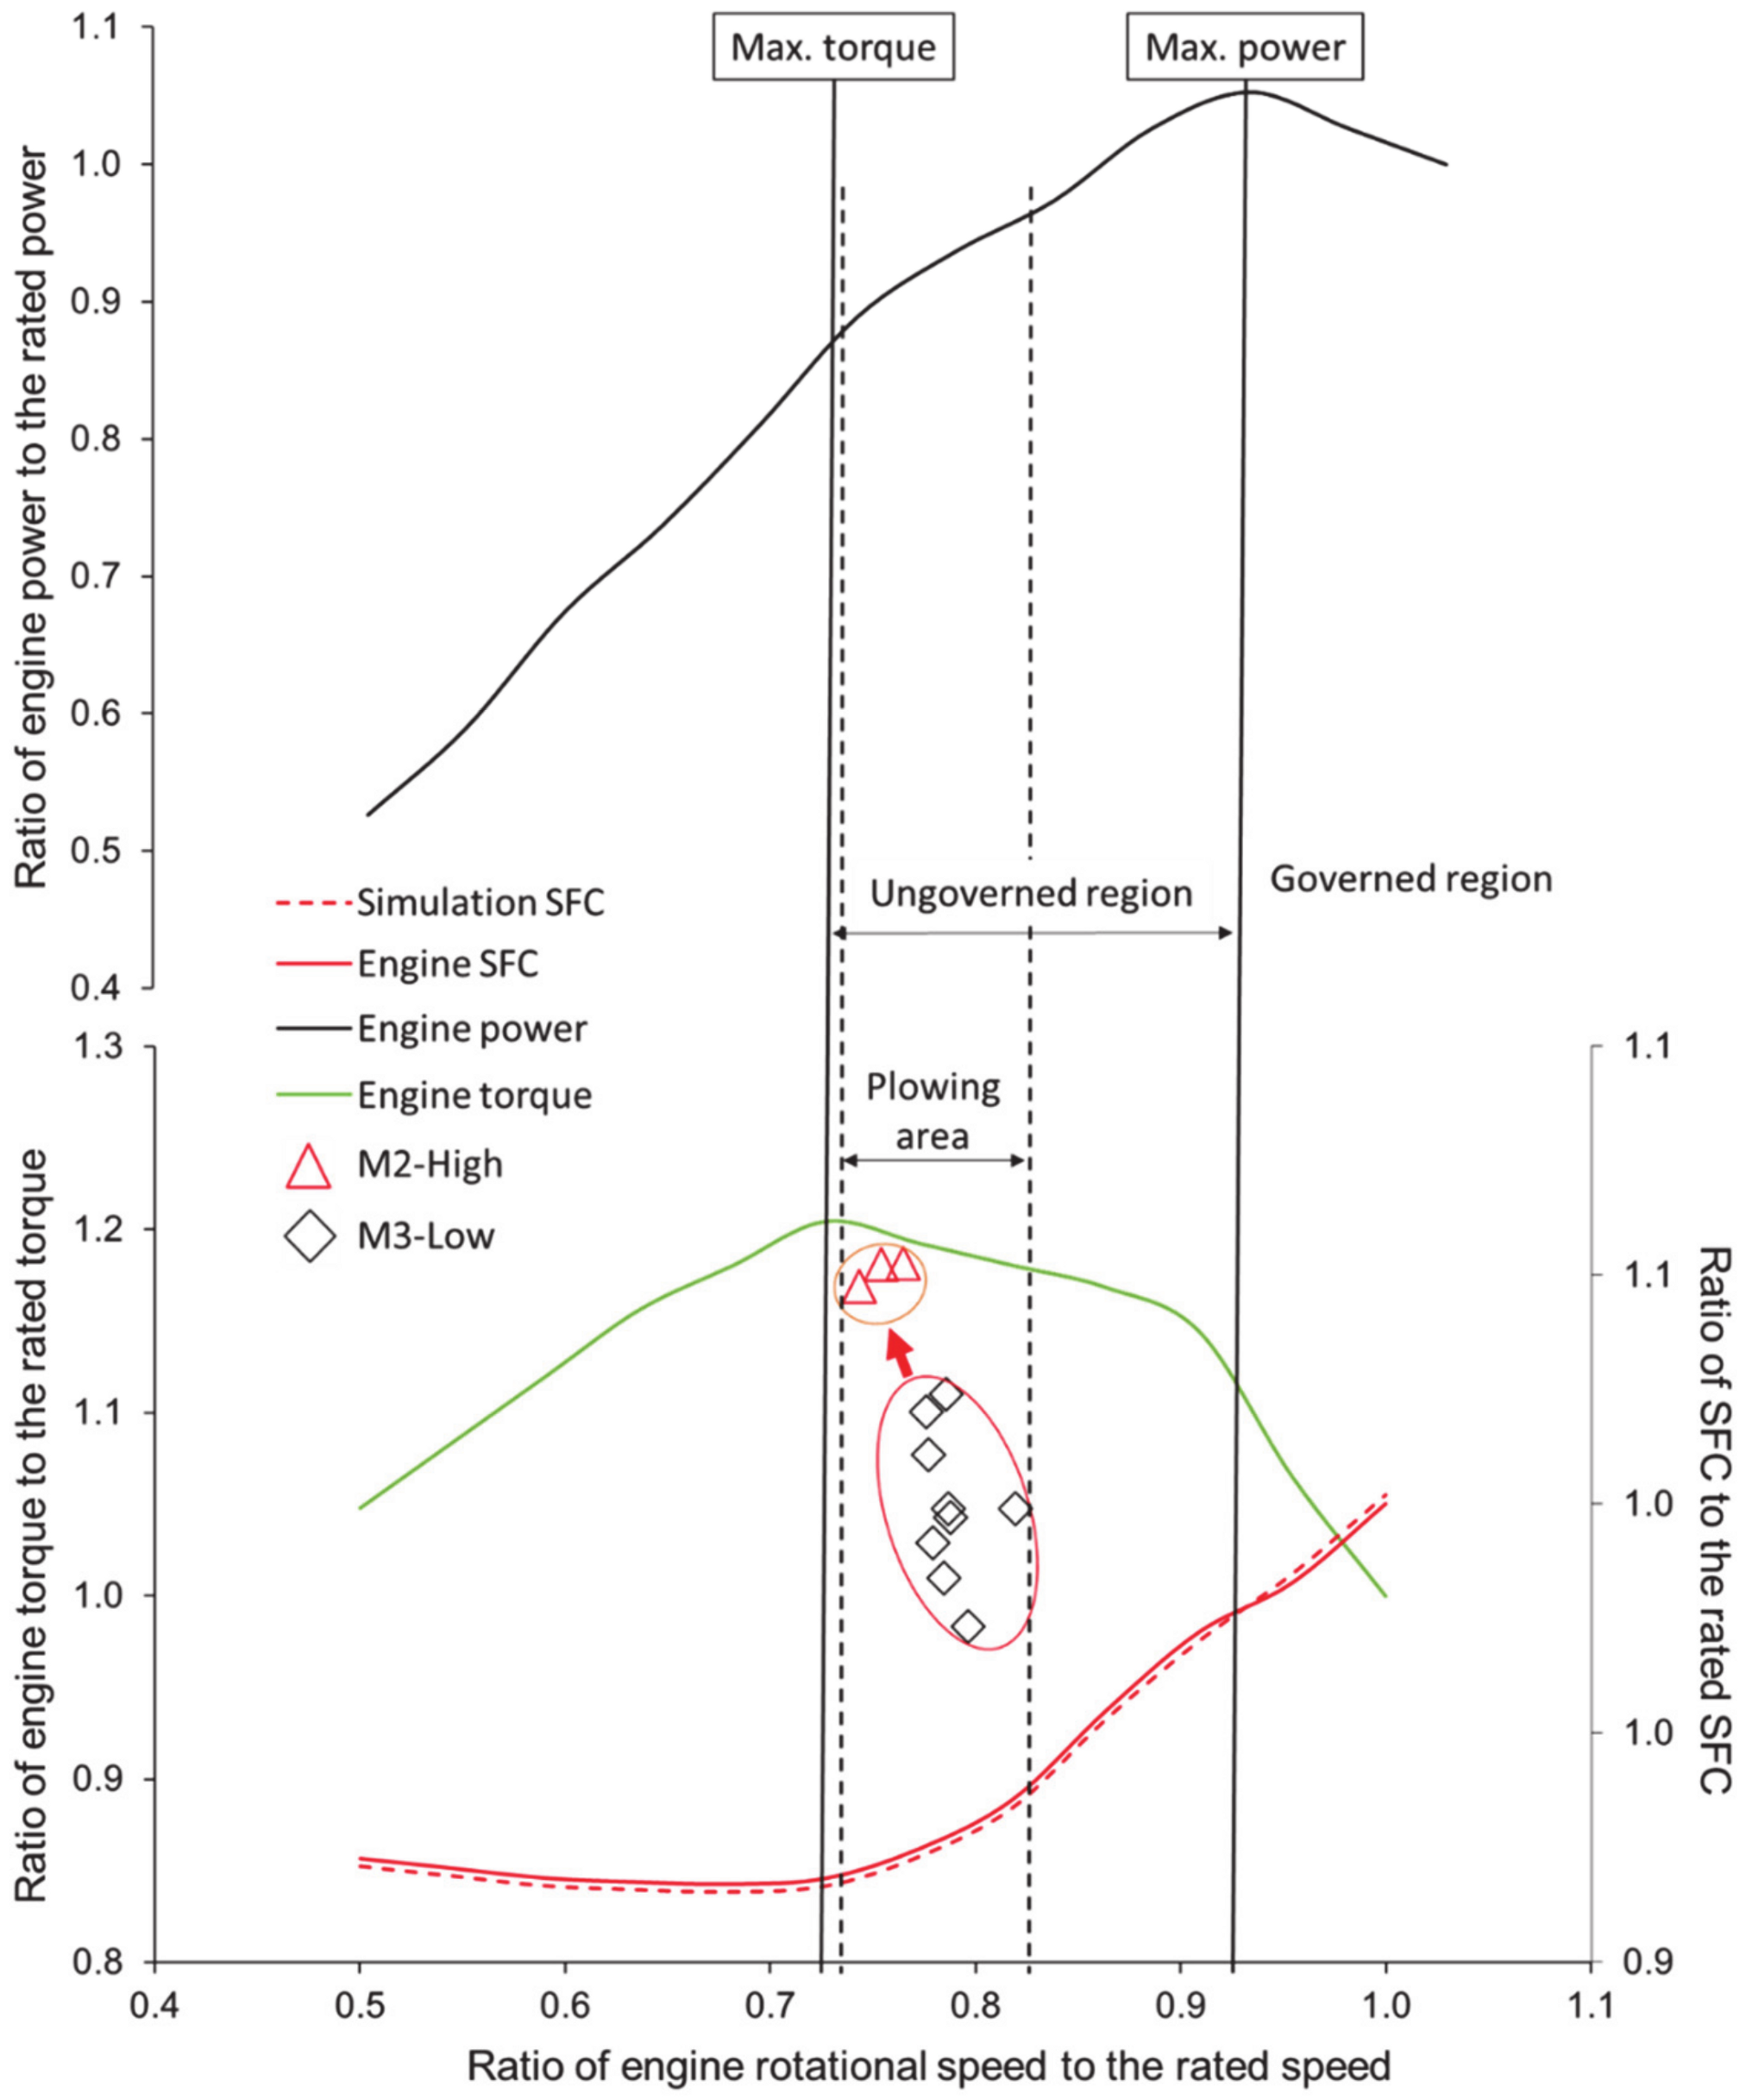
- It was observed that the engine generated power was higher at 9.81 km/h (M3-Low) than the soil strength, which indicated the loss of power. It was believed that the power loss had occurred by the travel reduction ratio (slip) [34]. The results indicated that the gear selection of 7.56 km/h (M2-High) was highly beneficial to conduct plow tillage operation using the 95 kW partial PST tractor considering high engine torque. To optimize the fuel consumption, the gear selection should be shifted to the M2-High instead of M3-Low because M3-Low generates low engine torque that might be suddenly turn-off the engine due to high soil strength [14].
5. Conclusions
- (1)
- It was observed that the highest maximum engine torques for both simulation and measured were 455 and 450 Nm at 90% of engine load, respectively. The lowest maximum torques for both methods were also found at 200 Nm at 40% of engine load. It was also observed that the maximum engine torques for both simulation and measured were at 1600 rpm of engine speed for all engine throttle levels. The statistical analysis (DMRT) proved that there was no significant difference between the simulation and measured engine torque at each throttle level. However, it was noticed that the engine torques for both simulation and measured were directly proportional to the engine throttle level.
- (2)
- The highest and lowest maximum hourly fuel consumptions for both simulation and measured were found around 20.22 and 19.95, and 6.42 and 6.55 kg/h at 90 and 40% of engine load, respectively. It was observed that the average increasing rate for both simulation and measured fuel consumption were comparatively higher at 70% of engine load than that of other engine load levels, accounting for 8.45 and 8.60 kg/h. The regression equations of the SFC of both simulation and measured with respect to the engine throttle levels represented that the SFC of both simulation and measured were increased almost 13.66 and 13.94 g/kWh, respectively for each 10% increase of engine load. The R-squared of both simulation and measured SFC were found almost 0.9831 and 0.9835, respectively. The analysis results show that there was no significant difference between the simulation and measured SFC, whereas the standard error (SE) was 1.14. The R-squared value was 0.99, whereas the RMSE and RD were approximately 1.89% and 2.54%, respectively.
Author Contributions
Funding
Institutional Review Board Statement
Informed Consent Statement
Data Availability Statement
Conflicts of Interest
References
- Kim, W.S.; Kim, Y.J.; Kim, Y.S.; Baek, S.Y.; Baek, S.M.; Lee, D.H.; Nam, K.C.; Kim, T.B.; Lee, H.J. Development of control system for automated manual transmission of 45-kW agricultural tractor. Appl. Sci. 2020, 10, 2930. [Google Scholar] [CrossRef]
- Shafaei, S.M.; Loghavi, M.; Kamgar, S. Fundamental realization of longitudinal slip efficiency of tractor wheels in a tillage practice. Soil Tillage Res. 2021, 205, 104765. [Google Scholar] [CrossRef]
- Islam, M.N.; Iqbal, M.Z.; Kabir, M.S.N.; Jung, K.Y.; Mun, D.H.; Chung, S.O. Performance Evaluation of Trenchless Subsurface Drainage Piping Machine. J. Biosyst. Eng. 2019, 44, 218–225. [Google Scholar] [CrossRef]
- Mairghany, M.; Yahya, A.; Adam, N.M.; Mat Su, A.S.; Aimrun, W.; Elsoragaby, S. Rotary tillage effects on some selected physical properties of fine textured soil in wetland rice cultivation in Malaysia. Soil Tillage Res. 2019, 194, 104318. [Google Scholar] [CrossRef]
- Kim, W.S.; Kim, Y.J.; Baek, S.M.; Moon, S.P.; Lee, N.G.; Kim, Y.S.; Park, S.U.; Choi, Y.; Kim, Y.K.; Choi, I.S.; et al. Fatigue life simulation of tractor spiral bevel gear according to major agricultural operations. Appl. Sci. 2020, 10, 8898. [Google Scholar] [CrossRef]
- Mordor Intelligence. Available online: https://www.mordorintelligence.com/industry-reports/india-agricultural-tractormachinery-%0Amarket (accessed on 16 March 2021).
- Kim, Y.S.; Lee, P.U.; Kim, W.S.; Kwon, O.W.; Kim, C.W.; Lee, K.H.; Kim, Y.J. Strength analysis of a PTO (Power Take-Off) gear-train of a multi-purpose cultivator during a rotary ditching operation. Energies 2019, 12, 1100. [Google Scholar] [CrossRef] [Green Version]
- Siddique, M.A.A.; Kim, W.S.; Kim, Y.S.; Kim, T.J.; Choi, C.H.; Lee, H.J.; Chung, S.O.; Kim, Y.J. Effects of temperatures and viscosity of the hydraulic oils on the proportional valve for a rice transplanter based on PID control algorithm. Agriculture 2020, 10, 73. [Google Scholar] [CrossRef] [Green Version]
- Tanelli, M.; Panzani, G.; Savaresi, S.M.; Pirola, C. Transmission control for power-shift agricultural tractors: Design and end-of-line automatic tuning. Mechatronics 2011, 21, 285–297. [Google Scholar] [CrossRef]
- Siddique, M.A.A.; Kim, W.S.; Kim, Y.S.; Baek, S.Y.; Baek, S.M.; Kim, Y.J.; Park, S.U.; Choi, C.H. Simulation of Design Factors of a Clutch Pack for Power-Shift Transmission for an Agricultural Tractor. Sensors 2020, 20, 7293. [Google Scholar] [CrossRef]
- Liyou, X.; Yihao, Z.; Jinzhong, S.; Xianghai, Y. Optimization of power shift tractor clutch based on ahp and improved genetic algorithm. Acta Tech. 2017, 62, 373–384. [Google Scholar]
- Siddique, M.A.A.; Kim, T.J.; Kim, Y.J. Technical Trend of the Power Shift Transmission (PST) of Agricultural Tractor. J. Drive Control 2020, 17, 68–75. [Google Scholar]
- Liang, J.; Yang, H.; Wu, J.; Zhang, N.; Walker, P.D. Power-on shifting in dual input clutchless power-shifting transmission for electric vehicles. Mech. Mach. Theory 2018, 121, 487–501. [Google Scholar] [CrossRef]
- Lee, J.W.; Kim, S.C.; Oh, J.; Chung, W.J.; Han, H.W.; Kim, J.T.; Park, Y.J. Engine speed control system for improving the fuel efficiency of agricultural tractors for plowing operations. Appl. Sci. 2019, 9, 3898. [Google Scholar] [CrossRef] [Green Version]
- Grisso, R.; Pitman, R.; Perumpral, J.V.; Roberson, G.T. Gear up and Throttle down to Save Fuel. In Virginia Cooperative Extension; Virginia Tech.: Blacksburg, VA, USA, 2010; pp. 442–450. [Google Scholar]
- Park, S.H.; Kim, Y.J.; Im, D.H.; Kim, C.K.; Jung, S.C.; Kim, H.J.; Jang, Y.; Kim, S.S. Development of Eco Driving System for Agricultural Tractor. J. Biosyst. Eng. 2010, 35, 77–84. [Google Scholar] [CrossRef] [Green Version]
- Jiang, J. Optimal Gain Scheduling Controller for a Diesel Engine. IEEE Control Syst. 1994, 14, 42–48. [Google Scholar] [CrossRef]
- Sung, S.W.; Lee, I.B. Limitations and countermeasures of PID controllers. Ind. Eng. Chem. Res. 1996, 35, 2596–2610. [Google Scholar] [CrossRef]
- Saunders, C.; Ucgul, M.; Godwin, R.J. Discrete element method (DEM) simulation to improve performance of a mouldboard skimmer. Soil Tillage Res. 2021, 205, 104764. [Google Scholar] [CrossRef]
- Kim, W.S.; Kim, Y.J.; Baek, S.Y.; Baek, S.M.; Kim, Y.S.; Park, S.U. Development of a prediction model for tractor axle torque during tillage operation. Appl. Sci. 2020, 10, 4195. [Google Scholar] [CrossRef]
- Kim, W.-S.; Kim, Y.-S.; Kim, Y.-J. Development of Prediction Model for Axle Torque of Agricultural Tractors. Trans. ASABE 2020, 63, 1773–1786. [Google Scholar] [CrossRef]
- Kim, Y.S.; Kim, W.S.; Baek, S.Y.; Baek, S.M.; Kim, Y.J.; Lee, S.D.; Kim, Y.J. Analysis of tillage depth and gear selection for mechanical load and fuel efficiency of an agricultural tractor using an agricultural field measuring system. Sensors 2020, 20, 2450. [Google Scholar] [CrossRef]
- Goering, C.E. Engine and Tractor Power; American Society of Agricultural Engineers (ASAE): St. Joseph, MI, USA, 1992. [Google Scholar]
- Bietresato, M.; Friso, D.; Sartori, L. Assessment of the efficiency of tractor transmissions using acceleration tests. Biosyst. Eng. 2012, 112, 171–180. [Google Scholar] [CrossRef]
- Chancellor, W.J.; Thai, N.C. Automatic Control of Tractor Transmission Ratio and Engine Speed. Trans. ASAE 1984, 27, 642–0646. [Google Scholar] [CrossRef]
- Zhang, N.; Perumpral, J.; Byler, R.K. Automatic control system for optimizing diesel engine performance. Comput. Electron. Agric. 1987, 2, 31–46. [Google Scholar] [CrossRef]
- De Farias, M.S.; Schlosser, J.F.; Linares, P.; Bertollo, G.M.; Martini, A.T. Reduction of fuel consumption using driving strategy in agricultural tractor. Rev. Bras. Eng. Agric. E Ambient. 2019, 23, 144–149. [Google Scholar] [CrossRef] [Green Version]
- Gui, X.Q.; Goering, C.E.; Buck, N.L. Simulation of a fuel-efficient augmented engine. Trans. Am. Soc. Agric. Eng. 1989, 32, 1875–1881. [Google Scholar] [CrossRef]
- Li, B.; Sun, D.; Hu, M.; Liu, J. Research on economic comprehensive control strategies of tractor-planter combinations in planting, including gear-shift and cruise control. Energies 2018, 11, 686. [Google Scholar] [CrossRef] [Green Version]
- Bera, P. Torque characteristic of SI engine in dynamic operating states. Combust. Engines 2017, 171, 175–180. [Google Scholar] [CrossRef]
- Shafaei, S.M.; Kamgar, S. A comprehensive investigation on static and dynamic friction coefficients of wheat grain with the adoption of statistical analysis. J. Adv. Res. 2017, 8, 351–361. [Google Scholar] [CrossRef]
- Kolator, B.; Białobrzewski, I. A simulation model of 2WD tractor performance. Comput. Electron. Agric. 2011, 76, 231–239. [Google Scholar] [CrossRef]
- Knauder, C.; Allmaier, H.; Sander, D.E.; Sams, T. Investigations of the friction losses of different engine concepts. Part 1: A combined approach for applying subassembly-resolved friction loss analysis on a modern passenger-car diesel engine. Lubricants 2019, 7, 39. [Google Scholar] [CrossRef] [Green Version]
- Renius, K.T. Fundamentals of Tractor Design, 1st ed.; Springer International Publishing: Cham, Switzerland, 2019; ISBN 978-3-030-32804-7. [Google Scholar]
- Iqbal, M.Z.; Islam, M.N.; Chowdhury, M.; Islam, S.; Park, T.; Kim, Y.-J.; Chung, S.-O. Working Speed Analysis of the Gear-Driven Dibbling Mechanism of a 2.6 kW Walking-Type Automatic Pepper Transplanter. Machines 2021, 9, 6. [Google Scholar] [CrossRef]
- Baek, S.M.; Kim, W.S.; Kim, Y.S.; Baek, S.Y.; Kim, Y.J. Development of a simulation model for HMT of a 50 kW class agricultural tractor. Appl. Sci. 2020, 10, 4064. [Google Scholar] [CrossRef]
- Howard, C.N.; Kocher, M.F.; Hoy, R.M.; Blankenship, E.E. Testing the fuel efficiency of tractors with continuously variable and standard geared transmissions. Trans. ASABE 2013, 56, 869–879. [Google Scholar] [CrossRef] [Green Version]
- Kim, Y.S.; Kim, W.S.; Siddique, M.A.A.; Baek, S.Y.; Baek, S.M.; Cheon, S.H.; Lee, S.D.; Lee, K.H.; Hong, D.H.; Park, S.U.; et al. Power transmission efficiency analysis of 42 kW power agricultural tractor according to tillage depth during moldboard plowing. Agronomy 2020, 10, 1263. [Google Scholar] [CrossRef]


| Parameters | Specifications | |
|---|---|---|
| Model | TS130, TYM, Korea | |
| Weight (N) | Gross weight (N) | 44,587 |
| Weight distribution (%) | 40.3 and 59.7 | |
| Engine | Type | Tier 4 |
| Rated power (kW) | 95 | |
| Rated torque (Nm) | 415 | |
| Rated speed (rpm) | 2200 | |
| Shifting method | Power-shift | |
| Transmission | Gear stages | 6 (1, 2, 3, 4, 5, 6) |
| Sub-shifting stages | 3 (L, M, H) | |
| Combinations (forward × reverse) | 18 × 18 | |
| Tire | Model (front and rear) | 380/85R24 and 460/85R38 |
| Diameter (front and rear) (mm) | 1256 and 1770 | |
| Parameters | Specifications |
|---|---|
| Model | SE 500, SAJ, India |
| Type | EDDY Current |
| Maximum power (kW) | 500 |
| Maximum torque (Nm) | 3000 @1800 rpm |
| Speed (rpm) | 1600~4500 |
| Inertia (kgm2) | 2.196 |
| Load cell type | U4000 |
| Weight (kg) | 1500 |
| Method | Simulation Engine Torques (Nm) | p-Value | |||||
|---|---|---|---|---|---|---|---|
| Load Levels (%) | 40 | 50 | 60 | 70 | 80 | 90 | |
| Maximum | 200 | 247.52 | 306.12 | 346.53 | 400 | 455 | 0.000 |
| Minimum | 164.36 | 205.45 | 254.08 | 287.62 | 335 | 369.80 | |
| Avg. ± S.D.* | 186.62 ± 11.30 a | 230.08 ± 14.49 b | 284.55 ± 17.92 c | 322.11 ± 20.28 d | 371.76 ± 23.70 e | 419.41 ± 28.07 f | |
| Method | Measured Engine Torques (Nm) | ||||||
| Maximum | 200 | 250 | 300 | 350 | 400 | 450 | |
| Minimum | 166 | 207.50 | 249 | 290.50 | 332 | 373.50 | |
| Avg. ± S.D.* | 185.91 ± 11.71 a | 232.38 ± 14.63 b | 278.86 ± 17.56 c | 325.34 ± 20.48 d | 371.81 ± 23.41 e | 418.29 ± 26.34 f | |
| Method | Simulation Fuel Consumption (kg/h) | p-Value | |||||
|---|---|---|---|---|---|---|---|
| Load Levels (%) | 40 | 50 | 60 | 70 | 80 | 90 | |
| Max. at 2200 rpm | 6.42 | 7.72 | 10.14 | 15.19 | 17.08 | 20.22 | 0.000 |
| Min. at 1100 rpm | 1.57 | 2.42 | 2.42 | 4.88 | 7.67 | 8.90 | |
| Avg. ± S.D. | 3.76 ± 1.41 a | 4.88 ± 1.70 b | 6.14 ± 2.04 c | 8.45 ± 3.23 d | 12.93 ± 3.18 e | 15.15 ± 3.65 f | |
| Method | Measured Fuel Consumption (kg/h) | ||||||
| Max. at 2200 rpm | 6.55 | 7.88 | 10.35 | 15.19 | 17.43 | 19.95 | |
| Min. at 1100 rpm | 1.61 | 2.47 | 3.36 | 4.98 | 7.83 | 9.08 | |
| Avg. ± S.D.* | 3.84 ± 1.44 a | 4.98 ± 1.73 b | 6.27 ± 2.09 c | 8.60 ± 3.23 d | 11.56 ± 3.25 e | 15.35 ± 3.58 f | |
| Method | Specific Fuel Consumption (g/kWh) | p-Value | SE | |||||
|---|---|---|---|---|---|---|---|---|
| Load Levels (%) | 40 | 50 | 60 | 70 | 80 | 90 | ||
| Simulation | 51.35 ± 9.81 a * | 68.81 ± 14.22 b | 18.71 ± 18.71 c | 118.46 ± 30.24 d | 202.92 ± 44.86 e | 239.91 ± 51.37 f | 0.000 | 1.14 |
| Measured | 52.40 ± 10.01 a | 70.21 ± 14.51 b | 90.14 ± 19.09 c | 120.88 ± 30.24 d | 207.06 ± 45.78 e | 244.81 ± 52.41 f | ||
Publisher’s Note: MDPI stays neutral with regard to jurisdictional claims in published maps and institutional affiliations. |
© 2021 by the authors. Licensee MDPI, Basel, Switzerland. This article is an open access article distributed under the terms and conditions of the Creative Commons Attribution (CC BY) license (http://creativecommons.org/licenses/by/4.0/).
Share and Cite
Siddique, M.A.A.; Baek, S.-M.; Baek, S.-Y.; Kim, W.-S.; Kim, Y.-S.; Kim, Y.-J.; Lee, D.-H.; Lee, K.-H.; Hwang, J.-Y. Simulation of Fuel Consumption Based on Engine Load Level of a 95 kW Partial Power-Shift Transmission Tractor. Agriculture 2021, 11, 276. https://0-doi-org.brum.beds.ac.uk/10.3390/agriculture11030276
Siddique MAA, Baek S-M, Baek S-Y, Kim W-S, Kim Y-S, Kim Y-J, Lee D-H, Lee K-H, Hwang J-Y. Simulation of Fuel Consumption Based on Engine Load Level of a 95 kW Partial Power-Shift Transmission Tractor. Agriculture. 2021; 11(3):276. https://0-doi-org.brum.beds.ac.uk/10.3390/agriculture11030276
Chicago/Turabian StyleSiddique, Md. Abu Ayub, Seung-Min Baek, Seung-Yun Baek, Wan-Soo Kim, Yeon-Soo Kim, Yong-Joo Kim, Dae-Hyun Lee, Kwan-Ho Lee, and Joon-Yeal Hwang. 2021. "Simulation of Fuel Consumption Based on Engine Load Level of a 95 kW Partial Power-Shift Transmission Tractor" Agriculture 11, no. 3: 276. https://0-doi-org.brum.beds.ac.uk/10.3390/agriculture11030276