
Examining the Influence of Sludge from Municipal Wastewater Treatment Plants Processed by Euphore Installations on the Quantity and Quality of Rapeseed and Soybean Production


Abstract
:1. Introduction
2. Materials and Methods
3. Results and Discussion
- -
- probability of transgression, ;
- -
- degrees of freedom for the observations, p;
- -
- degrees of freedom, for estimating the standard error.
- -
- the quantile of the studentized range distribution;
- -
- the shortest significant range (the actual critical value of the test).
- For each mi sample mean (Hi), from largest to smallest, the differences are calculated:with:where:
- i, (i = 1, 2, …, NV) is designated as the Superior Rank of variants, and
- j, (j = NV, NV-1, …, 2) is designated as the Inferior Rank of variants.
- The values for shortest significant range, were taken from Table 4, where, with .
- The values for the Ranks of variants, i and j, as well as for the difference with the values are compared: or .
- -
- 3.1. If or the variants used in the difference are significant.
- -
- 3.2. If or the variants used in the difference are insignificant.
- -
- of the p = 9 treatment variants, 5 variants are insignificant, and 4 are significant
- -
- insignificant treatment options are T2, T6, T7, T8, and T9
- -
- significant treatment options are T1, T3, T4, and T5.
- -
- the roots of the soybean plant contained heavy metals below the maximum permissible values, except for Pb that exceeded the value by 0.45 mg/kg dry substance; the highest concentrations of Pb (15.45 mg/kg dry substance), Cd (0.19 mg/kg dry substance.), Ni (12.74 mg/kg dry substance.), Cu (8.8 mg/kg dry substance.), and Zn (29.4 mg/kg dry substance.) were obtained for the dose of 35 t/ha, for the variant of soil treated with dry raw sludge.
- -
- the stems of the soybean plant contained heavy metals below the maximum allowable values; the highest concentrations of Pb (13.98 mg/kg dry substance), Cd (0.17 mg/kg dry substance.), Ni (8.15 mg/kg dry substance), Cu (7.64 mg/kg dry substance), and Zn (23.45 mg/kg dry substance) were obtained for the dose of 35 t/ha, for the variant of soil treated with dry raw sludge.
- -
- soybeans had a heavy metal content below the maximum admissible values; the highest concentrations of Pb (11.34 mg/kg dry substance), Cd (0.17 mg/kg dry substance), Ni (6.71 mg/kg dry substance), Cu (8.08 mg/kg dry substance), and Zn (24.96 mg/kg dry substance) were obtained for the dose of 35 t/ha, for the variant of soil treated with dry raw sludge.
- -
- the concentration of Ni, Cu, and Zn in stems, roots, and beans were well below the level of toxicity in all organs of the soybean plant regardless of the applied dose. Rapeseed crops consume a lot of phosphorus. That is why it is recommended to fertilize the soil before sowing and plowing. The Pioneer PT225 Rapeseed Hybrid was chosen because it is resistant and it has good production.
- -
- Basic autumn fertilization at sowing and autumn foliar fertilization at the stage of 6–8 leaves.
- -
- Phase fertilization I at the rosette stage, 8–11 leaves and phase fertilization II at the stage of the incipient floral buds.
- -
- Spring foliar fertilization at the stage of green and yellow floral buds.
- -
- of the p = 9 treatment variants, 2 variants are insignificant, and 7 are significant;
- -
- insignificant treatment options are T8 and T9;
- -
- significant treatment options are T1, T2, T3, T4, T5, T6, and T7.
4. Conclusions
Author Contributions
Funding
Institutional Review Board Statement
Informed Consent Statement
Data Availability Statement
Conflicts of Interest
References
- Adesodum, J.K.A.; Mbagwu, J.S.C.; Oti, N. Structural stability and carbohydrate contents of an ultisol under different management systems. Soil Till. 2001, 60, 135–142. [Google Scholar] [CrossRef]
- Bittencourt, S.; Serrat, B.M.; Aisse, M.M.; Gomes, D. Sewage sludge usage in agriculture: A case study of its destination in the curitiba metropolitan region, paraná, Brazil. Water Air Soil Pollut. 2014, 225, 2074. [Google Scholar] [CrossRef]
- Iticescu, C.; Georgescu, L.P.; Murariu, G.; Circiumaru, A.; Timofti, M. The characteristics of sewage sludge used on agricultural lands. AIP Conf. Proc. 2018, 2022, 020001. [Google Scholar] [CrossRef]
- Tsadilas, C.D.; Hu, Z.; Bi, Y.; Nikoli, T. Utilization of coal fly ash and municipal sewage sludge in agriculture and for reconstruction of soils in disturbed lands: Results of case studies from Greece and China. Int. J. Coal Sci. Technol. 2018, 5, 64–69. [Google Scholar] [CrossRef] [Green Version]
- Kirchmann, H.; Börjesson, G.; Kätterer, T.; Cohen, Y. From agricultural use of sewage sludge to nutrient extraction: A soil science outlook. Ambio 2017, 46, 143–154. [Google Scholar] [CrossRef] [Green Version]
- Kocik, A.; Truchan, M.; Rozen, A. Application of willows (Salix viminalis) and earthworms (Eisenia fetida) in sewage sludge treatment. Eur. J. Soil Biol. 2007, 43, 327–331. [Google Scholar] [CrossRef]
- Gherghel, A.; Teodosiu, C.; De Gisi, S.A. Review on wastewater sludge valorisation and its challenges in the context of circular economy. J. Clean. Prod. 2019, 228, 244–263. [Google Scholar] [CrossRef]
- Duan, B.; Zhang, W.; Zheng, H.; Wu, C.; Zhang, Q.; Bu, Y. Disposal situation of sewage sludge from municipal wastewater treatment plants and assessment of the ecological risk of heavy metals for its land use in Shanxi, China. Int. J. Environ. Res. Public Health 2017, 14, 823. [Google Scholar] [CrossRef] [PubMed] [Green Version]
- Ågren, G.I.; Wetterstedt, J.Å.M. What determines the temperature response of soil organic matter decomposition. Soil Biol. Biochem. 2007, 39, 1794–1798. [Google Scholar] [CrossRef] [Green Version]
- Nascimento, A.L.; de Souza, A.J.; Oliveira, F.C.; Coscione, A.R.; Viana, D.G.; Regitano, J.B. Chemical attributes of sewage sludges: Relationships to sources and treatments, and implications for sludge usage in agriculture. J. Clean. Prod. 2020, 258. [Google Scholar] [CrossRef]
- Przydatek, G.; Wota, A.K. Analysis of the comprehensive management of sewage sludge in Poland. J. Mater. Cycles Waste Manag. 2020, 22, 80–88. [Google Scholar] [CrossRef] [Green Version]
- Bazzoffi, P. Soil erosion tolerance and water runoff control: Minimum environmental standards. Reg. Environ. Chang. 2009, 9, 169–179. [Google Scholar] [CrossRef]
- Chatterjee, A.; Lal, R. On farm assessment of tillage impact on soil carbon and associated soil quality parameters. Soil Tillage Res. 2009, 104, 270–277. [Google Scholar] [CrossRef]
- Izaurralde, R.C.; Williams, J.R.; Post, W.M.; Thomson, A.M.; McGill, W.B. Long-term modeling of soil C erosion and sequestration at the small watershed scale. Clim. Chang. 2007, 80, 73–90. [Google Scholar] [CrossRef]
- Alvarenga, P.; Farto, M.; Mourinha, C.; Palma, P. Beneficial use of dewatered and composted sewage sludge as soil amendments: Behaviour of metals in soils and their uptake by plants. Waste Biomass Valoriz. 2016, 7, 1189–1201. [Google Scholar] [CrossRef]
- E-Correia, A.A.S.; Matos, M.P.S.R.; Gomes, A.R.; Rasteiro, M.G. Immobilization of heavy metals in contaminated soils–performance assessment in conditions similar to a real scenario. Appl. Sci. 2020, 10, 7950. [Google Scholar] [CrossRef]
- Eid, E.M.; Alrumman, S.A.; El-Bebany, A.F.; Hesham, A.E.-L.; Taher, M.A.; Fawy, K.F. The effects of different sewage sludge amendment rates on the heavy metal bioaccumulation, growth and biomass of cucumbers (Cucumis sativus L.). Environ. Sci. Pollut. Res. 2017, 24, 16371–16382. [Google Scholar] [CrossRef]
- Gawdzik, J. Mobility of heavy metals in municipal sewage sludge from different throughput sewage treatment plants. Pol. J. Environ. Stud. 2012, 21, 1603–1611. [Google Scholar]
- Parkpian, P.; Leong, S.T.; Preecha, L.; Torotoro, J. Influence of salinity and acidity on bioavailability of sludge-borne heavy metals. A case study of Bangkok municipal sludge. Water Air Soil Pollut. 2002, 139, 43–60. [Google Scholar]
- Singh, R.P.; Agrawal, M. Variations in heavy metal accumulation, growth and yield of rice plants grown at different sewage sludge amendment rates. Ecotoxicol. Environ. Saf. 2010, 73, 632–641. [Google Scholar] [CrossRef] [PubMed]
- Turek, A.; Wieczorek, K.; Wolf, W.M. Digestion Procedure and Determination of Heavy Metals in Sewage Sludge—An Analytical Problem. Sustainability 2019, 11, 1753. [Google Scholar] [CrossRef] [Green Version]
- Hamdi, H.; Hechmi, S.; Khelil, M.N.; Zoghlami, I.R.; Benzarti, S.; Tlili, S.M.; Hassen, A.; Jedidi, N. Repetitive land application of urban sewage sludge: Effect of amendment rates and soil texture on fertility and degradation parameters. Catena 2019, 172, 11–20. [Google Scholar] [CrossRef]
- Farasat, S.; Namli, A. Evaluating effects of sewage sludge on soil biochemical properties amounts (incubation experiment). Fresenenius Environ. Bull. 2016, 25, 1484–1493. [Google Scholar]
- Rastetter, N.; Gerhardt, A. Retraction Note to: Toxic potential of different types of sewage sludge as fertiliser in agriculture: Ecotoxicological effects on aquatic and soil indicator species. J. Soils Sediments 2016, 15, 565–577. [Google Scholar] [CrossRef]
- Charlton, A.; Sakrabani, R.; Tyrrel, S.; Casado, M.R.; McGrath, S.P.; Crooks, B.; Campbell, C.D. Long-term impact of sewage sludge application on soil microbial biomass: An evaluation using meta-analysis. Environ. Pollut. 2016, 219, 1021–1035. [Google Scholar] [CrossRef] [PubMed] [Green Version]
- Inglezakis, V.J.; Zorpas, A.; Karagiannidis, A.; Samaras, P.; Voukkali, I. European Union legislation on sewage sludge management. Fresenius Environ. Bull. 2014, 23, 635–639. [Google Scholar]
- Deeks, L.; Chaney, K.; Murray, C.; Sakrabi, R.; Gedara, S. A new sludge-derived organo-mineral fertilizer gives similar crop yields as conventional fertilizers. Agron. Sustain. Dev. 2013, 33, 539–549. [Google Scholar] [CrossRef]
- Lamastra, L.; Suciu, N.A.; Trevisan, M. Sewage sludge for sustainable agriculture: Contaminants’ contents and potential use as fertilizer. Chem. Biol. Technol. Agric. 2018, 5, 10. [Google Scholar] [CrossRef]
- Liu, H.-T. Achilles Heel of Environmental Risk from Recycling of Sludge to Soil as Amendment: A Summary in Recent Ten Years (2007–2016). Waste Manag. 2016, 56, 575–583. [Google Scholar] [CrossRef]
- Singh, R.P.; Agrawal, M. Potential benefits and risks of land application of sewage sludge. Waste Manag. 2008, 28, 347–358. [Google Scholar] [CrossRef] [PubMed]
- Jain, M.K.; Das, D. Estimation of sediment yield and areas of soil erosion and deposition for watershed prioritization using gis and remote sensing. Water Resour. Manag. 2010, 24, 2091–2112. [Google Scholar] [CrossRef]
- Lindstrom, M.J. Effects of residue harvesting on water runoff, soil erosion and nutrient loss. Agric. Ecosyst. Environ. 1986, 16, 103–112. [Google Scholar] [CrossRef]
- Wiechmann, C.; Dienemann, C.; Kabbe, S.; Brandt, I.; Vogel, A.R. Klärschlammentsorgung in der Bundesrepublik Deutschland. Für Umweltbundesamt. 2012. Available online: http://opus.kobv.de/zlb/volltexte/2012/13541/pdf/4280.pdf (accessed on 15 December 2020).
- Florea, N.; Munteanu, I. Romanian System of Soil Taxonomy; Estfalia Press: Bucharest, Romania, 2012; ISBN 978-606-112-0901. [Google Scholar]
- Stoica, E.; Rauta, C.; Florea, N. Methods of Soil Chemical Analysis; Research Institute of Soil Science and Agrochemestry: Bucharest, Romania, 1986. [Google Scholar]
- Jităreanu, G. Experimental Technique; “Ion Ionescu de la Brad” Publishing House: Iaşi, Romania, 2000; p. 256. ISBN 973-98979-3-2. [Google Scholar]
- ISO 659. Oilseeds-Determination of Oil Content-Reference Method. 2009. Available online: https://www.iso.org/standard/43169.html (accessed on 1 February 2021).
- FOSFA. Technical Manual. Available online: https://www.fosfa.org/technical-2/technical-manual/ (accessed on 8 March 2021).
- Harter, L.H.; Balakrishnan, N. Tables for the Use of Range and Studentized Range in Test of Hypotheses; CRC Press: Boca Raton, FL, USA, 1997; p. 677. ISBN 0-8493-3114-5. [Google Scholar]
- Tehnica Experimentala. Available online: https://www.yumpu.com/ro/document/read/62662785/tehnica-experimentala (accessed on 10 March 2021).
- Dumitru, E.; Calciu, I.; Carabulea, V.; Canarache, A. Metode de Analiza Utilizate in Laboratorul de Fizica a Solulu (Analysis Methods Use in Soil Physics Laboratory); Sitech Press: Craiova, Romania, 2009; ISBN 978-606-530-752-0. [Google Scholar]
- Lixandru, G. Sisteme Integrate de Fertilizare in Agricultura (Integrated Fertilization Systems in Agriculture); “Ion Ionescu de la Brad” Publishing House: Iaşi, Romania, 2006; p. 357. ISBN 9737967067. [Google Scholar]
- Lăcătușu, R.; Lungu, M.; Rizea, N. Global Chemestry; Terra Nostra Publishing House: Iași, Romania, 2017; p. 70. ISBN 978-606-623-0742. [Google Scholar]
- Filpov, F. Pedologie (Pedology); “Ion Ionescu de la Brad” Publishing House: Iaşi, Romania, 2005; p. 444. ISBN 973-7921-64-X.15. [Google Scholar]
- Lixandru, G.; Filipov, F. Organic Fertilizers. Environmental Quality Protection; “Ion Ionescu de la Brad”, Publishing House: Iaşi, Romania, 2012; p. 420. ISBN 978-973-147-093-1. [Google Scholar]


| Chemical Indicators | Sludge Used in Agriculture CMA, D. 86/278/EEC, mg/kg Dry Substance (CMA = Maximum Allowable Concentration) | Naturally Dried Sludge/ Value kg Dry Substance | Dried Sludge Euphore Installation/Value kg Dry Substance |
|---|---|---|---|
| Humidity | - | 38% | 6% |
| pH | - | 6.92 | 7.93 |
| Nitrogen | - | 2.4% | 3.5% |
| Phosphate | - | 9.4% | 24% |
| Potassium | - | 2.5% | 5.2% |
| Cadmium | 20–40 mg | 3.8 ppm | 3.6 ppm |
| Copper | 1000–1750 mg | 166.35 ppm | 165.57 ppm |
| Nickel | 300–400 mg | 5.6 ppm | 5.2 ppm |
| Lead | 750–1200 mg | 20.15 ppm | 19.58 ppm |
| Zinc | 2500–4000 mg | 1362 ppm | 1355 ppm |
| Chromium | 500 mg | 92.65 ppm | 91.75 ppm |
| Dosage of Applied Sludge (t/ha) | Control Soil Untreated with Sludge Production kg/ha | Soil Treated with Euphore Type Sludge Production kg/ha | Soil Treated with Dry Raw Sludge on Treatment Plant Platform Production kg/ha |
|---|---|---|---|
| 15 | T2 = 3265 | T6 = 2994 | |
| 25 | T3 = 3443 | T7 = 3072 | |
| 30 | T1 = 2880 | T4 = 3555 | T8 = 3146 |
| 35 | T5 = 3761 | T9 = 3226 |
| Rank, r | 1 | 2 | 3 | 4 | 5 | 6 | 7 | 8 | 9 | Mean |
|---|---|---|---|---|---|---|---|---|---|---|
| Variant | T5 | T4 | T3 | T2 | T9 | T8 | T7 | T6 | T1 | - |
| Average soybean production, Sr,(kg/ha) | 3761 | 3555 | 3443 | 3265 | 3226 | 3146 | 3072 | 2994 | 2880 | |
| Standard error, σr, (cm) | 23.84 | 27.03 | 28.51 | 29.43 | 31.14 | 24.79 | 25.44 | 26.05 | 26.71 |
| Degrees of Freedom for Observations, p | 2 | 3 | 4 | 5 | 6 | 7 | 8 | 9 |
|---|---|---|---|---|---|---|---|---|
| Standardized critical value, | 2.9 | 3.05 | 3.15 | 3.21 | 3.26 | 3.3 | 3.33 | 3.36 |
| Shortest critical range, | 63.18 | 66.38 | 68.45 | 69.91 | 71.01 | 71.87 | 72.54 | 73.1 |
| Difference between Pairs of Variants, k | 1 | 2 | 3 | 4 | 5 | 6 | 7 | 8 | 9 |
|---|---|---|---|---|---|---|---|---|---|
| Superior Rank of variants, i | 1 | 1 | 1 | 1 | 1 | 1 | 1 | 1 | 2 |
| Inferior Rank of variants, j | 9 | 8 | 7 | 6 | 5 | 4 | 3 | 2 | 9 |
| Index p for shortest significant range, Rp | 9 | 8 | 7 | 6 | 5 | 4 | 3 | 2 | 8 |
| Difference between pairs of variants, k | 10 | 11 | 12 | 13 | 14 | 15 | 16 | 17 | 18 |
| Superior Rank of variants, i | 2 | 2 | 2 | 2 | 2 | 2 | 3 | 3 | 3 |
| Inferior Rank of variants, j | 8 | 7 | 6 | 5 | 4 | 3 | 9 | 8 | 7 |
| Index p for shortest significant range, Rp | 7 | 6 | 5 | 4 | 3 | 2 | 7 | 6 | 5 |
| Difference between pairs of variants, k | 19 | 20 | 21 | 22 | 23 | 24 | 25 | 26 | 27 |
| Superior Rank of variants, i | 3 | 3 | 3 | 4 | 4 | 4 | 4 | 4 | 5 |
| Inferior Rank of variants, j | 6 | 5 | 4 | 9 | 8 | 7 | 6 | 5 | 9 |
| Index p for shortest significant range, Rp | 4 | 3 | 2 | 6 | 5 | 4 | 3 | 2 | 5 |
| Difference between pairs of variants, k | 28 | 29 | 30 | 31 | 32 | 33 | 34 | 35 | 36 |
| Superior Rank of variants, i | 5 | 5 | 5 | 6 | 6 | 6 | 7 | 7 | 8 |
| Inferior Rank of variants, j | 8 | 7 | 6 | 9 | 8 | 7 | 9 | 8 | 9 |
| Index p for shortest significant range, Rp | 4 | 3 | 2 | 4 | 3 | 2 | 3 | 2 | 2 |
| Difference between Pairs of Variants, k | 26 | 33 | 35 |
|---|---|---|---|
| Values for difference between pairs of variants, | 39.0 | 74.0 | 78.0 |
| Values for shortest critical range, | 78.379 | 78.379 | 78.379 |
| Value of the difference, | −39.379 | −4.379 | −0.379 |
| Variant for superior rank | T2 | T8 | T7 |
| Variant for inferior rank | T9 | T7 | T6 |
| Rank, r | 1 | 2 | 3 | 4 | 5 | 6 | 7 | 8 |
|---|---|---|---|---|---|---|---|---|
| Difference of production, | 881 | 675 | 563 | 385 | 346 | 266 | 192 | 114 |
| + | + | + | - | - | - | - | - | |
| + | - | - | - | - | - | - | - | |
| - | - | - | - | - | - | - | - | |
| Significance | T5:DS | T4: S | T3: S | T2:NS | T9:NS | T8:NS | T7:NS | T6:NS |
| Rank, r | 1 | 2 | 3 | 4 | 5 | 6 | 7 | 8 |
|---|---|---|---|---|---|---|---|---|
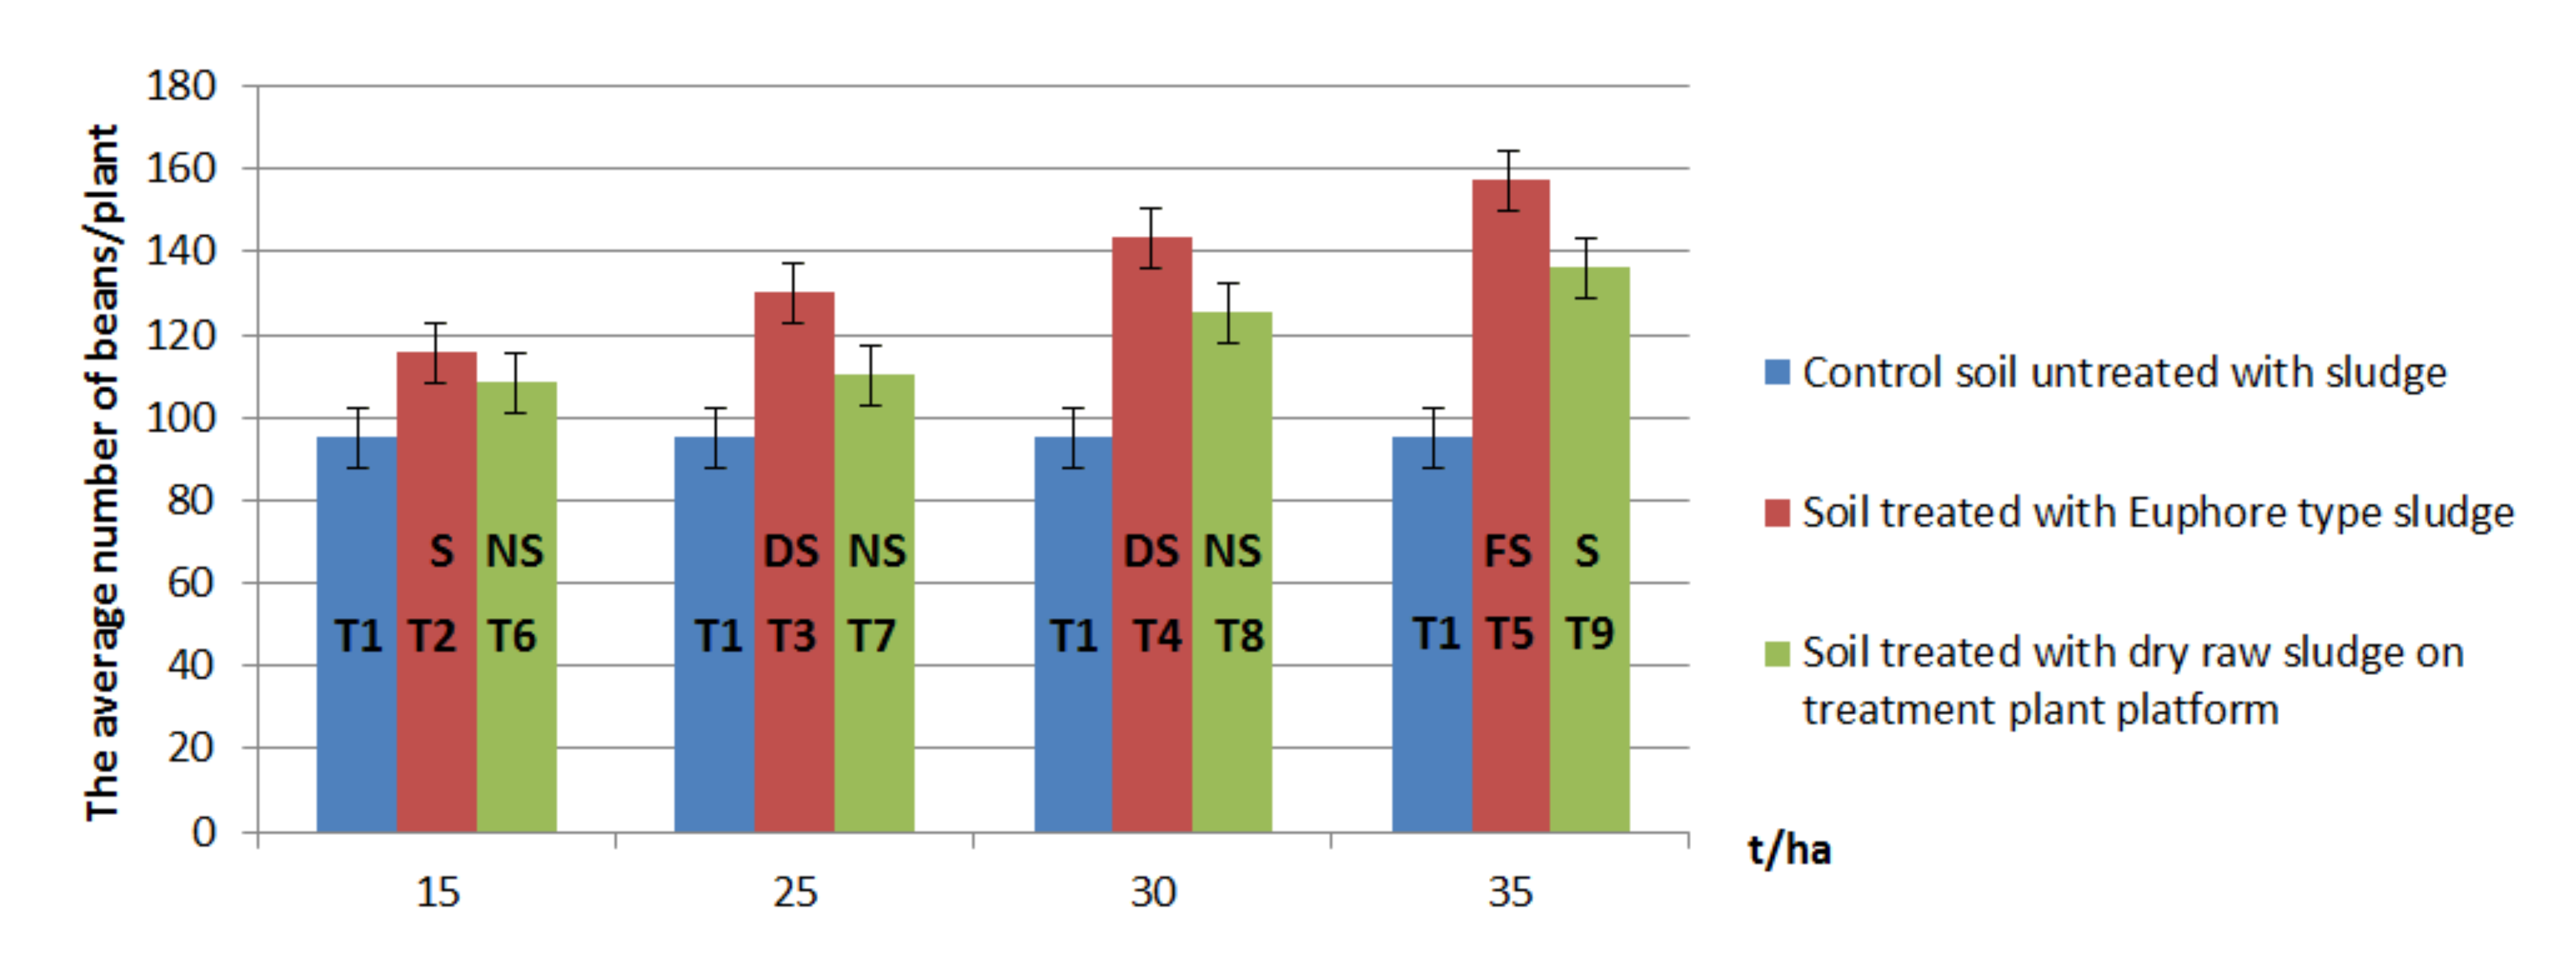
| Difference of number, | 28.8 | 20.6 | 16.7 | 16 | 13.2 | 12 | 10.6 | 8 |
| + | + | + | + | + | - | - | - | |
| + | + | + | - | - | - | - | - | |
| + | - | - | - | - | - | - | - | |
| Significance | T5: FS | T4:DS | T3:DS | T2: S | T9:S | T8:NS | T7:NS | T6:NS |
| Dosage of Applied Sludge (t/ha) | Control Soil Untreated with Sludge | Soil Treated with Euphore-Type Sludge | Soil Treated with Dry Raw Sludge from Treatment Plant Platform | |||
|---|---|---|---|---|---|---|
| Metal | Quantity mg/kg Dry Substance | Metal | Quantity mg/kg Dry Substance | Metal | Quantity mg/kg Dry Substance | |
| CMA Pb = 3–15 mg/kg dry substance, CMA Cd =1 mg/kg dry substance, CMA Ni = 30 mg/kg dry substance, CMA Cu = 15–20 mg/kg dry substance, CMA Zn = 150 mg/kg dry substance | ||||||
| Soybean Root | ||||||
| 15 t/ha | Pb | 11.89 | Pb | 12.3 | Pb | 12.8 |
| Cd | 0.11 | Cd | 0.12 | Cd | 0.13 | |
| Ni | 8.5 | Ni | 9.2 | Ni | 9.6 | |
| Cu | 6.25 | Cu | 6.84 | Cu | 7.13 | |
| Zn | 22.3 | Zn | 22.75 | Zn | 23.6 | |
| 25 t/ha | Pb | 12.45 | Pb | 13.77 | Pb | 14. 02 |
| Cd | 0.12 | Cd | 0.13 | Cd | 0.14 | |
| Ni | 9.7 | Ni | 10.4 | Ni | 10.78 | |
| Cu | 7.11 | Cu | 7.65 | Cu | 7.98 | |
| Zn | 23.15 | Zn | 25.75 | Zn | 26.06 | |
| 30 t/ha | Pb | 13.6 | Pb | 14.1 | Pb | 14.59 |
| Cd | 0.16 | Cd | 0.17 | Cd | 0.21 | |
| Ni | 10.78 | Ni | 11.89 | Ni | 12.16 | |
| Cu | 7.86 | Cu | 8.27 | Cu | 8.98 | |
| Zn | 25.7 | Zn | 26.29 | Zn | 27.02 | |
| 35 t/ha | Pb | 14.4 | Pb | 14.7 | Pb | 15.45 |
| Cd | 0.17 | Cd | 0.18 | Cd | 0.19 | |
| Ni | 12.4 | Ni | 12.66 | Ni | 12.74 | |
| Cu | 8.4 | Cu | 8.67 | Cu | 8.8 | |
| Zn | 26.8 | Zn | 28.7 | Zn | 29.4 | |
| Soybean Stem | ||||||
| 15 t/ha | Pb | 10.65 | Pb | 10.87 | Pb | 11.23 |
| Cd | 0.9 | Cd | 0.10 | Cd | 0.11 | |
| Ni | 4.3 | Ni | 4.76 | Ni | 5.12 | |
| Cu | 5.35 | Cu | 5.64 | Cu | 6.15 | |
| Zn | 20.1 | Zn | 20.64 | Zn | 21.2 | |
| 25 t/ha | Pb | 11.8 | Pb | 11.95 | Pb | 12.12 |
| Cd | 0.10 | Cd | 0.11 | Cd | 0.12 | |
| Ni | 5.6 | Ni | 6.16 | Ni | 6.54 | |
| Cu | 5.85 | Cu | 6.41 | Cu | 6.85 | |
| Zn | 21.2 | Zn | 22.34 | Zn | 23.12 | |
| 30 t/ha | Pb | 12.9 | Pb | 13.26 | Pb | 13.68 |
| Cd | 0.12 | Cd | 0.13 | Cd | 0.14 | |
| Ni | 6.73 | Ni | 7.25 | Ni | 7.56 | |
| Cu | 6.37 | Cu | 6.89 | Cu | 7.12 | |
| Zn | 21.85 | Zn | 22.58 | Zn | 22.97 | |
| 35 t/ha | Pb | 13.6 | Pb | 13.79 | Pb | 13.98 |
| Cd | 0.15 | Cd | 0.16 | Cd | 0.17 | |
| Ni | 7.66 | Ni | 7.92 | Ni | 8.15 | |
| Cu | 6.75 | Cu | 7.32 | Cu | 7.64 | |
| Zn | 22.32 | Zn | 23.13 | Zn | 23.45 | |
| Soybean Beans | ||||||
| 15 t/ha | Pb | 9.3 | Pb | 9.7 | Pb | 9.9 |
| Cd | 0.09 | Cd | 0.10 | Cd | 0.11 | |
| Ni | 3.8 | Ni | 4.35 | Ni | 4.6 | |
| Cu | 5.6 | Cu | 6.5 | Cu | 6.73 | |
| Zn | 21.1 | Zn | 21.72 | Zn | 22.15 | |
| 25 t/ha | Pb | 9.7 | Pb | 10.11 | Pb | 10.42 |
| Cd | 0.10 | Cd | 0.112 | Cd | 0.23 | |
| Ni | 4.68 | Ni | 5.16 | Ni | 5.46 | |
| Cu | 6.3 | Cu | 7.02 | Cu | 7.41 | |
| Zn | 22.15 | Zn | 22.9 | Zn | 23.11 | |
| 30 t/ha | Pb | 10.1 | Pb | 10.71 | Pb | 11.08 |
| Cd | 0.11 | Cd | 0.12 | Cd | 0.13 | |
| Ni | 5.20 | Ni | 5.78 | Ni | 6.16 | |
| Cu | 6.8 | Cu | 7.55 | Cu | 7.85 | |
| Zn | 23.12 | Zn | 23.61 | Zn | 23.92 | |
| 35 t/ha | Pb | 10.6 | Pb | 11.12 | Pb | 11.34 |
| Cd | 0.13 | Cd | 0.14 | Cd | 0.15 | |
| Ni | 5.82 | Ni | 6.33 | Ni | 6.71 | |
| Cu | 7.25 | Cu | 7.66 | Cu | 8.08 | |
| Zn | 24.2 | Zn | 24.52 | Zn | 24.96 | |
| Dosage of Applied Sludge (t/ha) | Control Soil Untreated with Sludge | Soil Treated with Euphore-Type Sludge | Soil Treated with Dry Raw Sludge from Treatment Plant Platform | |||
|---|---|---|---|---|---|---|
| Production kg /ha | Oil Content of Rapeseed % | Production kg/ha | Oil Content of Rapeseed % | Production kg /ha | Oil Content of Rapeseed % | |
| 5 | T1 = 2356 | T1 = 37.5 | T2 = 4250 | T2 = 46.1 | T6 = 4046 | T6 = 41.4 |
| 10 | T3 = 4920 | T3 = 46.5 | T7 = 4223 | T7 = 42.2 | ||
| 20 | T4 = 5050 | T4 = 47.2 | T8 = 4450 | T8 = 43.1 | ||
| 30 | T2 = 5200 | T5 = 48 | T9 = 4600 | T9 = 44 | ||
| Rank, r | 1 | 2 | 3 | 4 | 5 | 6 | 7 | 8 | 9 | Mean |
|---|---|---|---|---|---|---|---|---|---|---|
| Variant | T5 | T4 | T3 | T9 | T2 | T8 | T7 | T6 | T1 | - |
| Average oil production, Or, (kg/ha) | 2496 | 2383.6 | 2287.8 | 2024 | 1959.25 | 1917.95 | 1782.11 | 1675.04 | 883.5 | 1934.36 |
| Standard error, σr, (%) | 9.94 | 22.04 | 25.74 | 26.82 | 28.08 | 18.84 | 20.05 | 21.58 | 22.77 | 21.76 |
| Difference between Pairs of Variants, k | 30 |
|---|---|
| Values for difference between pairs of variants, ,(Kg/ha) | 41.30 |
| Values for shortest critical range, (Kg/ha) | 63.18 |
| Values for difference , (Kg/ha) | −21.88 |
| Variant for superior rank, i (i = 5) | T9 |
| Variant for inferior rank, j (j = 6) | T8 |
| Rank, r | 1 | 2 | 3 | 4 | 5 | 6 | 7 | 8 |
|---|---|---|---|---|---|---|---|---|
| Difference of production, | 1612.5 | 1500 | 1404.3 | 1140.5 | 1075.75 | 1034.45 | 898.61 | 791.54 |
| + | + | + | + | + | + | + | + | |
| + | + | + | + | + | + | + | - | |
| + | + | + | + | - | - | - | - | |
| Significance | T5:FS | T4:FS | T3:FS | T9:FS | T2:DS | T8:DS | T7:DS | T6:S |
| Chemical Indicators that were Determined | Unit of Measurement | Values of the Indices | ||
|---|---|---|---|---|
| Dose of Sludge Applied: 20 t/ha | ||||
| Control Soil, Untreated with Sludge, V1 | Soil Treated with Euphore-Type Sludge, V2 | Soil Treated with Dry Raw Sludge from Treatment Plant Platform, V3 | ||
| pH | 7.34 | 7.52 | 7.85 | |
| Total nitrogen | mg/100 g | 0.16 | 0.23 | 0.21 |
| P2 O5 | mg/100 g | 2.2 | 9.5 | 4.2 |
| K2 O | mg/100 g | 14.9 | 24.5 | 18.6 |
| Pb | mg/kg | 8.9 | 10.1 | 13.7 |
| Cd | mg/kg | 0.60 | 0.61 | 0.65 |
| Cr | mg/kg | 65.9 | 68.6 | 70.4 |
| Ni | mg/kg | 4.1 | 4.3 | 4.8 |
| Cu | mg/kg | 16.1 | 16.6 | 17.3 |
| Zn | mg/kg | 12.3 | 14.42 | 15.2 |
Publisher’s Note: MDPI stays neutral with regard to jurisdictional claims in published maps and institutional affiliations. |
© 2021 by the authors. Licensee MDPI, Basel, Switzerland. This article is an open access article distributed under the terms and conditions of the Creative Commons Attribution (CC BY) license (http://creativecommons.org/licenses/by/4.0/).
Share and Cite
Chiorescu, E.; Filipov, F. Examining the Influence of Sludge from Municipal Wastewater Treatment Plants Processed by Euphore Installations on the Quantity and Quality of Rapeseed and Soybean Production. Agriculture 2021, 11, 278. https://0-doi-org.brum.beds.ac.uk/10.3390/agriculture11040278
Chiorescu E, Filipov F. Examining the Influence of Sludge from Municipal Wastewater Treatment Plants Processed by Euphore Installations on the Quantity and Quality of Rapeseed and Soybean Production. Agriculture. 2021; 11(4):278. https://0-doi-org.brum.beds.ac.uk/10.3390/agriculture11040278
Chicago/Turabian StyleChiorescu, Esmeralda, and Feodor Filipov. 2021. "Examining the Influence of Sludge from Municipal Wastewater Treatment Plants Processed by Euphore Installations on the Quantity and Quality of Rapeseed and Soybean Production" Agriculture 11, no. 4: 278. https://0-doi-org.brum.beds.ac.uk/10.3390/agriculture11040278