
Morphological and Molecular Characterization of Quinoa Genotypes

 , , ,
, , ,
Abstract
:1. Introduction
2. Materials and Methods
2.1. Plant Materials
2.2. Field Experiment
2.3. Molecular Characterization-Based SRAP Markers
2.4. Data Analysis
3. Results and Discussion
4. Conclusions
Supplementary Materials
Author Contributions
Funding
Institutional Review Board Statement
Informed Consent Statement
Data Availability Statement
Acknowledgments
Conflicts of Interest
References
- Bazile, D.; Jacobsen, S.E.; Verniau, A. The global expansion of quinoa: Trends and limits. Front. Plant Sci. 2016, 7, 622–629. [Google Scholar] [CrossRef] [Green Version]
- Gomez-Pando, L.R.; Aguilar-Castellanos, E.; Ibañez-Tremolada, M. Quinoa (Chenopodium quinoa Willd.) breeding. In Advances in Plant Breeding Strategies: Cereals; Al-Khayri, J., Jain, S., Johnson, D., Eds.; Springer: Cham, Switzerland, 2019; pp. 259–316. [Google Scholar]
- Tapia, M.E. The long journey of Quinoa: Who wrote its history? In State of the Art Report of Quinoa in the World in 2013; Bazile, D., Bertero, D., Nieto, C., Eds.; FAO: Rome, Italy; CIRAD: Montpellier, France, 2015; pp. 3–9. [Google Scholar]
- Fuentes, F.; Bhargava, A. Morphological analysis of quinoa germplasm grown under lowland desert conditions. J. Agron. Crop Sci. 2011, 197, 124–134. [Google Scholar] [CrossRef]
- Aguilar, P.C.; Jacobsen, S.E. Cultivation of quinoa on the Peruvian Altiplano. Food Rev. Int. 2003, 19, 31–41. [Google Scholar] [CrossRef]
- Schmockel, S.M.; Lightfoot, D.J.; Razali, R.; Tester, M.; Jarvis, D.E. Identification of putative involved in tolerance in Chenopodium quinoa by integrating physiological data, RNA seq, and SNP Analyses. Front. Plant Sci. 2017, 8, 1023. [Google Scholar] [CrossRef] [Green Version]
- Bhargava, A.; Shukla, S.; Ohri, D. Genetic variability and heritability of selected traits during different cuttings of vegetable Chenopodium. Ind. J. Genet. Plant Breed. 2003, 63, 359–360. [Google Scholar]
- Fuentes, F.F.; Martinez, E.A.; Hinrichsen, P.V.; Jellen, E.N.; Maughan, P.J. Assessment of genetic diversity patterns in Chilean quinoa (Chenopodium quinoa Willd.) germplasm using multiplex fluorescent microsatellite markers. Conserv. Genet. 2009, 10, 369–377. [Google Scholar] [CrossRef]
- Zhang, T.; Gu, M.; Liu, Y.; Lv, Y.; Zhou, L.; Lu, H.; Liang, S.; Bao, H.; Zhao, H. Development of novel InDel markers and genetic diversity in Chenopodium quinoa through whole–genome re-sequencing. BMC Genom. 2017, 18, 685. [Google Scholar] [CrossRef]
- Salazar, J.; Torres, M.D.; Gutierrez, B.; Torres, A.F. Molecular characterization of Ecuadorian quinoa (Chenopodium quinoa Willd.) diversity conservation and.breeding. Euphytica 2019, 215, 60–71. [Google Scholar] [CrossRef] [Green Version]
- Mason, S.; Stevens, M.R.; Jellen, E.N.; Bonifacio, A.; Fairbanks, D.J.; Coleman, C.E.; McCarty, R.R.; Rasmussen, A.G.; Maughan, P.J. Development and use of microsatellite markers for germplasm characterization in quinoa (Chenopodium quinoa. Willd.). Crop. Sci. 2005, 45, 1618–1630. [Google Scholar] [CrossRef]
- Christensen, S.; Pratt, D.B.; Pratt, C.; Nelson, P.T.; Stevens, M.R.; Jellen, E.N.; Coleman, C.E.; Fairbanks, D.J.; Bonifacio, A.; Maughan, P.J. Assessment of genetic diversity in The USDA and CIP–FAO international nursery collections of quinoa (Chenopodium quinoa Willd.) using microsatellite markers. Plant Genet. Resour. 2007, 5, 82–95. [Google Scholar] [CrossRef] [Green Version]
- Li, G.; Quiros, C.F. Sequence-Related amplified polymorphism (SRAP), a new marker system based on a simple PCR reaction: Its application to mapping and gene tagging in Brassica. Theor. Appl. Genet. 2001, 103, 455–461. [Google Scholar] [CrossRef]
- Robarts, D.W.; Wolfe, A.D. Sequence-Related amplified polymorphism (SRAP) markers: A potential resource for studies in plant molecular biology. Appl. Plant Sci. 2014, 2, 1400017. [Google Scholar] [CrossRef]
- Bioversity International. Available online: https://www.bioversityinternational.org (20 December 2020).
- Cota-Sanchez, H.; Remarchuk, K.; Ubayasenaj, K. Ready-to-use DNA extracted with a CTAB method adapted for herbarium specimens and mucilaginous plant tissue. Plant Mol. Biol. Rep. 2006, 24, 161–167. [Google Scholar] [CrossRef]
- Ammar, M.H.; Migdadi, H.M.; Khan, M.A.; El-Harty, E.H.; Al-Faifi, S.A.; Alghamdi, S.S. Assessment of genetic diversity among faba bean genotypes using agromorphological and molecular markers. Saudi J. Biol. Sci. 2015, 22, 340–350. [Google Scholar] [CrossRef] [PubMed]
- XLSTAT. Available online: http://www.xlstat.com (15 August 2020).
- Botstein, D.; White, R.L.; Skolnick, M.; Davis, R.W. Construction of a genetic linkage map in man using restriction fragment length polymorphisms. Am. J. Hum. Genet. 1980, 32, 314–331. [Google Scholar]
- Anderson, J.A.; Churchill, G.A.; Autrique, J.E.; Tanksley, S.D.; Sorrells, M.E. Optimizing parental selection for genetic linkage maps. Genome 1993, 36, 181–186. [Google Scholar] [CrossRef] [PubMed]
- Jaccard, P. Nouvelles recherches sur la distribution florale. Bull. Soc. Vaud. Sci. Nat. 1908, 44, 223–270. [Google Scholar]
- Mantel, N. The detection of disease clustering and a generalized regression approach. Cancer Res. 1967, 27, 209–220. [Google Scholar]
- Pritchard, J.K.; Stephens, M.; Donnelly, P. Inference of population structure using multilocus genotype data. Genetics 2000, 155, 945–959. [Google Scholar]
- Evanno, G.; Regnaut, S.; Goudet, J. Detecting the number of clusters of individuals using the software STRUCTURE: A simulation study. Mol. Ecol. 2005, 14, 2611–2620. [Google Scholar] [CrossRef] [Green Version]
- Peakall, R.; Smouse, P.E. GenAIEx 6.5: Genetic analysis in Excel. Population genetic software for teaching and research an update. Bioinformatics 2012, 28, 19. [Google Scholar] [CrossRef] [Green Version]
- Bhargava, A.; Ohri, D. Origin of genetic variability and improvement of quinoa (Chenopodium quinoa Willd.). In Gene Pool Diversity and Crop Improvement; Rajpal, V.R., Rao, S., Eds.; Springer: Cham, Switzerland, 2016. [Google Scholar]
- Tan, M.; Temel, S. Performance of some quinoa (Chenopodium quinoa Willd.) genotypes grown in different climate conditions. Turk. J. Field Crop. 2018, 23, 180–186. [Google Scholar] [CrossRef] [Green Version]
- Bhargava, A.; Shukla, S.; Rajan, S.; Ohri, D. Genetic Diversity for Morphological and Quality Traits in Quinoa (Chenopodium quinoa Willd.) Germplasm. Genet. Resour. Crop Evol. 2007, 54, 167–173. [Google Scholar] [CrossRef]
- Jacobsen, S.E. The worldwide potential for quinoa (Chenopodium quinoa Willd.). Food Rev. Int. 2003, 19, 167–177. [Google Scholar] [CrossRef]
- Benlhabib, O.; Boujartani, N.; Maughan, P.J.; Jacobsen, S.E.; Jellen, E.N. Elevated genetic diversity in an F2:6 population of quinoa (Chenopodium quinoa) developed through an inter-ecotype cross. Front. Plant Sci. 2016, 7, 1222. [Google Scholar] [CrossRef] [PubMed] [Green Version]
- Aneja, B.; Yadav, N.R.; Yadav, R.C.; Kumar, R. Sequence related amplified polymorphism (SRAP) analysis for genetic diversity and micronutrient content among gene pools in mung bean (Vigna radiata (L.) Wilczek). Physiol. Mol. Biol. Plants 2013, 19, 399–407. [Google Scholar] [CrossRef] [Green Version]
- EL-Harty, E.H.; Ashrie, A.; Ammar, M.; Alghamdi, S. Genetic Variation among egyptian white lupin (Lupinus albus L.) genotypes. Turk. J. Field Crop. 2016, 21, 147–154. [Google Scholar] [CrossRef] [Green Version]
- Castillo, C.; Winkel, T.; Mahy, G.; Bizoux, J.-P. Genetic structure of quinoa (Chenopodium quinoa Willd) from the Bolivian altiplano as revealed by RAPD markers. Genet. Resour. Crop Evol. 2007, 54, 897–905. [Google Scholar] [CrossRef]
- Hossein-pour, A.; Haliloglu, K.; Ozkan, G.; Tan, M. Genetic diversity and population structure of quinoa (Chenopodium quinoa Willd.) Using IPBS–retrotransposons markers. App. Ecol. Environ. Res. 2019, 17, 1899–1911. [Google Scholar] [CrossRef]
- Ruas, P.M.; Bonifacio, A.; Ruas, C.F.; Fairbanks, D.J.; Anderson, W.R. Genetic relationships among 19 accessions of six species of Chenopodium L. by random amplified polymorphic DNA fragments (RAPD). Euphytica 1999, 105, 25–32. [Google Scholar] [CrossRef]
- Rodríguez, L.A.; Isla, M.T. Comparative analysis of genetic and morphologic diversity among quinoa accessions (Chenopodium quinoa Willd.) of the South of Chile and highland accessions. J. Plant Breed. Crop Sci. 2009, 1, 210–216. [Google Scholar]
- Soleimani, M.; Talebi, M.; Sayed-Tabatabaei, B. Use of SRAP markers to assess genetic diversity and population structure of wild, cultivated, and ornamental pomegranates (Punica granatum L.) in different regions of Iran. Plant Syst. Evol. 2012, 298, 1141–1149. [Google Scholar] [CrossRef]


| No. | Accessions | ID.Number | Origin | Status |
|---|---|---|---|---|
| 1 | Giza1 | --- | Egypt | Cultivar |
| 2 | LP-128 | PI 587173 | Argentina | Cultivar |
| 3 | Q-Silvestre | PI 510547 | Argentina | Cultivar |
| 4 | Bianra-de-Juny | PI 665272 | Australia | IG |
| 5 | Apelawa | Ames 13747 | Bolivia | IG |
| 6 | CQ-125 | PI 614925 | Bolivia | IG |
| 7 | Pasan-Ralle | PI 470932 | Bolivia | IG |
| 8 | Sayana | PI 614922 | Bolivia | Cultivar |
| 9 | Line-0692 | PI 665275 | Bolivia | IG |
| 10 | Q-Sajama-Jusi | PI 510545 | Chile | Cultivar |
| 11 | Pichaman | PI 634919 | Chile | Landrace |
| 12 | QQ-87 | PI 614884 | Chile | Landrace |
| 13 | UDEC-3 | PI 634925 | Chile | Landrace |
| 14 | DE-1 | PI 674266 | Ecuador | Cultivar |
| 15 | Grande | PI 510540 | Peru | Cultivar |
| 16 | Q-de-Quiaca | PI 510532 | Peru | IG |
| 17 | QQ-065 | PI 614880 | Peru | Cultivar |
| 18 | QQ-61 | PI 614888 | Peru | Landrace |
| 19 | Quinua | PI 510551 | Peru | Cultivar |
| 20 | Q-Amarillo | PI 510543 | Peru | Cultivar |
| 21 | Q-Blanca | PI 510548 | Peru | Cultivar |
| 22 | Col-#6197 | PI 665283 | USA, Colorado | IG |
| 23 | Colorado-407D | PI 596293 | USA, Colorado | Cultivar |
| 24 | 537-BK60-B | PI 677096 | USA, Maryland | Cultivar |
| 25 | 3P | Ames 13741 | USA, New Mexico | IG |
| 26 | Copacabana | Ames 13748 | USA, New Mexico | IG |
| 27 | Kaslaea | Ames 13745 | USA, New Mexico | IG |
| 28 | 37TES | Ames 13723 | USA, New Mexico | IG |
| 29 | 79R | Ames 13720 | USA, New Mexico | IG |
| 30 | NSSL-91567 | PI 677099 | USA, New York | Cultivar |
| 31 | NSSL-86649 | PI 677097 | USA, South | Cultivar |
| 32 | Japanese-strain | PI 677100 | USA, Washington | Cultivar |
| Trait | Category | Frequency | Trait | Category | Frequency | ||
|---|---|---|---|---|---|---|---|
| Absolute | Relative (%) | Absolute | Relative (%) | ||||
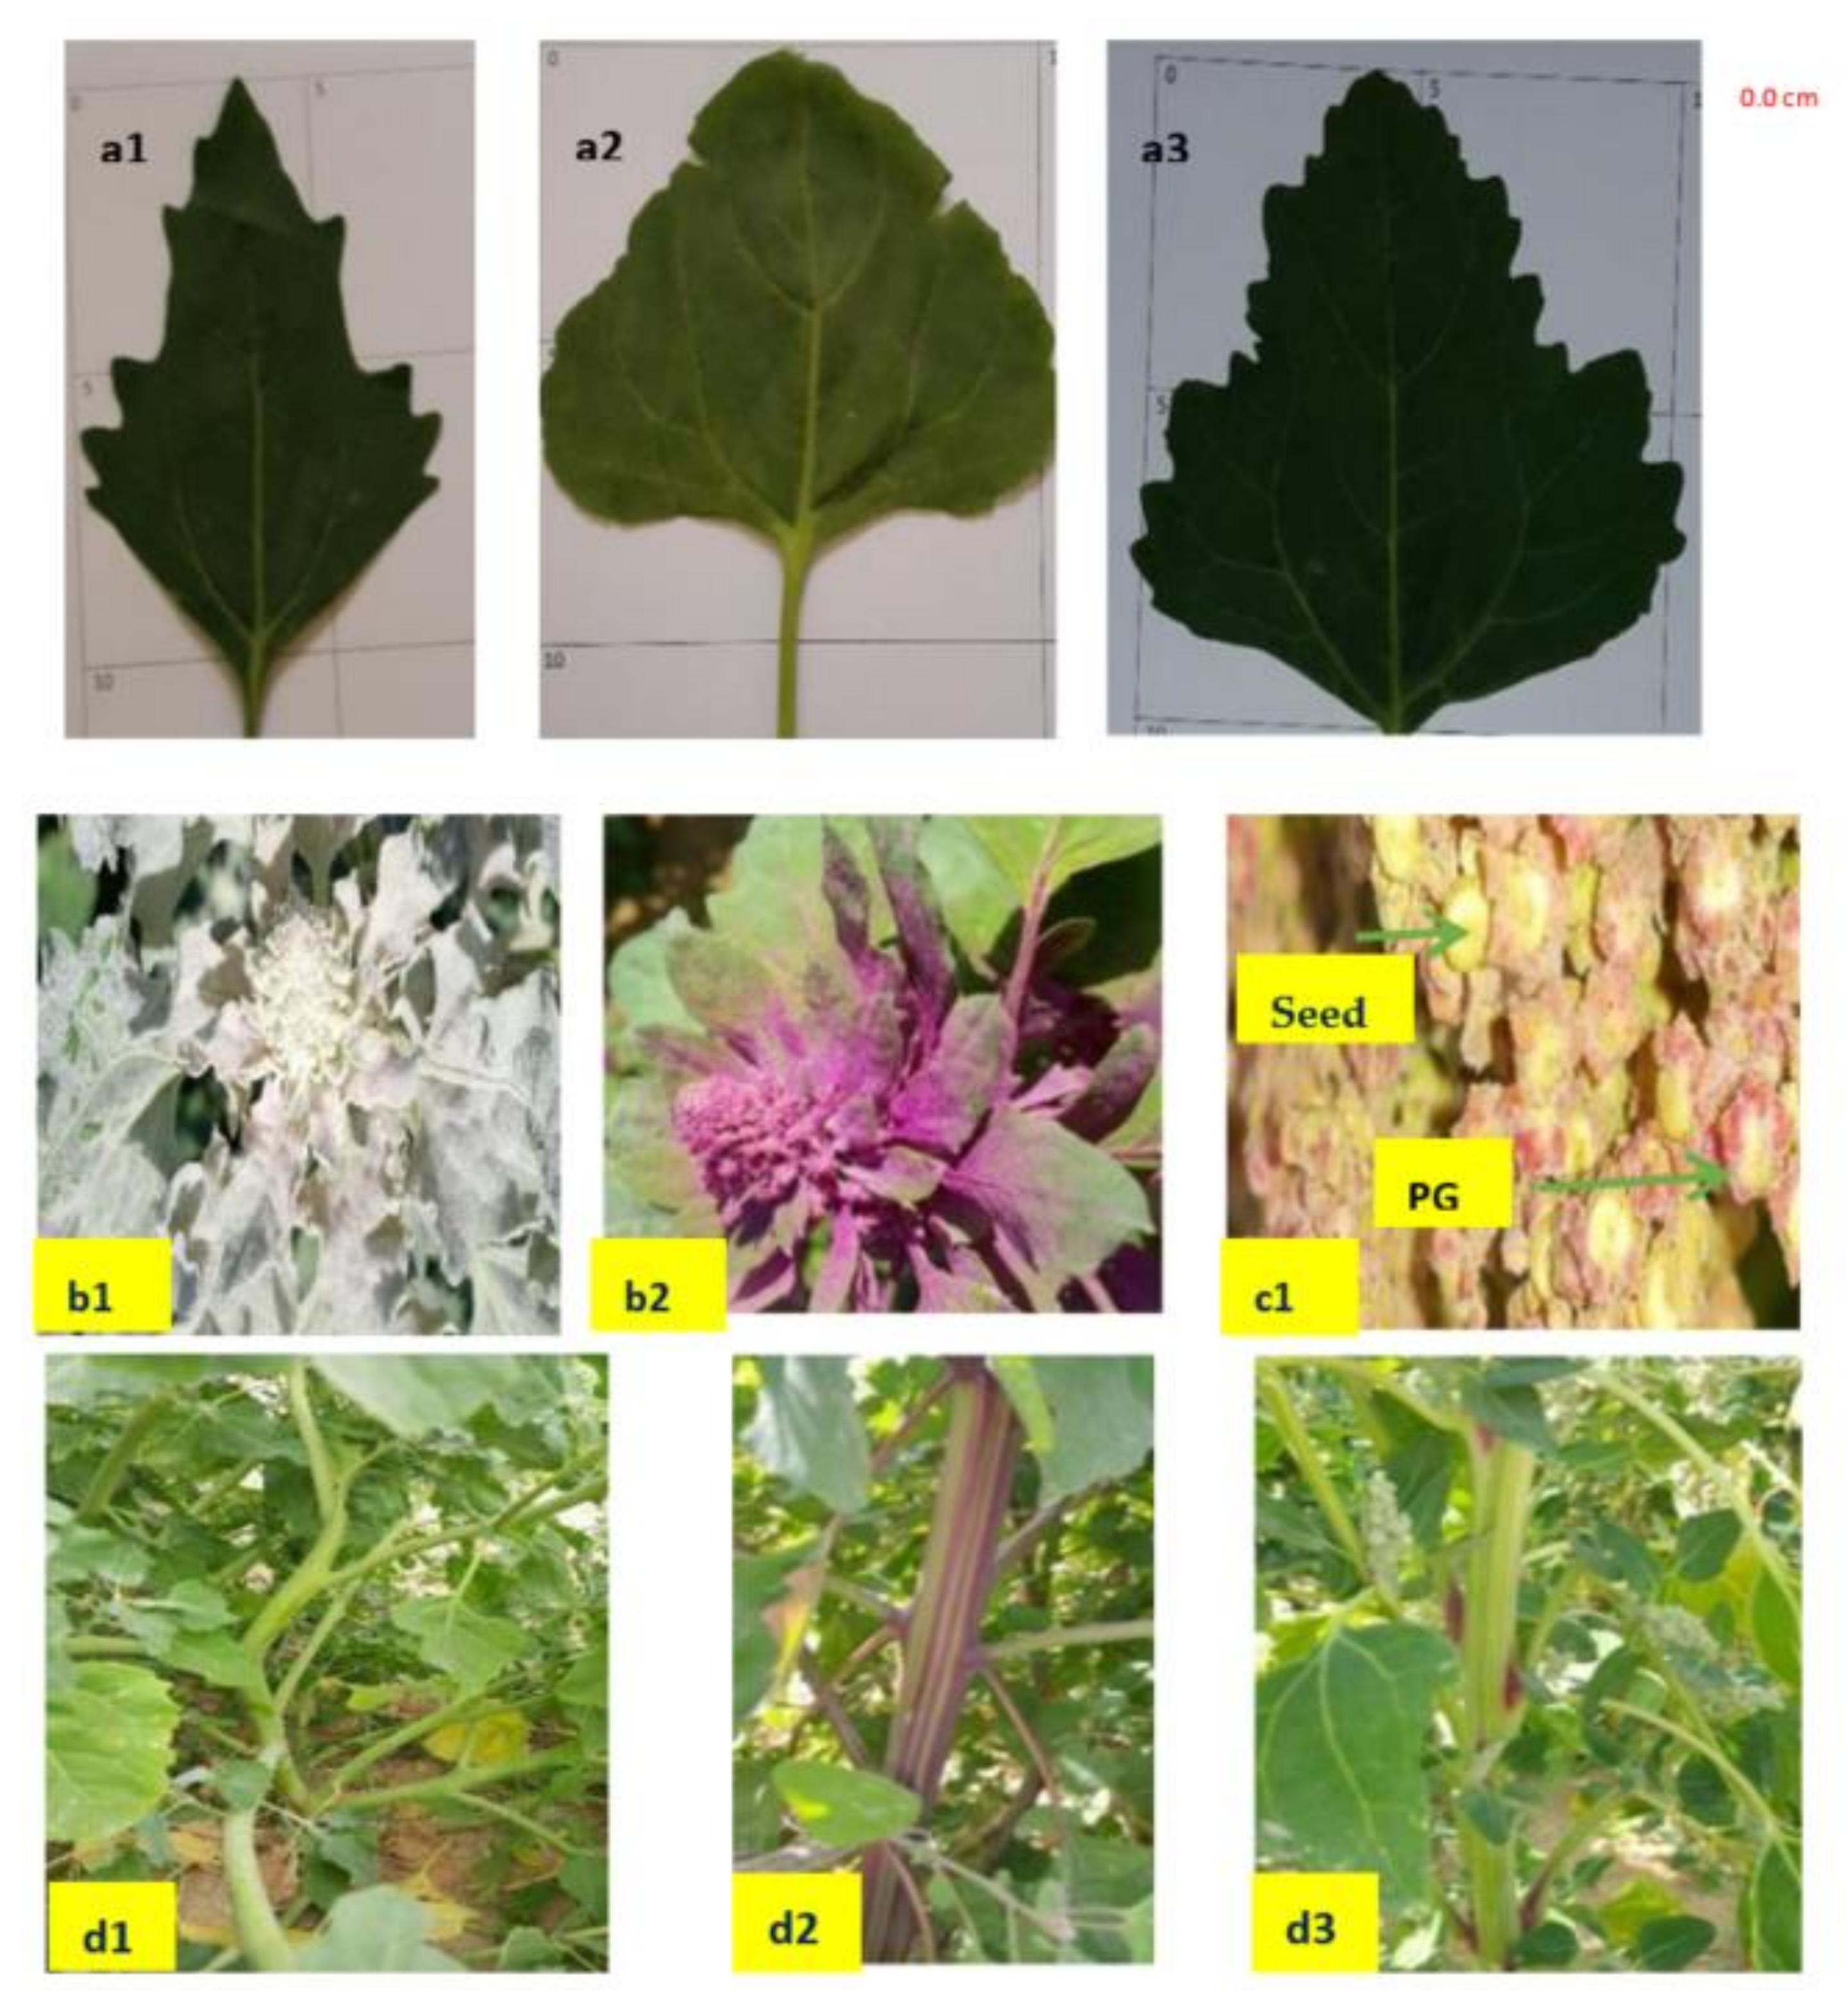
| GH | Branched to 2/3 the main stem | 22 | 69 | PBr | Oblique | 18 | 56 |
| Branched to the main panicle | 10 | 31 | Slightly curved | 14 | 44 | ||
| SC | Green | 10 | 31 | PCM | Orange | 15 | 47 |
| Yellow | 8 | 25 | Yellow | 9 | 28 | ||
| Red | 8 | 25 | Red | 4 | 12.5 | ||
| Other colors | 6 | 19 | Other colors | 4 | 12.5 | ||
| StC | Green | 21 | 66 | PS | Glomerulate | 5 | 16 |
| Red | 3 | 9 | Intermediate | 12 | 38 | ||
| Purple | 8 | 25 | Amarantiform | 15 | 47 | ||
| LC | Green | 23 | 72 | PD | Lax | 16 | 50 |
| Green-red | 8 | 25 | Intermediate | 14 | 44 | ||
| Red | 1 | 3 | Compact | 2 | 6 | ||
| LM | Entire | 1 | 3 | DD | Light | 7 | 22 |
| Dentate | 13 | 41 | Regular | 19 | 59 | ||
| Serrate | 18 | 56 | Strong | 6 | 19 | ||
| SS | Cylindrical | 11 | 34 | PG | Semi-opened | 18 | 56 |
| Angular | 21 | 66 | Closed | 14 | 44 | ||
| LS | Rhomboidal | 13 | 41 | Pa | Absent | 19 | 59 |
| Triangular | 19 | 59 | Present | 13 | 41 | ||
| PCF | Green | 24 | 75 | LGC | Absent | 5 | 16 |
| Purple | 2 | 6 | White | 20 | 63 | ||
| Red | 4 | 13 | White-red | 2 | 6 | ||
| Mixture | 2 | 6 | Purple | 3 | 16 | ||
| PC | Cream | 11 | 34 | ||||
| Yellow | 3 | 9 | |||||
| Red | 6 | 19 | |||||
| Orange | 4 | 13 | |||||
| Other five colors | 8 | 25 | |||||
| Trait | Mean ± S.E. | Category | Frequency | |
|---|---|---|---|---|
| Absolute | Relative (%) | |||
| PH (cm) | 107.4 ± 27.2 | 60–80 | 4 | 13 |
| 80–135 | 25 | 78 | ||
| 136–180 | 3 | 9 | ||
| NoB | 15.6 ± 4.4 | 8–11 | 5 | 16 |
| 12–16 | 11 | 34 | ||
| 17–23 | 16 | 50 | ||
| SD (mm) | 11.7 ± 4.3 | 8–12 | 8 | 25 |
| 13–20 | 21 | 66 | ||
| 21–27 | 3 | 9 | ||
| PeL (cm) | 7.2 ± 1.2 | 5–6 | 9 | 28 |
| 7–9 | 13 | 41 | ||
| 9–11 | 4 | 13 | ||
| LL (cm) | 8.9 ± 1.4 | 6–7 | 5 | 16 |
| 8–10 | 23 | 72 | ||
| 11–12 | 4 | 13 | ||
| LW (cm) | 7.8 ± 1.4 | 5–6 | 7 | 22 |
| 7–9 | 20 | 63 | ||
| 10–11 | 5 | 16 | ||
| LA (cm) | 40.4 ± 11.5 | 21–28 | 7 | 22 |
| 28–52 | 20 | 63 | ||
| 53–66 | 5 | 16 | ||
| NoT | 13.1 ± 3.8 | 6–9 | 7 | 22 |
| 10–16 | 19 | 59 | ||
| 17–21 | 6 | 19 | ||
| PL (cm) | 22.7 ± 4.4 | 17–19 | 5 | 16 |
| 20–26 | 23 | 72 | ||
| 27–32 | 4 | 13 | ||
| PW (cm) | 8.7 ± 2.3 | 5–6 | 4 | 13 |
| 7–12 | 26 | 81 | ||
| 13–15 | 2 | 6 | ||
| MD | 129.2 ± 21.7 | 98–107 | 6 | 19 |
| 108–151 | 19 | 59 | ||
| 152–177 | 7 | 22 |
| Primer Combination | Amplicons a | Total no. of Amplicon b | Average No. of Amplicon c | PIC Value | DP | |
|---|---|---|---|---|---|---|
| Forward | Reverse | |||||
| ME19 | EM19 | 6 | 37 | 1.16 | 0.68 | 5.71 |
| ME21 | EM08 | 3 | 44 | 1.38 | 0.54 | 2.86 |
| ME21 | EM21 | 4 | 61 | 1.91 | 0.60 | 3.81 |
| ME29 | EM07 | 2 | 57 | 1.78 | 0.50 | 1.90 |
| ME29 | EM08 | 2 | 60 | 1.88 | 0.50 | 1.90 |
| ME29 | EM19 | 3 | 50 | 1.56 | 0.56 | 2.86 |
| ME30 | EM31 | 3 | 56 | 1.75 | 0.61 | 2.86 |
| ME05 | EM20 | 4 | 51 | 1.59 | 0.63 | 3.81 |
| ME05 | EM28 | 3 | 33 | 1.03 | 0.62 | 2.86 |
| ME05 | EM29 | 3 | 41 | 1.28 | 0.43 | 2.86 |
| ME05 | EM31 | 3 | 49 | 1.53 | 0.56 | 2.86 |
| ME09 | EM19 | 3 | 74 | 2.31 | 0.65 | 2.86 |
| ME15 | EM31 | 3 | 41 | 1.28 | 0.61 | 2.86 |
| ME20 | EM22 | 6 | 45 | 1.41 | 0.66 | 5.71 |
| ME20 | EM08 | 3 | 38 | 1.19 | 0.34 | 2.86 |
| ME27 | EM19 | 4 | 66 | 2.06 | 0.62 | 3.81 |
| ME27 | EM29 | 3 | 48 | 1.50 | 0.60 | 2.86 |
| ME27 | EM31 | 3 | 40 | 1.25 | 0.56 | 2.86 |
| ME26 | EM20 | 4 | 74 | 2.31 | 0.73 | 3.81 |
| ME27 | EM28 | 6 | 63 | 1.97 | 0.66 | 5.71 |
| ME28 | EM29 | 4 | 77 | 2.41 | 0.72 | 3.81 |
| Total | 75 | 1105 | ----- | --- | ---- | |
| Mean | 3.57 | 52.62 | 1.64 | 0.59 | 3.40 | |
| Min | 2.00 | 33.00 | 1.03 | 0.34 | 1.90 | |
| Max | 6.00 | 77.00 | 2.41 | 0.73 | 5.71 | |
| No. | Accessions | Inferred Clusters | Origin | Population ID |
|---|---|---|---|---|
| 1 | Giza1 | admixture | Egypt | 1 |
| 2 | LP-128 | 2 | Argentina | 2 |
| 3 | Q-Silvestre | 2 | Argentina | 2 |
| 4 | Bianra-de-Juny | 1 | Australia | 3 |
| 5 | Apelawa | 1 | Bolivia | 4 |
| 6 | CQ-125 | 1 | Bolivia | 4 |
| 7 | Pasan-Ralle | 1 | Bolivia | 4 |
| 8 | Sayana | 1 | Bolivia | 4 |
| 9 | Line-0692 | 2 | Bolivia | 4 |
| 10 | Q-Sajama-Jusi | 2 | Chile | 5 |
| 11 | Pichaman | admixture | Chile | 5 |
| 12 | QQ-87 | admixture | Chile | 5 |
| 13 | UDEC-3 | admixture | Chile | 5 |
| 14 | DE-1 | 1 | Ecuador | 6 |
| 15 | Grande | 1 | Peru | 7 |
| 16 | Q-de-Quiaca | 1 | Peru | 7 |
| 17 | QQ-065 | 1 | Peru | 7 |
| 18 | QQ-61 | 1 | Peru | 7 |
| 19 | Quinua | 1 | Peru | 7 |
| 20 | Q-Amarillo | admixture | Peru | 7 |
| 21 | Q-Blanca | admixture | Peru | 7 |
| 22 | Col-#6197 | 2 | USA, Colorado | 8 |
| 23 | Colorado-407D | admixture | USA, Colorado | 8 |
| 24 | 537-BK60-B | admixture | USA, Maryland | 9 |
| 25 | 3P | 1 | USA, New Mexico | 10 |
| 26 | Copacabana | 1 | USA, New Mexico | 10 |
| 27 | Kaslaea | 2 | USA, New Mexico | 10 |
| 28 | 37TES | admixture | USA, New Mexico | 10 |
| 29 | 79R | admixture | USA, New Mexico | 10 |
| 30 | NSSL-91567 | admixture | USA, New York | 11 |
| 31 | NSSL-86649 | 2 | USA, South | 12 |
| 32 | Japanese-strain | 2 | USA, Washington | 13 |
| Population | No. of Genotypes | Na | Ne | I | H | % P | Private Alleles |
|---|---|---|---|---|---|---|---|
| Population 1 | 13 | 1.765 | 1.457 | 0.411 | 0.271 | 83.95 | 10 |
| Population 2 | 8 | 1.185 | 1.324 | 0.283 | 0.188 | 56.79 | 2 |
| population 3 | 11 | 1.531 | 1.401 | 0.351 | 0.232 | 71.6 | 2 |
| Source | Df | SS | MS | Est. Var. | % | ||
| Among Pops | 2 | 57.047 | 28.523 | 1.717 | 14% | ||
| Within Pops | 29 | 305.984 | 10.551 | 10.551 | 86% | ||
| Total | 31 | 363.031 | 12.268 | 100% | |||
| PhiPT | 0.14 | p < 0.001 |
Publisher’s Note: MDPI stays neutral with regard to jurisdictional claims in published maps and institutional affiliations. |
© 2021 by the authors. Licensee MDPI, Basel, Switzerland. This article is an open access article distributed under the terms and conditions of the Creative Commons Attribution (CC BY) license (http://creativecommons.org/licenses/by/4.0/).
Share and Cite
EL-Harty, E.H.; Ghazy, A.; Alateeq, T.K.; Al-Faifi, S.A.; Khan, M.A.; Afzal, M.; Alghamdi, S.S.; Migdadi, H.M. Morphological and Molecular Characterization of Quinoa Genotypes. Agriculture 2021, 11, 286. https://0-doi-org.brum.beds.ac.uk/10.3390/agriculture11040286
EL-Harty EH, Ghazy A, Alateeq TK, Al-Faifi SA, Khan MA, Afzal M, Alghamdi SS, Migdadi HM. Morphological and Molecular Characterization of Quinoa Genotypes. Agriculture. 2021; 11(4):286. https://0-doi-org.brum.beds.ac.uk/10.3390/agriculture11040286
Chicago/Turabian StyleEL-Harty, Ehab H., Abdelhalim Ghazy, Talal K. Alateeq, Sulieman A. Al-Faifi, Muhammad Altaf. Khan, Muhammed Afzal, Salem S. Alghamdi, and Hussein M. Migdadi. 2021. "Morphological and Molecular Characterization of Quinoa Genotypes" Agriculture 11, no. 4: 286. https://0-doi-org.brum.beds.ac.uk/10.3390/agriculture11040286