1. Introduction
Multispectral imaging (MSI) and near-infrared spectroscopy (NIRS) are both quick and non-destructive methods that have received much attention in seed testing and seed research. The fact that it is possible to measure different quality parameters in a non-destructive, quick, and for some methods, automatic way makes it very interesting for seed-testing facilities and the seed industry. Some of the challenges before the methods are fully implemented and integrated are: development and validation of appropriate statistical models to classify future seeds and a better understanding of these models, i.e., why did the seeds belong to the specific group. The latter is probably more interesting from a scientific, research, and development perspective. In some cases, e.g., a commercial setting, a prober model might be sufficient and the deeper understanding of it less important. This review concerns methods and applications in seed testing and research using MSI and single seed and bulk NIRS to characterize the covering structures of seeds used as regeneration material.
1.1. Seed Covering Structure and Chemical Composition
The microstructure and chemical composition of specific seed coat cell layers give rise to species and variety differences in seed coat structure and function. Most morphological features of the seed coat are relatively insensitive to environmental conditions and therefore very useful for taxonomic identification. Seed coat color is influenced by environmental conditions—i.e., climatic conditions during maturation and hence not appropriate for taxonomic purposes [
1].
Sugar beet (
Beta vulgaris subsp.
vulgaris var.
altissima Doell.) belongs to the
Amaranthaceae family, and other important crops in this family are red beet (
Beta vulgaris subsp. vulgaris var
. Conditiva) and spinach (
Spinacia oleracea L.). The dry fruit of sugar beet seed is a single achene with the fruit coat (pericarp) composed of lignified cells. The pericarp consists of an outer layer of parenchyma cells and an inner, denser layer of sclerenchyma cells. The fruit coat is a physical and chemical barrier for germination [
2]. The seeds of species in this family are characterized by a thick fruit coat consisting of lignified cells.
The typical fruit of the
Poaceae family (e.g., cereals and grasses) is a caryopsis, comprised by the embryo, the starchy endosperm, and the outer aleurone endosperm, surrounded in turn by the nucellar layer, the testa (seed coat) and the pericarp. In addition, the caryopsis of barley (
Hordeum vulgare L.) and oats (
Avena sativa L.) have an adherent outer coat or husk or hull consisting of the glumellae—lemma and palea—or the glumes, which are not removed, enclosing the caryopsis [
3,
4,
5]. In contrast to species in the
Amaranthaceae family, the seeds of species in this family are characterized by a thin fruit coat—the husk or hull.
1.2. Seed Coat Function
The seed coat is the seed’s primary defense against adverse environmental conditions [
6]. The seed coat functions as preserving the integrity of the interior parts of seeds, protects against pests and diseases, regulates gaseous exchanges between the embryo and the external environment and in many families the seed coat plays a role in the control of water absorption during imbibition and germination. Species in the
Fabaceae family (e.g., beans and forage legumes) have an outer layer consisting of a waxy cuticle [
1]. This represents a barrier to imbibition, which may be conferred by waxy or phenolic substances in the epidermis of the seed coat. Many legume species can produce seeds with seed coats temporarily impermeable to water—“hard seeds”—which is a mechanism of physical dormancy.
The intact seed coat protects the embryo from cellular rupture and the leakage of intracellular substances during imbibition. Soybean seeds (
Glycine max (L.) Merr.) with seed coat epidermal cracking have higher leakage and low viability [
7,
8] and rapid imbibition of soybean seeds increases the leakage of intracellular substance and decreases seedling survival [
7]. Leakage of intracellular substances from imbibing seeds are indicators of low seed vigor and viability.
Damage to seeds by microorganisms occurs by the production of exocellular enzymes which degrade the seed coat, and therefore microorganism infection may also lead to an increase in electrolyte leakage [
9].
2. Near-Infrared Spectroscopy
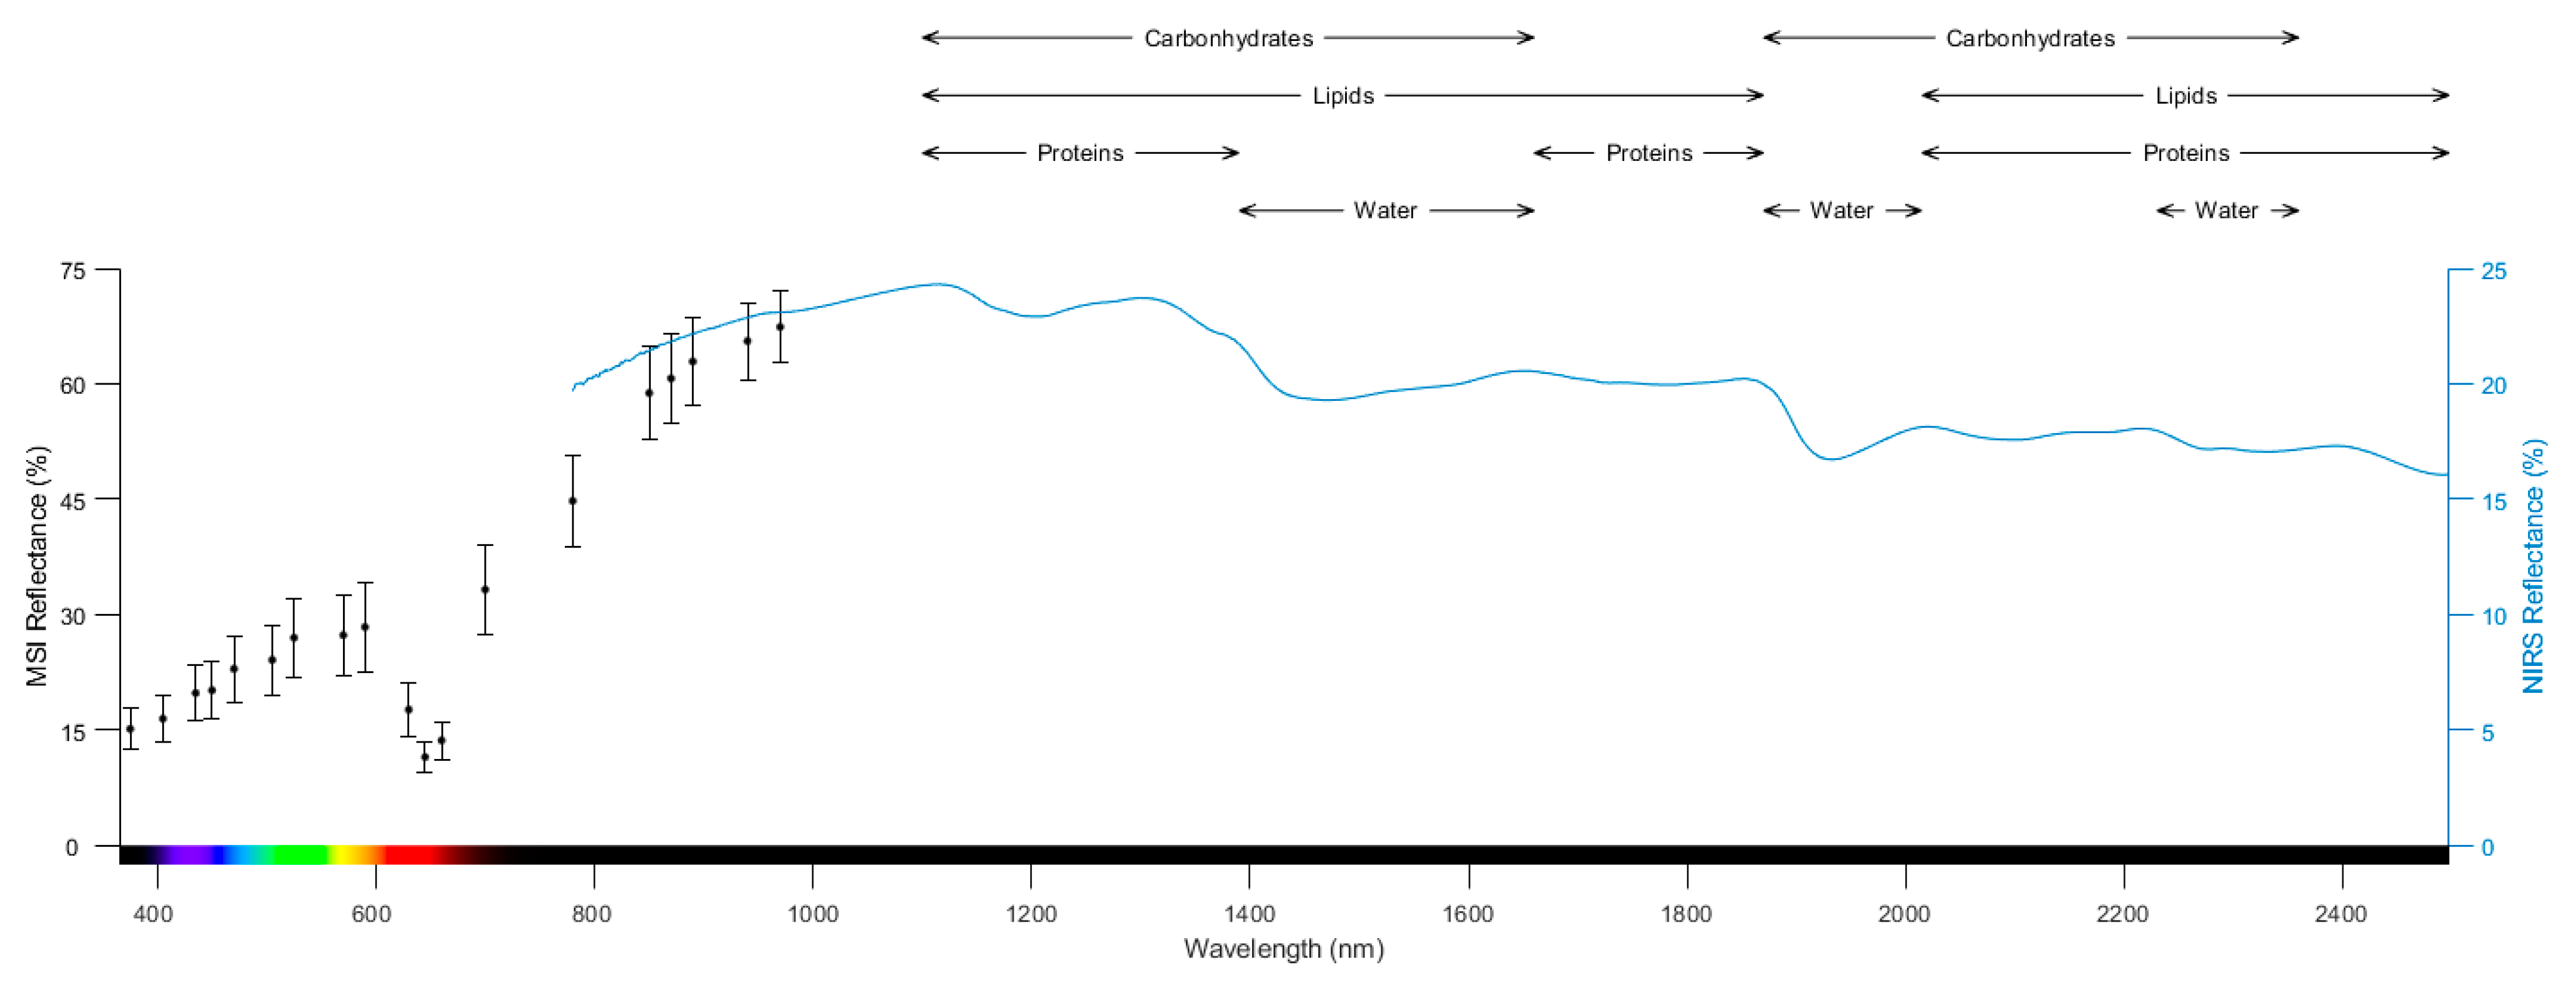
Single seed or bulk seed NIRS is a non-destructive measurement of the seed or seeds in the electromagnetic near-infrared (NIR) spectrum from wavelengths 780 to 2498 nm, equivalent to wavenumbers 12,821 to 4000 cm
−1, respectively, with a spectral resolution of 0.5–5 nm (
Figure 1) Thus, NIRS radiation is invisible to the human eye in contrast to the shorter wavelengths used in most image analysis systems. The NIR spectrum emerges when monochromatic radiation at a frequency which corresponds to the vibration of a particular chemical bond is absorbed by that bond, while the rest of the radiation is either reflected or transmitted without interacting with other bonds [
10]. The C-H, N-H, S-H or O-H bonds absorb the radiation energy and hence it is possible to measure water and organic compounds such as protein, carbohydrates, alcohols and/or lipids [
11]. The NIR spectrum consists of overtone bands when radiation energy makes the molecule go from the ground stage (
v = 0) to an excited stage (
v = 2) defined as the first overtone, or from the ground stage to
v = 3 defined as the second overtone. Furthermore, the NIR spectrum consists of combination vibrations, which typically form broad and complex wavebands making it difficult to relate the spectra to individual chemical components [
12]. This direct link between spectral information and the chemical compounds makes it obvious to develop a calibration model consisting of single seed NIRS measurements (explainable or X variables) and wet chemical measurement (response or Y variables) of the aforementioned chemical compounds. This model can be used to predict the chemical compounds in other future seeds.
2.1. NIRS Spectra with Good Informative Spectra
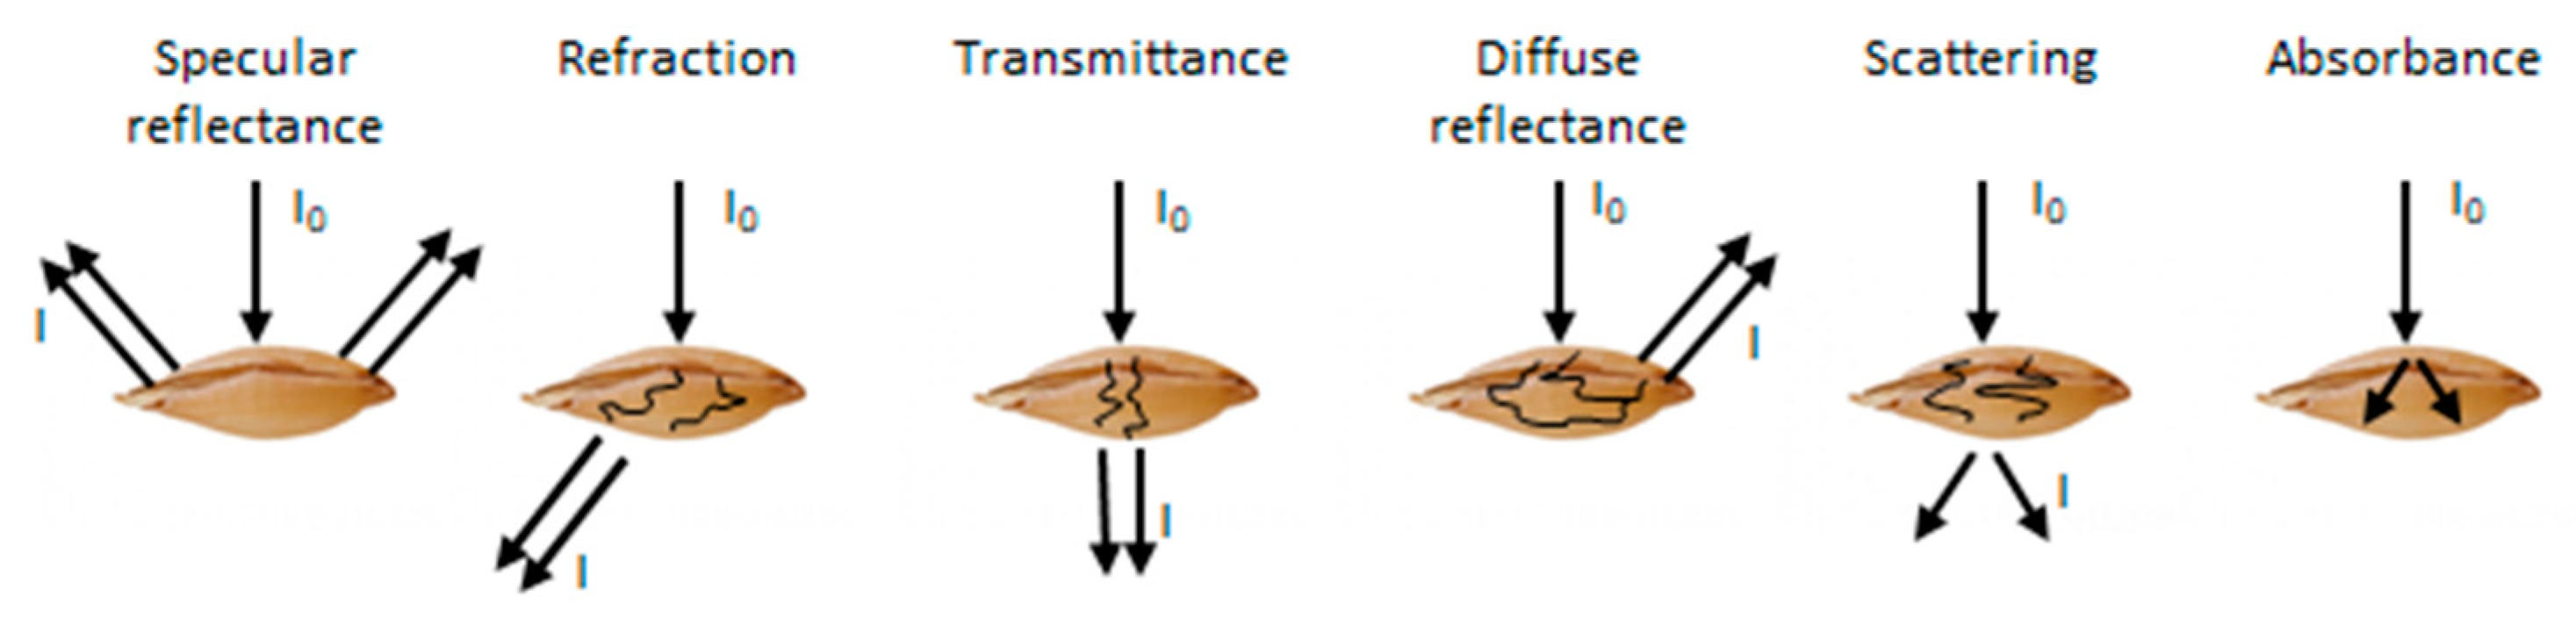
The use of NIRS in seed testing and seed research can be through single seed or bulk seed lot measurements. The single seed measurement requires a sample holder with similar form as the seed to reduce the risk of light scatter (light travelling outside the seed to the detector). Near-infrared light can penetrate the seed; however, the depth of the penetration depends on several factors such as the physical proportions of the seed. The NIR light is then reflected, refracted, transmitted, scattered or absorbed in the seed (
Figure 2)
The method for bulk seed NIRS measurement depends on the available instrumentation, and the output is a mean spectrum of the seeds.
The choice of single seed or bulk seed lot measurement depends on the aim of the project. The main advantage of single seed NIRS is the possibility to obtain a spectral signature, i.e., fingerprint for individual seeds, while bulk analysis is an average spectrum of the measured seeds. The benefit of bulk seed analysis lies in the reduced operation time and the possibility to characterize seed lots with fewer measurements as each spectrum represents the variation within the seed lot.
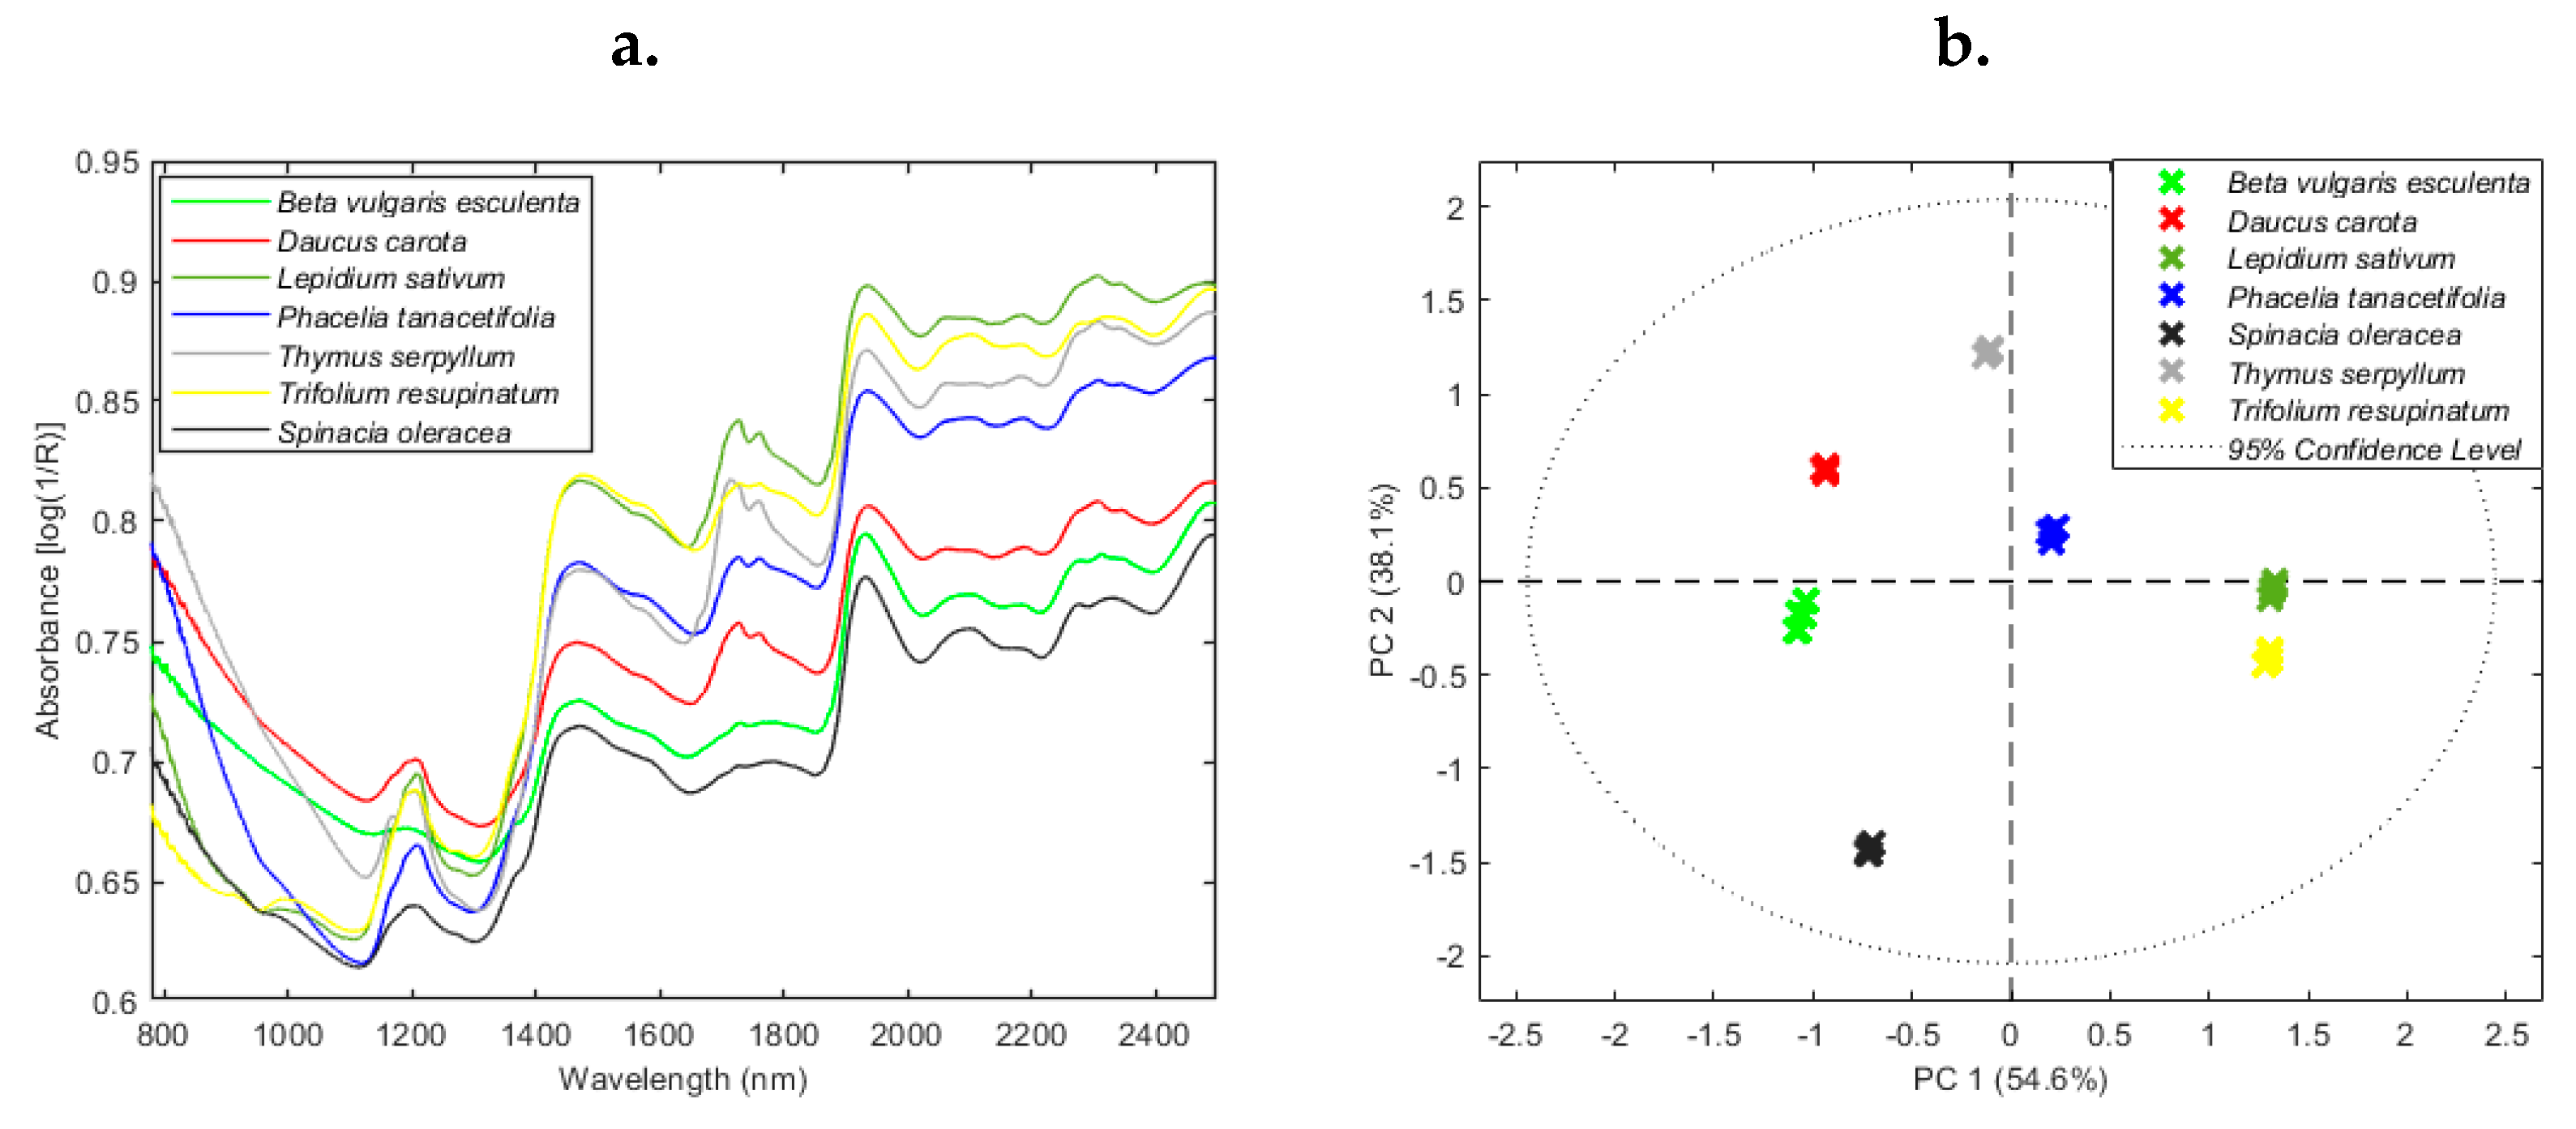
The raw NIR spectra contain important information in terms of spectral peaks that relate to chemical information. Shrestha et al. [
14] showed the NIR spectra of seeds of seven species and even though the trends (spectral peaks) were similar, it was possible to identify spectral differences between the species using principal component analysis (
Figure 3).
2.2. Spectral Pre-Processing
Pre-processing of the NIR spectra is the first step in developing informative classification models. The purpose of pre-processing is to identify and to remove spectral information that interferes with the desired predictions [
15]. If the pre-processing fails, there will be confusion between the information which is sought and the noise which is of no interest [
16]. Several pre-processing methods are available and some of them are thoroughly described and shown in Rinnan et al. [
17]. In practice, it is important to evaluate the effect of different pre-processing methods on the final models. Another possibility is to use the raw spectra in the subsequent principal component analysis (PCA) as shown in
Figure 3. The use of raw spectra will in most cases lead to the usage of more principal components for the final model to reduce noise in the spectra.
2.3. NIRS Model Development and Validation
Models for classification, pattern recognition or clustering developed from NIR spectra for one sample of seeds (either bulk or single seed NIRS) are intended to classify other seeds or seed samples of the same species based on their NIR spectra.
The NIRS data are highly correlated, meaning that data points next to each other are more alike than data points far from each other, and a common method to reduce this dimensionality is through PCA [
18]. Subsequently, this reduction in dimensionality is used in different linear and non-linear models as described by [
18,
19,
20]. The classification models are divided into supervised or non-supervised models where the supervision relates to labelled or non-labelled data. The use of labelled data in supervised classification models will inevitably influence the results and makes proper validation of the models even more important to avoid overfitting. There are a few regression-based classification models, such as partial least squares discriminant analysis [
21,
22] and extended canonical variates analysis [
23].
Validation of models is an essential part of the modelling process to ensure that a model can be used to classify other seeds or seed samples, but also to avoid giving unrealistic (i.e., optimistic) estimates of the ability to classify new samples [
24]. Any model should be validated for model performance and prediction ability using either cross-validation or test set-validation. Cross-validation is performed by dividing the full dataset into
G sample set and using
G-1 sample set as the training set and the remaining segment in the test set. Each segment is successively excluded and used for testing the model based on the remaining samples from the
G-1 segments. Using this method, all samples are used for both calibrating and validating the model. The performance of the model is evaluated by its predictive error in terms of root mean square error of cross-validation. Test set-validation is normally seen as a stronger validation of the obtained models as samples in the test set are not part of the model development. Test set-validation requires the data to be divided into a calibration and a validation set. The calibration set is used to calibrate the model and this model is subsequently tested on the validation set. The model performance using test set-validation is described by root mean square error of prediction.
3. Multispectral Imaging
Multispectral imaging of seeds is a non-destructive technique for simultaneously measuring spectral and spatial information of seeds by imaging their surface reflectance at selected wavelengths from 365 to 970 nm (
Figure 1). The combined spectral and spatial measurements provide information about the seed surface chemistry [
25] and seed morphology (color, shape, and texture). Multispectral images acquired through MSI is a middle ground between RGB (red green blue) color images and hyperspectral images. RGB images use three wide overlapping wavebands to mimic the human visual perception of colors. In contrast to hyperspectral imaging, which measures the reflectance at hundreds of continuous narrow wavebands across a large spectral range, multispectral imaging measures the reflectance at fewer (<50) and wider discrete wavebands (10–50 nm).
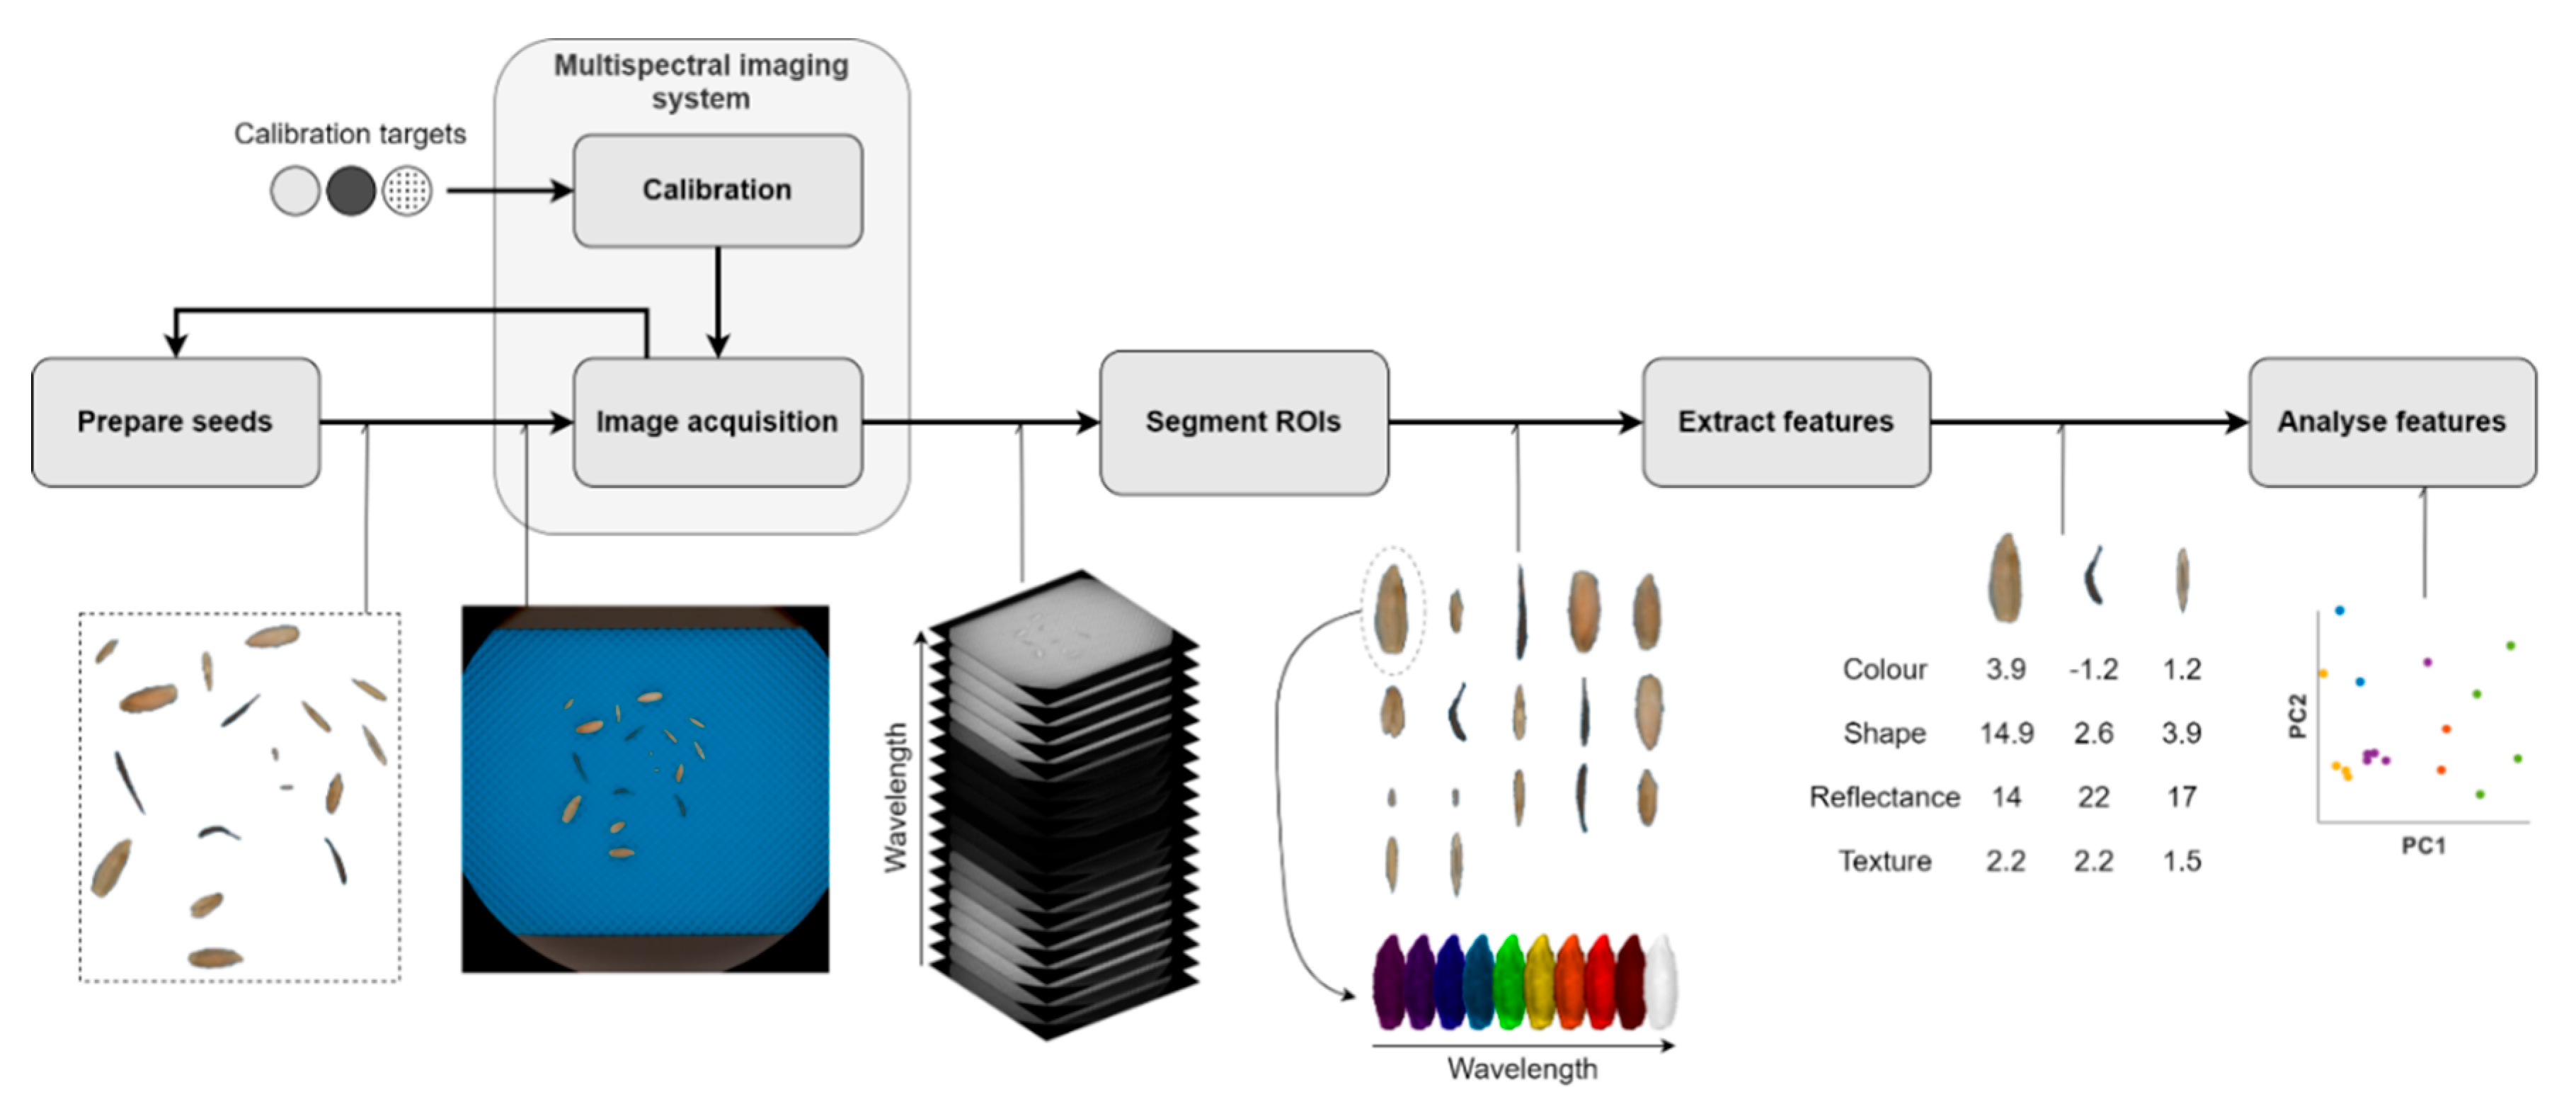
The workflow for MSI of seeds generally includes the following six steps (
Figure 4): (1) preparation of seed samples, (2) calibration of multispectral imaging system, (3) acquisition of multispectral images of the seeds, (4) segmentation of regions of interest (ROIs, e.g., the seeds, part(s) of the seeds or foreign matter) in the acquired multispectral images, (5) feature extraction from the segmented ROIs and (6) analysis of the extracted features. If the aim is to study changes in the seeds over time, for example, to follow the imbibition process or radicle emergence, steps 1 to 3 may be repeated multiple times before proceeding with steps 4 to 6.
3.1. Sample Preparation
For MSI, seeds require very little preparation beyond the preparation required for the application or experiment at hand. For example, if the aim was to see if it is possible to identify the presence of particular fungi on seeds, the first step might be to work with sterilized seeds before inoculating them with the fungus/fungi of interest [
26,
27,
28,
29,
30]. Similarly, it may be necessary to artificially age seeds for different lengths of time, to explore the use of MSI for predicting whether seeds are viable or dead, or parameters related to vigor (e.g., El Masry et al. [
31]). On the other hand, in varietal purity applications, the seeds may be imaged without any further preparation.
Due to the spatial nature of the multispectral images, multiple seeds can be imaged simultaneously. Seeds are often placed in a Petri dish and it is important that there is space around each seed. Seeds located too close to each other may touch or even overlap and cause occlusion leading to poorer segmentation and adding noise to the extracted features. To prevent seeds from moving, when placing them in the Petri dish, they may be fixed with double-sided tape [
29,
32] or placed on an insert with small recesses inside the Petri dish. When placing the seeds, it is important to consider which side is most relevant for the application and thus should be facing the imaging sensor. In applications where multiple sides are equally relevant, such as detection of processing damage, images from multiple sides can be acquired by imaging each seed multiple times [
33,
34,
35]. For some studies, it may be necessary to keep track of each individual seed through the imaging process to understand the subsequent ‘fate’ of each seed.
Placing seeds manually in a Petri dish for imaging can be both cumbersome and time-consuming. A conveyer belt can be used to automate the imaging process and increase the number of seeds imaged over time in applications where the seeds do not require any special preparation or manual assessment (e.g., variety or foreign matter identification [
36]).
3.2. Calibration of Multispectral Imaging System
The MSI system must be calibrated prior to image acquisition to ensure comparable reflectance measurements across wavebands and images, pixel correspondence between wavebands and to enable spatial measurements in world units [
37,
38]. This includes both a radiometric calibration and a geometric calibration, which is carried out by imaging calibration targets with known reflectance and geometry [
39].
Furthermore, the illumination and exposure times must be set to minimize the number of under- and oversaturated pixels, thereby maximizing the dynamic range and the signal-to-noise ratio of the images [
27,
37].
3.3. Image Acquisition
After calibration, the MSI system is ready to image the prepared samples. The output of a measurement is a multispectral image or “data cube” consisting of
W ×
H pixels ×
C channels, where
W and
H are the width and height of the image, respectively, and each pixel contains
C channels corresponding to the discrete multispectral bands. When a pixel position overlaps with a seed, the pixel values represent the chemistry on and below the surface of the seed in the small area covered by the pixel [
25].
Although multispectral imaging systems can acquire the images through either point scanning, line scanning or area scanning [
40], in the vast majority of the applications the images are acquired through area scanning with a charged coupled device (CCD) imaging sensor and sequentially illuminating the seeds using LEDs with the desired wavebands (
Table 1). Ideally, these wavebands should be carefully selected to match the application or research question [
34]. However, most MSI applications use the same multi-purpose MSI system (all applications with 19 bands in
Table 1), where the wavebands and spectral range are selected by the company. However, changing the spectral range will mean changing imaging sensor technology as the spectral range of the current MSI systems is limited by the quantum efficiency of a standard CCD to approximately 400–1000 nm.
Selecting a high contrasting background material on which the seeds are placed can make the segmentation step easier; however, the intensity level of the background should approximately match that of the seeds to fully use the dynamic range of the multispectral imaging system.
3.4. Segmentation of Regions-of-Interest
The multispectral images contain not only ROIs, but also background objects, such as the background material, the Petri dish, a conveyer belt, or other inert matter. In the segmentation step, the ROIs are separated from the background objects and extracted from the image. The ROIs in the multispectral images are often limited to only the seeds, but they may also include other objects such as foreign matter [
36]. To ensure that only the correct objects are analyzed, the segmentation method must extract only objects regarded as ROIs. Equally important, the segmentation method must return all pixels related to the ROIs, and only those pixels to reduce noise in the subsequently extracted features.
With a high contrast background material and sufficient space around each seed, the segmentation can often be carried out using a simple threshold in either a single channel [
36,
40], a sum of the channels [
33] or on a score image created through canonical discriminant analysis (CDA) [
53] or PCA [
36]. Ma et al. [
49] used Otsu’s algorithm [
56] to set the threshold automatically.
Although different methods have been explored, their performance have not been/are seldom quantified (e.g., pixel accuracy or intersection over union) beyond visual inspection as the segmentation step is often seen as an intermediate step towards the final analysis.
3.5. Feature Extraction
In recent applications, several features quantifying the reflectance and morphology of the seed have been explored. These features form four groups related to their characterization of the seed and their relation to the multispectral image: reflectance, color, shape, and texture (
Table 1). They are generally extracted from the entire seed; however, they may also focus on only a specific part of the seed such as the endosperm region [
42]. The reflectance and color features relate to the spectral dimension (C) of the multispectral image and express the intensity of either reflectance or color of the seed. The reflectance features either treat the wavebands individually by extracting first-order derivatives from the raw wavebands [
52] or combine them with a CDA transformation before extracting either a trimmed mean [
50] or ratio of pixels above a given threshold [
55]. In contrast, the color features combine wavebands overlapping with the human visible spectrum into a well-defined color space, e.g., CIELAB [
47], and extracts first-order features from there. The shape features are related to the spatial dimensions (
W ×
H) of the multispectral image and are therefore derived from the binary image created during segmentation. They include simple descriptors, such as area, width and length [
57], but also more complex descriptors, such as ellipse fitting parameters and resemblance to known simple shapes (i.e., circle, ellipse, and rectangle). The texture features combine the spatial and spectral dimensions by quantifying the spatial variation in intensity across the seed. This spatial variation in intensity can be caused by both small changes in the surface structure (valleys and hills) as well as changes in color in the seed surface pattern. The color, shape, and texture features describe the morphology of the seed and are therefore jointly referred to as morphological features. Characters of morphologic features of different seed structures play an important role in the delimitation and identification of species [
58].
The type of extracted features is somewhat application-dependent (
Table 1). Applications related to fungal presence all use reflectance features and to some extent color and texture features. Shape features are, however, not used as the shape of the seed is not affected by the presence of fungus until the fungus has grown significantly. On the other hand, applications related to varietal purity almost all use reflectance, color, and shape features, but do not consider texture features. Applications on seed viability and vigor favor reflectance and to a lesser extent color and shape.
For a given application, it is important to extract features which are expected to correlate well with the desired response variable. Features may be derived from existing knowledge, such as previous work in hyperspectral imaging, NIRS or crop descriptors [
59]. However, the selection of features should be well argued.
3.6. Multivariate Data Analysis
The multivariate data analysis of the extracted features often includes a descriptive statistic followed by data modelling. The descriptive statistics compares the mean and variation of the individual features for each class. For the reflectance features, this is often visualized as a mean spectrum for each of the classes [
26]. Principle component analysis is also widely used to investigate any trends in the features prior to data modelling.
Several linear and non-linear methods have been used for data modelling in MSI. The most frequently used methods include PCA, CDA, support vector machines (SVM), partial least squares and to a lesser extent neural networks and k-nearest neighbors (
Table 1)
Despite a large number of features and correlation between features within feature types (e.g., shape features), dimension reduction [
44,
57] or feature selection [
52] prior to modelling is the exception to the rule. However, several applications evaluate the feature types both individually and combined and show an improvement in accuracy when feature types are combined (
Table 1).
In applications related to physiological seed quality and seed health, it may be difficult to ensure an equal number of examples from each class. This leads to an unbalanced dataset, where one or more classes are either over- or underrepresented compared to the remaining classes in the dataset. Unbalanced data in the calibration set can lead to a model with poor generalization on future data, while the model is still reporting misleadingly high values in error metrics such as accuracy. The data imbalance may be handled as a pre-processing step (e.g., resampling) through cost-sensitive learning (assigning different costs to each type of misclassification) or at an algorithm-level [
60]. Likewise, error metrics less skewed by an unbalanced dataset should be favored.
4. Applications
The recent applications of multispectral imaging of seeds can be grouped into three categories according to the aspect of seed quality (
Table 1): physical seed quality, physiological seed quality, and seed health.
4.1. Physical Seed Quality
The physical seed quality applications include (a) varietal identity and purity, (b) presence of other seeds and inert matter and (c) seed coat integrity.
4.1.1. Varietal Identity and Purity
The microstructure and chemical composition of specific seed coat cell layers give rise to species and varieties differences. Most morphological features of the seed coat are relatively insensitive to environmental conditions and therefor very useful for taxonomic identification.
Multispectral imaging has been employed for varietal discrimination and identification in several species such as tomato (
Solanum lycopersicum L.), rice (
Oryza sativa L.) and soybean (reviewed in Boelt et al. [
55]). Color, shape and spectral features have been used in the classification models (
Table 1). Since then, studies in alfalfa and pepper (
Capsicum annuum L.) have been reported [
41,
43].
In pepper, three commercial varieties were analyzed for varietal identification [
43]. Each variety was represented by at least 450 seeds and seed material was harvested at different locations. Samples were divided into training and test set in the ratio 9:1. The study employs different multivariate data analysis and resulting classification accuracies are in the range of 86–98%. The multispectral imaging system used in this study has 19 bands. Interestingly, a successive projection algorithm identified nine bands, which provide a classification accuracy almost identical with the outcome with all 19 bands (97%). Still, the authors suggest that a data analysis with lower classification accuracy (93%) may be used as this is easier to operate and has a sufficiently high accuracy for the purpose. This illustrates how feasibility and ease of operation is of importance in the commercial seed industry.
Twelve alfalfa cultivars (
Medicago sativa L.) with diverse geographic origin were obtained from a genebank [
41]. A total number of 200 seeds were split 70:30 in training and testing set, respectively. Different multivariate data analysis was used to classify cultivars (
Table 1). When only morphological features were employed, classification accuracy was low (42–44%) but combined with spectral features, accuracy increased to 92–93%. It is noticed that based on spectral reflectance cultivars were classified into three groups correlating with geographic origin. This may be based on common genetic background or seeds may have been produced in different environments. Seed coat color is influenced by environmental conditions—i.e., climatic conditions during maturation and hence not appropriate for taxonomic purposes [
1]. However, variation in texture and chemical composition will also be reflected in the spectral features and they are highly relevant for taxonomic discrimination.
Seed accessions in genebanks may not be as uniform as commercial varieties; however, the description of the seed morphology is very important to manage the large accession numbers (for example during the regeneration procedure). Already Hansen et al. [
25] demonstrated high classification accuracy among 20 diverse rice varieties (93%) and suggested MSI as an important tool in management of genebank accessions. A recent study used MSI for the assessment of the genetic diversity in a collection of pigmented rice accessions from the Philippines [
45]. Geometric seed traits were quantified (area, length, width, roundness, and seed color parameters). The study identified pigmented rice accessions, which represent a valuable genetic resource for the future improvement of commercial rice varieties.
In conclusion, MSI may both be used to distinguishing among commercial varieties in the test of varietal purity and to describe diversity in seed traits during conservation management of plant genetic resources.
4.1.2. Presence of Other Seeds and Inert Matter
Sendin et al. [
34] reported the use of MSI for the determination of other crop seeds and plant debris in white maize (
Zea maize L.). Seeds of crop species were wheat (
Triticum aestivum L.), sorghum (
Sorghum bicolor L.), soybean and sunflower (
Helianthus annuus L.) and all were classified with 100% accuracy. Plant debris was also classified with 100% accuracy and the authors point to the benefit of MSI contra hyperspectral imaging in relation to shorter analysis time and lower cost. Recently Hu et al. [
39] published findings on the differentiation of sweet clover (
Melilotus ssp.) in alfalfa with a classification accuracy of >99% by MSI. Combining morphological features and spectral data in the models increased the accuracy. The survey included six alfalfa varieties and two species of sweet clover: One seed lot of
Melilotus officinalis and five seed lots of
Melilotus albus. All seed lots consisted of 200 seeds, divided in training and model testing in the proportion 70:30. Reflection mean intensity showed discrimination both in visible and NIRS wavelength bands.
As indicated in the two above-mentioned studies, very high accuracies may be expected when classifying seeds belonging to different species, and hence this may not attain much consideration in research; however, the determination of other seeds in crop seeds is a very time-consuming task in the seed industry. It appears relevant to develop robust models of crop seeds containing the variability in seed morphology from site to site, year to year for the use in seed testing. There are examples from the food industry in the detection of “foreign matter” which would include some of the same constituents as the inert matter fraction in a seed sample (soil, stones, plant debris) [
34,
36].
4.1.3. Integrity of Seed Covering Structures
The intact seed coat protects the internal structures of the seed and controls water uptake, but seed coat disrupture may occur due to insect infestation during seed production or storage or mechanical damage during harvest and processing. Seed coat damage negatively affects vigor and viability potential, and the “openings” of the damaged seed coat may be an entrance for pathogenic fungi.
Insect Infestation
When insect infestation occurs during seed production, the damaged seed is often discarded during harvest and processing due to a lower seed mass. Insect infestation occurring in the later developmental phase may not be identified and has the potential to develop during storage. Insect infestation has a direct effect on seed quality by consuming the seed reserves but there is also an indirect effect as it allows the establishment of secondary pests and fungi, for the storage pests lay eggs on the seed surface for the larvae to penetrate the seed coat and the larvae may undergo different larvae stages and finally produce a pupa inside the seed. X-ray and MSI have been tested for the identification of grain moth (
Sitotroga cerealella) in wheat [
28]. The study showed the potential of X-ray for the study of internal structures in the seed, whereas MSI showed the potential for identifying eggs on the seed surface.
Mechanical Damage
Species containing germination inhibitors in the seed coat (for example sugar beet) undergo different treatments during processing to remove these inhibitors. The inner pericarp layer contains crystals of chemical compounds in the sclerenchyma cells [
61], and the crystals dissolve in water during washing. This process alters the outer surface structure of sugar beet seed [
2]. MSI can detect changes in surface color and reflectance during maturation in sugar beet seed [
62], and the study verified a concomitant increase in the content of phenolic compounds. Removal of the pericarp by polishing is another approach for the removal of inhibitory compounds. The polishing process removes most of the large parenchyma cells of the pericarp and hence alters the surface of the sugar beet seed [
2]. The ideal treatment will remove the outer pericarp layer, whereas the inner pericarp layer remains intact. Besides removal of germination inhibitors, polishing also makes seed more uniform for pelleting and improves water uptake.
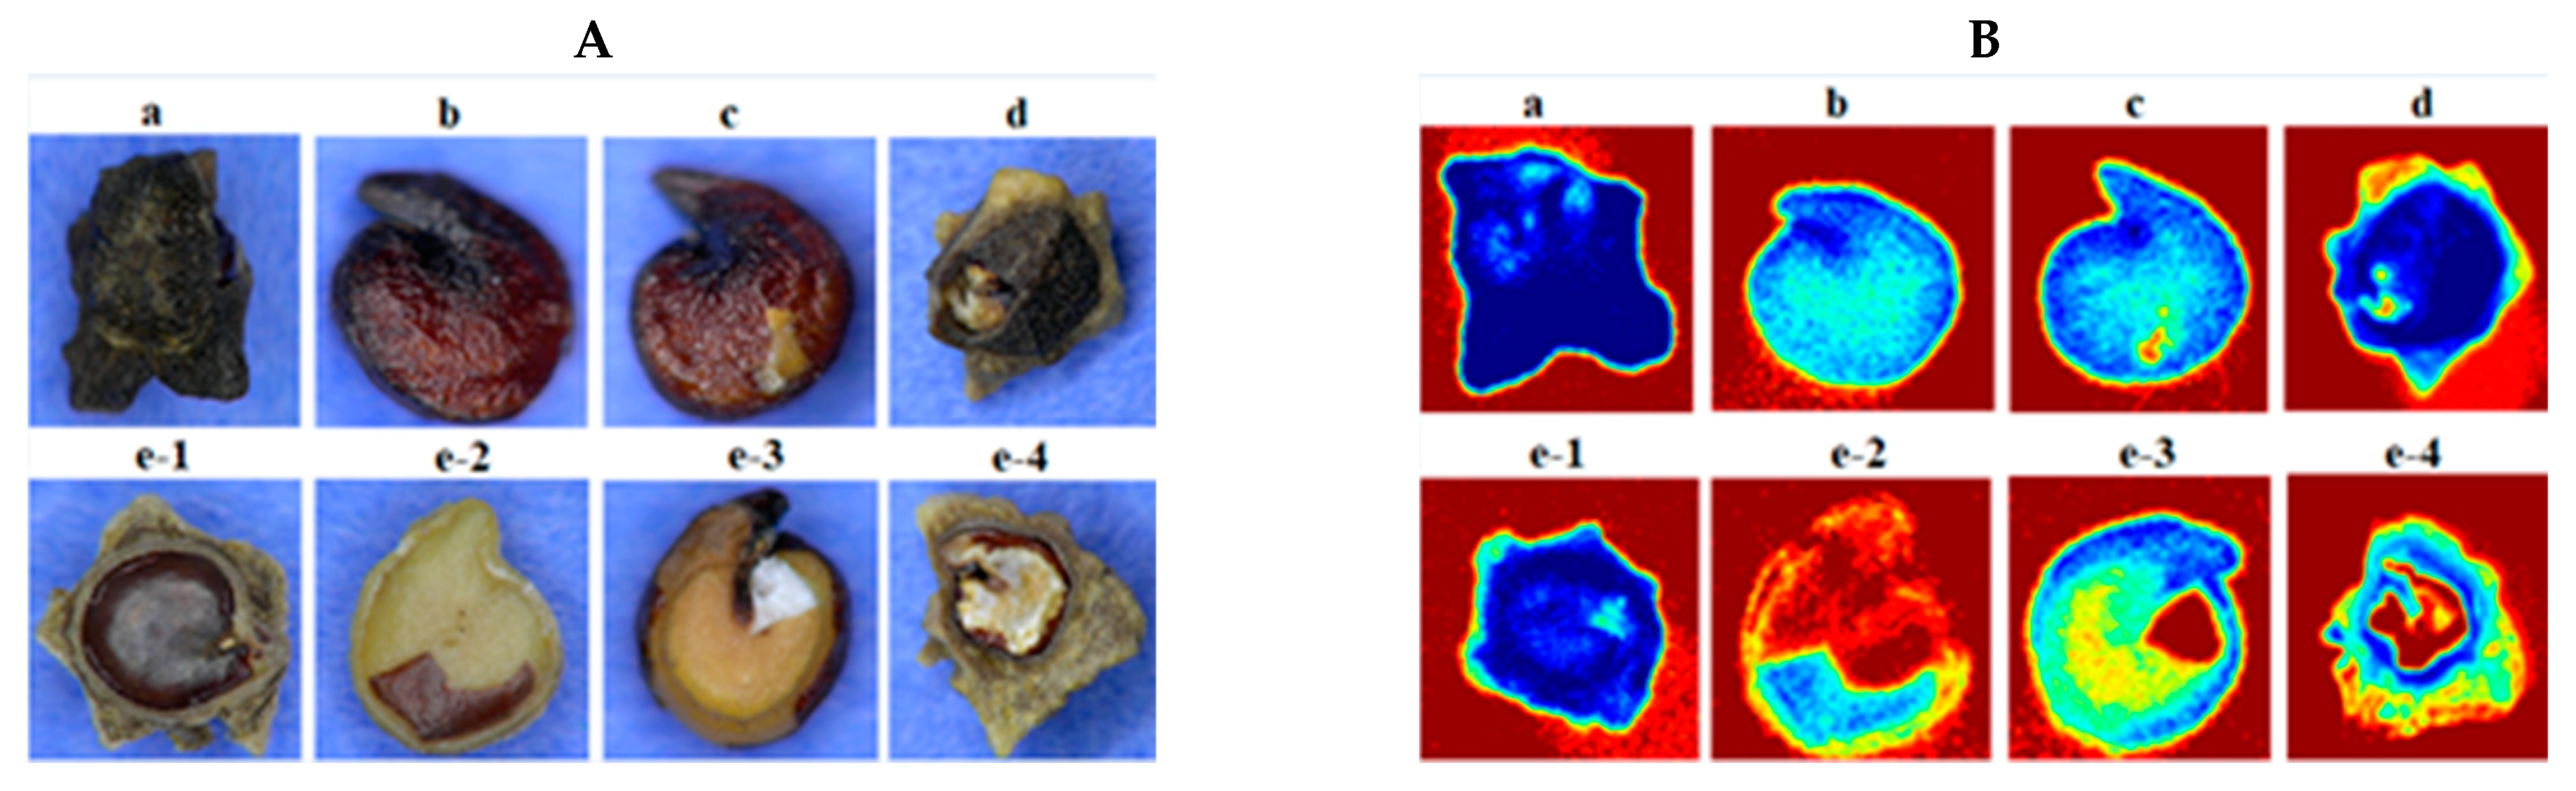
As with any mechanical operation, excessive processing can cause damage to the seed, and this damage can be extended to the interior parts of the seed and affect physiological quality of the seed (
Figure 5) Mechanical injuries decrease the seed longevity, expose the seed to the fungal infection and reduce viability.
Due to their sensitivity to water uptake, damaged seeds may result in heterogenous field performance, and there is also evidence from soybean, sweet corn and maize that the damaged seeds are more likely to produce abnormal seedlings [
61].
A study by Salimi [
35] displayed the potential of MSI in classification of various damage types, without additional analytical evaluation. The study demonstrated MSI as a tool for the identification of mechanical damage from polishing during processing and hence demonstrates MSI as a tool in seed quality assessment. A classification model based on MSI derived information about surface characteristics and multivariate data analysis enabled discrimination into five damage classes with 82% overall accuracy.
Barley (
Hordeum vulgare L.) grains without hulls will imbibe water and germinate more rapidly than those with firmly adhering husk [
63]. During harvest, the hull acts to protect the embryo during the abrasive threshing process in the harvester [
64]. However, the husk may be partially or wholly detached at harvest and during post-harvest handling (Brennan, Shepherd et al. 2017). MSI may be a potential tool for the characterization of de-hulled barley grains.
4.2. Physiological Seed Quality
Tannins, phenols, waxes, pigments, germination inhibitors and other substances are found in the seed covering structures of different species, and these may influence the function of the seed coat and subsequently the physiological development of the seed.
4.2.1. Viability
Olesen et al. [
50] identified viable castor bean (
Ricinus cummunis L.) seeds with 92% accuracy and showed good correlation between results from tetrazolium tests and MSI. Three seed lots were included in the study. In castor bean, seed coat color was related to the development and the darker seeds were the most developed. In this study, seeds from four ecotypes were studied. The calibration set consisted of 120 seeds from two ecotypes, and they were divided into three groups in depending on seed coat color (visible inspection). The validation set was two other ecotypes, and the seeds of those were also divided into three groups. After acquisition of MSI images, seeds were germinated for the phenotyping of viability, and a tetrazolium test was performed as the viability reference. A high correlation was found (92%). The supervised nCDA model showed 96% precision accuracy in the classification of viable and dead seeds in the validation set. The study showed high differentiation between viable and non-viable seed in mean intensity reflection in the wavelength interval 375–970 nm with the largest difference in the NIR-regions, which is supported by Shetty et al. [
52] in a study predicting germination ability in spinach. This latter reference combined the use of single seed NIRS and MSI.
Liu et al. [
53] also found a high prediction accuracy (91–92%) for high-quality watermelon (
Citrullus lanatus (Thunb.)) seed, in two different varieties using both spectral and morphology features in MSI. From each variety 500 seeds were classified into pure, viable; low vigor; other varieties and dead seeds by means of a grow-out trial. Prediction accuracy concerns two classes: pure, viable, and all other seeds for each variety.
4.2.2. Vigor
Several species in the Fabaceae family can produce hard seeds (physical dormancy) which are impermeable or semi-permeable and hence do not absorb water. Physical dormancy is often associated with a layer of wax in the outer layers of the seed coat.
Hu et al. [
54] examined seeds of six species within the Fabaceae family with MSI for the detection of hard seeds. For each species, 400 seeds were examined 70:30 in training and testing set, respectively, and following image acquisition seeds were imbibed for germination. Hard seeds were identified as un-imbibed, whereas seed which adsorbed water was classified as “soft” non-dormant seed. For three species (sweet clover, alfalfa and galega (
Galega officinalis L.)) MSI combined with multivariate data analysis has accuracies in the interval of 88–92% in detecting hard seeds, whereas for the other three species they could not be identified. In all three species studied, hard seeds showed a higher reflectance compared to non-hard seeds. Hu et al. [
54] used SVM analysis and found that wavelengths in the NIR-region, i.e., 970 nm (water) and 940 nm (lipids, were of highest importance in the separation of the two groups. However, for each species only one seed lot was represented in the analysis and there were proportionally fewer non-hard seeds which made the two groups unbalanced.
Single seed NIRS spectroscopy and MSI have been employed for the assessment of viability after controlled deterioration or artificially seed ageing in spinach [
38] and cowpea (
Vigna unguiculata L.) [
31]. In spinach, two seed lots with viability percentages of 90% and 97% were chosen for the examination by single seed NIRS after artificially ageing of both seed lots [
38]. In cowpea, variation in germination performance was generated by artificially ageing in four treatments (ageing intervals 24–96 h) [
31]. Olesen et al. [
38] used Extended Canonical Variates Analysis (ECVA) assigned differences of scatter corrected absorbance spectra from aged and non-aged seeds to CH
2, CH
3 and HC = CH structures, which are some of the functional groups in lipids. Lipids play a major role in both ageing and germination. During accelerated ageing lipid peroxidation leads to deterioration of cell membranes and contributes in that way to reducing seed viability of the seed sample. These biochemical changes may be the reason for a clear grouping between aged and non-aged seeds with misclassification in the range of 4–11% when performing the ECVA. In cowpea, the overall correct classification was in the interval 97–98% between aged and non-aged seeds, whereas the classification was lower in the detection of germinated versus non-germinated seed (79–82%). A recent paper reports a strong relationship between X-ray and MSI and seed physiological potential in
Jatropha curcas L. seed [
51]. Both viability and vigor were studied, and the authors find that reflectance data in the NIR wavelength 940 nm showed 96% accuracy.
Ruptured seed coats allow for the diffusion of leachates, which serve as substrates for pathogen growth, and broken seed coats serve as infection sites for seed pathogens. Common measurements of seed leakage in water are the conductivity of electrolytes and ultraviolet (UV) light absorbance (254 and 280 nm) [
65,
66]. Leaked solutes may be amino acids, proteins, sugars, and phenolics. Brassica seed has a high content of phenolic compounds. One of these is sinapine, the content of which increases under unfavorable storage conditions. Hill et al. [
67] found sinapine leakage a more accurate method for the identification of viable cabbage (
Brassica oleracea var.
capitata L.) seeds than the conductivity test. Sinapine was measured by the absorbance at 388 nm. The compound fluoresces when irradiated with UV light and has maximum absorbance values of 326 and 388 nm. Later work [
68] showed that seeds with cracked seed coat leaked faster and that seed coat integrity is a major factor regulating sinapine leakage. Sinapine does not leak from viable seeds [
67].
Since leaked solutes have been measured using absorbance of light in the UV region, a future perspective of MSI would be analyzing single dry seeds for diffused solutes often associated with cracks in the seed coat.
4.3. Seed Health
Detection of seeds infected by fungi is traditionally performed by visual inspection of dry seeds, washing tests, incubation methods, embryo count method or seedling symptom tests as well as identification of sporulation [
69,
70]. These methods require expert knowledge and can be time-consuming. However, the combinations of the features from multispectral images captured by visual light and NIR wavelengths (
Figure 1) have proved to be useful in the separation of infected and uninfected seeds (
Table 1), but depend on traditional reference methods.
Multispectral imaging for seed health detection has in several studies been based on artificial inoculation of uninfected seeds, with freeze-blotter seed health assay as reference method. First demonstrated in spinach by detection of
Stemphylium botryosum,
Cladosporium spp.,
Fusarium spp.,
Verticillium spp. or
Alternaria alternate [
26], and recently by detection of
Drechslera avenae and
Helminthosporium avenae in black oat/oats seeds (
Avena strigosa) [
32],
Fusarium pallidoroseum, Rhizoctonia solani, and
Aspergillus sp. in cowpea [
29].
The simplest approach is to use a visual score as reference for fungal infection. However, the method depends on an expert to classify the seeds in healthy and infected seeds as well as determine the species of the fungi. Weng et al. [
30] used artificial inoculation of uninfected seeds by
Ustilaginoidea virens in rice with a visual scoring as reference method. The seeds used in this study were divided into healthy, slightly infected, and infected seeds. However, the healthy and the slightly infected seeds were difficult to separate by a PCA. It was suggested that this was due to only minor changes in seed surface features or chemical components of the slightly infected seeds.
DNA-based data may be used as reference in combination with MSI. Boelt et al. [
55] used next generation sequencing (NGS) of the ITS (Internal Transcribed Spacer) from total DNA as reference method on naturally infected barley seeds collected from a wide range of environments. NGS is highly sensitive and gives information to species level as well as the fungal composition and quantities. This is particularly useful as several fungi may infect seeds simultaneously. NGS made it possible to separate seeds infected by
Alternaria infectoria, Dothidomycetes sp.,
Fusarium graminearum, F. avenaeum and
Mycosphaerella tassiana by multispectral imaging.
Magnetic resonance imaging (MRI) to identify anatomical changes in artificial inoculation of
Jatropha curcas L. was used in combination with MSI by Barboza da Silva et al. [
27]. The proposed MRI and MSI methodology allowed the identification of different damage patterns in the endosperm tissues due to infections by
Lasiodiplodia theobromae, Colletotrichum siamense, and
Colletotrichum truncatum. 5. Summary and Perspectives
Multispectral imaging and single seed or bulk seed NIRS are non-destructive techniques for quality assessment both in research and in seed testing. In contrast, hyperspectral imaging requires more resources for operation and is therefore most relevant in seed testing and seed research. Since recent reviews of multispectral imaging [
40,
55] there has been a growing evidence of the application of MSI in particular in physical seed quality evaluation and in seed health.
For physical seed quality, focus has been to distinguish genetic purity among varieties (alfalfa and pepper) or between crop species and inert matter (alfalfa versus sweet clover; mustard versus foreign and inert matter). In general, high classification accuracies have been obtained but often the number of samples or sample sizes have been limited or even unbalanced. Future studies ought to include more robust training and validation datasets by including higher and more diverse samples. Exploring seed produced at different sites (years and environmental conditions) would strengthen validation of the models by including variation in seed size and seed coat color and eventually lead to robust global models.
A relevant application for MSI is the characterization of the stored seed samples for the preservation of plant genetic resources. For this application features such as shape, texture, reflectance, and color are highly relevant, but they may be combined with a focus on specific parts of the seed, for example, the morphology of the hilum region, which is a relevant feature in the crop descriptors of legume seeds.
In conclusion, MSI may be used both to distinguish among commercial varieties in the test of varietal purity and to describe diversity in seed traits during conservation of plant genetic resources. For the assessment of physical seed quality, very little sample preparation is required, but a large diversity from each species or variety ought to be included by representing different production sites and climatic environments.
In seed research and seed testing, electrolyte leakage is an established method for vigor evaluation, where seeds are imbibed for a certain period of time, and the imbibition water is analyzed by spectrophotometer. Solutes are measured using the absorbance of light in the UV region. A future perspective of MSI would be analyzing single seeds? for diffused solutes in the UV band. The information acquired on the single seed level may even be combined with other features such as color, physical damage, or cracks in the seed coat. The determination of physiological seed quality will often require more sample preparation depending on the physiological process in question, and sample sizes may be unbalanced, for example, there are far fewer non-viable seeds in a commercial seed lot.
Physiological seed quality is often reflected in the chemistry of the seed and therefore information from the NIR-wavelength regions is often very informative. The region of interest for the chemical information defines which method to apply, where MSI will inspect the seed covering surface and single seed or bulk NIRS will inspect the seed beyond the surface cover. However, none of these methods provides information on internal morphological seed structures.
The use of MSI and single seed and bulk NIRS to characterize seed covering structures is only at the beginning, and there is a future potential for the development of specific applications in seed testing. Cross disciplinary studies between seed research and data science may combine the required insight in seed biology and data analysis to provide relevant seed samples for inspection and optimize feature extraction, data analysis, and model validation.
Author Contributions
Conceptualization, A.K.M., R.G., J.R.J. and B.B.; writing—original draft preparation, A.K.M., R.G., J.R.J. and B.B.; writing—review and editing, A.K.M., R.G., J.R.J. and B.B. All authors have read and agreed to the published version of the manuscript.
Funding
This material is based upon work that is funded by The Ministry of Higher Education and Science, Denmark.
Conflicts of Interest
The authors declare no conflict of interest.
References
- Souza, F.H.D.D.; Marcos-Filho, J. The seed coat as a modulator of seed-environment relationships in Fabaceae. Rev. Bras. De Botânica 2001, 24, 365–375. [Google Scholar] [CrossRef] [Green Version]
- Ignatz, M.; Hourston, J.E.; Tureckova, V.; Strnad, M.; Meinhard, J.; Fischer, U.; Steinbrecher, T.; Leubner-Metzger, G. The biochemistry underpinning industrial seed technology and mechanical processing of sugar beet. Planta 2019, 250, 1717–1729. [Google Scholar] [CrossRef] [Green Version]
- Rodríguez, M.V.; Barrero, J.M.; Corbineau, F.; Gubler, F.; Benech-Arnold, R.L. Dormancy in cereals (not too much, not so little): About the mechanisms behind this trait. Seed Sci. Res. 2015, 25, 99–119. [Google Scholar] [CrossRef] [Green Version]
- Brennan, M.; Shepherd, T.; Mitchell, S.; Topp, C.F.E.; Hoad, S.P. Husk to caryopsis adhesion in barley is influenced by pre- and post-anthesis temperatures through changes in a cuticular cementing layer on the caryopsis. BMC Plant Biol. 2017, 17, 169. [Google Scholar] [CrossRef] [Green Version]
- Cerri, M.; Reale, L. Anatomical traits of the principal fruits: An overview. Sci. Hortic. 2020, 270, 109390. [Google Scholar] [CrossRef]
- Mohamed-Yasseen, Y.; Barringer, S.A.; Splittstoesser, W.E.; Costanza, S. The role of seed coats in seed viability. Bot. Rev. 1994, 60, 426–439. [Google Scholar] [CrossRef]
- Duke, S.H.; Kakefuda, G.; Harvey, T.M. Differential Leakage of Intracellular Substances from Imbibing Soybean Seeds. Plant Physiol. 1983, 72, 919–924. [Google Scholar] [CrossRef] [PubMed] [Green Version]
- Duke, S.H.; Kakefuda, G.; Henson, C.A.; Loeffler, N.L.; Van Hulle, N.M. Role of the testa epidermis in the leakage of intracellular substances from imbibing soybean seeds and its implications for seedling survival. Physiol. Plant. 1986, 68, 625–631. [Google Scholar] [CrossRef]
- Halloin, J.M. Deterioration resistance mechanisms in seeds. Phytopathology 1983, 73, 335–339. [Google Scholar] [CrossRef]
- Workman Jr., J.; Shenk, J. Understanding and Using the Near-Infrared Spectrum as an Analytical Method. Near-Infrared Spectrosc. Agric. 2004, 44, 1–10. [Google Scholar] [CrossRef]
- Agelet, L.E.; Hurburgh, C.R. Limitations and current applications of Near Infrared Spectroscopy for single seed analysis. Talanta 2014, 121, 288–299. [Google Scholar] [CrossRef]
- Osborne, B.G.; Fearn, T.; Hindle, P.H. Practical NIR Spectroscopy with Applications in Food and Beverage Analysis; Longman Scientific and Technical: Harlow, UK, 1993; p. 227. [Google Scholar]
- Lequeue, G.; Draye, X.; Baeten, V. Determination by near infrared microscopy of the nitrogen and carbon content of tomato (Solanum lycopersicum L.) leaf powder. Sci. Rep. 2016, 6, 33183. [Google Scholar] [CrossRef] [Green Version]
- Shrestha, S.; Deleuran, L.; Gislum, R. Classification of different tomato seed cultivars by multispectral visible-near infrared spectroscopy and chemometrics. J. Spectr. Imaging 2016, 5, a1. [Google Scholar] [CrossRef]
- Boulet, J.-C.; Roger, J.-M. Pretreatments by means of orthogonal projections. Chemom. Intell. Lab. Syst. 2012, 117, 61–69. [Google Scholar] [CrossRef] [Green Version]
- Rinnan, Å. Pre-processing in vibrational spectroscopy—When, why and how. Anal. Methods 2014, 6, 7124–7129. [Google Scholar] [CrossRef]
- Rinnan, Å.; Berg, F.V.D.; Engelsen, S.B. Review of the most common pre-processing techniques for near-infrared spectra. TrAC Trends Anal. Chem. 2009, 28, 1201–1222. [Google Scholar] [CrossRef]
- Wold, S.; Esbensen, K.; Geladi, P. Principal component analysis. Chemom. Intell. Lab. Syst. 1987, 2, 37–52. [Google Scholar] [CrossRef]
- McLachlan, G.J. Discriminant Analysis and Statistical Pattern Recognition; John Wiley & Sons: Hoboken, NJ, USA, 2004; Volume 544. [Google Scholar]
- Coomans, D.; Massart, D.L. Alternative k-nearest neighbour rules in supervised pattern recognition: Part 2. Probabilistic classification on the basis of the kNN method modified for direct density estimation. Anal. Chim. Acta 1982, 138, 153–165. [Google Scholar] [CrossRef]
- Barker, M.; Rayens, W. Partial least squares for discrimination. J. Chemom. 2003, 17, 166–173. [Google Scholar] [CrossRef]
- Brereton, R.G.; Lloyd, G.R. Partial least squares discriminant analysis: Taking the magic away. J. Chemom. 2014, 28, 213–225. [Google Scholar] [CrossRef]
- Nørgaard, L.; Bro, R.; Westad, F.; Engelsen, S.B. A modification of canonical variates analysis to handle highly collinear multivariate data. J. Chemom. 2006, 20, 425–435. [Google Scholar] [CrossRef]
- Westad, F.; Marini, F. Validation of chemometric models—A tutorial. Anal. Chim. Acta 2015, 893, 14–24. [Google Scholar] [CrossRef] [PubMed]
- Hansen, M.A.E.; Hay, F.R.; Carstensen, J.M. A virtual seed file: The use of multispectral image analysis in the management of genebank seed accessions. Plant Genet. Resour. Charact. Util. 2016, 14, 238–241. [Google Scholar] [CrossRef] [Green Version]
- Olesen, M.H.; Carstensen, J.M.; Boelt, B. Multispectral imaging as a potential tool for seed health testing of spinach (Spinacia oleracea L.). Seed Sci. Technol. 2011, 39, 140–150. [Google Scholar] [CrossRef]
- Barboza Da Silva, C.; Bianchini, V.D.J.M.; Medeiros, A.D.D.; Moraes, M.H.D.D.; Marassi, A.G.; Tannús, A. A novel approach for Jatropha curcas seed health analysis based on multispectral and resonance imaging techniques. Ind. Crop. Prod. 2021, 161, 113186. [Google Scholar] [CrossRef]
- França-Silva, F.; Rego, C.H.Q.; Gomes-Junior, F.G.; Brancaglioni, V.A.; Hirai, W.Y.; Rodrigues, D.B.; Almeida, A.d.S.; Martins, A.B.N.; Tunes, L.V.M.D. Determination of Sitotroga cerealella infestation in wheat seeds by radiographic and multispectral images. Agron. J. 2020, 112, 3695–3703. [Google Scholar] [CrossRef]
- Rego, C.H.Q.; Franca-Silva, F.; Gomes, F.G.; de Moraes, M.H.D.; de Medeiros, A.D.; da Silva, C.B. Using Multispectral Imaging for Detecting Seed-Borne Fungi in Cowpea. Agriculture 2020, 10, 361. [Google Scholar] [CrossRef]
- Weng, H.; Tian, Y.; Wu, N.; Li, X.; Yang, B.; Huang, Y.; Ye, D.; Wu, R. Development of a Low-Cost Narrow Band Multispectral Imaging System Coupled with Chemometric Analysis for Rapid Detection of Rice False Smut in Rice Seed. Sensors 2020, 20, 1209. [Google Scholar] [CrossRef] [PubMed] [Green Version]
- ElMasry, G.; Mandour, N.; Wagner, M.H.; Demilly, D.; Verdier, J.; Belin, E.; Rousseau, D. Utilization of computer vision and multispectral imaging techniques for classification of cowpea (Vigna unguiculata) seeds. Plant Methods 2019, 15, 24. [Google Scholar] [CrossRef] [Green Version]
- França-Silva, F.; Rego, C.H.Q.; Gomes-Junior, F.G.; Moraes, M.H.D.D.; Medeiros, A.D.D.; Silva, C.B.D. Detection of Drechslera avenae (Eidam) Sharif [Helminthosporium avenae (Eidam)] in Black Oat Seeds (Avena strigosa Schreb) Using Multispectral Imaging. Sensors 2020, 20, 3343. [Google Scholar] [CrossRef]
- Jaillais, B.; Roumet, P.; Pinson-Gadais, L.; Bertrand, D. Detection of Fusarium head blight contamination in wheat kernels by multivariate imaging. Food Control 2015, 54, 250–258. [Google Scholar] [CrossRef]
- Sendin, K.; Manley, M.; Williams, P.J. Classification of white maize defects with multispectral imaging. Food Chem. 2018, 243, 311–318. [Google Scholar] [CrossRef] [PubMed]
- Salimi, Z.; Boelt, B. Classification of Processing Damage in Sugar Beet (Beta vulgaris) Seeds by Multispectral Image Analysis. Sensors 2019, 19, 2360. [Google Scholar] [CrossRef] [PubMed] [Green Version]
- Li, M.; Huang, M.; Zhu, Q.; Zhang, M.; Guo, Y.; Qin, J. Pickled and dried mustard foreign matter detection using multispectral imaging system based on single shot method. J. Food Eng. 2020, 285, 110106. [Google Scholar] [CrossRef]
- Dissing, B.S.; Nielsen, M.E.; Ersbøll, B.K.; Frosch, S. Multispectral Imaging for Determination of Astaxanthin Concentration in Salmonids. PLoS ONE 2011, 6, e19032. [Google Scholar] [CrossRef] [PubMed] [Green Version]
- Olesen, M.H.; Shetty, N.; Gislum, R.; Boelt, B. Classification of Viable and Non-Viable Spinach (Spinacia Oleracea L.) Seeds by Single Seed near Infrared Spectroscopy and Extended Canonical Variates Analysis. J. Near Infrared Spectrosc. 2011, 19, 171–180. [Google Scholar] [CrossRef]
- Hu, X.W.; Yang, L.J.; Zhang, Z.X.; Wang, Y.R. Differentiation of alfalfa and sweet clover seeds via multispectral imaging. Seed Sci. Technol. 2020, 48, 83–99. [Google Scholar] [CrossRef]
- ElMasry, G.; Mandour, N.; Al-Rejaie, S.; Belin, E.; Rousseau, D. Recent Applications of Multispectral Imaging in Seed Phenotyping and Quality Monitoring-An Overview. Sensors 2019, 19, 1090. [Google Scholar] [CrossRef] [Green Version]
- Yang, L.; Zhang, Z.; Hu, X. Cultivar Discrimination of Single Alfalfa (Medicago sativa L.) Seed via Multispectral Imaging Combined with Multivariate Analysis. Sensors 2020, 20, 6575. [Google Scholar] [CrossRef]
- De la Fuente, G.N.; Carstensen, J.M.; Edberg, M.A.; Lubberstedt, T. Discrimination of haploid and diploid maize kernels via multispectral imaging. Plant Breed. 2017, 136, 50–60. [Google Scholar] [CrossRef] [Green Version]
- Li, X.; Fan, X.; Zhao, L.; Huang, S.; He, Y.; Suo, X. Discrimination of Pepper Seed Varieties by Multispectral Imaging Combined with Machine Learning. Appl. Eng. Agric. 2020, 36, 743–749. [Google Scholar] [CrossRef]
- Liu, W.; Liu, C.; Ma, F.; Lu, X.; Yang, J.; Zheng, L. Online Variety Discrimination of Rice Seeds Using Multispectral Imaging and Chemometric Methods. J. Appl. Spectrosc. 2016, 82, 993–999. [Google Scholar] [CrossRef]
- Mbanjo, E.G.N.; Jones, H.; Caguiat, X.G.I.; Carandang, S.; Ignacio, J.C.; Ferrer, M.C.; Boyd, L.A.; Kretzschmar, T. Exploring the genetic diversity within traditional Philippine pigmented Rice. Rice 2019, 12, 27. [Google Scholar] [CrossRef] [PubMed] [Green Version]
- Liu, C.; Liu, W.; Lu, X.; Chen, W.; Chen, F.; Yang, J.; Zheng, L. Non-destructive discrimination of conventional and glyphosate-resistant soybean seeds and their hybrid descendants using multispectral imaging and chemometric methods. J. Agric. Sci. 2016, 154, 1–12. [Google Scholar] [CrossRef]
- Shrestha, S.; Deleuran, L.C.; Olesen, M.H.; Gislum, R. Use of multispectral imaging in varietal identification of tomato. Sensors 2015, 15, 4496–4512. [Google Scholar] [CrossRef] [PubMed] [Green Version]
- Vresak, M.; Olesen, M.H.; Gislum, R.; Bavec, F.; Ravn Jorgensen, J. The Use of Image-Spectroscopy Technology as a Diagnostic Method for Seed Health Testing and Variety Identification. PLoS ONE 2016, 11, e0152011. [Google Scholar] [CrossRef]
- Ma, F.; Wang, J.; Liu, C.; Lu, X.; Chen, W.; Chen, C.; Yang, J.; Zheng, L. Discrimination of Kernel Quality Characteristics for Sunflower Seeds Based on Multispectral Imaging Approach. Food Anal. Methods 2015, 8, 1629–1636. [Google Scholar] [CrossRef]
- Olesen, M.H.; Nikneshan, P.; Shrestha, S.; Tadayyon, A.; Deleuran, L.C.; Boelt, B.; Gislum, R. Viability prediction of Ricinus cummunis L. seeds using multispectral imaging. Sensors 2015, 15, 4592–4604. [Google Scholar] [CrossRef] [Green Version]
- Bianchini, V.d.J.M.; Mascarin, G.M.; Silva, L.C.A.S.; Arthur, V.; Carstensen, J.M.; Boelt, B.; Barboza da Silva, C. Multispectral and X-ray images for characterization of Jatropha curcas L. seed quality. Plant Methods 2021, 17, 9. [Google Scholar] [CrossRef]
- Shetty, N.; Olesen, M.H.; Gislum, R.; Deleuran, L.C.; Boelt, B. Use of partial least squares discriminant analysis on visible-near infrared multispectral image data to examine germination ability and germ length in spinach seeds. J. Chemom. 2012, 26, 462–466. [Google Scholar] [CrossRef]
- Liu, W.; Xu, X.; Liu, C.; Zheng, L. Rapid Discrimination of High-Quality Watermelon Seeds by Multispectral Imaging Combined with Chemometric Methods. J. Appl. Spectrosc. 2019, 85, 1044–1049. [Google Scholar] [CrossRef]
- Hu, X.; Yang, L.; Zhang, Z. Non-destructive identification of single hard seed via multispectral imaging analysis in six legume species. Plant Methods 2020, 16, 116. [Google Scholar] [CrossRef]
- Boelt, B.; Shrestha, S.; Salimi, Z.; Jorgensen, J.R.; Nicolaisen, M.; Carstensen, J.M. Multispectral imaging—A new tool in seed quality assessment? Seed Sci. Res. 2018, 28, 222–228. [Google Scholar] [CrossRef]
- Otsu, N. A threshold selection method from gray-level histograms. IEEE Trans. Syst. ManCybern. 1979, 9, 62–66. [Google Scholar] [CrossRef] [Green Version]
- Liu, C.; Liu, W.; Lu, X.; Chen, W.; Yang, J.; Zheng, L. Nondestructive determination of transgenic Bacillus thuringiensis rice seeds (Oryza sativa L.) using multispectral imaging and chemometric methods. Food Chem. 2014, 153, 87–93. [Google Scholar] [CrossRef] [PubMed]
- Gabr, D.G. Seed morphology and seed coat anatomy of some species of Apocynaceae and Asclepiadaceae. Ann. Agric. Sci. 2014, 59, 229–238. [Google Scholar] [CrossRef] [Green Version]
- IBPGR. Descriptors for Cowpea; IBPGR (International Board for Plant Genetic Resources): Rome, Italy, 1983; p. 30. [Google Scholar]
- Haixiang, G.; Yijing, L.; Shang, J.; Mingyun, G.; Yuanyue, H.; Bing, G. Learning from class-imbalanced data: Review of methods and applications. Expert Syst. Appl. 2017, 73, 220–239. [Google Scholar] [CrossRef]
- Chomontowski, C.; Podlaski, S. Impact of sugar beet seed priming using the SMP method on the properties of the pericarp. BMC Plant Biol. 2020, 20, 32. [Google Scholar] [CrossRef] [PubMed]
- Salimi, Z.; Boelt, B. Optimization of Germination Inhibitors Elimination from Sugar Beet (Beta vulgaris L.) Seeds of Different Maturity Classes. Agronomy 2019, 9, 763. [Google Scholar] [CrossRef] [Green Version]
- Hoad, S.P.; Brennan, M.; Wilson, G.W.; Cochrane, P.M. Hull to caryopsis adhesion and grain skinning in malting barley: Identification of key growth stages in the adhesion process. J. Cereal Sci. 2016, 68, 8–15. [Google Scholar] [CrossRef]
- Olkku, J.; Kotaviita, E.; Salmenkallio-Marttila, M.; Sweins, H.; Home, S. Connection between Structure and Quality of Barley Husk. J. Am. Soc. Brew. Chem. 2005, 63, 17–22. [Google Scholar] [CrossRef]
- Murphy, J.B.; Noland, T.L. Temperature Effects on Seed Imbibition and Leakage Mediated by Viscosity and Membranes. Plant Physiol. 1982, 69, 428–431. [Google Scholar] [CrossRef] [PubMed]
- Parrish, D.J.; Leopold, A.C. Transient Changes During Soybean Imbibition. Plant Physiol. 1977, 59, 1111–1115. [Google Scholar] [CrossRef] [PubMed]
- Hill, H.J.; Taylor, A.G.; Huang, X.L. Seed Viability Determinations in Cabbage Utilizing Sinapine Leakage and Electrical Conductivity Measurements. J. Exp. Bot. 1988, 39, 1439–1447. [Google Scholar] [CrossRef]
- Taylor, A.G.; Paine, D.H.; Paine, C.A. Sinapine Leakage from Brassica Seeds. J. Am. Soc. Hortic. Sci. 1993, 118, 546–550. [Google Scholar] [CrossRef] [Green Version]
- Mathur, S.; Kongsdal, O. Common Laboratory Seed Health Testing Methods for Detecting Fungi; International Seed Testing Association: Bassersdof, Switzerland, 2003; 425p. [Google Scholar]
- Lievens, B.; Thomma, B.P.H.J. Recent Developments in Pathogen Detection Arrays: Implications for Fungal Plant Pathogens and Use in Practice. Phytopathology 2005, 95, 1374–1380. [Google Scholar] [CrossRef] [Green Version]
| Publisher’s Note: MDPI stays neutral with regard to jurisdictional claims in published maps and institutional affiliations. |
© 2021 by the authors. Licensee MDPI, Basel, Switzerland. This article is an open access article distributed under the terms and conditions of the Creative Commons Attribution (CC BY) license (https://creativecommons.org/licenses/by/4.0/).


