Article

Four-Year Study on the Bio-Agronomic Response of Biotypes of Capparis spinosa L. on the Island of Linosa (Italy)

1
Department of Agricultural, Food and Forest Sciences, Università degli Studi di Palermo, Viale delle Scienze 13, Building 4, 90128 Palermo, Italy
2
Department of Agricultural and Forest Sciences, Università degli Studi della Tuscia, 01100 Viterbo, Italy
3
Research Consortium for the Development of Innovative Agro-Environmental Systems (Corissia), Via della Libertà 203, 90143 Palermo, Italy
*
Authors to whom correspondence should be addressed.
These authors are equally contributed.
Submission received: 10 March 2021 / Revised: 2 April 2021 / Accepted: 6 April 2021 / Published: 7 April 2021

Abstract

:
The caper plant is widespread in Sicily (Italy) both wild in natural habitats and as specialized crops, showing considerable morphological variation. However, although contributing to a thriving market, innovation in caper cropping is low. The aim of the study was to evaluate agronomic and production behavior of some biotypes of Capparis spinosa L. subsp. rupestris, identified on the Island of Linosa (Italy) for growing purposes. Two years and seven biotypes of the species were tested in a randomized complete block design. The main morphological and production parameters were determined. Phenological stages were also observed. Analysis of variance showed high variability between the biotypes. Principal component analysis and cluster analysis highlighted a clear distinction between biotypes based on biometric and production characteristics. Production data collected in the two-year period 2007–2008 showed the greatest production levels in the third year following planting in 2005. In particular, biotype SCP1 had the highest average value (975.47 g) of flower bud consistency. Our results permitted the identification of biotypes of interest for the introduction into new caper fields. Further research is needed in order to characterize caper biotypes in terms of the chemical composition of the flower buds and fruits.

Graphical Abstract

1. Introduction

The caper plant belongs to the Capparaceae family, which includes approximately 40–60 tropical, subtropical and temperate genera, 700–900 species of which belong to tree, shrub and herbaceous plants [1]. The genus Capparis L. includes approximately 250 species distributed in tropical and subtropical regions [2,3]. It is a minor crop but since the origins of civilization man has taken an interest in this species due to its healing and nutritional properties [4,5,6,7]. Populations of Capparis L. on the continent of Europe include Capparis spinosa L. with two subspecies: subsp. spinosa and subsp. rupestris (Sibth and Sm) Nyman [8].
In Sicily (Italy) and the surrounding islands, C. spinosa, with the two intraspecific taxa, subsp. spinosa and subsp. rupestris, is widespread both wild in natural habitats and as specialized crops [9], showing considerable morphological variation due to a number of factors, such as phenotypic plasticity, eco-geographical differentiation and hybridization processes, which promote the presence of intermediate phenotypes [3,10].
Caper buds, harvested from both wild and cultivated plants, are mainly used for food and medicinal purposes [5]. Immature flower buds, called “capers”, the fruits, known as “cucunci” or “capperone” and the tender leaves, preserved in salt or vinegar, are popular in cuisine, enjoying good levels of global trade [11,12,13,14,15]. The consistency of the caper berries is central to the quality of the berry. Consistency is important in the creation maturation indices, for the handling and preservation of the product and in customer sensory perception. The size of the bud is also fundamental for commercialization purposes, with a customer preference for small buds [16,17].
It is known for its medicinal use due to the marked therapeutic effects of its extracts. Ethnobotanical research carried out in Sicily [18] shows how extracts of the stem of the caper plant have been used in traditional Sicilian medicine to treat toothache for many years. Various pharmacological properties are attributed to the extracts of leaves, stems, flowers, fruits and roots, such as anti-hypertensive [19], anti-hepatic [20], anti-diabetic [21,22], anti-obesity [23], anti-allergic [24], anti-inflammatory [25] and antibiotic [26] properties. It is to be noted that the biochemical compounds of the caper are influenced by geographical and environmental conditions, by the harvesting period of the immature flower bud and its size, by storage methods, by genotype and by method of extraction and processing [12,27] as evidenced in other Mediterranean species of the same Country [28]. Phenolic and flavonoid compounds are amongst those bioactive compounds found in abundance in the various parts of the caper plant [29,30,31,32,33,34,35]. According to various authors [36], in particular, rutin is the most abundant phenolic compound in fresh berries, whereas quercetin (produced by the hydrolysis of rutin and which has not been found in fresh caper berries), is the most abundant phenolic compound in fermented berries. Recent studies [37,38,39] on quercetin have shown that this flavonoid would interfere with the SARS-COV-2 virus by reducing or eliminating the possibility of replication.
In addition to food and medicinal uses, the aesthetic properties of Capparis spinosa also make it popular as an ornamental plant for gardens, walls and terraces [40,41,42]. Furthermore, due to its xerophilic nature highly extensive root system, extremely high root/stem ratio and moderate water consumption [43,44], the caper is highly suited as a crop to regions with harsh climatic conditions, such as those in the Mediterranean area. The root system architecture and aerial biomass help limit erosion and protect the soil from high temperatures, even in the presence of extreme climate change, thus creating conditions suitable for microbiota and ensuring the agroecosystems are sustainable [10]. Therefore, it is a species of agronomic interest, able to reduce erosion and slow down the desertification process [45]. It is also widely used in re-forestation and re-naturalization in Sicily [46].
However, although contributing to a thriving market, innovation in caper cropping is low. Caper crop specialization is limited by the absence of improved cultivars and the lack of studies on the characterization and valorization of Sicilian caper germplasm. Current knowledge on Capparis spinosa does not allow us to define the characteristics of the genetic material being cultivated with any degree of certainty. Therefore, we cannot say that there are any caper cultivars. Individual plants used in production are frequently of uncertain origin, coming either from seedlings or from cuttings of plants harvested from the wild. They are often selected by farmers based on certain highly appreciated characteristics from within local populations [47].
The aim of the study was to evaluate agronomic and production behavior of seven biotypes of Capparis spinosa L. subsp. rupestris, identified on the Island of Linosa (Italy), over a four-year test period and to identify the most promising biotypes for cultivation.

2. Materials and Methods

2.1. Experimental Site, Cropping Techniques and Plant Material

The test was carried out over the four-year period 2005–2008, on the Island of Linosa, Sicily, Italy, (35°51′43″ N 12°52′37″ E: Google Earth) at a local farm located in the village Calcarella, between Monte Vulcano and Montagna Rossa, at an altitude of 32 m a.s.l. The test site lies on North–West facing rolling terrain. The soil is typic xerorthents; volcanic, shallow, loose and with scarce organic matter [48] and vegetation is synanthropic, typical of abandoned cropland on these soils (Euphorbia spp., Brassicaceae, etc.).
Prior to planting, biotypes identified in a previous study [49], classified as Capparis spinosa L. subsp. rupestris and marked with the abbreviation SCP1-7 (Table 1), underwent virological investigation for caper latent virus (CapLV) at the Rome Experimental Institute of Plant Pathology (Italy) in order to ensure only “healthy material” was used.
In December 2005, an experimental plot with a randomized block design with three replicates was created using the plants of the 7 biotypes under evaluation, with a planting spacing of 2.50 × 2.50 m. The photos of the experimental field and caper biotypes are presented in Supplementary Figures S1–S4.
Local cultivation practices were used for the planting: rooted cuttings were placed in holes 30 cm deep and 300 g of blond peat was placed at the bottom of each hole in order to increase soil water holding capacity.
Subsequently, 3 to 4 lava stones were placed around the plantlings to protect them from the wind and to limit water loss from evaporation (Figure 1).
During the first year of growth, five rescue irrigation were carried out in summer to encourage establishment of the young plantlings. Pruning was carried out at the end of each year during the autumn-winter period (November–December) by cutting branches to approximately 6–10 cm from the base (long pruning), (Figure 2). Crop care included manual weeding 5 times and hoeing 3 times.

2.2. Plant Measurement

During the first year (2006), 6 months after planting, production was considered negligible and no measurements were taken. In the two-year period (2007–2008), however, weekly measurements of the main phenological stages were carried out according to extended BBCH scale [50]: start of plant growth, flower bud formation, flowering, fruit formation and plant dormancy. Each phenological phase was identified when each parcel showed 70–80% of the plants in the considered phase. The following parameters were also determined for each caper biotype: flower bud fresh weight (FW); flower bud dry weight (DW); weight of 100 flower buds; percentage of flower bud dry matter; flower bud diameter (Figure S5); flower bud consistency (Figure S6); average length of primary branches; number of nodes per cm on primary branch; number of secondary branches on primary branch; number of flower buds per primary branch; number of flower buds per secondary branch. Data of all parameters showed normal distribution.
A penetrometer test (FT02, 0–1 kg) with a 2 mm ferrule was used to determine bud consistency; values are expressed in grams.

2.3. Statistical Analysis

All biometric and production parameter data were subjected to analysis of variance. The difference between means was carried out using the Tukey test.
In order to assess the correlation between the biometric and production parameters, Pearson’s correlation coefficient was calculated for each year, prior to standardization of data. By grouping the data from the two years, principal component analysis (PCA) was carried out to evaluate the relationship between the different characteristics and how the accessions behaved along the component axes. In addition, cluster analysis (UPGMA) was performed and shown graphically on the principal components plot. Before conducting principal component analysis (PCA) and cluster analysis (UPGMA), the data was standardized. Data analysis was performed using Minitab 19 software for Windows. Principal Component Analysis (PCA) score plots and cluster analysis (UPGMA) were performed with Past 4.03 software for Windows.

3. Results

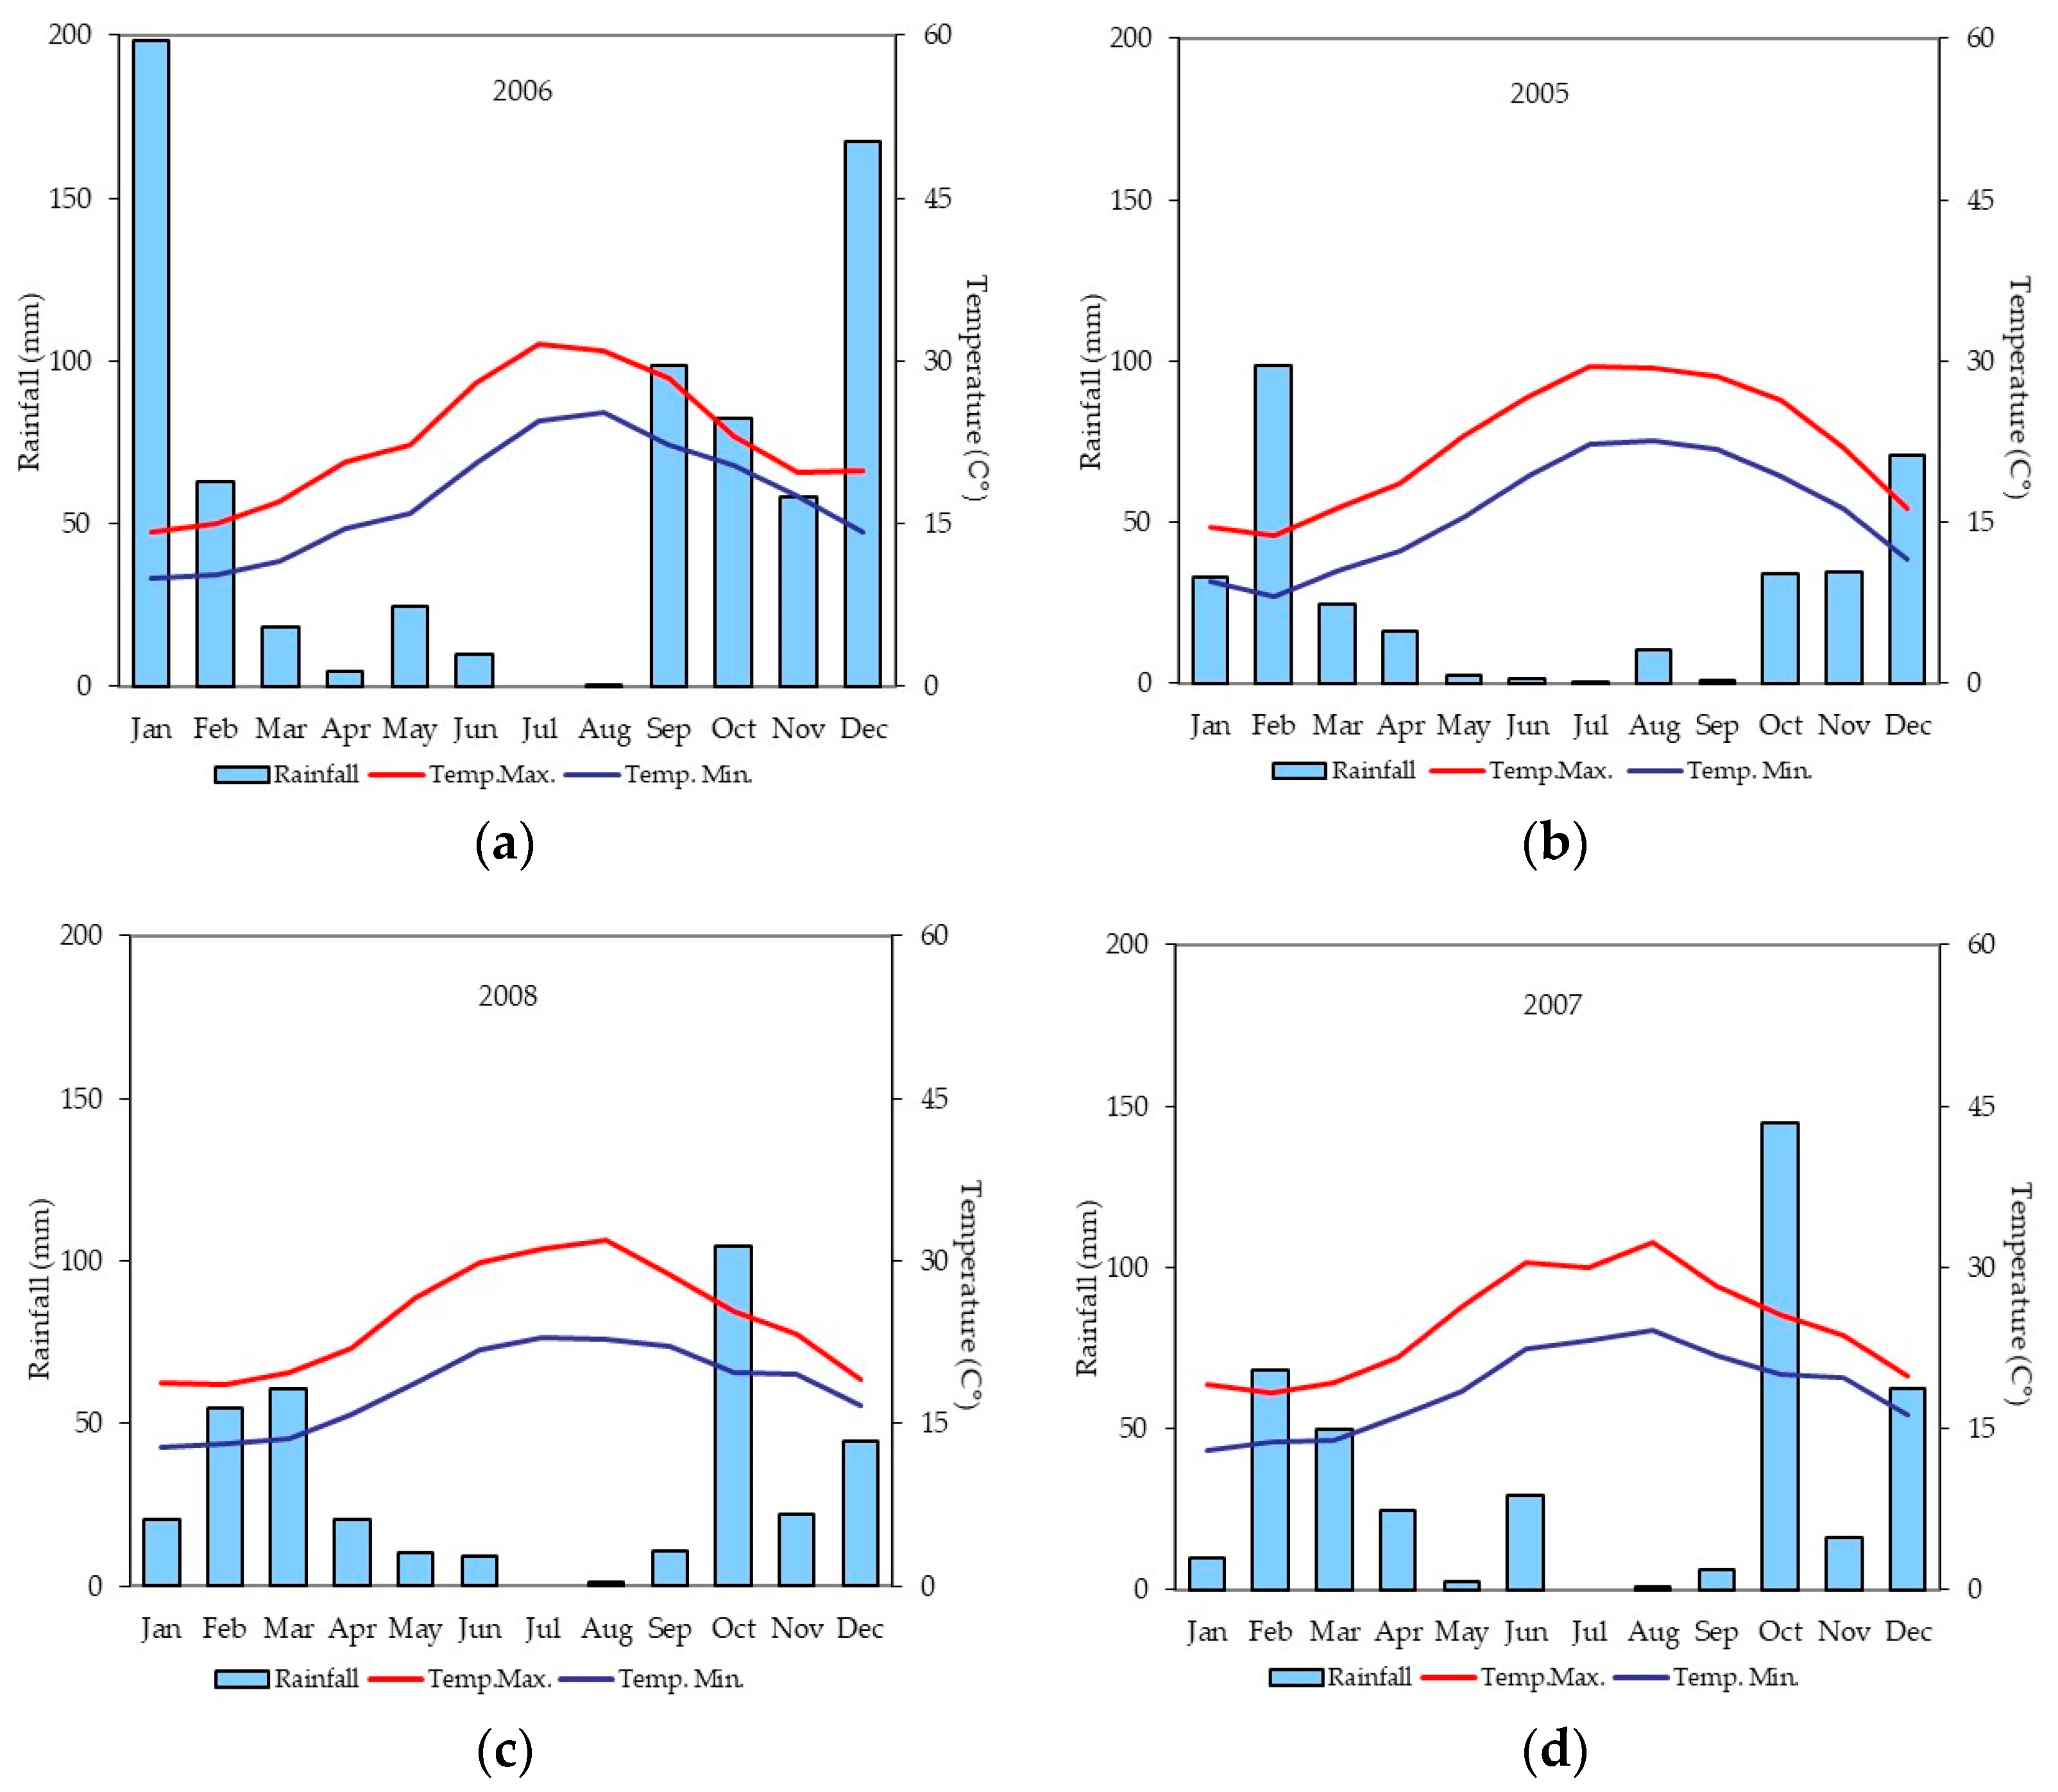
3.1. Analysis of Rainfall and Air Temperature Trends at the Test Site

Rainfall and air temperature trends during the test period are shown in Figure 3.
Rainfall levels during the 4 test years were not always typical of the test environment. In 2005, the year the caper plants were planted in the test field, precipitation depth was consistent with the test environment, whereas in 2006, it was high at 725 mm of rain. In 2007, when phenological and production measuring began, rainfall levels were approximately 100 mm greater than typical of the test environment (414.40 mm). In 2008, the final test year, rainfall was consistent with the test environment (359.00 mm). Rainfall events have always been concentrated mostly in January and in the months between September and December. Average minimum air temperatures (2005:15.80 °C—2006:17.30 °C—2007:18.60 °C—2008:18.60 °C) and average maximum air temperatures (2005:22.10 °C—2006:22.60 °C—2007:24.60 °C—2008:24.60 °C) were found to be consistent with the test environment.

3.2. Analysis of Biometric and Production Parameters

The biotype and year factors and biotype-by-year interaction determined significant differences for almost all parameters in the study. Differences found in parameters during the test years highlight the influence of plant age on biometric and production characteristics. Only for variables: weight of 100 flower buds, flower bud diameter, flower bud consistency, nodes/cm primary branch and ratio flower bud/secondary branches were no statistical differences found (Table 2).
During the test years, fresh weight, dry weight and flower bud dry matter were greater in 2008 despite the fact that rainfall was approximately 50 mm lower than in 2007. The same trend was found when evaluating the morphological characteristics, such as average length of primary branch, number of secondary branches/primary branch and number of flower buds/primary branch.
The highest average values of fresh and dry weight of flower bud were found, in accessions SCP2, SCP3, SCP4, SCP5 and SCP1 (FW: 1167.61–1031.89 g; DW: 220.83–160.70 g), while the lowest averages were recorded in SCP7 (FW:745.17 g; DW: 147.97 g) which were also distinguished by the greatest weight of 100 flower bud (Table 2). The percentage of bud dry weight varied from 19.84% (SCP7) to 14.23% (SCP4). The diameter of the largest flower bud (8 mm) was recorded in SCP5, SCP2 and SCP4, while that of the smallest flower bud (7 mm) was observed in SCP1, SCP7, SCP6 and SCP3. The highest flower bud consistency (957.47 g) was determined in SCP1, while the lowest (842.16 g) in SCP4.
As regards the biometric parameters of the caper accessions in the study, the greatest average length of the primary branch, the greatest number of nodes/cm of primary branch and the highest number of flower buds/primary branch ratio were observed in SCP2. SCP3, SCP5 and SCP4 had the highest number of secondary branches/primary branch ratio while SCP7, together with accessions SCP1 and SCP5 showed the lowest. The highest number of flower buds/secondary branch ratio (47.10) was recorded in SCP3 while the lowest in SCPI (15.13) and SCP7 (14.16) for which no significant differences were found.
The main results for production characteristics of the caper accessions (Table S1) in two year-study highlight that SCP2 and SCP5 obtained the best performance while SCP7 was the least productive accession. Evaluation of results for the first year of biometric and production characteristics showed that both flower bud fresh weight and flower bud dry weight were greater in SCP2 (FW: 533.76 g—DW: 97.07 g), whilst SCP7 was found to have lower flower bud fresh. SCP6 and SCP7 were found to have greater 100 flower bud weight, while SCP1 and SCP3 recorded the lowest in this weight. The greatest percentages for flower bud dry matter varied from 18.82% (SCP5 and SCP7) to 13.88% (SCP4), while while the flower bud diameter varied from 8.53 mm (SCP5) to 7.60 mm (SCP6). Greatest flower bud consistency was found in SCP1 (980.44 g), while the lighest consistency was found in SCP4 (840.40 g), SCP3 (851.08) and SCP5 (856.69).
The greatest average length of the primary branch and the greatest number of nodes/cm of primary branch were found in SCP2. The greatest number of secondary branches/primary branch was recorded in SCP5 and SCP3, while the lowest values for this ratio were found in SCP7. The greatest number of flower buds/primary branch was found in SCP2 while the lowest number in SCP5, SCP4, SCP6 and SCP3. The greatest number of flower buds/secondary branch was determined in SCP3 and SCP4 whilst the lowest in SCP7.
In the second year, the greatest fresh weight of flower buds were found in SCP2, SCP4, SCP5, SCP3 and SCP1 while the lowest in SCP7. The greatest dry weight of flower buds were found in SCP2 and SCP5 while the lowest in SCP7.
By analyzing the results of the accession for each year, no variations were found either in the 100-flower bud weight or the flower bud dry matter %. Furthermore, the order of the accession classification remained unchanged for both of the parameters. The same trend was found for both of the parameters flower bud diameter and flower bud consistency. It is worth noting that, in 2008, the results were slightly lower above all regarding flower-bud diameter, and greater uniformity in characteristics was found between accessions. Flower bud diameter ranged, in 2008, between 8.44 mm (SCP5) and 7.39 mm (SCP1), and flower bud consistency ranged between 970.51 g (SCP1) and 843.92 g (SCP4). Accession SCP2 demonstrated the greatest production of longer primary branches, in the same way that SCP7, SCP4 and SCP5 produced the highest number of shorter primary branches.
The number of nodes cm−1 on the primary branch was again greater in SCP2, whilst the lower numbers were found in SCP7, SCP4, SCP6 and SCP3.
The number of secondary branches on the primary branch was greater in SCP3, SCP4, SCP5 and SCP6, whilst in the remaining accession, values were approximately one third of the former: SCP1, SCP2 and SCP7.
The greatest number of flower buds/primary branch was found in SCP2 followed by SCP1 and SCP7.
A similar trend as the previous year was also found for the number of flower buds/secondary branches, with the greatest number of buds found for accession SCP3, whilst accessions SCP1 and SCP7 developed the fewest flower buds/secondary branches.

3.3. Correlation Matrix
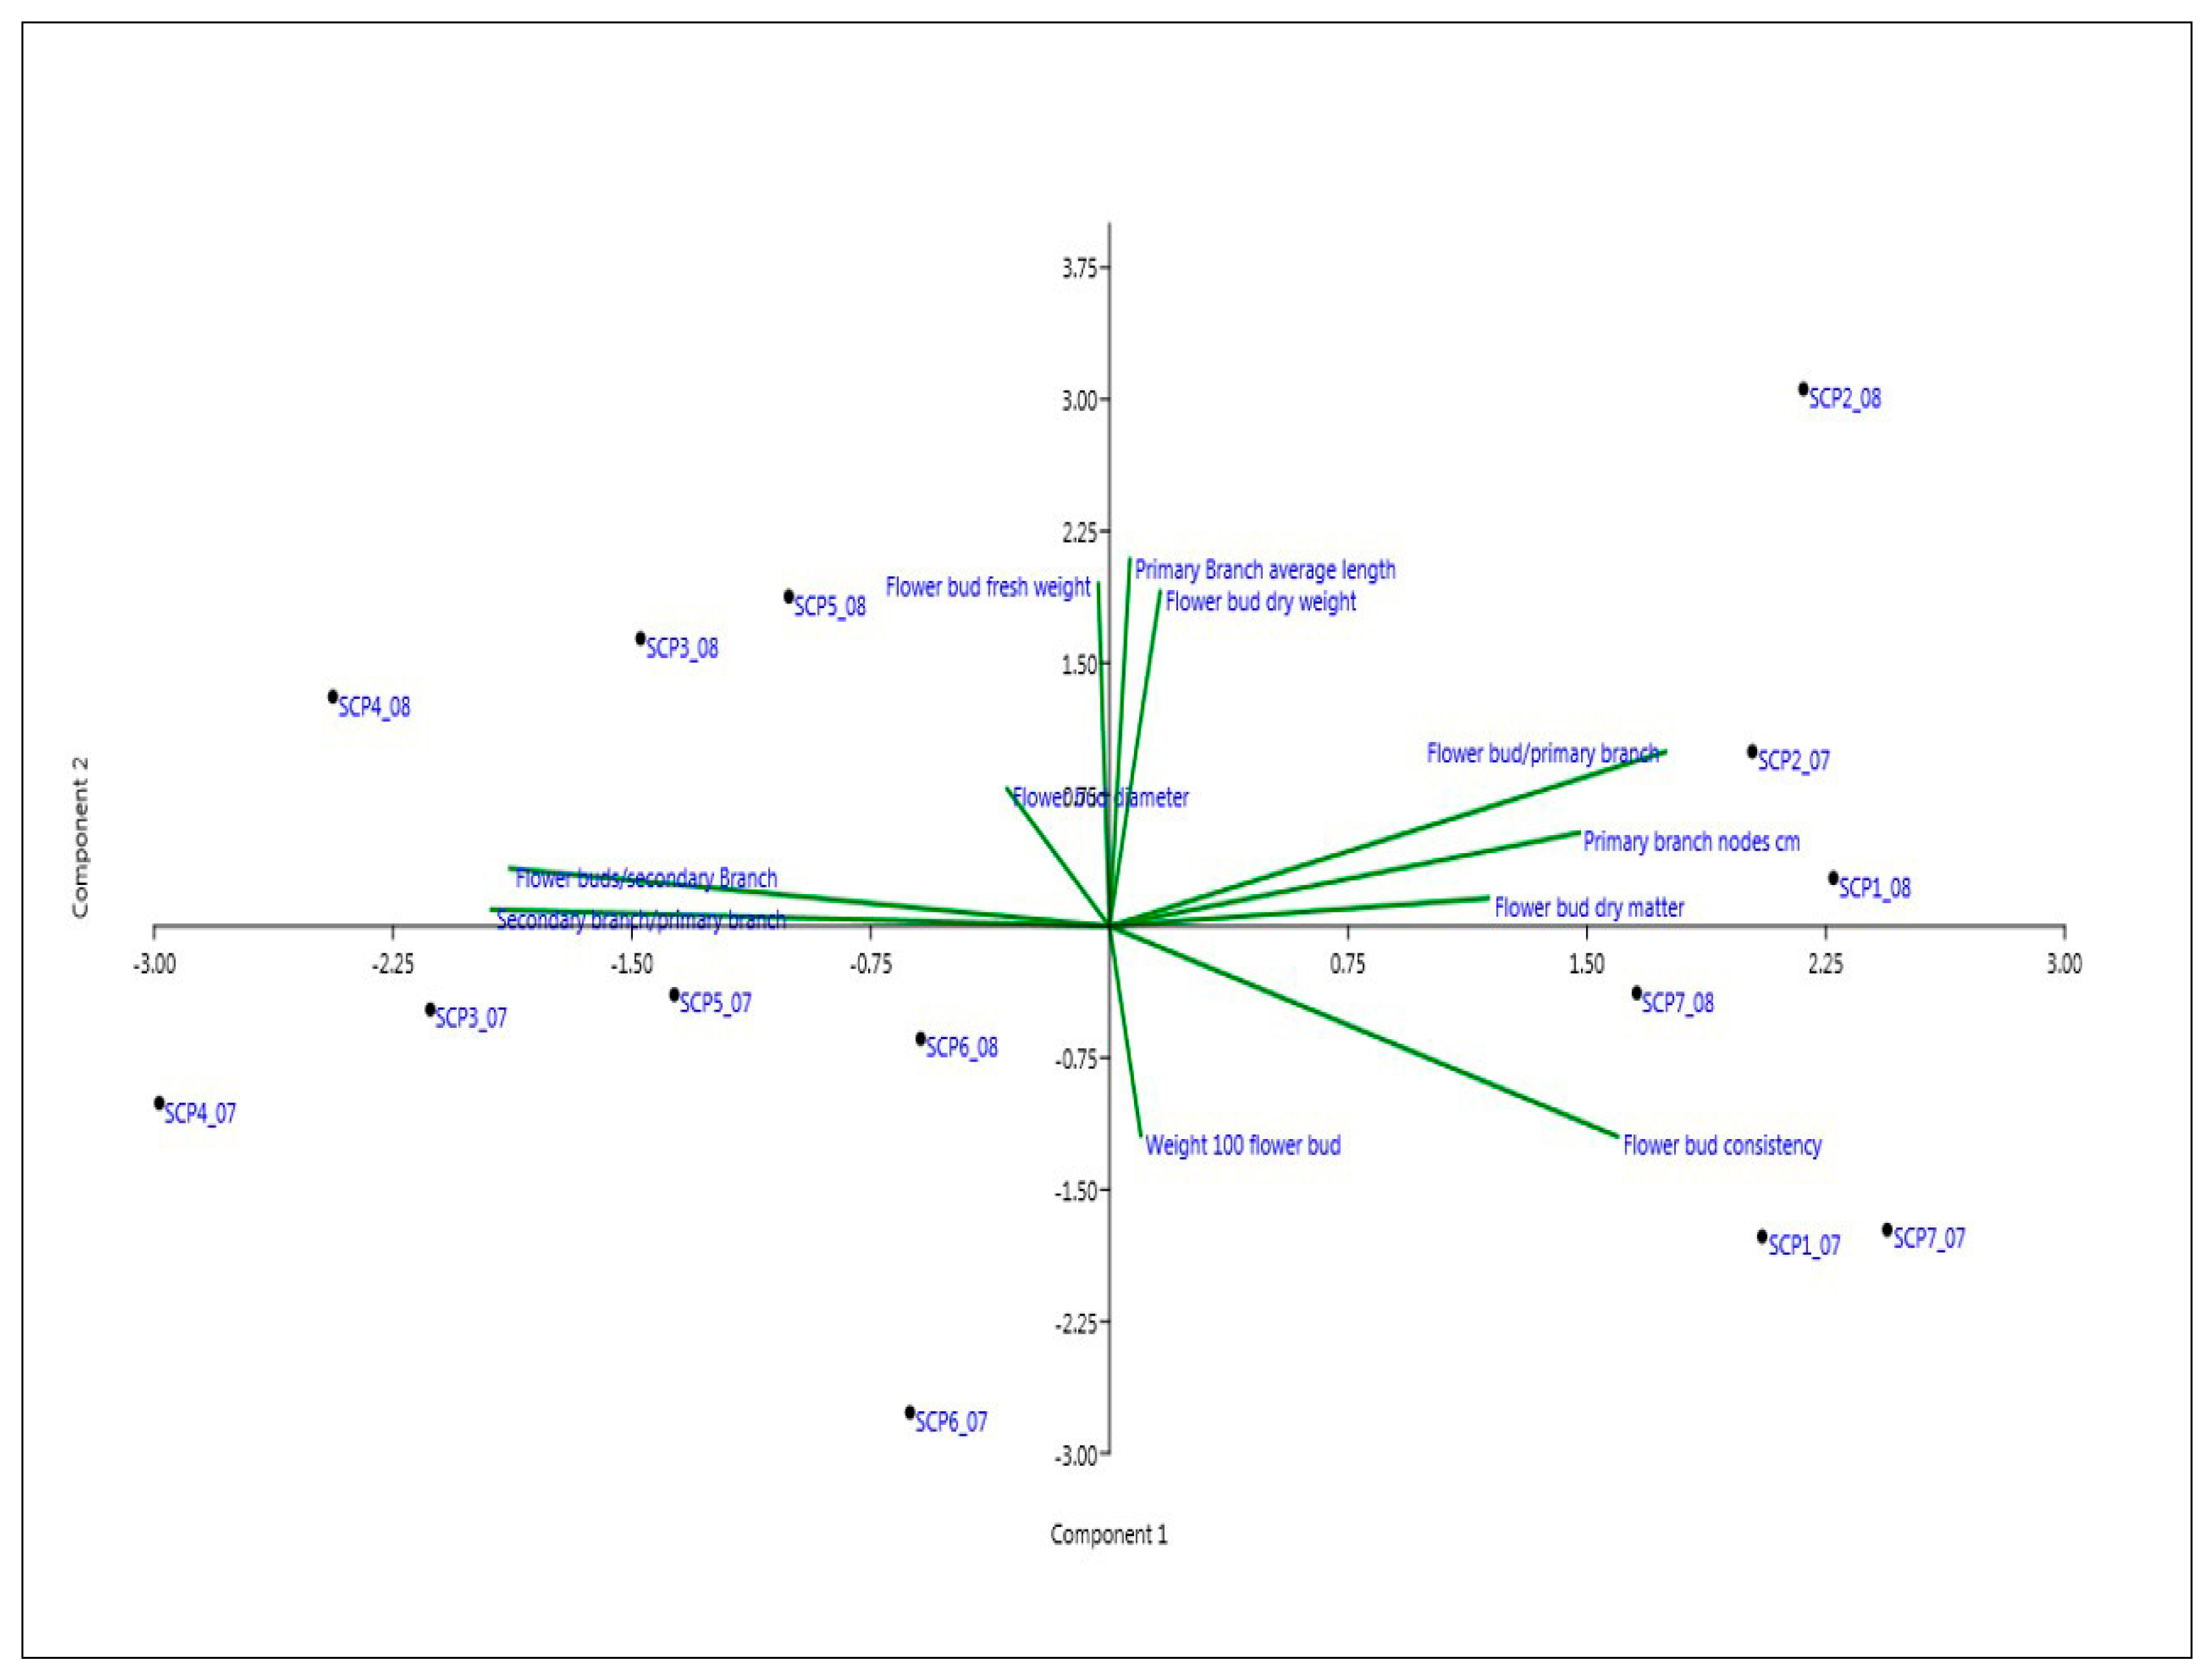
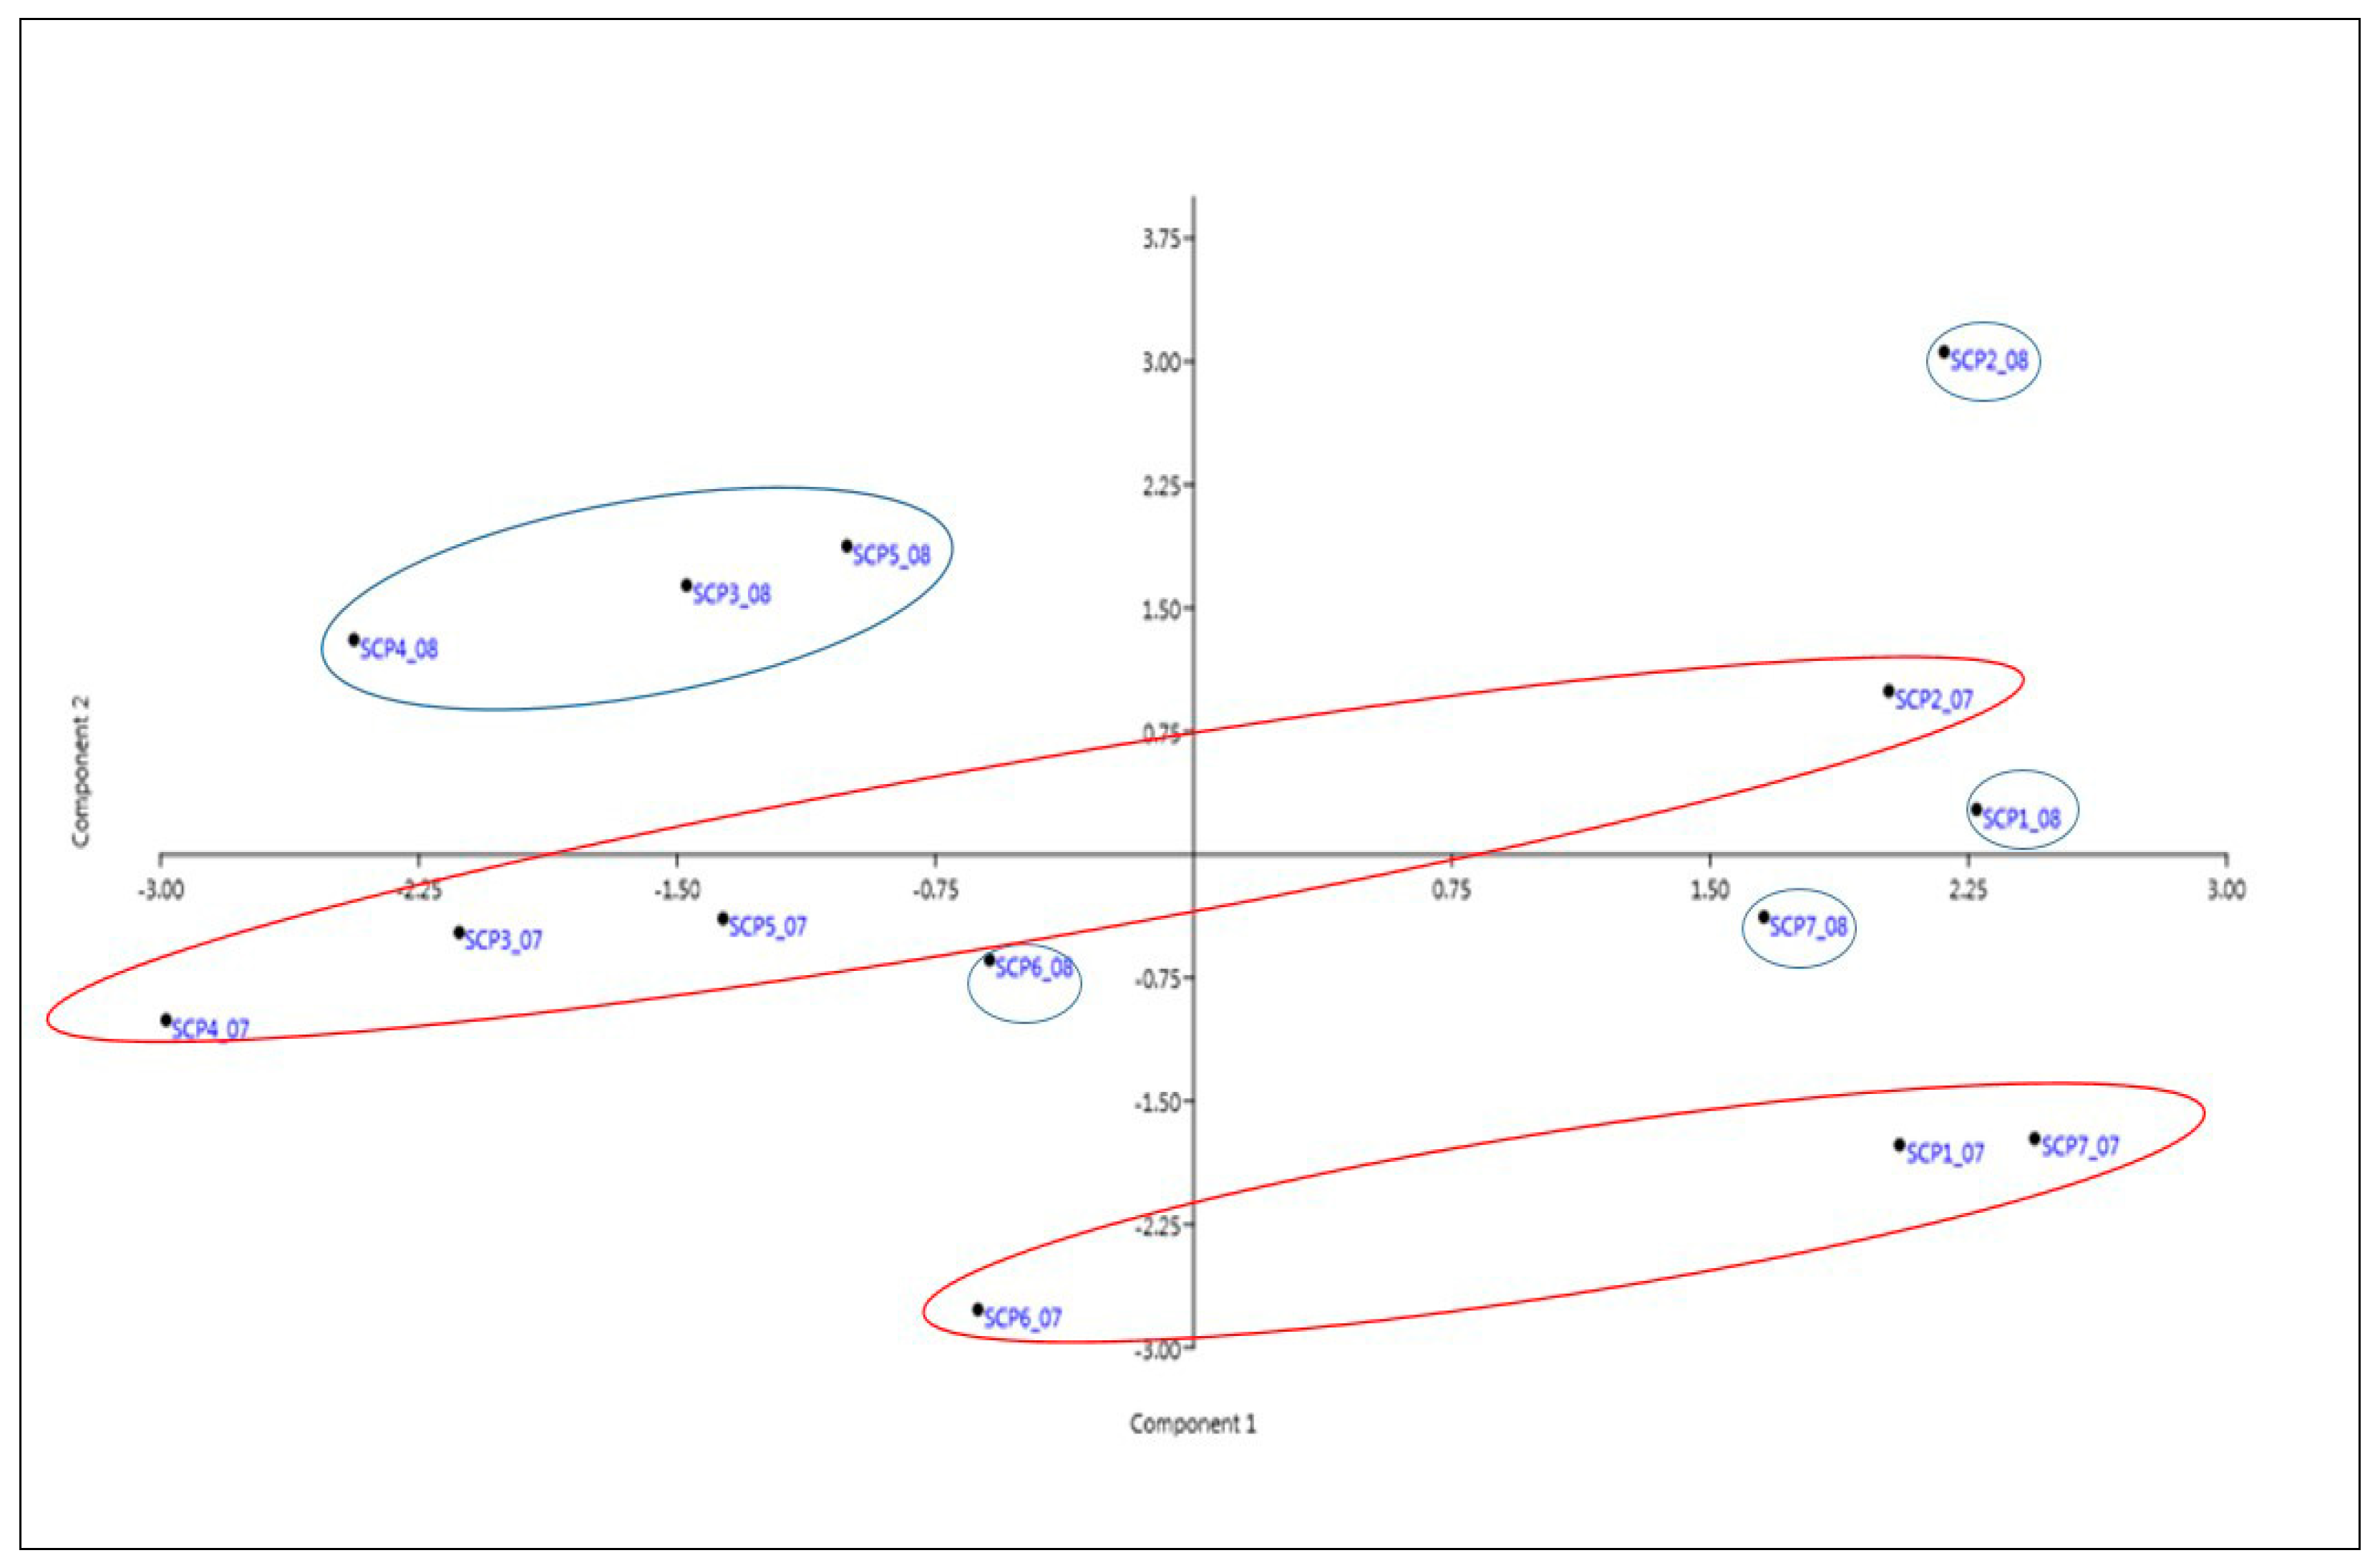
Table 3 shows correlations between the various morphological and production parameters divided by year.
Many correlations were founds between the characteristics observed, albeit only a few were considered significant (p < 0.05; p < 0.01) and sometimes divergent.
In particular, worthy of note is the fact that the relationship between the fresh weight of the flower buds per plant (FWFB/P) and the dry weight of the flower buds per plant (DWFB/P) was found to be positive and significant only in 2007, whilst it remained medium high (r = 0.70) in 2008. Furthermore, in 2008, the parameter fresh weight of the flower buds per plant (FWFB/P), showed a significant but negative correlation with 100-flower bud weight (W100FB) whilst, in 2007, these two parameters were found to be always negatively correlated, but medium-high in value (r = −0.61).
The relationship between the number of nodes/primary branch (PBN) and the dry matter % of the flower buds (FBDM) was significant and positive for 2007 but somewhat absent (r = 0.16) in 2008. The same relationship was found, albeit with a stronger relationship (r = 0.66) in 2008 regarding the number of flower buds/primary branch (FBPB) and the number of nodes/primary branch (PBN). In contrast, the positive correlation between the number of flower buds/secondary branch (FBSB) and the number of secondary branches/primary branch (SBPB) was considered highly significant for both years.
All of the negative and significant correlations number of flower bud/secondary branches (FBSB) and flower bud consistency (FBC); number of secondary branches/primary branch (SBPB) and number of nodes/primary branch (PBN); number of flower buds/secondary branches (FBSB) and number of nodes/cm/primary branch (PBN); number of flower buds/primary branch (FBPB) ad number of secondary branches/primary branch (SBPB); number of flower buds/secondary branches (FBSB) and number of flower buds/primary branch (FBPB), found in 2007 corresponded to those found in 2008, with the exception of number of secondary branches/primary branch (SBPB) and number of nodes/primary branch (PBN), and of number of flower buds/secondary branches (FBSB) and number of nodes/primary branch (PBN), which were negligible in 2008.

3.4. PCA Analysis

PCA analysis, carried out not only to assess relationships between the variables and their importance, but also to reveal the behavior of the accessions along the component axes, showed that the 3 principal components accounted for over 77.00 % of total variability (Table 4).
For analytical purposes, however, only the first three were considered to be of interest.
In Table 5, it is clear that the largest principal component (PC1), at 36.44%, is strongly correlated with as many as 6 out of 11 characteristics.
In particular, it is positively correlated with the percentage of flower bud dry matter, flower bud consistency, number of nodes/cm on primary branch and number of flower buds/primary branch, and negatively correlated with the number of secondary branches/primary branch and the number of flower buds/secondary branches.
The second component, which accounts for 23.82% of the total variance, is positively linked to the flower bud fresh weight/plant, flower bud dry weight/plant and the number of primary branch average length and negatively to the 100-flower bud weight.
The third component explains a lower percentage of variance (17.04%) compared to PC1 and PC2 and is negatively correlated with the flower bud diameter however, it was able to separate the accessions more distinctly compared to the second component, confirming the diversity of the accessions.
Figure 4 shows a loading plot of factor weights relating to the two main principal components.
Statistical data can be extracted from Figure 4 and Figure 5, which projects the distribution of the accessions on the plot for the two principal components.
Representation on the plots of relationships between the accessions showed a relatively wide variability. Cluster analysis lead to the identification of two main groups; the first group containing all of the accessions grown in 2007 (shown in red) and all those grown in 2008 in the second group (shown in blue) (Figure 5).
The first main group (2007) can be subdivided into two further subgroups, one which encompasses 4 accessions (SCP2, SCP5, SCP4, SCP3) and the other 3 accessions (SCP7, SCP1 SCP6). The second main group (2008) is formed by 5 subgroups. With the exception of one of these subgroups, which includes 3 accessions (SCP4, SCP5, SCP3), each of the other subgroups is formed by one accession only (SCP1, SCP2, SCP6, SCP7).
Apart from the conformity in behavior shown by the species in both years and made clear by the cluster analysis which formed two macro-groups, a number of subgroups also emerged based on expressions of the most significant morphological and production characteristics.
Accessions SCP2 and SCP1 from 2008, each of which form a group on their own, located in the top right quadrant, showed the best characteristics associated with PC1 and PC2 (Figure 4). It is worth noting, however, that for SCP1 (2008), component 2 had little weight whilst PC3 assumed greater significance (Supplementary Figure S7). Accession SCP1(2008) can be considered a good compromise of all the characteristics being examined, as it performed well regarding production and produced the best the biometric and quality parameters like SCP2 (2008), which performed the best for all of the characteristics. However, SCP2 (2008) differed from SCP1 (2008) as it produced larger flower buds. SCP2 (2008), in fact, is located in the lower right quadrant, as can be seen on the plot between component 1 and 3, similar to SCP2 in 2007 (Supplementary Figure S7).
SCP2 (2007) is located in this same quadrant (lower right). Although it presented characteristics favorably linked to PC1 and PC2 (Figure 5), unlike accessions SCP3, SCP4 and SCP5 (lower left quadrant), with which it shares a subgroup, all of the accessions are defined by PC3 (Supplementary Figure S7). The abovementioned accessions are located in the quadrants along which PC3 assumes a negative value and, as component 3 is negatively correlated to flower bud diameter, all the accessions produced larger flower buds (Supplementary Figure S7).
The second subgroup (2007) included 2 of the 3 accessions (SCP1, SCP7) associated with those parameters with greatest values for component 1, unlike the other accession SCP6, which is located to the left of the origin. All 3 accessions, however, are located in quadrants with negative values for PC2 (Figure 5). Regarding the characteristic linked to PC3, the 3 accessions (SCP1, SCP6, SCP7), as they are positioned close to the origin, they all have medium-sized buds. Furthermore, it is important to highlight that SCP6 produced the smallest flower buds of the 3 accessions, as located in the top left quadrant, whilst the other 2 accessions are located in the lower right quadrant (Supplementary Figure S7).
In addition, the flower buds produced by the accessions in the third subgroup (SCP3, SCP4, SCP5) in the main 2008 cluster are near in size to the buds of accession SCP6 in 2007 (Supplementary Figure S7). However, the abovementioned accessions are positively characterized by characteristics linked to PC2 and negatively for the parameters linked to PC1 (Figure 5) SCP6 and SCP7, each of which form a subgroup on their own in the main 2008 cluster, although having certain production characteristics which are similar, differ regarding the biometric characteristics linked to PC1 and PC3. In particular, SCP6 had a lighter flower bud consistency, shorter average primary branch length, lower number of flower buds/primary branch and a smaller flower bud diameter compared to SCP7.

3.5. Phenology

Table 6 shows average days, in the two test years, for the four phenological stages considered.
Statistically significant differences regarding number of days (for the phenological stages in consideration and in the two test years) were found for all the parameters under study.
Accessions (Table 7) presented statistically significant differences for all phenological stages measured.
The duration of plant dormancy in particular was greater in accession SCP4 (98.50 days), whilst shorter in accession SCP2 (80.0 days) by 18 days.
Plant growth stage (297.02 days), flower bud emergence (233.02 days) and fruiting (181.51 days) were also longer in accession SCP2. Plant growth stage was shortest in accession SCP7 (258.01 days); this accession also recorded the shortest fruiting stage (165.52 days). However, shortest flower bud emergence stage was shortest for SCP6 (208.02).
In Figure 6, the flower and flower bud of the species are shown.

4. Discussion

Increased demand for buds and caper fruits has prompted farmers to switch from wild plant harvesting to specialized crops of caper plants [51]. Of fundamental importance for the creation of new caper plants is undoubtedly the genetic material used for propagation purposes. Therefore, the identification of biotypes in the wild and characterized by high agronomic performance, which can be recommended to farmers or included in genetic improvement programs, is considered an excellent strategy [52,53,54] Previous studies carried out by Barbera [47] have led to specific characteristics to be identified which are deemed of interest in crop development; for example, high productivity, long stems, short internodes and high node fertility, spherical, dark green buds with closely-placed, non-pubescent and late opening bracts, oval fruits with a light green pericarp and few seeds, absence of stipular spines, easy separation of stems to simplify harvesting and post-harvest operations, suitability for agamic reproduction and resistance to biotic and abiotic stresses. Bud consistency is, without doubt, extremely important in the definition of quality. Amongst those characteristics most sought-after is the diameter. The Boletín Oficial del Estado [55] distinguishes seven classes of increasing diameter, from the smallest of 7 mm to the greatest of 13 mm, highlighting the fact that those most highly appreciated by consumers are actually smaller than 7 mm.
The characterization of the germplasm on the island of Linosa led to the evaluation of 7 biotypes with at least one characteristic not in common, previously identified on the island by Tuttolomondo et al. [49]. Biotypes included in the agronomic evaluation belong to the species C. spinosa subsp. rupestris (Sm) Nyman which exhibits a narrower range than species C. spinosa subsp. spinosa and is found in areas of the Mediterranean and North Africa [56]. It is a spineless chamaephyte with few or no ramifications of the primary branches and with uniform morphological traits [57].
Rainfall trends in the four test years were consistent with the test environment except for rainfall depth in 2006. Such high levels (725 mm) undoubtedly contributed to the successful establishment of the caper field and no failures were recorded (data not shown).
Production data collected in the two-year period 2007–2008 showed the greatest production levels in the fourth year following planting in 2005. This behavior is consistent with the characteristics of the species. The caper plant begins production, although in insignificant quantities, in the first year of planting. Full production is recorded as of the fourth year and can reach an average yield of 4–5 kg plant−1 and over. This level of production is thought to last up to 35–40 years and to be influenced not only by biotype, age and cropping techniques (fertilizing, irrigation, etc.) but also by the growth environment [10,47]. In our case, production in the year following planting was considered negligible and no measurements were taken.
In our study, in fact, already from 2008, all biotypes showed a significant increase in yields corresponding to approximately three/four times those recorded in 2007. A comparison of the test accessions showed that all seven biotypes differed significantly for all biometric and production parameters. More specifically, in both years, biotype SCP2 demonstrated greater production characteristics, both in terms of greater flower bud fresh weight and dry weight and in morphometric terms. Furthermore, a greater number of flower buds on the main branches were recorded for SCP2, in accordance with previous studies [12,58] which found that a longer primary branch determined a greater number of nodes, allowing greater differentiation of flower buds and, therefore, increased productivity. Aytac et al. [58] demonstrates how the length of the primary branches of caper plants increases by increasing the slope of the caper crop field.
In our study, conducted on a flat field, the length of the primary branches in the test accessions, both during the first and second year of the test, was considerably longer than the length obtained under similar environmental conditions but in older caper plants and using different agronomic management by Tuttolomondo et al. [49]. These differences are presumably due to genetic and non-environmental factors.
In 2008, yields expressed in grams of flower buds per plant, obtained from the remaining accessions are consistent with previous tests conducted by Barbera et al. [59]. Yields in these tests, albeit under different agronomic conditions and in different environments, ranged from 1 to 1.5 kg plant−1 (Island of Pantelleria) and from 2 to 3 kg plant−1 (Island of Salina). Biotype SCP2 also obtained the lowest number of secondary branches and relative flower buds. This characteristic is valued by farmers as it is seen to facilitate harvesting operations with lower production costs, as reported by Barbera [46]. Regarding flower bud size, a valuable characteristic from a commercial point of view (the smaller they are, the more they are valued), previous studies conducted by Aytac et al. [56] showed how a harvest interval of 5 days was found to produce the highest number of flower buds with a diameter of less than 7 mm—a diameter highly valued on a commercial level [53]—highlighting how reducing harvest intervals determines smaller flower buds. In our study, the smallest size of flower buds with a harvest interval of 8 days was found for accession SCP1 with 7.57 mm and SCP6 with 7.58 mm.
Another useful element in defining the quality of buds and valued by consumers is the consistency. This was measured using a penetrometer. Biotype SCP1 obtained the best result at 975.47 g; A difference of a little over 100 g from the least substantial in consistency (SCP4). Consistency determination, not previously noted by other authors, allowed caper bud quality indexes to be expanded. This characteristic has been studied for other species and is considered strategic as it seems that consumers are more sensitive to differences in consistency than in taste [60]. The measurement of fruit consistency using a penetrometer has long been used in apricots, peaches nectarines, peaches and plums as an index of ripeness [61]. The use of penetrometric analysis in order to identify best bud and caper fruit consistency not only adds value to the product in terms of consumer demand, but also helps innovate mechanical processing and develop the caper supply chain. In order to facilitate the design of machines to be used in the marketing of caper fruits, Lorestani [17] studied the physical and chemical characteristics of unripe buds and caper fruits through elasticity testing (Young Modulus) and the ZwickRoell universal testine machine.
Phenological analysis allowed biotypes to be differentiated according to the duration of the single phenological stage. Shorter plant dormancy and longer plant growth, and, therefore, longer flower bud emission and fruiting stage (which presumably contributed to the increased yield) was found for biotype SCP2. An earlier production stage inevitably led to better use of soil water resources, built up during the autumn-winter period. It is during this period that greatest rainfall levels were recorded for both years, thereby creating an agronomic benefit for the crop. The length of the phenological stages observed were consistent for all of the accessions in the test with those found in previous studies carried out in Sicily by Fici [3]. On average, all of the biotypes began growth stage during March and began to emit flower buds during April right up until November, when the biotypes stopped growth. The phenological trends of the various accessions is a further factor for accession characterization and is of great interest for the species and for cropping technique development. Furthermore, studies carried out by Melgarejo et al. [62] show that phenological behavior is fundamental for the improvement of cropping techniques of this species as various edible parts are included in the term ‘yield’, (flower buds, young sprouts and fruits) spanning over the entire annual growth cycle.
Characterization of biometric and production parameters (based on statistical methods such as correlation matrix, PCA, and cluster analysis) is the first step towards successful description and understanding of the variability of caper biotypes. It is well known that biometric and production parameters are strongly influenced by genetic and environmental factors [63]. Morphological and production variations found in plant populations can demonstrate adaptation strategies to various selection pressures from phenotypic plasticity or genetic differentiation due to natural selection or other evolutionary forces [64]. PCA and cluster analyses showed a clear distinction between biotypes based on biometric and production characteristics.

5. Conclusions

Agronomic characteristics linked to drought-resistance and tolerance to high temperatures together with the use of accessions with good production results, makes this species a good candidate for use in marginal lands from an environmental point of view. These lands are increasingly more fragile due to climate change, which has caused not only a reduction in rainfall levels but also anomalous intensity and irregular distribution.
The results of this study contribute to further knowledge on caper germplasm found on the Island of Linosa. The biotypes which were analyzed showed good adaptability of the test environment and good yield results. Although the best results in terms of flower buds, length of primary branch, number of nodes/primary branch and precocity were obtained with biotype SCP2, it is also worth noting that results for biotypes SCP1 and SCP5 were also satisfactory. Regarding quality parameters, such as average flower bud diameter and consistency, the best results for both years were obtained with SCP1.
This first 4 years of tests on caper germplasm characterization is the first test in the Mediterranean area to focus on the identification of accessions of interest for the introduction of innovation into new caper fields. This work can contribute to ex situ conservation of the species, since the best biotypes can be propagated and grown.
Further research is needed, however, in order to characterize caper accessions in terms of the chemical composition of the flower buds, fruits and other parts of the plant with application in the food, cosmetics, pharmaceutical and medicinal sectors.

Supplementary Materials

The following are available online at https://0-www-mdpi-com.brum.beds.ac.uk/article/10.3390/agriculture11040327/s1, Figure S1: A view of the experimental field. Figure S2: Caper plantlings after 5 months from the transplanting in open field. Figure S3: Flowering stage of caper biotypes. Figure S4: Growth stage of caper plants. Figure S5: Determination of flower bud diameter. Figure S6: Determination of flower bud consistency using a penetrometer. Figure S7: PC3. Table S1: Average values of the biometric and pro-duction parameters of accessions of Capparis spinosa subs. rupestris in 2007 and 2008.

Author Contributions

Conceptualization, S.L.B. and F.R.; methodology, S.L.B. and F.R.; software, N.I. and G.V.; validation, M.L. and C.L.; formal analysis, N.I., R.R. and T.T.; investigation, M.L., G.V. and R.R.; resources, S.L.B., F.R. and T.T.; data curation, M.L., G.V., R.R. and N.I.; writing—original draft preparation, S.L.B., F.R., N.I. and T.T.; writing—review and editing, M.L. and G.V.; visualization, R.R. and C.L.; supervision, S.L.B. and F.R.; project administration, C.L.; funding acquisition, C.L. All authors have read and agreed to the published version of the manuscript.

Funding

This research was funded by the Sicilian Regional Ministry of Agriculture and Forestry (Italy), grant number: DDS N. 509/2005.

Institutional Review Board Statement

Not applicable.

Informed Consent Statement

Not applicable.

Data Availability Statement

Data are available by contacting the authors.

Acknowledgments

The authors would like to thank the Sicilian Regional Ministry of Agriculture and Forestry, funding the “Characterization, genetic breeding and safeguard of capper plant (Capparis spinosa L.) of minor islands of Sicily”, research project. Special thanks go to Lucie Branwen Hornsby for her linguistic assistance.

Conflicts of Interest

The authors declare no conflict of interest. The funders had no role in the design of the study; in the collection, analyses, or interpretation of data; in the writing of the manuscript, or in the decision to publish the results.

References

  1. Hall, J.C.; Sytsma, K.J.; Iltis, H.H. Phylogeny of Capparaceae and Brassicaceae based on chloroplast sequence data. Am. J. Bot. 2002, 89, 1826–1842. [Google Scholar] [CrossRef]
  2. Jacobs, M. The genus Capparis (Capparaceae) from the Indus to the Pacific. Blumea 1965, 12, 385–541. [Google Scholar]
  3. Fici, S. Intraspecific variation and evolutionary trends in Capparis spinosa L. (Capparaceae). Plant Syst. Evol. 2001, 228, 123–141. [Google Scholar] [CrossRef]
  4. Sozzi, O.G. Caper bush: Botany and horticulture. Hortic. Rev. 2001, 27, 125–188. [Google Scholar]
  5. Rivera, D.; Inocencio, C.; Obón, C.; Alcaraz, F. Review of food and medicinal uses of Capparis L. subgenus Capparis (Capparidaceae). Econ. Bot. 2003, 57, 515–534. [Google Scholar] [CrossRef]
  6. Bhoyar, M.S.; Mishra, P.G.; Naik, K.P.; Murkute, A.A.; Srivastavar, B.R. Genetic variability studies among natural populations of Capparis spinosa from cold arid desert of trans-Himalayas using DNA markers. Natl. Acad. Sci. Lett. 2012, 35, 505–515. [Google Scholar] [CrossRef]
  7. Tlili, N.; El-Fallah, W.; Saadadoui, E.; Khaldi, A.H.; Triki, S.; Nasri, N. The caper (Capparis L.): Ethnopharmacology, phyto-chemical and pharmacological properties. Fitoterapia 2011, 82, 93–101. [Google Scholar] [CrossRef] [PubMed]
  8. Heywood, V.H. Capparis L. In Flora Europaea; Tutin, T.G., Heywood, V.H., Burges, N., Valentine, D.H., Walters, S.M., Webb, D.A., Eds.; Cambridge University Press: Cambridge, UK, 1993; p. 312. [Google Scholar]
  9. Gristina, A.S.; Fici, S.; Siragusa, M.; Fontana, I.; Garfì, G.; Carimi, F. Hybridization in Capparis spinosa L.: Molecular and morphological evidence from a Mediterranean island complex. Flora Morphol. Distrib. Funct. Ecol. Plants 2014, 209, 733–741. [Google Scholar] [CrossRef]
  10. Chedraoui, S.; Abi-Rizk, A.; El-Beyrouthy, M.; Chalak, L.; Ouaini, N.; Rajjou, L. Capparis spinosa L. in a systematic review: A xerophilous species of multi values and promising potentialities for agrosystems under the threat of global warming. Front. Plant Sci. 2017, 8, 1845. [Google Scholar] [CrossRef] [Green Version]
  11. Saadaoui, E.; Khaldi, A.; Khouja, M.L.; Mohamed, E.G. Intraspecific variation of Capparis spinosa L. in Tunisia. J. Herbs Spices Med. Plants 2009, 15, 9–15. [Google Scholar] [CrossRef]
  12. Sozzi, O.G.; Vicente, A.R. Capers and caperberries. In Handbook of Herbs and Spices; Peter, K.V., Ed.; Woodhead Publishing Limited and CRC Press: Boca Raton, FL, USA, 2006; pp. 230–256. [Google Scholar]
  13. Aliyazicioglu, R.; Tosun, G.; Eyupoglu, E. Characterisation of volatile compounds by spme and gc-fid/ms of capers (Capparis spinosa L.). Afr. J. Agric. Res. 2015, 10, 2213–2217. [Google Scholar]
  14. Legua, P.; Martínez, J.; Melgarejo, P.; Hernández, F. Phenological growth stages of caper plant (Capparis spinosa L.) according to the Biologische Bundesanstalt, Bundessortenamt and CHemical scale. Ann. Appl. Biol. 2013, 163, 135–141. [Google Scholar] [CrossRef]
  15. Romeo, V.; Ziino, M.; Giuffrida, D.; Condurso, C.; Verzera, A. Flavor profile of Capers (Capparis spinosa L.) from the Eolian Archipelago by HS-SPME/GC-MS. Food Chem. 2007, 101, 1272–1278. [Google Scholar] [CrossRef]
  16. Barbera, G. Il Cappero; Edagricole: Bologna, Italy, 1993. [Google Scholar]
  17. Lorestani, A.N. Some physical and mechanical properties of caper. J. Agric. Technol. 2012, 8, 1199–1206. [Google Scholar]
  18. Tuttolomondo, T.; Licata, M.; Leto, C.; Gargano, M.L.; Venturella, G.; La Bella, S. Plant genetic resources and traditional knowledge on medicinal use of wild shrub and herbaceous plant species in the Etna Regional Park (Eastern Sicily, Italy). J. Ethnopharmacol. 2014, 155, 1362–1381. [Google Scholar] [CrossRef] [PubMed]
  19. Ali, Z.N.; Eddouks, M.; Michel, J.B.; Sulpice, T.; Hajji, L. Cardiovascular effect of capparis spinosa aqueous extract. Part III: Antihypertensive effect in spontaneously hypertensive rats. Am. J. Pharmacol. Toxicol. 2007, 2, 111–115. [Google Scholar] [CrossRef]
  20. Gadgoli, C.; Mishra, S.H. Antihepatotoxic activity of p-methoxy benzoic acid from Capparis spinosa. J. Ethnopharmacol. 1999, 66, 187–192. [Google Scholar] [CrossRef]
  21. Kazemian, M.; Abad, M.; Haeri, M.R.; Ebrahimi, M.; Heidari, R. Anti-diabetic effect of Capparis spinosa L. root extract in diabetic rats. Avicenna J. Phytomed. 2015, 5, 325–332. [Google Scholar]
  22. Mollica, A.; Zengin, G.; Locatelli, M.; Stefanucci, A.; Mocan, A.; Macedonio, G.; Carradori, S.; Onaolapo, O.; Onaolapo, A.; Adegoke, J.; et al. Anti-diabetic and anti-hyperlipidemic properties of Capparis spinosa L.: In vivo and in vitro evaluation of its nutraceutical potential. J. Funct. Foods 2017, 35, 32–42. [Google Scholar] [CrossRef]
  23. Lemhadri, A.; Eddouks, M.; Sulpice, T.; Burcelin, R. Anti-hyperglycaemic and anti-obesity effects of Capparis spinosa and Chamaemelum nobile aqueous extracts in HFD mice. Am. J. Pharmacol. Toxicol. 2007, 2, 106–110. [Google Scholar] [CrossRef] [Green Version]
  24. Trombetta, D.; Occhiuto, F.; Perri, D.; Puglia, C.; Santagati, N.A.; Pasquale, A.D.; Saija, A.; Bonina, F. Antiallergic and anti-histaminic effect of two extracts of Capparis spinosa L. flowering buds. Phytother. Res. 2005, 19, 29–33. [Google Scholar] [CrossRef] [PubMed]
  25. Zhou, H.; Jian, R.; Kang, J.; Huang, X.; Li, Y.; Zhuang, C.; Yang, F.; Zhang, L.; Fan, X.; Wu, T.; et al. Anti-inflammatory effects of caper (Capparis spinosa L.) fruit aqueous extract and the isolation of main phytochemicals. J. Agric. Food Chem. 2010, 58, 12717–12721. [Google Scholar] [CrossRef] [PubMed]
  26. Mahboubi, M.; Mahboubi, A. Antimicrobial activity of Capparis spinosa as its usages in traditional medicine. Herba Pol. 2014, 60, 39–48. [Google Scholar] [CrossRef] [Green Version]
  27. Tlili, N.; Khaldi, A.; Triki, S.; Munné-Bosch, S. Phenolic compounds and vitamin antioxidants of caper (Capparis spinosa). Plant Foods Hum. Nutr. 2010, 65, 260–265. [Google Scholar] [CrossRef] [PubMed]
  28. Perrino, E.V.; Wagensommer, R.P. Crop Wild Relatives (CWR) priority in Italy: Distribution, ecology, in situ and ex situ conservation and expected actions. Sustainability 2021, 13, 1682. [Google Scholar] [CrossRef]
  29. Yang, T.; Wang, C.; Liu, H.; Chou, G.; Cheng, X.; Wang, Z. A new antioxidant compound from Capparis spinosa. Pharm. Biol. 2010, 48, 589–594. [Google Scholar] [CrossRef]
  30. Yang, T.; Wang, C.-H.; Chou, G.-X.; Wu, T.; Cheng, X.-M.; Wang, Z.-T. New alkaloids from Capparis spinosa: Structure and X-ray crystallographic analysis. Food Chem. 2010, 123, 705–710. [Google Scholar] [CrossRef]
  31. Zhang, S.; Hu, D.-B.; He, J.-B.; Guan, K.-Y.; Zhu, H.-J. A novel tetrahydroquinoline acid and a new racemic benzofuranone from Capparis spinosa L., a case study of absolute configuration determination using quantum methods. Tetrahedron 2014, 70, 869–873. [Google Scholar] [CrossRef]
  32. Sharaf, M.; El-Ansari, M.A.; Saleh, N.A. Flavonoids of four Cleome and three Capparis species. Biochem. Syst. Ecol. 1997, 25, 161–166. [Google Scholar] [CrossRef]
  33. Kulisic-Bilusic, T.; Blažević, I.; Dejanović, B.; Miloš, M.; Pifat, G. Evaluation of the antioxidant activity of essential oils from caper (Capparis spinosa) and sea fennel (Crithmum maritimum) by different methods. J. Food Biochem. 2010, 34, 286–302. [Google Scholar] [CrossRef]
  34. Fu, X.P.; Wu, T.; Abdurahim, M.; Su, Z.; Hou, X.L.; Aisa, H.A.; Wu, H. New spermidine alkaloids from Capparis spinosa roots. Phytochem. Lett. 2008, 1, 59–62. [Google Scholar] [CrossRef]
  35. Zhang, H.; Ma, Z.F. Phytochemical and pharmacological properties of Capparis spinosa as a medicinal plant. Nutrients 2018, 10, 116. [Google Scholar] [CrossRef] [Green Version]
  36. Francesca, N.; Barbera, M.; Martorana, A.; Saiano, F.; Gaglio, R.; Aponte, M.; Moschetti, G.; Settanni, L. Optimised method for the analysis of phenolic compounds from caper (Capparis spinosa L.) berries and monitoring of their changes during fermen-tation. Food Chem. 2016, 196, 1172–1179. [Google Scholar] [CrossRef] [Green Version]
  37. Smith, M.; Smith, J.C. Repurposing therapeutics for COVID-19: Supercomputer-based docking to the SARS-CoV-2 viral spike protein and viral spike protein-human ACE2 interface. ChemRxiv 2020, in press. [Google Scholar]
  38. Derosa, G.; Maffioli, P.; D’Angelo, A.; Di Pierro, F. A role for quercetin in coronavirus disease 2019 (COVID-19). Phytother. Res. 2021, 35, 1230–1236. [Google Scholar] [CrossRef] [PubMed]
  39. Haslberger, A.G.; Jacob, U.; Hippe, B.; Karlic, H. Mechanisms of selected functional foods against viral infections with a view on COVID-19: Mini review. Funct. Food Health Dis. 2020, 5, 195–209. [Google Scholar] [CrossRef]
  40. Bailey, L. The Standard Cyclopedia of Horticulture; Macmillan: New York, NY, USA, 1927; Volume 1, p. 658. [Google Scholar]
  41. Baccaro, G. Il Cappero: Pianta da Reddito; Universale Edagricole, Edizioni Edagricole: Bologna, Italy, 1987. [Google Scholar]
  42. Faran, M. Capparis spinosa—The plant on the wall. In Medicinal and Aromatic Plants of the Middle-East (Medicinal and Aromatic Plants of the World); Yaniv, Z., Dudai, N., Eds.; Springer: Dordrecht, The Netherlands, 2014; pp. 59–65. [Google Scholar]
  43. Zuo, W.; Ma, M.; Ma, Z.; Gao, R.; Guo, Y.; Jiang, W.; Liu, J.; Tian, L. Study of photosynthetic physiological characteristics of desert plant Capparis spinosa L. J. Shihezi Univ. 2012, 3, 006. [Google Scholar]
  44. Gan, L.; Zhang, C.; Yin, Y.; Lin, Z.; Huang, Y.; Xiang, J.; Fu, C.; Li, M. Anatomical adaptations of the xerophilous medicinal plant, Capparis spinosa, to drought conditions. Hortic. Environ. Biotechnol. 2013, 54, 156–161. [Google Scholar] [CrossRef]
  45. Grimalt, M.; Hernández, F.; Legua, P.; Almansa, M.; Amorós, A. Physicochemical composition and antioxidant activity of three Spanish caper (Capparis spinosa L.) fruit cultivars in three stages of development. Sci. Hortic. 2018, 240, 509–515. [Google Scholar] [CrossRef]
  46. La Mantia, T.; Rühl, J.; Massa, B.; Pipitone, S.; Lo Verde, G.; Bueno, R.S. Vertebrate-mediated seed rain and artificial perches contribute to overcome seed dispersal limitation in a Mediterranean old field. Restor. Ecol. 2019, 27, 1393–1400. [Google Scholar] [CrossRef]
  47. Barbera, G. Le câprier (Capparis spp.). In Programme de Recherche Agrimed; Guiseppe, B., Ed.; Commission des Communautés Européennes L-2920: Luxembourg, 1991; p. 62. [Google Scholar]
  48. Fierotti, G. I Suoli della Sicilia: Con Elementi di Genesi, Classificazione, Cartografia e Valutazione dei Suol, 1st ed.; Flaccovio Dario: Palermo, Italy, 1997. [Google Scholar]
  49. Tuttolomondo, T.; La Bella, S.; Cammalleri, I.; Gaglio, G. Indagine preliminare sul germoplasma di Capparis spinosa subsp. rupestris (Sm.) Nyman dell’isola di Linosa. Ital. J. Agron. 2009, 4, 513–517. [Google Scholar]
  50. Lancashire, P.D.; Bleiholder, H.; Van Den Boom, T.; Langelüddeke, P.; Stauss, R.; Weber, E.; Witzenberger, A. A uniform decimal code for growth stages of crops and weeds. Ann. Appl. Biol. 1991, 119, 561–601. [Google Scholar] [CrossRef]
  51. Tuttolomondo, T.; La Bella, S.; Hornsby, L. Il cappero: Analisi desk sui flussi di commercializzazione in Italia e nei principali Paesi competitors. Ital. J. Agron. 2009, 4, 789–796. [Google Scholar]
  52. Tuttolomondo, T.; Iapichino, G.; Licata, M.; Virga, G.; Leto, C.; La Bella, S. Agronomic evaluation and chemical characterization of Sicilian Salvia sclarea L. accessions. Agronomy 2020, 10, 1114. [Google Scholar] [CrossRef]
  53. Perrino, E.V.; Perrino, P. Crop wild relatives: Know how past and present to improve future research, conservation and utilization strategies, especially in Italy: A review. Genet. Resour. Crop. Evol. 2020, 67, 1067–1105. [Google Scholar] [CrossRef]
  54. Landucci, F.; Panella, L.; Lucarini, D.; Gigante, D.; Donnini, D.; Kell, S.; Maxted, N.; Venanzoni, R.; Negri, V. A prioritized inventory of crop wild relatives and wild harvested plants of Italy. Crop. Sci. 2014, 54, 1628–1644. [Google Scholar] [CrossRef]
  55. Boletín Oficial del Estado. Normas de calidad para el comercio exterior de alcaparras y alcaparrones. BOE 1984, 100, 11394–11397. [Google Scholar]
  56. Inocencio, C.; Rivera, D.; Obon, C.; Alcaraz, F.; Barrena, J.A. A systematic revision of Capparis section Capparis (Capparaceae). Ann. Mo. Bot. Gard. 2006, 93, 122–149. [Google Scholar] [CrossRef]
  57. Fici, S.; Gianguzzi, L. Diversity and conservation in wild and cultivated Capparis in Sicily. Bocconea 1997, 7, 437–443. [Google Scholar]
  58. Aytaç, Z.; Kinaci, G.; Caylan, A. Yield and some morphological characteristics of Caper (Capparis spinosa L.) population cultivated at various slopes in Aegean ecological conditions. Pak. J. Bot. 2009, 41, 591–596. [Google Scholar]
  59. Barbera, G.; Di Lorenzo, R. La coltura specializzata del cappero nell’ isola di Pantelleria. Inf. Agrar. 1982, XXXVIII, 22113–22117. [Google Scholar]
  60. Shewfelt, R.L. What is quality? Postharvest Biol. Technol. 1999, 15, 197–200. [Google Scholar] [CrossRef]
  61. Crisosto, C.H. Stone fruit maturity indices: A descriptive. Postharvest News Inf. 1994, 5, 65–68. [Google Scholar]
  62. Melgarejo, P.; Legua, P.; Martinez, J.; Martinez-Font, R.; Hernandez, F. Preliminary characterization of sixty one caper clones (Capparis spinosa L.). Acta Hortic. 2009, 818, 155–160. [Google Scholar] [CrossRef]
  63. Burghardt, L.T.; Edwards, B.R.; Donohue, K. Multiple paths to similar germination behavior in Arabidopsis thaliana. New Phytol. 2015, 209, 1301–1312. [Google Scholar] [CrossRef] [Green Version]
  64. Awatef, R.; Hédia, H.; Sonia, H.; Mohamed, B. The use of morphological descriptors to study variability in wild populations of Capparis spinosa L. (Capparaceae) in Tunisia. Afr. J. Ecol. 2012, 51, 47–54. [Google Scholar] [CrossRef]
Figure 1. Mitigating effect on evaporation of the lava stones.
Agriculture 11 00327 g001
Figure 2. Pruning carried out in December 2007.
Agriculture 11 00327 g002
Figure 3. Rainfall and air temperature trends during the test period in the experimental area. Graph (a) refers to 2005, graph (b) refers to 2006, graph (c) refers to 2007 and graph (d) refers to 2008.
Agriculture 11 00327 g003
Figure 4. Factor weight and grouping of Capparis spinosa subsp. rupestris accessions.
Agriculture 11 00327 g004
Figure 5. Distribution of the accessions on the score plot for the two principal components. In the graph, the dots refer to accessions of Capparis spinosa subsp. rupestris grown in the first year while the squares refer to accessions grown in the second year, the same color refers to the same accession.
Agriculture 11 00327 g005
Figure 6. Flower (a) and flower buds (b) of caper plant.
Agriculture 11 00327 g006
Table 1. Main morphological characteristics of Capparis spinosa L. subsp. rupestris biotypes.
BiotypeLeaf Color (Code n.)Leaf
Morphology
Spiny
Stipulates
Flower Bud
Color (Code Number) *
Bud
Morphology
SCP1brown-green (371)obovate leaves with
retuse apices
absentdeep-green (412)rounded
SCP2brown-green (371)obovate leaves with
retuse apices
absentdeep-green (412)rounded
SCP3brown-green (371)ovate leaves with marked retuse apicesabsentdeep-green (412)rounded/
pyramidal
SCP4deep-green (421)ovate leavesabsentdeep-green (411)rounded/
pyramidal
SCP5deep-green (421)ovate leaves with marked retuse apicesabsentdeep-green (412)rounded/
pyramidal
SCP6deep-green (426)ovate leaves with marked retuse apicesabsentdeep-green with dark spots (422)rounded/
pyramidal
SCP7deep-green (426)Ovate leaves with marked retuse apicesabsentdeep-green with dark spots (423)rounded
* Seguy E.: Code universel des couleurs (Universal color code).
Table 2. Effects of biotype, year and interaction biotype-by-year on biometric and production parameters. Average values are shown.
FactorFlower Bud Fresh Weight (g)Flower Bud Dry Weight (g)Weight 100 Flower Bud (g)Flower Bud Dry Matter (%)Flower Bud
Diameter (mm)
Flower Bud Consistency (g)Primary Branch
Average Length (cm)
Primary Branch Nodes cm−1 (n)Secondary Branch/
Primary Branch (n)
Flower Buds/
Primary Branch (n)
Flower Buds/
Secondary Branch (n)
Biotype (B)
SCP11031.89 ab187.24 ab20.63 c17.79 bc7.57 c975.47 a104.21 d0.66 b5.77 c36.08 b15.13 f
SCP21167.61 a220.83 a22.84 b18.64 ab8.19 ab886.67 d139.19 a0.70 a6.37 c46.58 a25.51 e
SCP31056.70 ab184.57 ab22.08 b17.23 c7.65 c855.97 e127.24 b0.64 bc19.07 a25.43 c47.01 a
SCP41114.43 ab160.70 b23.40 b14.23 d8.15 ab842.16 f117.78 c0.61 c18.58 a24.17 c43.72 b
SCP51099.20 ab212.70 a23.04 b19.11 a8.49 a856.59 e117.92 c0.65 bc18.94 a25.00 c37.68 d
SCP6919.16 bc177.44 ab28.12 a19.02 a7.58 c922.85 c99.74 e0.64 bc17.37 b24.46 c41.41 c
SCP7745.17 c147.97 b27.80 a19.48 a7.97 bc942.10 b114.77 c0.66 b6.62 c35.94 b14.16 f
Year (Y)
2007446.00 b77.53 b24.11 a17.46 b8.01 a898.82 a114.13 b0.66 a12.87 b29.67 b31.77 a
20081592.33 a291.44 a23.86 a18.39 a7.87 a895.99 a120.40 a0.65 a13.62 a32.52 a32.41 a
Y × B**************
Means followed by the same letter in the same column are not significantly different according to Tukey’s test (p ≤ 0.05). * significant at p ≤ 0.05; ** significant at p ≤ 0.01.
Table 3. Correlation matrix of biometric and production parameters.
2008
CharactersFBFW/PFBDW/PW100FBFBDMFBDFBCPBALPBNSBPBFBPBFBSB
2007FBFW/P 0.7002−0.8101 *−0.51080.3024−0.56190.47570.65160.22360.02320.3796
FBDW/P0.7830 * −0.5640.25150.2249−0.21390.40320.8684 *−0.08130.33680.0534
W100FB−0.6078−0.3776 0.4343−0.0190.2082−0.3884−0.53680.0527−0.1581−0.0324
FBDM−0.31150.34650.3651 −0.09410.4765−0.13240.1596−0.39320.3782−0.4446
FBD0.53400.5728−0.17610.0887 −0.61630.45300.07170.21760.00690.1378
FBC−0.6513−0.32130.19850.4819−0.5068 −0.5733−0.04090.7607 *0.4574−0.821 *
PBAL0.64780.5935−0.3399−0.0590.5296−0.5468 0.5314−0.0280.39410.1760
PBN−0.15140.35600.15260.7813 *0.22480.53600.2839 −0.40220.6623−0.1507
SBPB0.27670.04820.0363−0.34810.0432−0.7105−0.1299−0.8002 * −0.9116 **0.9351 **
FBPB0.11240.3145−0.14590.31930.13620.41150.50690.8235 *−0.8903 ** −0.7551 *
FBSB0.41990.1261−0.016−0.4437−0.0361−0.7621 *0.0469−0.7885 *0.9491 **−0.7396 *
FBFW = flower bud fresh weight; FBDW = flower bud dry weight; W100FB = weight 100 flower bud; FBDM = flower bud dry matter; FBD = flower bud diameter; FBT = flower bud consistency; PBAL = primary branch average length; PBN = primary branch nodes cm−1; SBPB = secondary branch/ primary branch; FBPB = flower buds/primary branch; FBSB = flower buds/secondary branch. * correlation is significant at the 0.05 level. ** correlation is significant at the 0.01 level.
Table 4. Variance in principal components and cumulative contribution to total variance.
PC1PC2PC3
Eigenvalues4.012.621.88
% variance36.4423.8217.04
% cumulative variance36.4460.2677.30
Table 5. Factor weights of properties on the three principal components.
PC1PC2PC3
Flower bud fresh weight/plant (g)−0.01700.77260.5975
Flower bud dry weight/plant (g)0.07810.75510.6347
Weight 100 flower buds (g)0.0483−0.47200.2717
Flower bud dry matter (%)0.58380.06330.3437
Flower bud diameter (mm)−0.15760.3101−0.6735
Flower bud consistency (g)0.7826−0.47480.3420
Primary branch average length (cm)0.03130.8279−0.4013
Primary branch nodes/cm−1 (n/cm)0.72380.2111−0.3868
Second. branches/primary branch (n) −0.95260.03760.1472
Flower buds/primary branch (n)0.85700.3944−0.1708
Flower buds/secondary branches (n)−0.92400.13020.0663
Table 6. Average days per year corresponding to phenological stages.
YearPlant Dormancy (Day)Plant Growth
(Day)
Flower Bud
Emergence
(Day)
Fruiting
(Day)
200790.14 b267.00 a212.57 b175.71 b
200891.14 a265.58 b215.14 a175.85 a
Significance********
Means followed by the same letter in the same column are not significantly different according to Tukey’s test (p ≤ 0.05). ** significant at p ≤ 0.01.
Table 7. Average length of phenological stages based on accessions of C. spinosa subsp. rupestris.
BiotypePlant Dormancy (Day)Plant Growth
(Day)
Flower Bud
Emergence
(Day)
Fruiting
(Day)
SCP194.00 b264.0 1e217.00 b178.02 d
SCP280.01 g297.02 a233.02 a181.51 a
SCP385.51 f270.51 b209.51 f177.52 e
SCP498.50 a260.01 f212.02 e178.02 c
SCP592.01 d267.02 5215.01 c180.02 b
SCP691.01 e266.52 d208.02 g170.03 f
SCP793.50 c258.01 g212.52 d165.53 g
Significance********
Means followed by the same letter in the same column are not significantly different according to Tukey’s test (p ≤ 0.05). ** significant at p ≤ 0.01.
Publisher’s Note: MDPI stays neutral with regard to jurisdictional claims in published maps and institutional affiliations.

