
Influence of Tillage on the Production Inputs, Outputs, Soil Compaction and GHG Emissions


1
Institute of Agricultural Economics and Information, Mánesova 75, 120 00 Praha 2, Czech Republic
2
Crop Research Institute, Drnovská 507/73, 161 06 Praha 6-Ruzyně, Czech Republic
3
Department of Agroecology and Crop Production, Faculty of Agrobiology, Food and Natural Resources, Czech University of Life Sciences Prague, Kamýcká 129, 165 00 Praha 6-Suchdol, Czech Republic
*
Author to whom correspondence should be addressed.
Agriculture 2021, 11(5), 456; https://0-doi-org.brum.beds.ac.uk/10.3390/agriculture11050456
Submission received: 31 March 2021
/
Revised: 13 May 2021
/
Accepted: 14 May 2021
/
Published: 18 May 2021
(This article belongs to the Special Issue Cropping Systems: Implications on Climate and Environment)
Abstract
:Fertilizer inputs, crop yields, the composition of technological operations and intensity of treatment with different types of pesticides in both basic approaches were evaluated. A comprehensive comparison of impacts showed that all crops, except sugar beet, achieved better economic and emission parameters of production based on the evaluation of GHG production by using reduced tillage compared to ploughing. The total reduction of GHG emissions based on CO2eq on average of all crops per ton as a result of the technological processes was 6% using reduced tillage. The most significant CO2eq reductions were achieved for rye and oat (13%), and spring barley (8%). The reduction of crop yields ranges from about 1% (spring barley) to 4% (grain maize). Cost reduction per tone was in the range of 14% (rye) to 2% (silage maize). The energy gain was at reduced tillage improved at poppy (8%), rape (4%), oat (3%), rye (3%) and spring and winter barley (2%). From the evaluation of the number of chemical protections, a lower number of total protections was found at the no-till system for most crops. In most cases, there was no difference between ploughing and reduced tillage. There was an increase in specific nitrogen consumption per tonne of production in marginal areas, reduced tillage led to an increase in soil compaction.
1. Introduction
Agriculture of the last century was focused primarily on increasing the productivity of cultivated crops and intensive land use. However, long-term intensive farming has a significant impact on the climate and the environment [1]. The problem is the deteriorating condition of the soil and the subsequent reduction in soil fertility. Soils are often degraded, soil organic carbon stocks are depleted and biodiversity is lost [2,3,4]. In addition, intensively cultivated soils are frequently prone to erosion and disruption of the soil structure and changes in moisture regime. A significant risk of long-term intensive tillage is the low water retention in the landscape, deteriorating water quality due to leaching of nutrients from the soil and last but not least groundwater pollution by nitrates and pesticides [5,6,7].
One of the main principles of today’s agriculture is the use of crop-growing systems including optimal agronomic practices to ensure the efficient use of all inputs for crop productivity and economic profitability while maintaining the quality of the environment and the sustainability of the agroecosystem [8,9].
Since the 1950s, there has been a gradual transition from the moldboard plough to various forms of conservation tillage to no-till with minimum soil disturbance throughout the world. Conservation and reduced systems of tillage are effective practices to control soil erosion and conserve water, contributes to the C sequestration and reduce monetary and energy costs, but problems with weed control, soil organic C and nutrient stratification, risks for compaction, runoff and acidification are also mentioned [10,11,12]. On the other hand, ploughing, i.e., conventional tillage (CT) improves soil fertility and agronomic productivity but there was detected a long-term trend of decline in soil structure and the increase in susceptibility to crusting, compaction and erosion [8,10].
The used method of soil tillage significantly affects the productivity and sustainability of agricultural land and the growth of cultivated crops through changes in physical, chemical and biological soil processes [13,14]. Tillage changes the vertical distribution of soil organic matter and plant nutrients supplied to the soil surface, which affects the activity of enzymes and microbial biomass responsible for the transformation and cycle of organic matter and plant nutrients [14]. According to [11] the absence of CT caused the compaction and the onset of a no-till pan beneath the tillage depth of the cultivator, i.e., in a shallow depth of 13–23 cm but soil structure at greater depths (28–38 cm) was indistinguishable despite 25 years of different tillage.
Tillage practices significantly influence the carbon stocks in agricultural soils. The data obtained from several studies pointed that RT is an effective and sustainable method of tillage, which improves carbon sequestration and soil fertility, resulting in higher yields of cereal crops, especially in drier areas. RT, especially in combination with mulching, can thus help to retain the water content of the soil, but also to maintain better soil structure and stability [15,16].
CT means more frequent use of heavy machinery with associated fuel costs and higher CO2 emissions [16]. RT systems can significantly reduce greenhouse gas emissions from fuel consumed without affecting crop yields. A study [17] suggests that, in particular, RT technologies can be recommended as a conventional agricultural practice to achieve an optimal balance between greenhouse gas emissions, crop yields and nitrogen balances. However, many authors have stated that RT is not suitable for all soil types, crops and climatic areas in terms of possible soil compaction and N2O emissions that may occur in poorly aerated and loosed soils [18,19].
Energy, economics and the environment are mutually dependent. At present, the productivity and profitability of agriculture depend upon energy consumption. The amount of energy used depends on the level of mechanization, the amount of active agricultural work and cultivated land [20]. Soil tillage in the cultivation of arable crops is one of the largest energy and labour consumers. Primary tillage practices require 75% of the total energy consumed before sowing.
Therefore, the selection of an appropriate method of tillage includes an assessment of the energy savings and environmental pollution control. Thus, reducing the intensity of tillage has the potential to reduce susceptibility to soil erosion, reduce fuel consumption, time and energy in crop cultivation [17].
RT technologies can contribute to efficient land management, but at the same time, the risks associated with the use of these technologies need to be recognized [21]. RT affects the development of weeds and diseases associated with the use of pesticides [22].
The use of pesticides is a pertinent aspect of modern agricultural activities. These chemicals protect crops from a variety of insects, pests and even weeds. Thus, their application has risen dramatically in recent times and resulted in an overwhelming increase in food production all over the world. On the other hand, excessive pesticide usage is leading to severe detrimental effects on the environment and humans with time [23]. These impacts have included contamination of groundwater and surface water with nutrients and pesticide residues and increasing resistance of insects and diseases to current methods of control [24,25]. Pesticides are a major cause of pollution in water, air and soil [23]. Pesticides together with fertilizers are among the most important secondary sources of emission, too [26]. Even though total energy use in pesticides manufacture is small in comparison with fertilizers, it can require two to five times as much energy per kilogram as nitrogen fertilizer manufacture [27]. Tillage systems research has been carried out in many countries around the world for decades concerning the economic, energy and environmental point of view. Optimization of tillage in terms of soil type and climatic conditions, together with the optimal nutrient supply, is a prerequisite for high yields, maintaining soil fertility, reducing ecosystem pollution and decrease of the energy intensity of crop production [4,28].
The analysis of the literature shows a wide range of approaches to the problem of choosing tillage, which the paper tries to unify. This study aimed to evaluate the influence of the used tillage technologies in terms of economics, energy and GHG emissions according to LCI database Agri-footprint [29] and RECIPE characterization methodology [30]. It was analyzed 9 years of growth of a wide spectrum of crops cultivated on 529 plots at different tillage. The influence of CT and RT was evaluated in terms of: (i) the intensity of production inputs of cultivated crops such as nitrogen fertilizers and plant chemical protection; (ii) the evaluation of the penetrometric resistances of soil and (iii) CO2eq emissions associated with the energy and economic intensity of crop production.
2. Materials and Methods
2.1. Primary Dataset
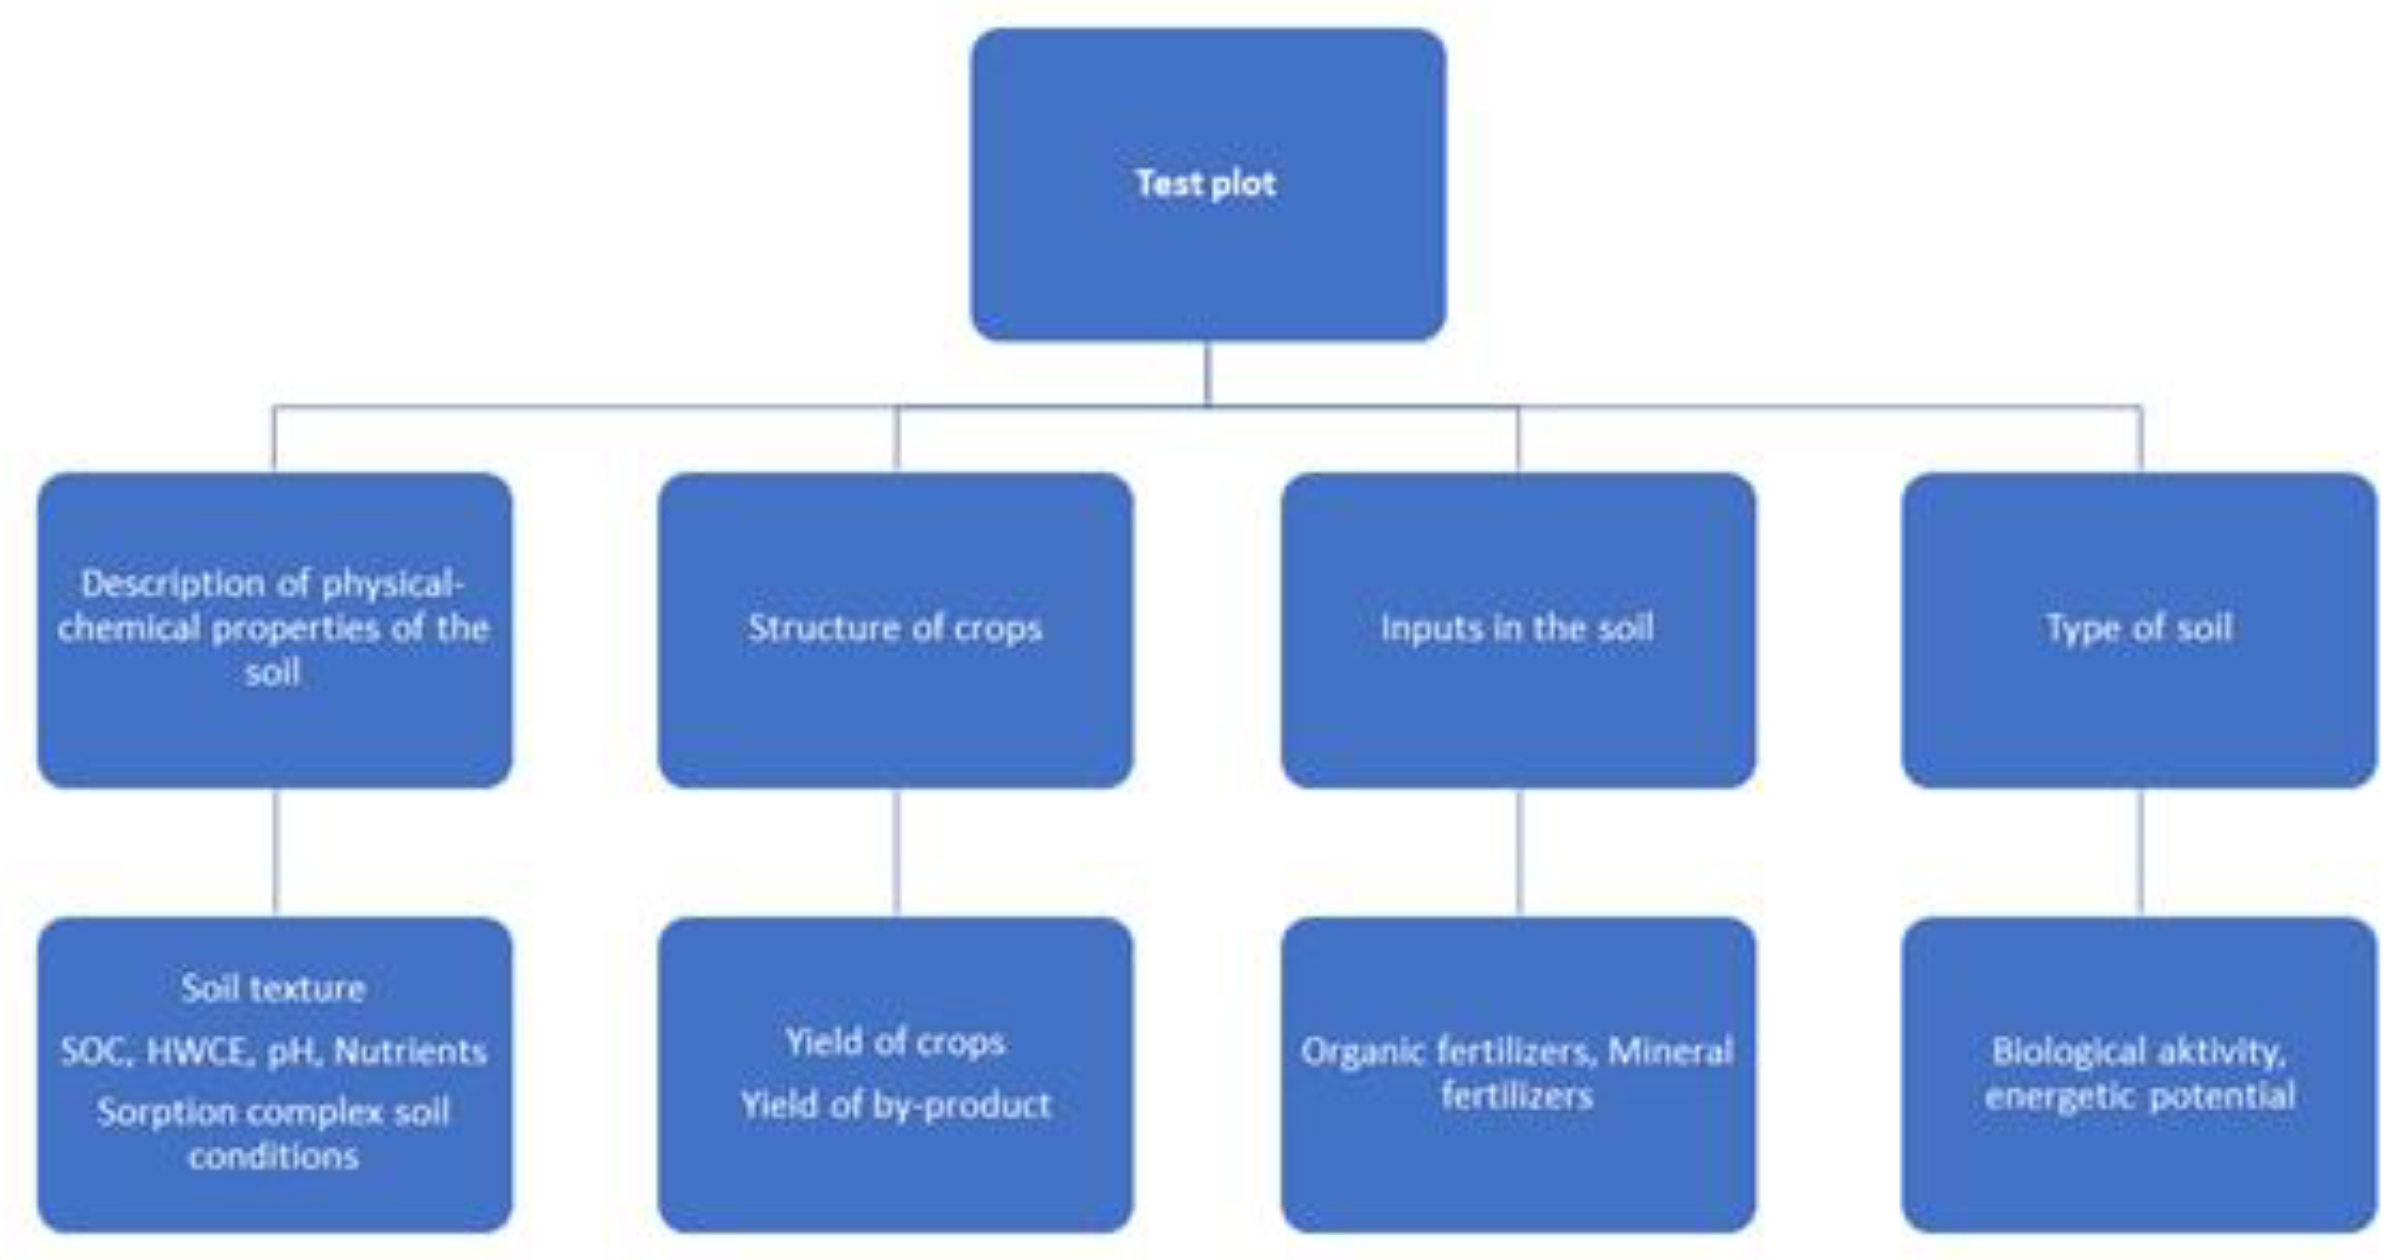
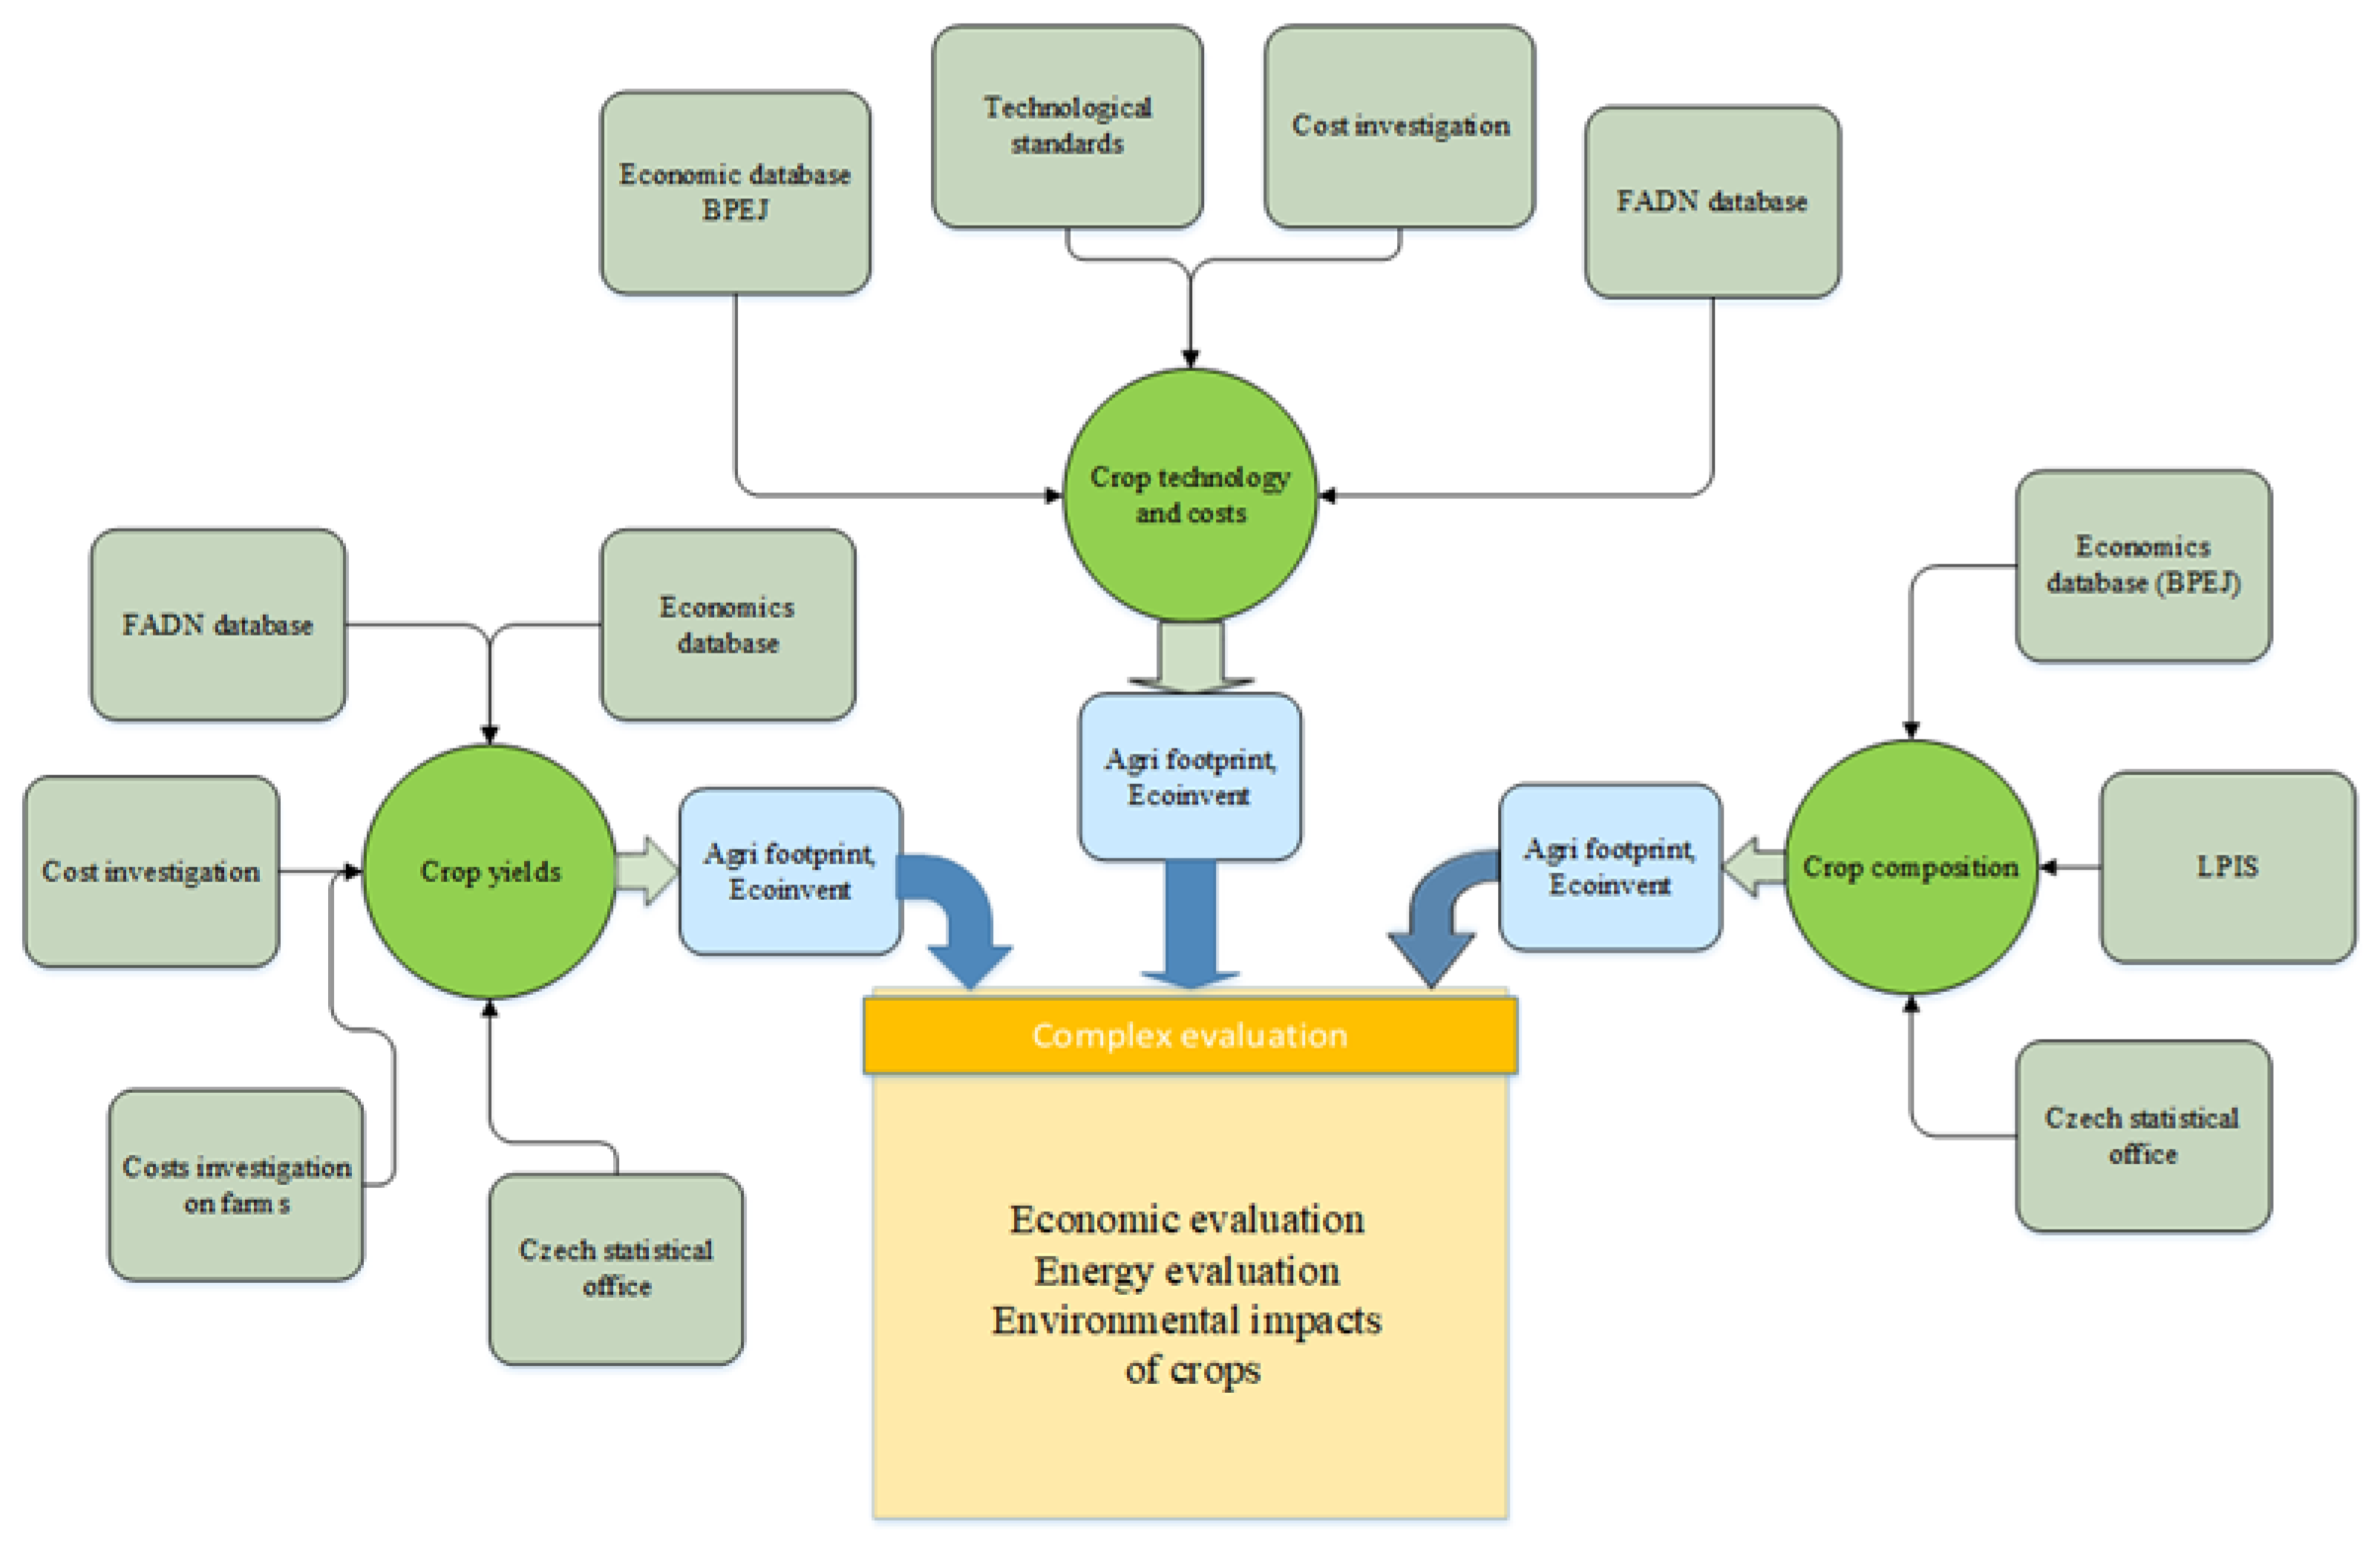
Fundamental monitoring was carried out on 529 plots for nine years 2002–2010 [31,32] in the major soil and climatic conditions, on the area of 9.2 thousand hectares, including 127 represented the most evaluated soil-ecological units (ESEU) in 0–8 climatic regions in the Czech Republic. The map of climatic regions of the Czech Republic is in Appendix A (Figure A1). Results interpret three quarters of total arable land in the country. Monitoring was carried out on homogeneous lands with total area of min. 5 ha. Monitoring was conducted in usual farming operations, with detailed monitoring of all inputs and outputs in crop cultivation including the assessment of soil samples. Eleven crops were observed: winter wheat, winter barley, winter rye, winter triticale, winter oilseed rape, spring barley, oat, grain maize, silage maize, poppy and sugar beet. The values of inputs (nitrogen fertilizers and chemical plant protection) were monitored on farms for individual plots based on the reported data of farms. The basic structure of inputs to the monitored plots is based on the diagrams in Appendix A (Figure A2 and Figure A3) and Appendix B (Table A1, Table A2, Table A3, Table A4, Table A5 and Table A6).
The context of economic, energy and environmental indicators in relation to the conventional tillage (CT—including ploughing or stubble ploughing and subsequent ploughing) and reduced tillage (RT—including one or two or multiple shallow stubble ploughing/breaking system) were evaluated.
2.2. Supporting Databases
Databases of economic, energy and environmental relations of crop production were used to evaluate the relations between tillage, climatic conditions, fertilization and chemical protection. The basis was a description of soil-climatic properties according to ESEU and monitoring of technological parameters in relation to the soil fertility in a comprehensive concept according to the crops production functions [31,32,33,34,35]. Basic information to the system ESEU was described in fundamental databases [36,37,38,39,40,41,42]. An overview of climatic conditions in the basic breakdown by climate regions is described in Appendix B (Table A7). The long-term averages and year-specific weather conditions of the Czech Republic are displayed in Appendix B (Table A8).
The fundamental set of knowledge in the form of a national economic database consists of a set of databases on yields, costs of individual operations, inputs to the ESEU and is updated annually (until 2019) concerning the economic data used and crop yields, which are updated according to the data of farms continuously monitored [43]. According to the current state of the ESEU for the last five years (2015–2019), the basic value for economic and energy assessment was set. For the environmental assessment, a newly developed methodology for calculating ecological indicators [44] according to the agrifootprint database [35] was developed. The environmental data were processed for the impact assessment based on the evaluation unit data inputs into the production database Agrifootprint [29]. To simplify the environmental assessment, indicator CO2eq production has been selected. The mutual functional connection of the registered chemical plant protection of individual types of pesticides to the methods of tillage, climatic data and data on nitrogen fertilization was also evaluated.
2.3. Evaluation of the Primary Dataset
This article evaluates the context of economic, energy and environmental indicators in relation to CT and RT from the basic monitoring. The mutual functional connection of the registered chemical plant protection of individual types of pesticides to the methods of tillage, climatic data and data on nitrogen fertilization was also evaluated.
The results of the survey in farms were extrapolated concerning the conditions throughout the Czech Republic according to the identified production functions [43] and validated also with respect to the previous crop cultivation results achieved in similar ESEU conditions to current economic and energy parameters of production in 2015–2019. The used file allows comparison of differentiated operating conditions in farms, enabling a better evaluation of the functional context in a broader context.
Crop yields were standardized to a uniform moisture content [45].
2.3.1. Evaluation of the Fertilizers and Chemical Plant Protection Efficiency
From the set of measurements of 529 plots, the values of a specific consumption of total nitrogen supply per mass of detected production were found. These values affect the relation of all monitored economic and energy parameters and emissions based on the statistically treated input data in IBM-SPSS version 27. An indicator of the total nitrogen supply to the 1 t of production based on the doses of mineral and organic fertilizers per hectare was used to monitor the values.
In the set of measurements was detailed information of 529 plots with technological parameters of production in the major soil and climatic conditions, with a total area of 9.2 thousand hectares, including 127 represented the most BPEJ and 65 major soil units (HPJ). Results interpret three quarters of total arable land in the country. Monitoring was carried out on homogeneous lands with majority representation of the main soil units from 80% of land with total area of 5 ha.
Data on the content of organic nitrogen according to the analyzes of farms were included in the inputs of organic nitrogen as a priority. In the case of undocumented analysis of the amount of organic nitrogen by farms, it was determined according to the methodology of the Crop Research Institute [45].
The relationships of nitrogen doses per unit of production were examined with respect to the soil fertility given by the database background for individual crops in the Czech Republic according to the monitoring of relations with the ESEU [31,32,46]. The results are evaluated in the subsequent economic, energy and environmental indicators.
The values of fertilizers were structured according to the basic distinction between mineral and organic. In the context of the functional development of production relations, the dose of nitrogen of fertilizers was used according to the data of farms or for mineral fertilizers according to the data of producers or by the average content of the nutrients of the fertilizers according to the national guidelines [45].
Pesticides were structured according to their purpose into herbicides, fungicides, insecticides, combined and other pesticides and total pesticides. The input values of herbicides are so heterogeneous that only the number of chemical protections was monitored. For individual methods of tillage, the structure of pesticides does not change, only the frequency of chemical protections.
Standard chemical protection against weeds, insect pests and plant pathogens was designed for each evaluated crop. The number of active ingredients of herbicides, insecticides and fungicides (g/ha) was calculated and the environmental impact of chemical protection of evaluated crops was assed according to [32,44].
2.3.2. Evaluation of the Number of Plant Chemical Protections
The data set (n = 3381) included eleven crops (five winter crops: winter wheat, winter barley, winter rye, winter triticale, winter oilseed rape and six springs crops: spring barley, oat, grain maize, silage maize, poppy and sugar beet). The crops were cultivated at different tillage practices (CT, RT, no-till system). Effects of the year, crop and tillage system on the number of chemical protections (herbicidal, insecticidal, fungicidal and mixed protections and the total number of protections as well as preventive and urgent protections) were separately statistically evaluated by using one-way analysis of variance followed by the Tukey post-hoc test (α = 0.05) using data analysis software system Statistica 12 (StatSoft 2013).
A group of prevent protections included particularly preemergence herbicides, fungicides and partly mixed pesticides. Postemergence herbicides, insecticides and partly mixed pesticides belonged to the group of urgent protections. Group of mixed pesticides included tank-mix combinations of herbicides and/or other pesticides and chemical substances (e.g., plant growth regulators).
2.3.3. Evaluation of the Penetrometric Resistances of Soil
Penetrometric resistances were measured at three depths, namely 0–18 cm, 19–38 cm and 39–72 cm. Penetration resistance was measured using a registration penetrometer PN-10, which was developed at the Czech University of Life Sciences Prague. The penetrometer is equipped with a tip according to ASABE standards with a cone with an angle of 30° and its area is 100 mm2, methodology is described in [32,47].
2.3.4. Evaluation of the GHG Emission, Economic and Energy Parameters
The results of the survey in farms were extrapolated in relation to the conditions throughout the Czech Republic according to the identified production functions [43] and validated also with respect to previous crop cultivation results achieved in similar ESEU conditions to current economic and energy parameters of production in 2015–2019. The used file allows comparison of differentiated operating conditions in farms, enabling a better evaluation of the functional context in a broader context.
The basic approach to the calculation of economic, energy and environmental assessment of crops is based on a comprehensive methodology, where the indicator of the economy of crop production is determined based on Gross Margin equivalent including overhead in EUR/ha [32]:
where: GMo,i,p is a gross margin with overheads for crops p and soil climatic conditions i, COGS = Cost of goods sold including overheads (EUR), SOi,p is a standardized output of crop products (EUR).
GMo,i,p = SOi,p − COGSo,i,p
Energy gross margin including overheads 2 is similar:
where: EGMo,i,p is a Energy gross Margin with overheads for crops p and soil cli-matic conditions i, ECOGS = Cost of goods sold including overheads (MJ), ENSi,p is a standardized output in MJ.
EGMo,i,p = ENSi,p − ECOGSo,i,p
Environmental indicators are developed from agrifoodprint methodology and they are represented in the paper with GHG emission according to CO2eq emissions in the category of Midpoint. Detailed data are presented in the previous work [32].
Economic indicators of various tillage methods were calculated to simplify the data obtained and to establish relative relationships, according to the relation:
where P are the individual monitored indicators according to the index i (1–4): for i = 1—mineral nitrogen dose kg N/t, for i = 2—number of chemical protections/ha,i = 3—for crop yield (t/ha), i = 4 for economic costs (EUR/ha) at predicted yield (t/ha) according to local conditions [31] in RT and CT.
Ki = PRTi/PCTi
Environmental and energetic indicators were calculated similarly in the form of coefficients:
where PE are the individual monitored indicators according to index i (1 a 2): for i = 1—GHG (CO2eq), for i = 2—Energy gain (MJ/ha) [32] in RT and CT.
KEi = PERTi/PECTi
3. Results and Discussion
3.1. Evaluation of the Tillage System in Relation to the Input Data
The nitrogen inputs and the number of chemical protections in relation to yields and climatic conditions were evaluated by CT and RT. The penetrometric resistances of soil in relation to the various tillage methods were also observed.
3.1.1. Evaluation of the Specific Nitrogen Consumption per Tonne of Production in Relation to Yield, Soil Compaction and Climatic Factors
The resulting relations of nitrogen inputs for individual crops depend on random events due to the conditions for yield formation. For most crops, the broader significance of nitrogen doses with respect to soil fertility has not been demonstrated.
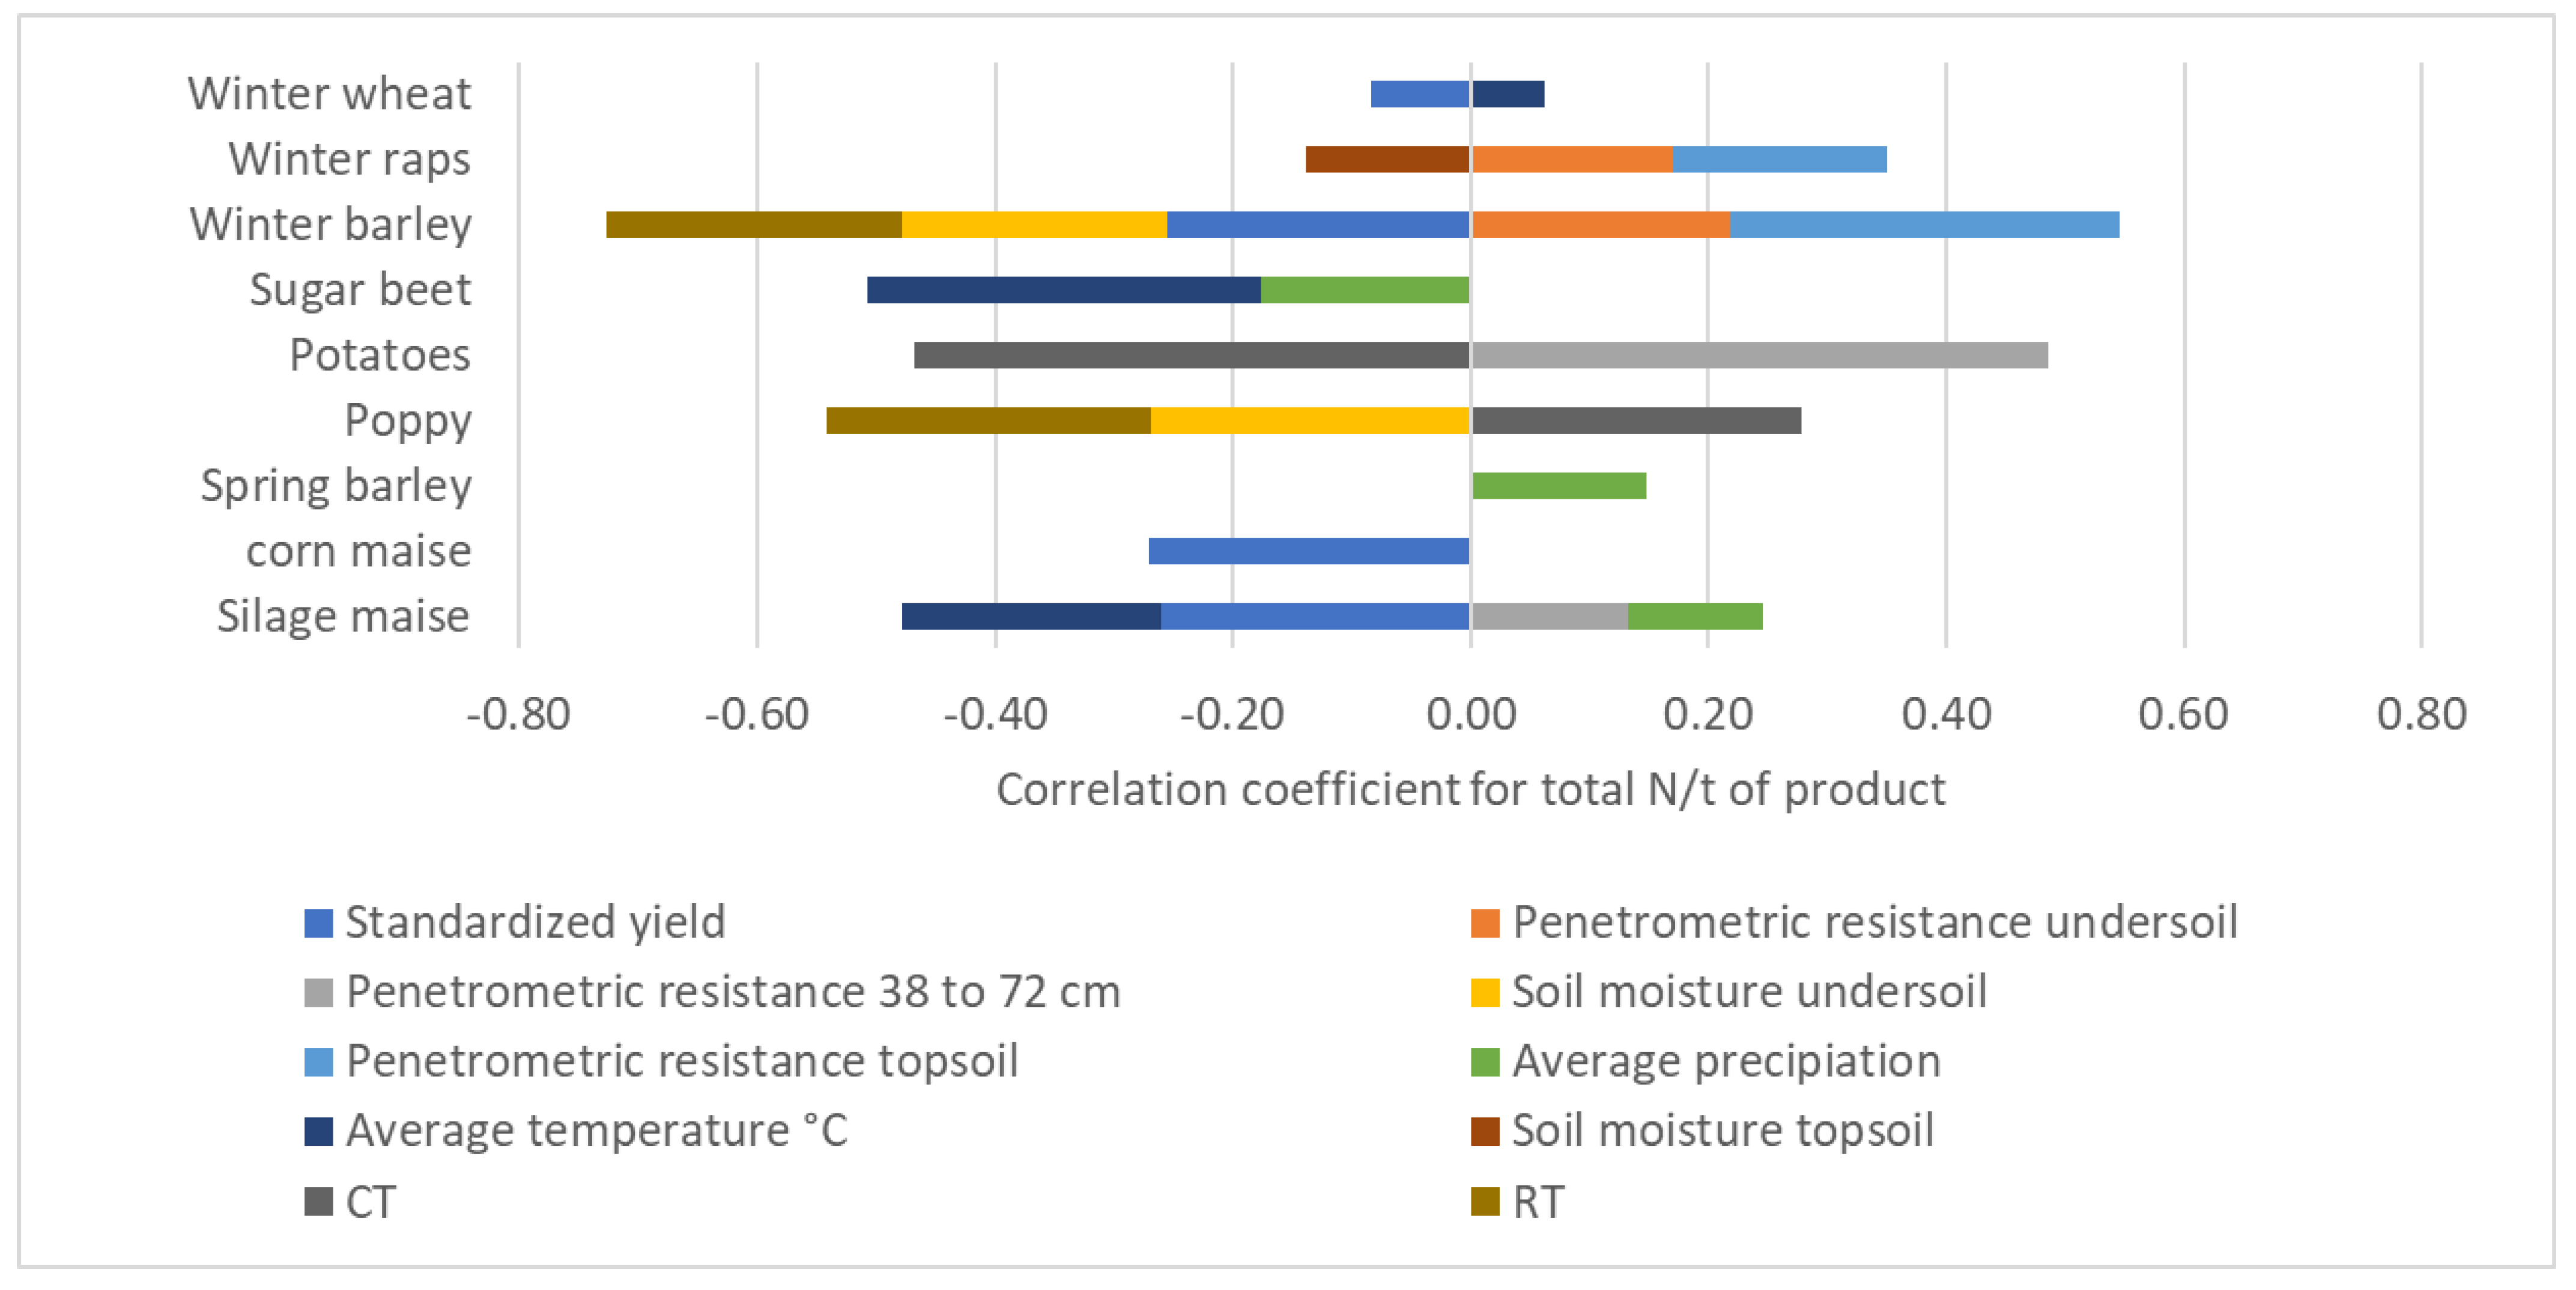
An overview of the main factors based on correlation analysis of the production of specific nitrogen consumption per tonne of yield is shown in Figure 1.
The obtained coefficients indicate that the specific nitrogen consumption of some crops is negatively correlated with the standardized yield. Fertilizer consumption for yield formation increase in the less fertile areas. This relation is particularly evident in fodder crops, silage maize, winter barley, grain maize and winter wheat.
Increased soil compaction in all layers leads to an increase in nitrogen fertilization and therefore maintaining a loose state is highly important from this point of view. This corresponds to the moisture in the soil of spring barley, poppy and rape, the increase of which leads to lower doses of nitrogen. The effect of the tillage system was observed only for poppy, winter barley and potatoes. RT of winter barley and poppy resulted in a decrease in specific nitrogen consumption per tonne of production. In the case of poppy, there was also an adequate increase in the specific nitrogen consumption of CT. In this case, soil compaction had a greater effect on specific nitrogen consumption compared to the used tillage system. For potatoes, there was a decrease in nitrogen doses per ton of CT production.
For thermophilic crops, sugar beet and silage maize, a higher average air temperature led to lower nitrogen consumption.
Silage and grain maize, winter barley and winter wheat showed a context between a systematic increase of nitrogen doses on less fertile soils, which deviated from the dispersion of nitrogen doses and yields achieved due to common agrotechnical problems based on the evaluation of the correlation coefficient.
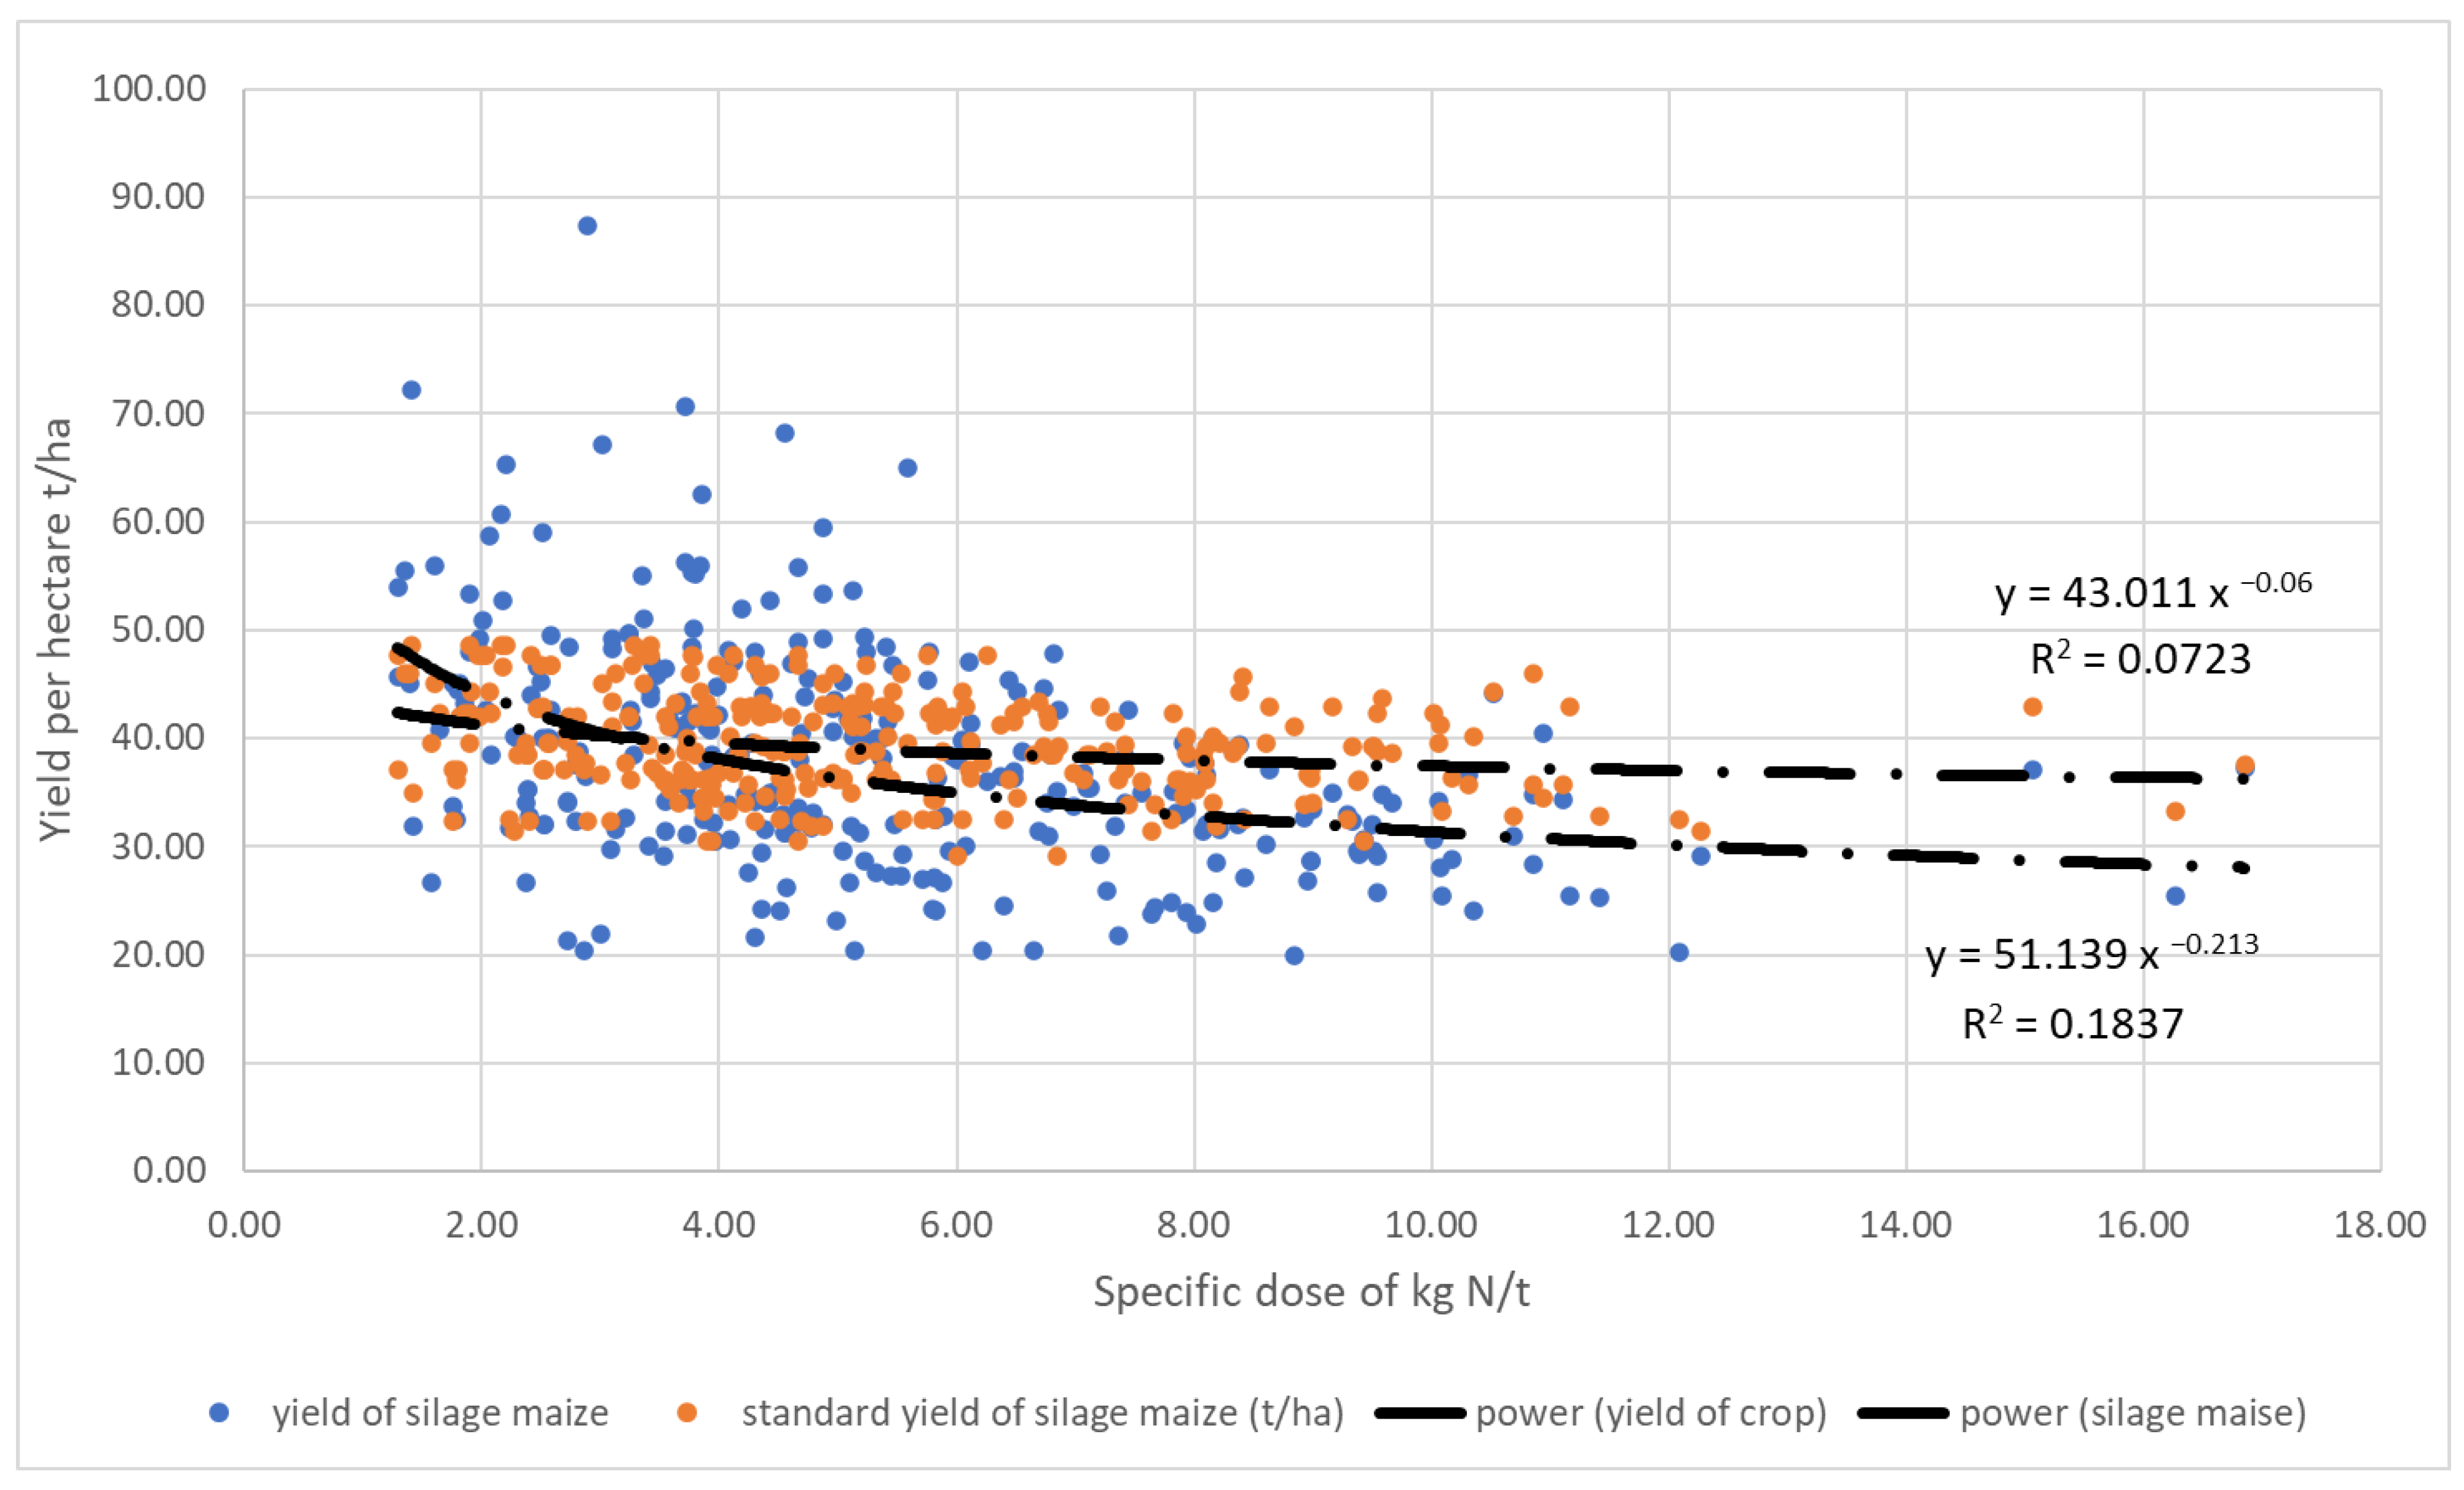
Figure 2 shows in detail the distribution of higher specific doses of nitrogen in silage maize, which increase in proportion to the decreasing soil fertility characterized by the standardized yield under the given conditions. The statistical evaluation has shown that the specific nitrogen doses in less favourable areas increased proportionately with decreasing soil fertility, which generally defines a standardized yield under the given conditions. The reason may be in addition to the normal crop damage and the requirement for higher yields in less fertile areas, where the biogas plants are often located. The maize is the most suitable crop for biogas plants due to its high dry matter biomass yield and high specific methane yield [48,49].
The increase in specific fuel consumption per tonne of production occurs from approximately the standard yield of 40 t/ha.
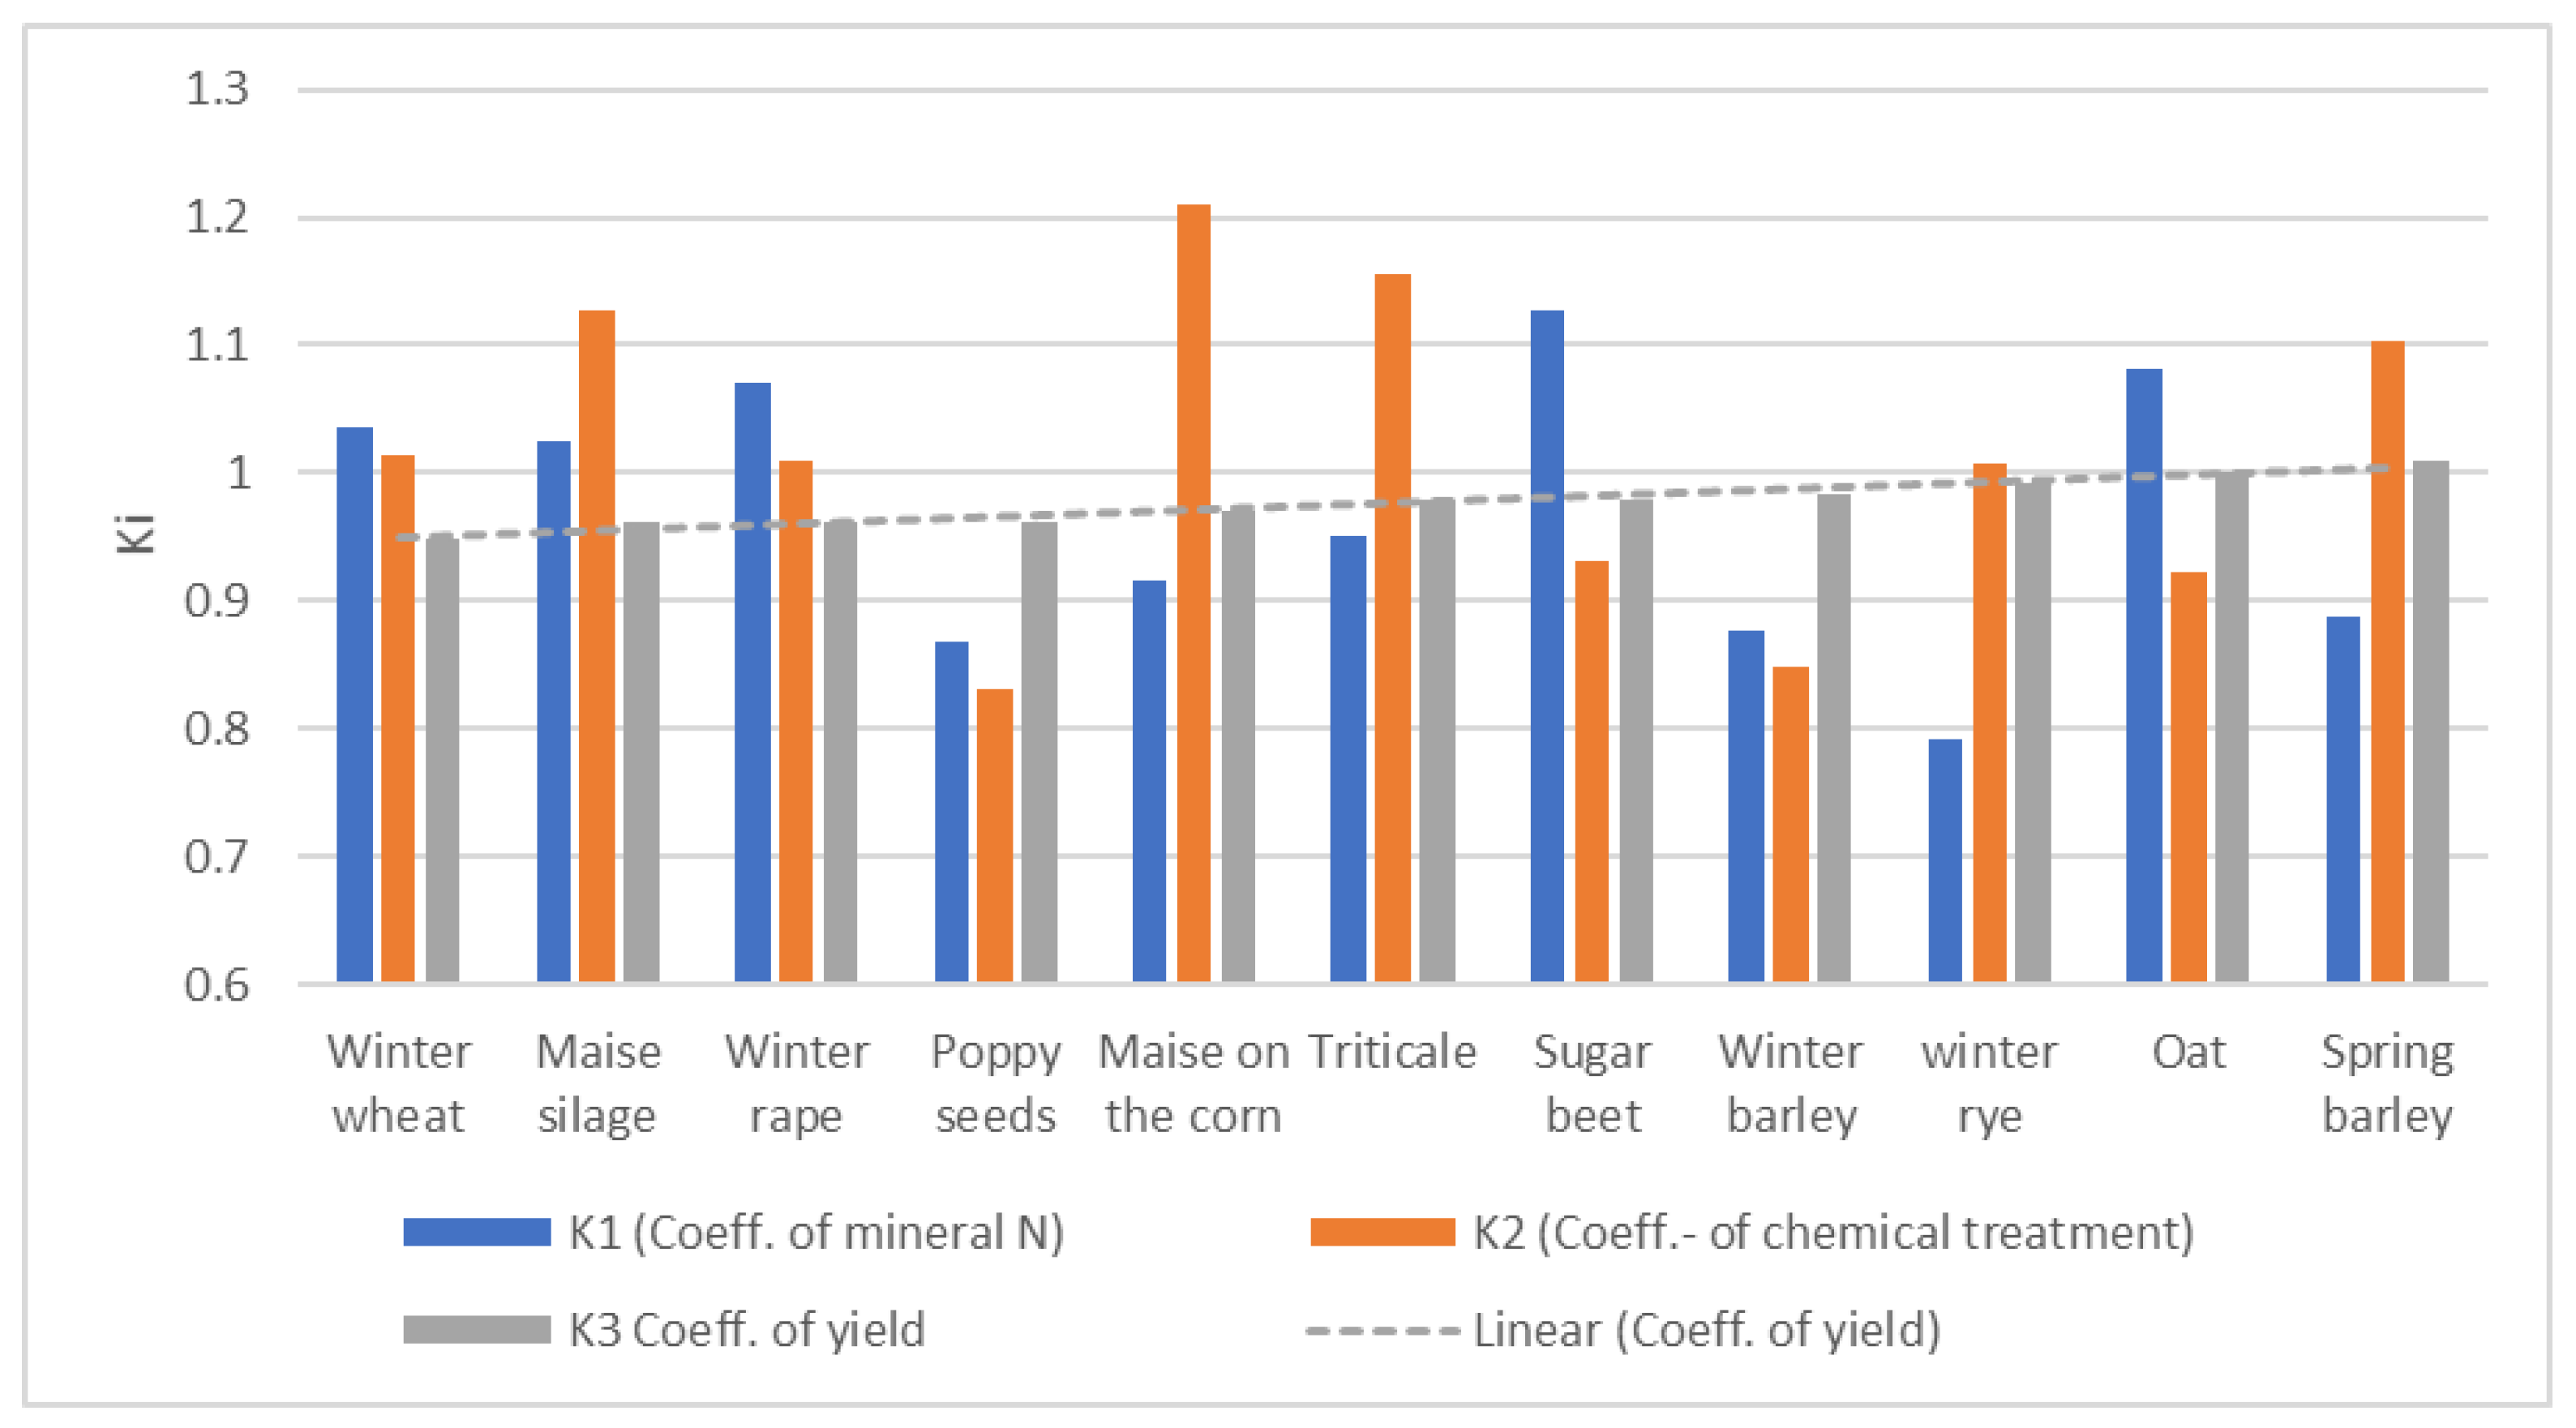
The mineral nitrogen consumption (kg/t) for the monitored crops is shown in Figure 3. Our observations show that specific nitrogen consumption for crops proves to be different. The share of mineral nitrogen consumption per tonne of production (N/t) for RT/CT was for sugar beet (1.13), silage maize (1.02), winter wheat (1.04), winter oilseed rape (1.07) and oats (1.08). On the contrary, a decrease in specific nitrogen consumption was recorded for spring barley (0.89), winter barley (0.88), grain maize (0.92), triticale (0.95) and winter rye (0.79) (Figure 3).
3.1.2. Evaluation of the Yield and Costs Depending on the Tillage System
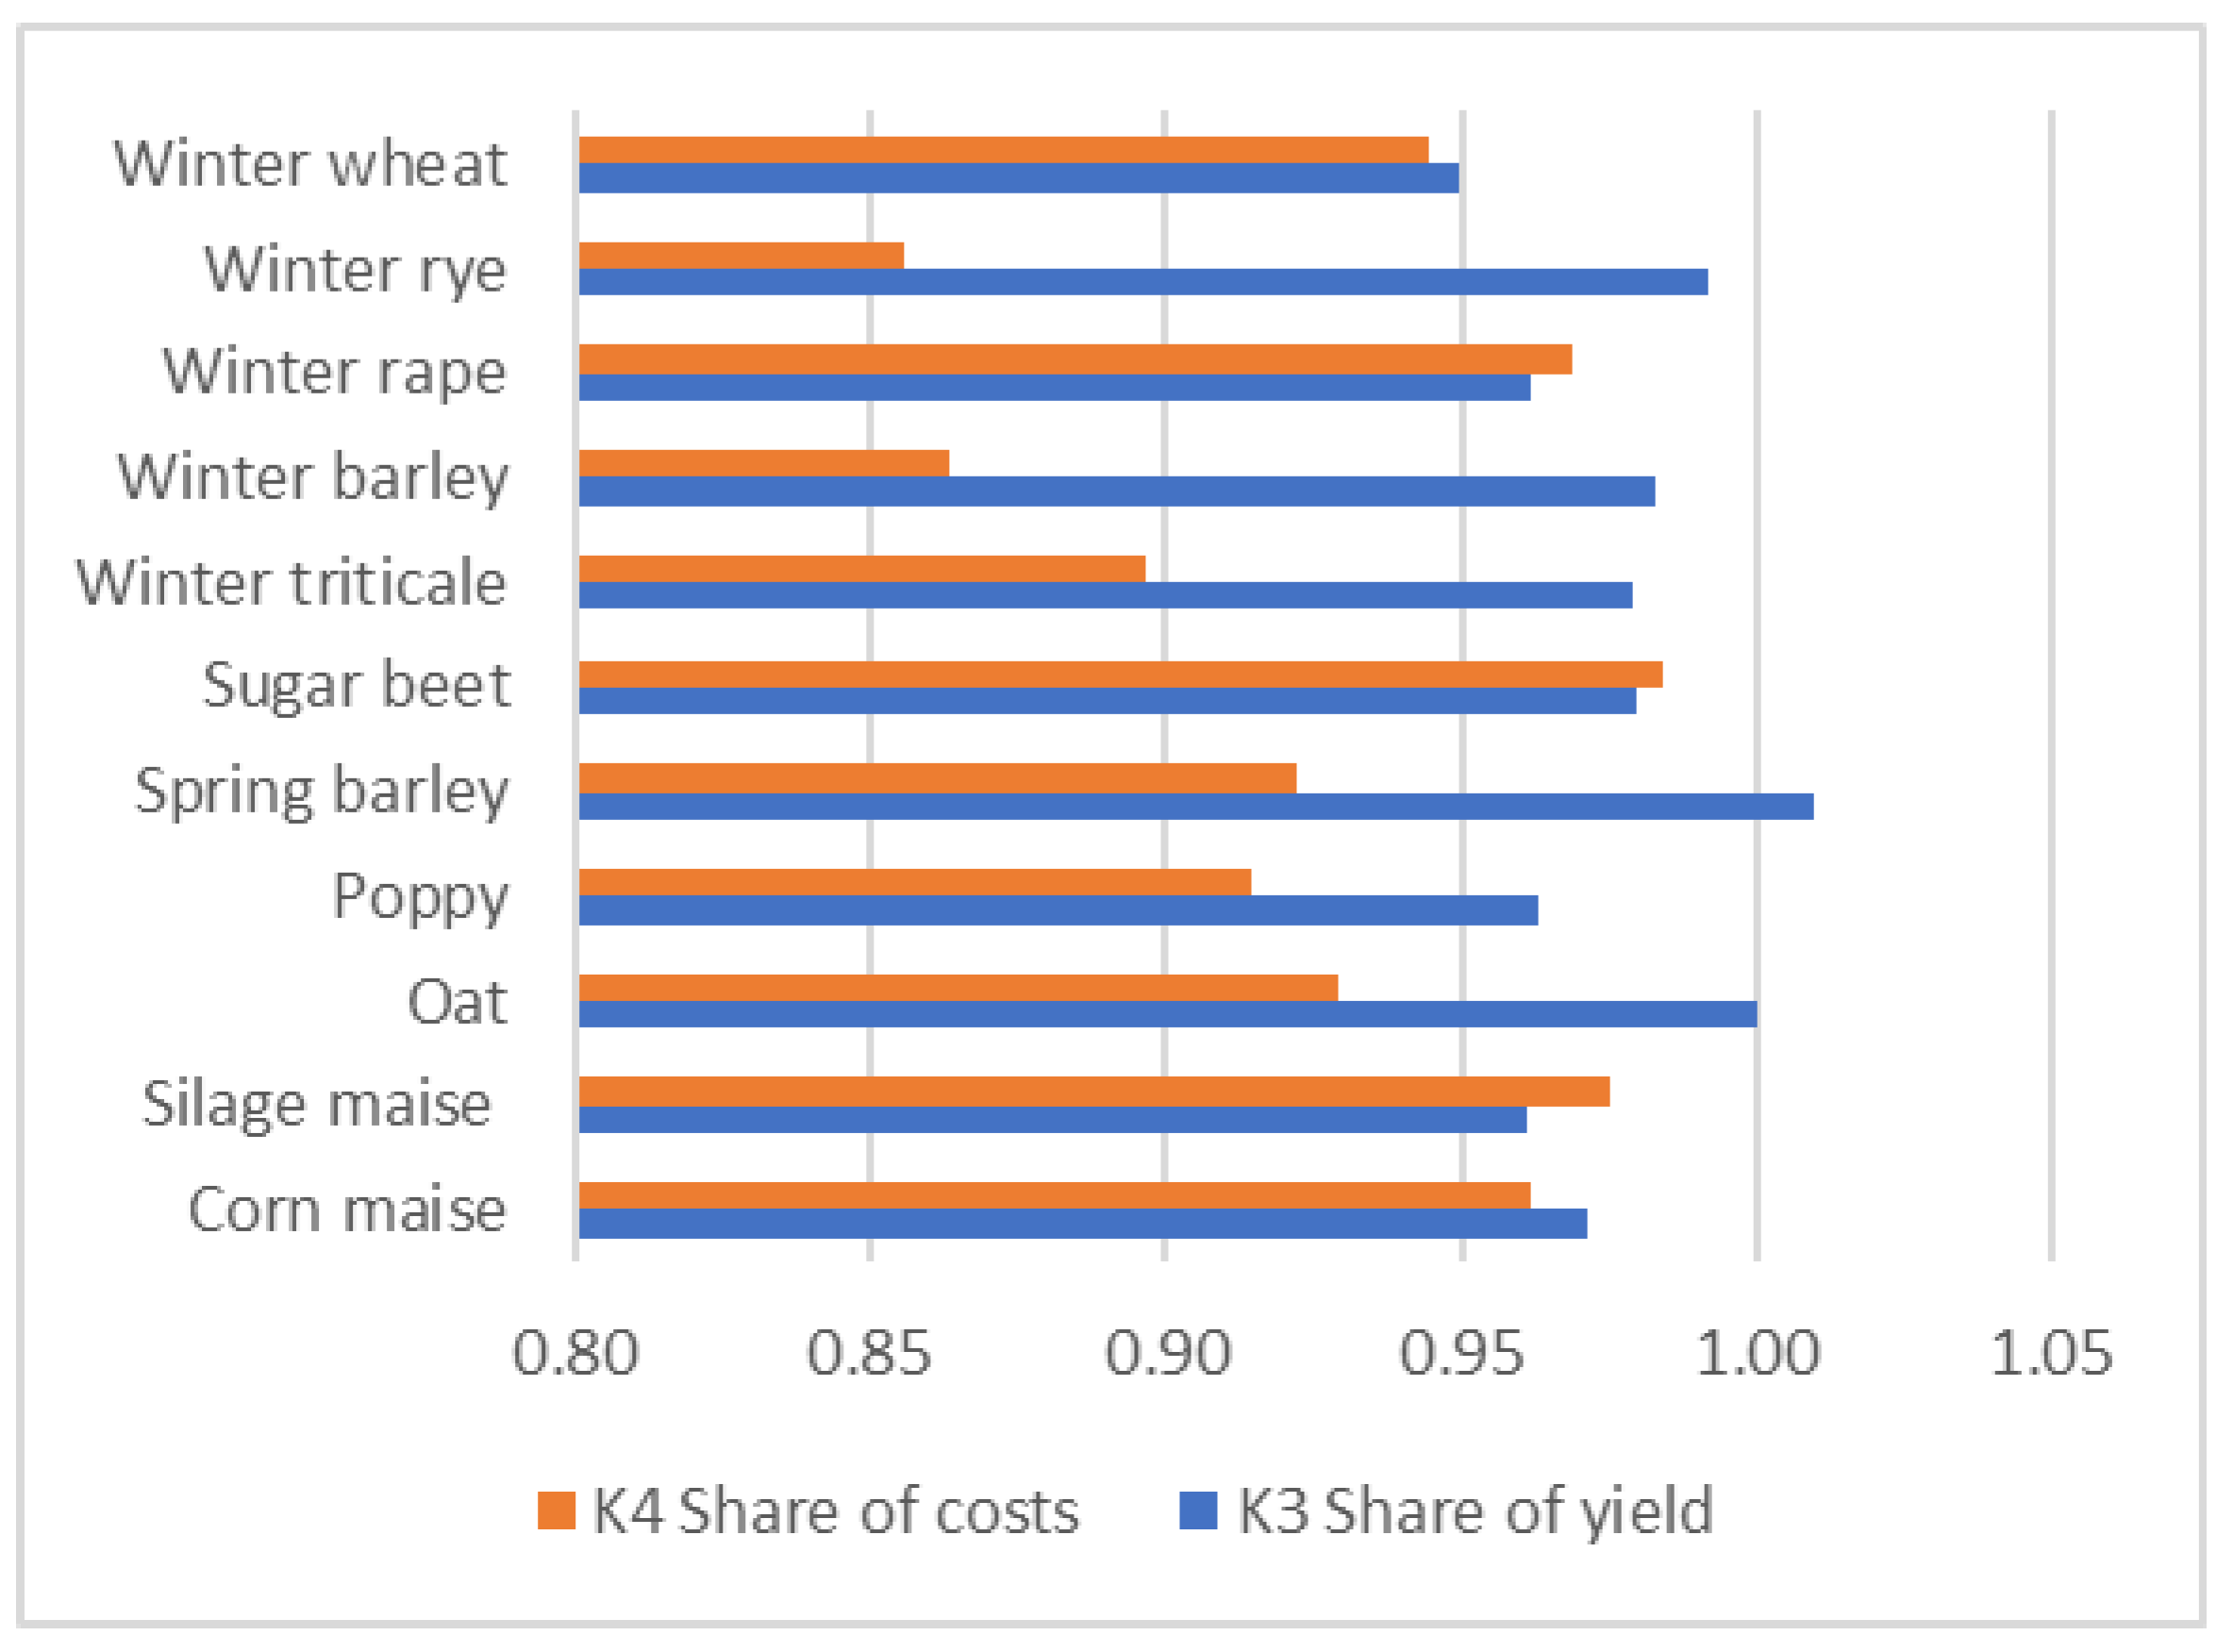
By the findings of other authors [50,51] lower yields of some crops with RT were found (K3 coefficient for sugar beet 0.94, silage maize 0.97, winter wheat 0.94, winter oilseed rape 0.97, winter barley 0.96), the yield increased in oats (1.05) and winter rye (1.05) (Figure 4).
The costs of RT for some crops (K4 coefficient for grain maize 0.96, silage maize 0.97, winter rape 0.97, winter wheat 0.94, sugar beet 0.98) showed a similar trend as for the evaluated yields (K3 coefficient). The question is therefore whether RT is economically effective. In contrast, for many crops, costs significantly decreased due to RT (winter rye 0.85, winter barley 0.86, winter triticale 0.89, spring barley 0.92, poppy 0.92, oat 0.93).
3.1.3. Evaluation of the Number of Plant Chemical Protections Depending on Tillage System
The total number of chemical protections (in the average of evaluated crops and tillage systems) of the evaluated data set ranged from 2.53 to 3.36 (Appendix B, Table A9). This parameter as well as the number of specific protections (herbicidal, fungicidal and mixed) were significantly influenced by an effect of the year. A tendency of increase in the number of fungicidal and mixed protections from 2003 until 2007 which increased in the total number of protections in this period was evident. Successive decrease of the number of total and most of the specific protections were recorded until 2010. Herbicidal protections took up the largest share of the total number of protections. On the other hand, lower values belonged to insecticidal and fungicidal protection. Pesticides are extensively used in modern agriculture and are an effective and economical way to enhance the yield quality and quantity [52]. Nevertheless, the majority of pesticides are toxic and non-biodegradable in nature and environmental implications are immense [23,53,54].
From Table A9 in Appendix B is also evident that the ratio of preventive/urgent protections was below 1 except for the year 2008. Many crop diseases are routinely controlled by preventive fungicides applied at regular intervals determined by the residual action of the active ingredient. Fungicide use sometimes can be reduced by using a disease ‘forecasting’ or ‘risk assessment’ model that evaluates conditions to determine suitability for infection. However, for some diseases detecting, the occurrence of favourable conditions may not allow time for control action [24].
Even though occurrences of pathogens and pests are considerably dependent on weather conditions, a clear connection between the number of protections (Appendix B, Table A9) and the mean air temperature or sums of precipitations in the years 2002–2010 (Appendix B, Table A8) was not evident. Changes in the number of protections and especially the decrease of them could have a relationship with an economic situation in the agriculture sector in 2002–2007 and subseqent financial crisis of 2008. This is in full agreement with studies demonstrating that costs and benefits drive use decisions for agricultural chemicals [55].
Table A10 in Appendix B shows a significantly lower number of total chemical protections at the no-till system in comparison with CT and RT systems which was based on lower herbicidal and fungicidal protection. Significant differences between CT and RT systems were recorded only for insecticides and fungicides but absolute differences were very small. There was no difference in the number of preventive protections, but a significantly lower number of urgent protections were detected at the no-till system. Our obtained results do not confirm findings of [56] that the conservation tillage systems have a higher reliance on herbicides. According to [57], no-till farming affects soil properties that control pesticide retention and interactions with soils, and ultimately their mobility in the environment. The concentration and load of pesticides are greater in runoff from no-till fields compared to the CT, especially pesticides with high solubility and low affinity for solids.
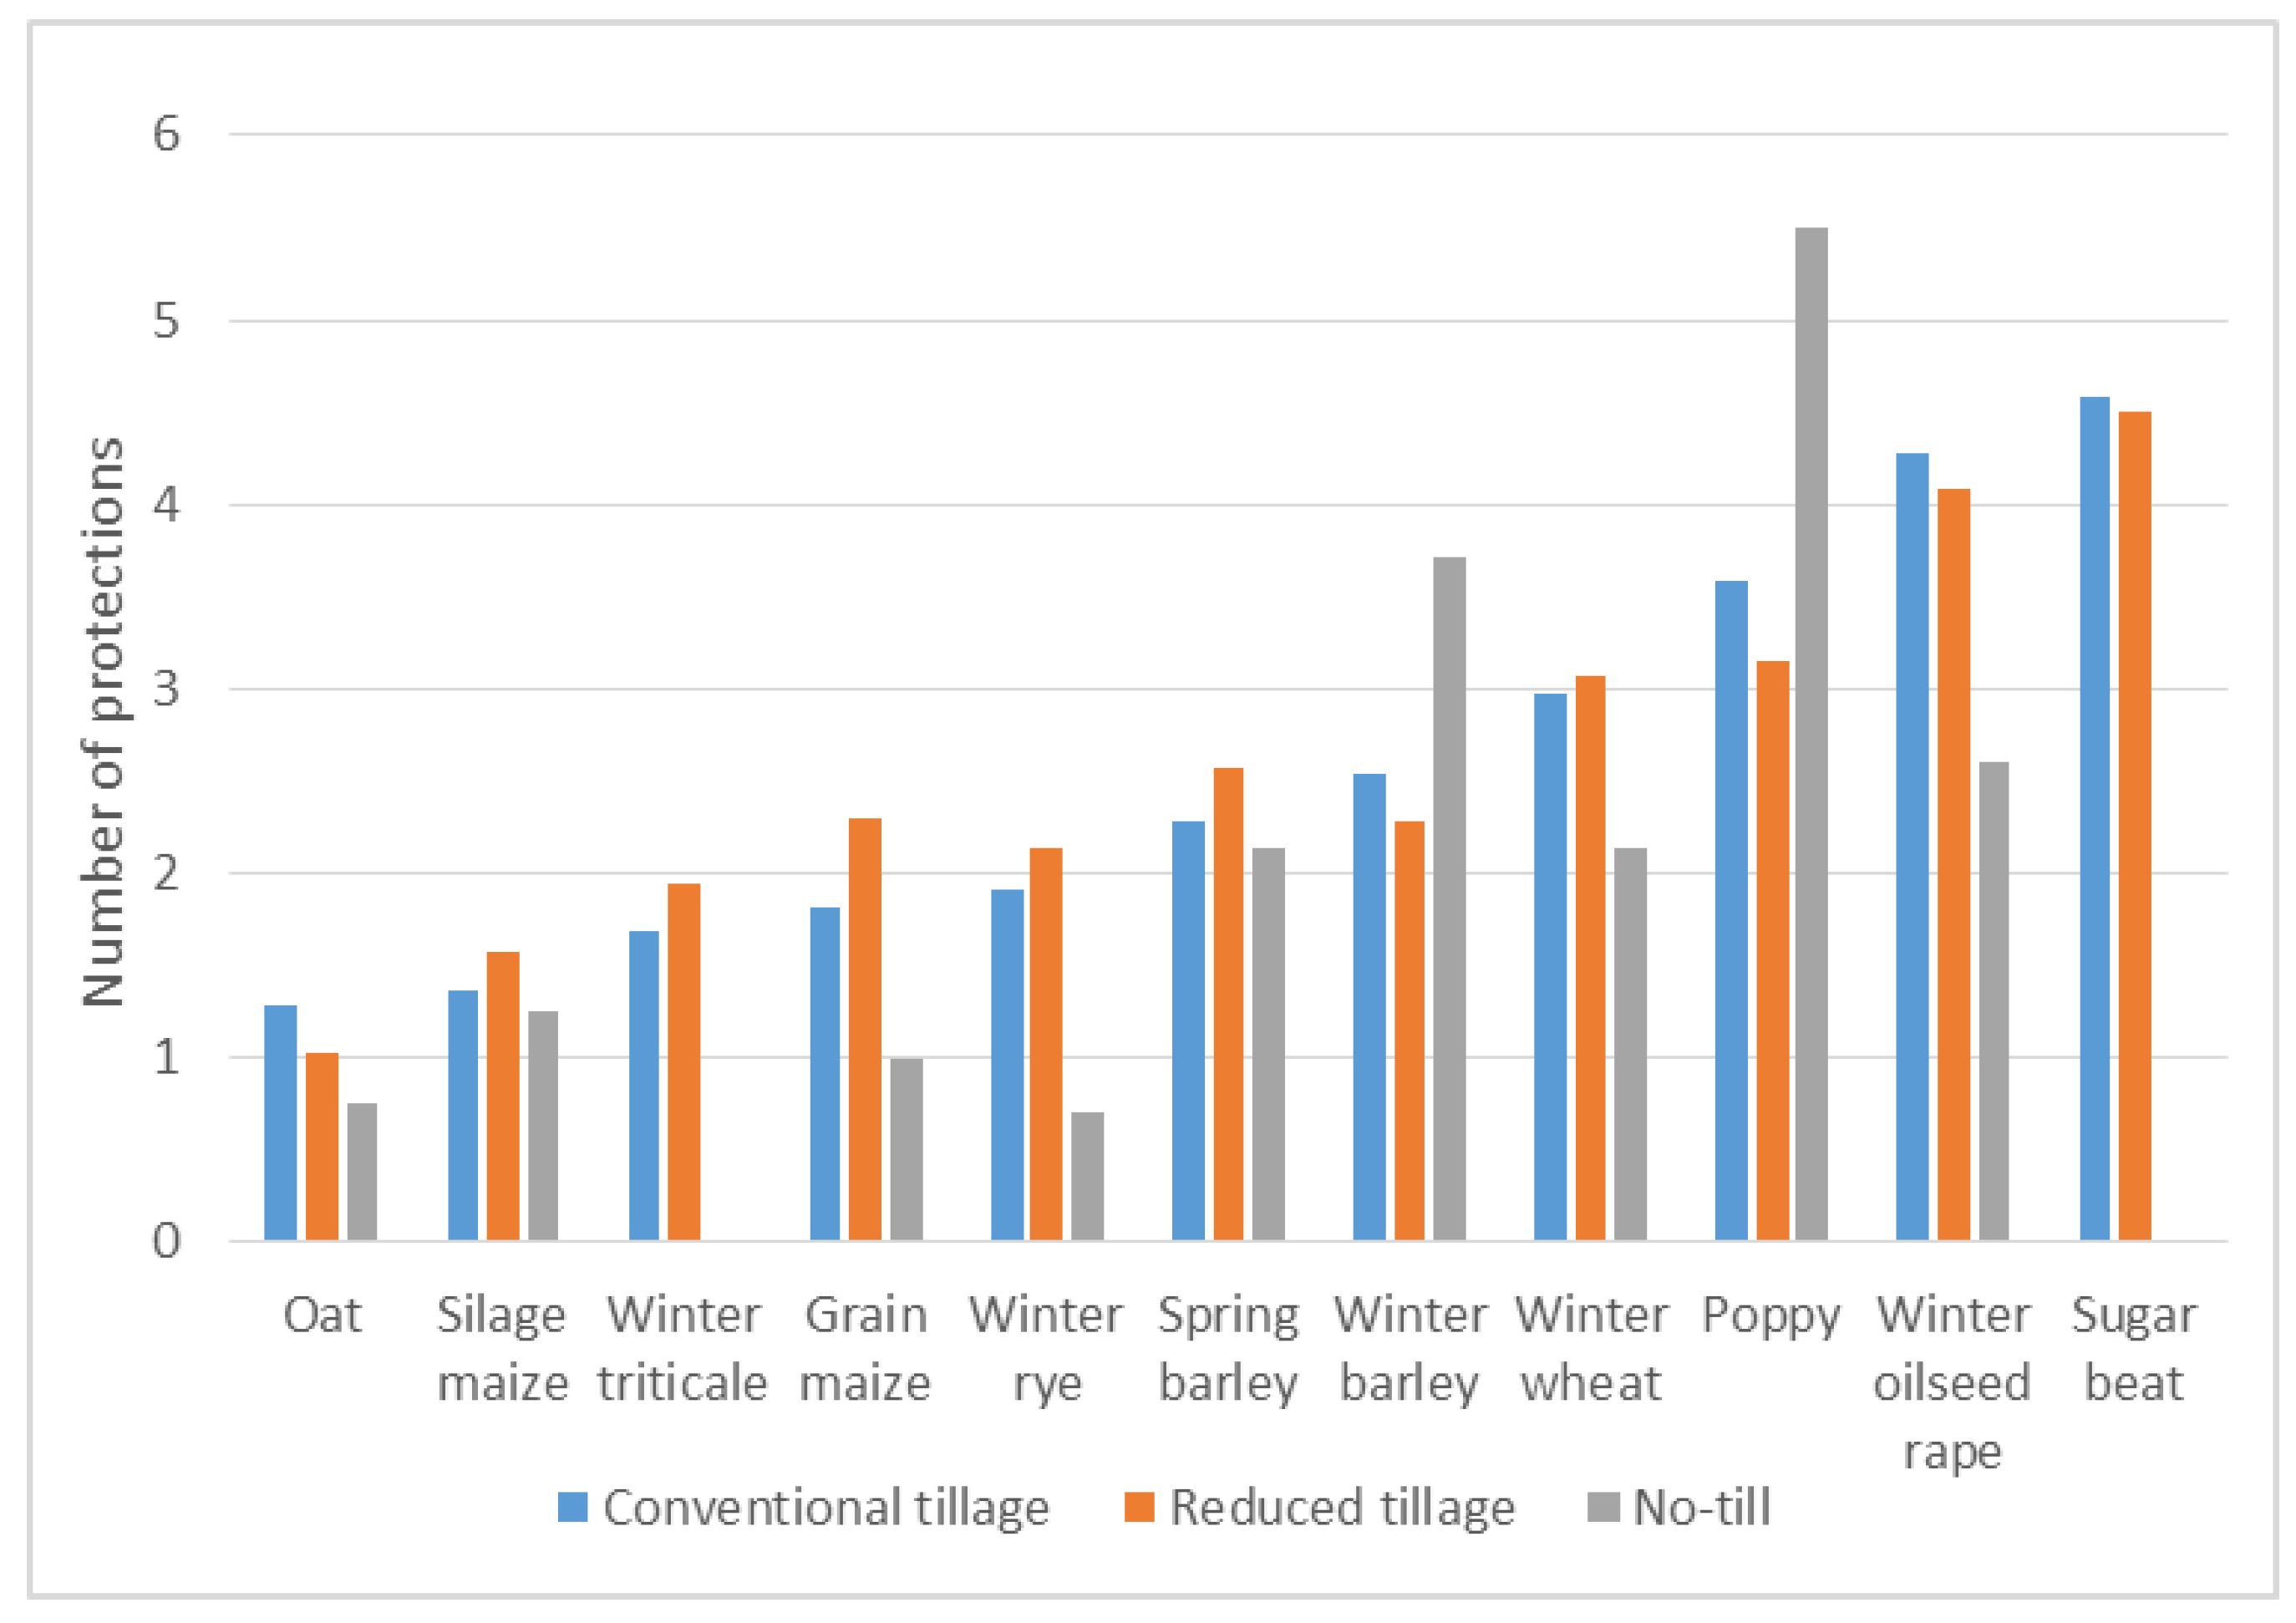
The number of chemical protections of evaluated crops cultivated in relation to different tillage systems is shown in Figure 5 and Table A11 and Table A12 in Appendix B. Despite the limited amount of data from the no-till system, a lower number of total protections is evident at the no-till system for most crops. In most cases, there was no difference between CT and RT system for the total number of protections as well as the number of preventive and urgent protections. However, a lower number of urgent protections was proved for winter wheat, winter oilseed rape and spring barley cultivated at the no-till system. Effect of tillage system on the yield of evaluated crops was not significant with the exception of higher yield of sugar beet and winter oilseed rape cultivated at CT. On the other hand, winter barley showed a higher yield at the no-till system. While there is demand for higher productivity of field crops, there also is increasing pressure to reduce the negative impacts of agriculture and its activities [24]. There is a growing awareness among farmers about the importance of soil for sustaining crop production and providing beneficial ecosystem services [56].
Even though pesticides represent less than one-sixth of the energy used in the production of many crops and energy use per hectare is decreasing, it is valuable to apply alternative pest control measures to reduce energy expenditures [27] and adverse environmental effects [58]. There is good potential to reduce both pesticide dose and the number of applications when they are utilized within competitive cropping systems. Diverse crop rotations, competitive cultivars, adequate crop seed rates, proper plant spacing, optimal planting dates, mechanical cultivation, specific fertilizer placement and cover crops have been identified as integral components of competitive cropping systems [27,59].
3.1.4. Evaluation of the Penetrometric Resistances of Soil and Other Parameters
The results in Table 1 demonstrate an overall positive effect of the number of CT carried out on the number of crop yields in the investigation, lower penetrometric resistance in topsoil and subsoil, reduced soil moisture in topsoil and increased number of chemical plant protection corresponding to higher crop intensity.
Water is usually the most limiting factor in agricultural production. Different agricultural management practices, such as tillage and the use of cover crops, can affect water infiltration into the soil [8,60]. A study [60] evaluating the effect of cover crops and tillage on soil water infiltration in maize suggests that cover crop management can increase soil water infiltration, which can improve soil quality and sustainability of production systems crops.
3.2. Evaluation of the Various Tillage and Inputs in Relation to GHG Emissions
The balance of GHG emissions according to CO2eq was processed according to standardized technological procedures of individual work operations [32]. Table 2 shows the values of GHG emissions in kg of CO2eq, when the increase in GHG emissions occurs in sugar beet.
Overall, CO2eq production according to the technical procedures used, except sugar beet, decreased by an average of 10% for all monitored crops. CO2eq production of sugar beet increased by 7.8%.
Many studies [2,17,61,62,63] state, that increased GHG emissions from intensive tillage are caused by some factors, in the particular increased biological activity of soil microorganisms and more intensive crop growth. Therefore, to maintain a sufficient amount of organic matter in the soil, there must be sufficient inputs of quality organic matter into the soil. The advantage of this approach is the economically advantageous provision of nitrogen, which is fixed in the plant biomass from plant or animal sources. When undecomposed organic matter is supplied, the formation of CO2 is accelerated due to the action of microorganisms without a corresponding increase in organic matter in the soil. The supply of organic matter to the subsoil with a RT method is ensured only by the root system of the crops and for this reason crops with a sufficiently large root system should be grown in these conditions. Alternatively, the supply of organic matter can be ensured by alternating tillage systems with the incorporation of quality organic matter into the soil. This corresponds to many studies. Data from a 50-year long-term field experiment for evaluating mainly soil organic carbon (SOC) content, crop sequence (monoculture vs. crop rotation) and tillage system (RT vs. CT) were analyzed for wheat yield [64]. The authors stated that the combination of RT and crop rotation improved soil fertility and crop productivity.
Soil organic carbon (SOC) sequestration into soil organic matter and crops biomass have recently drawn growing attention for its promise in mitigating rises in atmospheric CO2 concentrations [62]. Deep tillage increases the release of CO2 from soils, in addition, in modern highly mechanized crop systems, CO2 is emitted from a number of fuel-consuming operations [65].
Compared to CT, RT can improve the sequestration of SOC by reducing its decomposition in the soil [62,66]. For example observations [67] found that as soil processing intensity decreased, soil organic carbon sequestration increased. However, the results of [15] suggest that the SOC response in the transition to RT is significantly dependent on the initial SOC level.
3.3. The Overall Evaluation of the Impact of Tillage on the Intensity of Inputs, Yields, Economic and Energy Demands of Crop Production in Relation to GHG Emissions
The comprehensive results of the work are focused on the assessment of the relation between production processes and the production of GHG emissions.
Furthermore, solving the context of economic and energy impacts, including the influence of the environment on the consumption of inputs, such as the frequency of nitrogen fertilization and chemical protection in different methods of tillage in crop production.
The results of economic indicators according to the method of tillage are shown in Figure 6 (Table A13 in Appendix B).
The results show a considerable heterogeneity between yield, nitrogen dose and the number of chemical treatments. In some crops at RT, increased fertilization and chemical protection was found (winter wheat, silage maize, winter rape), in some crops there was a simultaneous decrease in nitrogen fertilization and chemical protection (poppy, winter barley). Some crops showed reduced fertilization but a higher degree of chemical protection (grain maize, triticale, winter rye, spring barley) and others lower chemical protection but higher fertilization rates (sugar beet, oat). Therefore, the results do not determine the clear impact of tillage on the evaluated factors. However, the most common crops (winter wheat, maize silage and winter rape) increase soil inputs with RT.
The main results of the comparison of economic and energy values are shown in Table 3.
Results in Table 3 show separately economic value difference RT-CT in division into SO COGS, and overall difference GMos. The values of SO decreased in all crops except oats, COGS values decreased in all crops. From an economic point of view, the use of RT is disadvantageous in grain maize and sugar beet, where a negative economic effect was achieved. Similarly, the energy values of ECOGS and EnSO and the total difference of EGMo are given. In energy emission, RT decreased costs for all crops except winter triticale, the energy value of crops was lower at RT for all crops except oats. Total EGMo was negative at RT for grain maize (−5376.8 MJ), silage maize (−1730 MJ), sugar beet (−7001 MJ), winter triticale (−7807.8 MJ) and winter wheat (−2607.1).
The energy requirements of different tillage systems and their impact on yield were compared by [68]. In their observations, the reduction of tillage practices resulted in lower energy consumption and soil protection against erosion, control of structural damage and reduction of time and energy required for seedbed preparation, which was confirmed by other studies.
Our evaluation shows that from an economic point of view, RT is beneficial for almost all crops and there is also a decrease in GHG emissions, but in energy values, there is an improvement in EGMo in only about half of the crops. The main reason is the different valuation of the production from an economic and energy point of view.
The results of the relation between economic, energy and environmental indicators for the whole Czech Republic based on the application to all ESEU are graphically shown in Figure 7, the values are given in Appendix B (Table A14).
A comprehensive comparison of the impacts in Figure 7 shows that rye, grain maize, triticale, spring barley, poppy and oats generally achieve better economic, energy and emission parameters of production based on the evaluation of CO2eq production by using RT compared to CT.
In all monitored respects, sugar beet achieves worse parameters if RT has been used in comparison with CT. Silage maize, winter wheat and winter oilseed rape achieve better CO2eq emission parameters with a deterioration in the economic and energy balance of production according to gross margin with overheads.
In the overall evaluation of tillage systems has been found that using RT leads to economic and energetic savings and a decrease in GHG emissions.
However, RT also brings some deficiencies. This is increased soil compaction in topsoil and subsoil, which increases with the decreasing number of CT. Increasing soil compaction leads to increased nitrogen fertilization of silage and grain maize, winter oilseed rape and winter barley. Increased nitrogen fertilization brings negative environmental impacts on the quality of groundwater and surface water. With a lower level of fertilization of nitrogen, yield losses would be increased, and the economic efficiency of RT would get worse.
4. Conclusions
RT leads to a technological reduction in the CO2eq production, mainly due to less energy-intensive technology. There is a significant reduction in CO2eq by about 10% and economic savings due to a significant reduction in costs at RT in comparison to reduce in the yields of most crops leading to increased gross margin. According to the presented results, there is also an increase in soil compaction, which can lead to related environmental problems due to the contamination of water and drying of the landscape.
From the evaluation of the number of chemical protections, a lower number of total protections was found at the no-till system for most crops. In most cases, there was no difference between CT and RT.
Overall, the choice of tillage should be taken into account of the local conditions as well as the assumptions of the forecast, on which the success of CT tillage depends. Due to the set of anti-erosion measures in the Czech Republic, which also limits the use of CT, it is necessary to further optimize the soil treatment also with regard to its compaction.
Optimizing tillage is an important aspect of the potential in terms of high yields and maintaining soil fertility while reducing the ecosystem pollution and the energy intensity of crop production. From this perspective, it is important to the complexity of the solution and the necessity of its further investigation.
Author Contributions
Conceptualization, V.V., methodology, V.V. and P.F.; software, M.H.; validation, V.V., J.W. and P.F.; formal analysis, J.W.; investigation, V.V.; resources, J.W. and P.F.; data curation, P.F. and V.V.; writing—original draft preparation, V.V., J.W. and P.F.; writing—review and editing, J.W.; visualization, V.V.; supervision, V.V.; project administration, V.V., J.W.; funding acquisition, V.V. and J.W. All authors have read and agreed to the published version of the manuscript.
Funding
Národní Agentura pro Zemědělský Výzkum, grant no QK1710307, institutional support of Ministry of agricultural, MZE-RO0418, “S” grant of the Ministry of Education, Youth and Sports of the Czech Republic.
Institutional Review Board Statement
Not applicable.
Data Availability Statement
All data are cited in references.
Acknowledgments
The paper was elaborated in the framework of the project of MoA QK1710307 “Economic support for strategic and decision-making processes at national and regional level leading to the optimal use of renewable energy sources, especially biomass, while respecting food selfsufficiency and soil protection”, institutional support of Ministry of agricultural, MZE-RO0418, “S” grant of the Ministry of Education, Youth and Sports of the Czech Republic. The authors acknowledge the support of the project.
Conflicts of Interest
The authors declare no conflict of interest.
Appendix A
Figure A1.
The map of climatic regions of the Czech Republic.
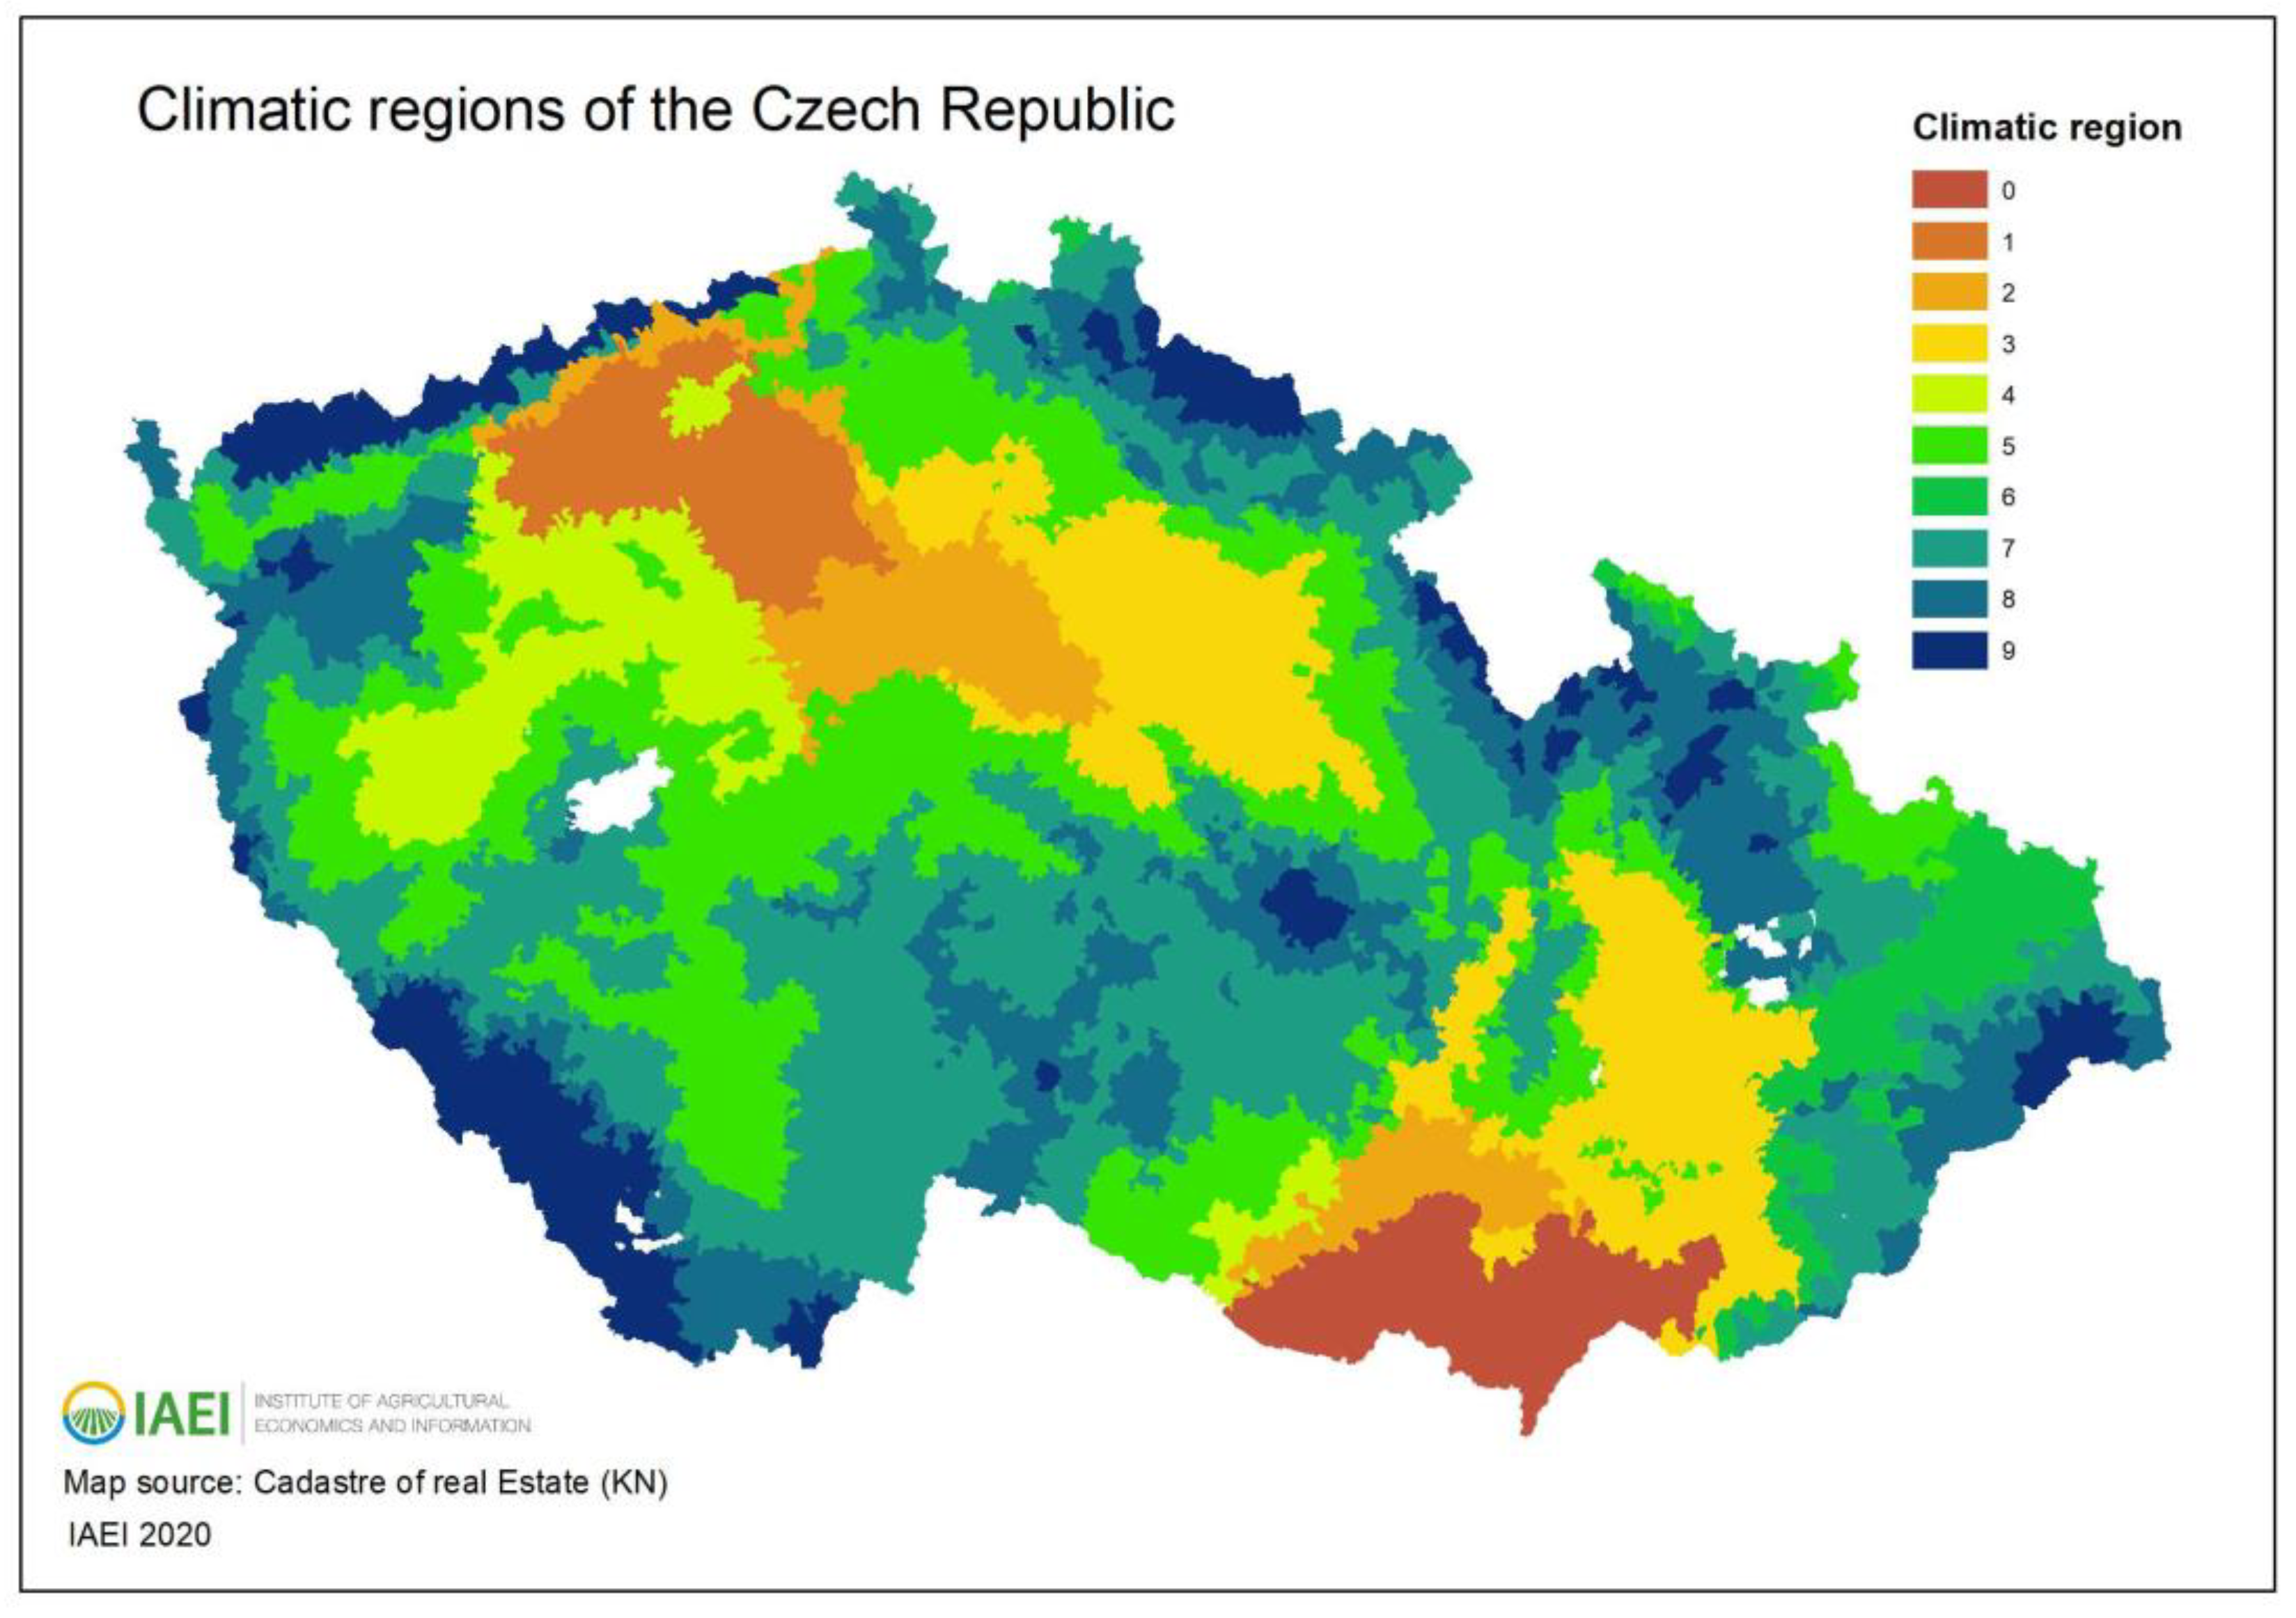
Figure A2.
The basic structure monitoring. Source: MDPI [69].
Figure A2.
The basic structure monitoring. Source: MDPI [69].

Figure A3.
Sources for economic, energy and environmental data. Source: MDPI [32].
Figure A3.
Sources for economic, energy and environmental data. Source: MDPI [32].

Appendix B

Table A1.
Energy of crop production.
| Crop | Product | Dry Matter Main Product % | Energy of Main Production (MJ/kg of Product) | By-Product Energy (MJ/kg of Product) |
|---|---|---|---|---|
| Potatoes | potatoes | 22 | 3.45 | 3 |
| Sugar beet | bulbs | 23 | 3.89 | 1.76 |
| Spring barley | grain | 85 | 15.93 | 13.73 |
| Spring barley malt | grain | 85 | 15.93 | 13.73 |
| Winter barley | grain | 85 | 15.48 | 13.73 |
| Silage maize | silage 32% | 32 | 5.984 | |
| Grain maize | grain | 85 | 16.21 | 13.5 |
| Poppy | grain | 85 | 15.48 | 13.69 |
| Oat | grain | 85 | 17.45 | 13.38 |
| Winter wheat | grain | 85 | 15.82 | 13.46 |
| Food wheat | grain | 85 | 15.82 | 13.46 |
| Winter rape | grain | 85 | 25.22 | 13.64 |
| Triticale | grain | 85 | 16.22 | 13.46 |
| Winter rye | grain | 85 | 15.48 | 13.46 |
Source: Preininger [70].
Table A2.
Used unit costs of materials.
| Inputs | Unit Price (EUR/Unit) | Unit |
|---|---|---|
| Oil | 0.98 | EUR/L |
| Work | 9.09 | EUR/hod |
| N | 1.55 | EUR/kg |
| P2O5 | 2.05 | EUR/kg |
| K2O | 1.09 | EUR/kg |
| MgO | 1.68 | EUR/kg |
| CaO | 0.36 | EUR/kg |
| Sulfur | 0.48 | EUR/kg |
| Chemicals | 89.73 | EUR/kg |
| Manure | 40.36 | EUR/t |
Source: Institute of agricultural economics and informations (IAEI).
Table A3.
Conversion factors for calculating the energy contained in machines.
| Machine Category | Value | Unit |
|---|---|---|
| Tractors | 95.7 | MJ/kg |
| Tillage machines | 99.2 | MJ/kg |
| Seeders | 95.4 | MJ/kg |
| Spreaders and sprayers | 95.4 | MJ/kg |
| Combine harvester | 83.5 | MJ/kg |
| Straw harvest | 95.4 | MJ/kg |
| Traffic machine | 83.5 | MJ/kg |
Source: Preininger [70].
Table A4.
Energy of used materials.
| Inputs | Value (MJ/Unit) | Unit |
|---|---|---|
| Oil | 40.7 | dm3 |
| Benzine | 41.5 | dm3 |
| Propane butane | 50.8 | kg |
| Natural gas | 33.8 | m3 |
| Lubricants | 45.2 | dm3 |
| Electrical energy | 9.6 | kWh |
| Coal | 27.8 | kg |
| Cereal seed | 8 | kg of seeds |
| Oilseeds, rape, flax | 5.7 | kg of seeds |
| Seed potatoes | 2 | kg of seed |
| Beet seed (batch of 100,000 seeds) | 172 | dose |
| Maize seed (50,000 seeds) | 16.2 | dose |
| N | 82.5 | kg |
| P2O5 | 17.7 | kg |
| K2O | 9.6 | kg |
Source: Preininger [70].
Table A5.
Price and energy of nutrients in cow manure.
| Nutrients | Nutrients’ kg/t 2 | Price EUR/kg 1 | Price Total EUR/t 1 | Energy MJ/t 3 |
|---|---|---|---|---|
| N | 5 | 1.55 | 7.73 | |
| P2O2 | 3.1 | 2.05 | 6.34 | |
| K2O | 7.1 | 1.09 | 7.75 | |
| Mg | 1.5 | 1.68 | 2.52 | |
| Ca | 4.5 | 0.36 | 1.62 | |
| S | 1 | 0.48 | 0.48 | |
| Total | 26.43 | 463 | ||
Source: 1 IAEI; 2,3 Preininger [70].
Table A6.
Basic information of crops under investigation.
| Crops | CT | RT | Ntotal kg/t of Product | Nmin | Number of Chemical Treatment | Yield (Moistness Unified) | Diference of Yield to Standard | Standardized Yield Production Function |
|---|---|---|---|---|---|---|---|---|
| Yes/No | Yes/No | kg/t | kg/t | Number | t/ha | t/ha | t/ha | |
| Sugar beet | 0 | 0 | 2.54 | 1.41 | 3.09 | 66.59 | 1.50 | 65.09 |
| Sugar beet | 0 | 1 | 2.83 | 1.64 | 4.51 | 59.25 | −1.36 | 60.61 |
| Sugar beet | 1 | 0 | 2.90 | 1.46 | 4.58 | 65.01 | −0.15 | 65.16 |
| Spring barley | 0 | 0 | 21.27 | 17.01 | 2.14 | 4.82 | 0.17 | 4.65 |
| Spring barley | 0 | 1 | 22.64 | 13.32 | 2.57 | 4.97 | −0.04 | 5.01 |
| Spring barley | 1 | 0 | 21.09 | 15.00 | 2.29 | 4.66 | −0.08 | 4.74 |
| Winter barley | 0 | 0 | 23.59 | 20.39 | 3.71 | 5.76 | −0.01 | 5.77 |
| Winter barley | 0 | 1 | 21.23 | 19.00 | 2.28 | 4.87 | −0.06 | 4.93 |
| Winter barley | 1 | 0 | 27.45 | 21.67 | 2.54 | 5.25 | 0.03 | 5.22 |
| Silage maize | 0 | 0 | 5.61 | 2.00 | 1.25 | 39.18 | 0.80 | 38.38 |
| Silage maize | 0 | 1 | 5.26 | 2.76 | 1.57 | 37.00 | −1.48 | 38.48 |
| Silage maize | 1 | 0 | 5.27 | 2.69 | 1.36 | 38.16 | 0.02 | 38.14 |
| Grain maize | 0 | 0 | 23.20 | 15.33 | 1.00 | 8.44 | 0.17 | 8.27 |
| Grain maize | 0 | 1 | 24.92 | 14.28 | 2.31 | 8.55 | −0.14 | 8.69 |
| Grain maize | 1 | 0 | 27.56 | 15.58 | 1.82 | 7.83 | 0.10 | 7.73 |
| Poppy | 0 | 0 | 176.22 | 108.79 | 5.50 | 0.79 | −0.11 | 0.90 |
| Poppy | 0 | 1 | 111.99 | 79.25 | 3.15 | 0.93 | 0.00 | 0.93 |
| Poppy | 1 | 0 | 163.07 | 91.37 | 3.58 | 0.90 | 0.03 | 0.87 |
| Oat | 0 | 0 | 26.11 | 16.30 | 0.75 | 3.93 | −0.24 | 4.18 |
| Oat | 0 | 1 | 21.13 | 19.26 | 1.03 | 3.74 | 0.05 | 3.69 |
| Oat | 1 | 0 | 22.81 | 17.81 | 1.29 | 3.91 | 0.05 | 3.85 |
| Winter wheat | 0 | 0 | 27.86 | 23.71 | 2.14 | 5.91 | −0.10 | 6.01 |
| Winter wheat | 0 | 1 | 27.08 | 23.26 | 3.07 | 5.96 | −0.16 | 6.12 |
| Winter wheat | 1 | 0 | 27.52 | 22.47 | 2.97 | 6.13 | 0.15 | 5.97 |
| Winter rape | 0 | 0 | 71.29 | 55.43 | 2.60 | 3.18 | −0.04 | 3.22 |
| Winter rape | 0 | 1 | 61.93 | 52.19 | 4.09 | 3.24 | −0.09 | 3.33 |
| Winter rape | 1 | 0 | 60.24 | 48.75 | 4.27 | 3.57 | 0.04 | 3.53 |
| Triticale | 0 | 0 | 24.99 | 21.15 | 1.79 | 5.18 | 0.06 | 5.12 |
| Triticale | 0 | 1 | 24.49 | 22.26 | 1.95 | 4.85 | −0.09 | 4.93 |
| Triticale | 1 | 0 | 25.98 | 23.38 | 1.69 | 4.82 | 0.02 | 4.81 |
| Winter rye | 0 | 0 | 26.30 | 17.64 | 0.71 | 4.13 | 0.00 | 4.12 |
| Winter rye | 0 | 1 | 20.15 | 19.46 | 2.14 | 4.65 | −0.03 | 4.69 |
| Winter rye | 1 | 0 | 28.49 | 24.54 | 1.92 | 4.14 | 0.01 | 4.14 |
Source: IAEI.
Table A7.
Description of the climatic regions.
| Region Numeric Code | Temperature Sum °C/Year | Temperature Average °C/Year | Rainfall Average mm/Year | Risk of Dry Years Coefficient | Moisture Security 1 Minimum, 10 Maximum |
|---|---|---|---|---|---|
| 0 | 3680 | 10.08 | 550 | 0.40 | 1.5 |
| 1 | 3430 | 9.40 | 450 | 0.50 | 1 |
| 2 | 3430 | 9.40 | 550 | 0.25 | 3 |
| 3 | 3380 | 9.26 | 600 | 0.15 | 5.5 |
| 4 | 3230 | 8.85 | 500 | 0.35 | 2 |
| 5 | 3080 | 8.44 | 600 | 0.23 | 7 |
| 6 | 3330 | 9.12 | 800 | 0.05 | 10 |
| 7 | 3030 | 8.30 | 700 | 0.10 | 10 |
| 8 | 2830 | 7.75 | 750 | 0.03 | 10 |
| 9 | 2680 | 7.34 | 850 | 0.00 | 10 |
Source: IAEI new calculation of temperature, [71].
Table A8.
Mean air temperature (°C) and sums of precipitation (mm) in years 2002–2010 in the Czech Republic (source: Czech Hydrometeorological Institute).
Table A8.
Mean air temperature (°C) and sums of precipitation (mm) in years 2002–2010 in the Czech Republic (source: Czech Hydrometeorological Institute).
| Mean Air Temperature | Sums of Precipitation | |||
|---|---|---|---|---|
| °C | mm | |||
| Year | April–September | January–December | April–September | January–December |
| 2002 | 14.9 | 8.7 | 505 | 855 |
| 2003 | 15.5 | 8.2 | 288 | 504 |
| 2004 | 13.9 | 7.8 | 359 | 666 |
| 2005 | 14.3 | 7.7 | 453 | 720 |
| 2006 | 14.9 | 8.2 | 448 | 703 |
| 2007 | 15.0 | 9.1 | 431 | 741 |
| 2008 | 14.4 | 8.9 | 372 | 619 |
| 2009 | 15.2 | 8.4 | 412 | 744 |
| 2010 | 14.1 | 7.2 | 607 | 867 |
| Long-term averages | 13.5 | 7.5 | 414 | 674 |
Table A9.
Number of chemical protections in 2002–2010; average of three tillage systems and eleven crops.
Table A9.
Number of chemical protections in 2002–2010; average of three tillage systems and eleven crops.
| Number of Protections | ||||||||
|---|---|---|---|---|---|---|---|---|
| Year | n | H | I | F | M | T | P | U |
| 2002 | 372 | 1.01 a | 0.30 | 0.62 abcd | 0.72 ac | 2.65 ab | 1.23 a | 1.41 a |
| 2003 | 356 | 1.22 abcd | 0.20 | 0.60 abcd | 0.50 d | 2.53 b | 1.15 a | 1.37 b |
| 2004 | 370 | 1.25 cd | 0.23 | 0.68 abc | 0.68 ad | 2.84 abc | 1.32 a | 1.51 c |
| 2005 | 351 | 1.06 abc | 0.31 | 0.71 abc | 0.88 ab | 2.96 ac | 1.37 a | 1.59 ab |
| 2006 | 343 | 1.24 bcd | 0.33 | 0.73 bc | 0.93 ab | 3.22 cd | 1.32 a | 1.91 bc |
| 2007 | 369 | 1.33 d | 0.29 | 0.74 c | 1.00 bd | 3.36 d | 1.35 a | 2.01 c |
| 2008 | 418 | 1.02 ab | 0.26 | 0.46 d | 1.20 d | 2.94 ac | 2.05 b | 0.89 d |
| 2009 | 408 | 1.17 abcd | 0.23 | 0.56 ad | 0.87 ab | 2.84 ab | 1.33 a | 1.50 a |
| 2010 | 394 | 1.07 abc | 0.20 | 0.57 abd | 0.83 ab | 2.68 ab | 1.19 a | 1.49 a |
| P | 0.000 | 0.039 | 0.000 | 0.000 | 0.000 | 0.000 | 0.000 | |
P: probability; different letters indicate significant differences for Tukey HSD (α = 0.05); H—herbicides, I—insecticides, F—fungicides, M—mixed and T—total protections; P—preventive and U—urgent protections.
Table A10.
Number of chemical protections of evaluated tillage systems; average of years 2002–2010 and eleven crops.
Table A10.
Number of chemical protections of evaluated tillage systems; average of years 2002–2010 and eleven crops.
| Number of Protections | ||||||||
|---|---|---|---|---|---|---|---|---|
| Tillage System | n | H | I | F | M | T | P | U |
| CT | 1992 | 1.17 a | 0.29 a | 0.61 a | 0.82 | 2.88 a | 1.39 | 1.49 a |
| RT | 1291 | 1.16 a | 0.22 b | 0.68 b | 0.89 | 2.95 a | 1.35 | 1.60 a |
| No-till | 98 | 0.66 b | 0.19 ab | 0.28 c | 0.97 | 2.10 b | 1.46 | 0.64 b |
| P | ˂0.000 | 0.007 | ˂0.000 | 0.145 | ˂0.000 | 0.616 | ˂0.000 | |
P: probability; different letters indicate significant differences for Tukey HSD (α = 0.05); CT—conventional tillage, RT—reduced tillage, H—herbicides, I—insecticides, F—fungicides, M—mixed and T—total protections; P—preventive and U—urgent protections.
Table A11.
Number of chemical protections of evaluated winter crops cultivated at different tillage systems; average of years 2002–2010.
Table A11.
Number of chemical protections of evaluated winter crops cultivated at different tillage systems; average of years 2002–2010.
| Crop | Tillage System | Number of Protections | Yield | |||||||
|---|---|---|---|---|---|---|---|---|---|---|
| n | H | I | F | M | T | P | U | t/ha | ||
| Winter wheat | CT | 580 | 0.99 a | 0.06 | 0.97 a | 0.95 | 2.97 a | 1.51 | 1.46 a | 6.13 |
| RT | 594 | 0.95 a | 0.05 | 0.96 a | 1.11 | 3.07 a | 1.48 | 1.59 a | 5.96 | |
| No-till | 35 | 0.63 b | 0.00 | 0.40 b | 1.11 | 2.14 b | 1.63 | 0.51 b | 5.91 | |
| P | 0.025 | 0.356 | ˂0.000 | 0.092 | 0.001 | 0.793 | ˂0.000 | 0.103 | ||
| Winter barley | CT | 127 | 0.91 | 0.06 | 0.69 | 0.89 a | 2.54 a | 1.57 | 0.97 a | 5.25 ab |
| RT | 58 | 0.98 | 0.02 | 0.90 | 0.38 b | 2.28 a | 1.26 | 1.02 a | 4.87 a | |
| No-till | 7 | 0.57 | 0.00 | 0.86 | 2.29 c | 3.71 b | 1.43 | 2.29 b | 5.76 b | |
| P | 0.197 | 0.422 | 0.119 | ˂0.000 | 0.007 | 0.270 | 0.009 | 0.025 | ||
| Winter rye | CT | 37 | 0.84 ab | 0.00 | 0.59 a | 0.46 | 1.92 a | 1.16 | 0.76 | 4.14 |
| RT | 7 | 1.14 a | 0.00 | 0.43 ab | 0.57 | 2.14 a | 1.43 | 0.71 | 4.65 | |
| No-till | 7 | 0.43 b | 0.00 | 0.00 b | 0.29 | 0.71 b | 0.71 | 0.00 | 4.13 | |
| P | 0.050 | - | 0.013 | 0.749 | 0.016 | 0.258 | 0.065 | 0.602 | ||
| Winter triticale | CT | 32 | 0.94 | 0.03 | 0.13 a | 0.59 | 1.69 | 1.34 | 0.34 | 4.82 |
| RT | 20 | 0.90 | 0.05 | 0.60 b | 0.40 | 1.95 | 1.30 | 0.65 | 4.85 | |
| No-till | 0 | - | - | - | - | - | - | - | - | |
| P | 0.869 | 0.738 | 0.001 | 0.372 | 0.404 | 0.873 | 0.245 | 0.613 | ||
| Winter oilseed rape | CT | 166 | 0.95 a | 1.40 a | 0.42 | 1.51 | 4.27 a | 2.13 | 2.14 a | 3.57 a |
| RT | 315 | 1.27 b | 1.08 b | 0.34 | 1.40 | 4.09 a | 2.04 | 2.05 a | 3.24 b | |
| No-till | 20 | 0.60 a | 0.75 b | 0.35 | 0.90 | 2.60 b | 1.80 | 0.80 b | 3.18 b | |
| P | ˂0.000 | ˂0.000 | 0.364 | 0.200 | 0.002 | 0.772 | 0.015 | ˂0.000 | ||
P: probability; different letters indicate significant differences for Tukey HSD (α = 0.05); CT—conventional tillage, RT—reduced tillage, H—herbicides, I—insecticides, F—fungicides, M—mixed and T—total protections; P—preventive and U—urgent protections.
Table A12.
Number of chemical protections of evaluated spring crops cultivated at different tillage systems; average of years 2002–2010.
Table A12.
Number of chemical protections of evaluated spring crops cultivated at different tillage systems; average of years 2002–2010.
| Crop | Tillage System | Number of Protections | Yield | |||||||
|---|---|---|---|---|---|---|---|---|---|---|
| n | H | I | F | M | T | P | U | t/ha | ||
| Spring barley | CT | 167 | 0.80 a | 0.03 | 0.70 a | 0.77 | 2.29 a | 0.97 ab | 1.32 a | 4.66 |
| RT | 287 | 1.00 b | 0.04 | 0.75 a | 0.78 | 2.57 b | 0.75 a | 1.82 a | 4.97 | |
| No-till | 7 | 0.57 ab | 0.00 | 0.00 b | 1.57 | 2.14 ab | 1.86 b | 0.29 b | 4.82 | |
| P | 0.001 | 0.743 | 0.018 | 0.093 | 0.015 | 0.011 | ˂0.000 | 0.092 | ||
| Oat | CT | 24 | 1.29 | 0.00 | 0.00 | 0.00 | 1.29 | 0.75 | 0.54 | 3.91 |
| RT | 30 | 1.03 | 0.00 | 0.00 | 0.00 | 1.03 | 0.40 | 0.63 | 3.74 | |
| No-till | 4 | 0.75 | 0.00 | 0.00 | 0.00 | 0.75 | 0.75 | 0.00 | 3.93 | |
| P | 0.296 | - | - | - | 0.296 | 0.271 | 0.218 | 0.827 | ||
| Grain maize | CT | 67 | 1.15 | 0.40 | 0.00 | 0.25 | 1.82 a | 0.90 | 0.93 | 7.83 |
| RT | 49 | 1.43 | 0.53 | 0.00 | 0.35 | 2.31 b | 1.29 | 1.02 | 8.55 | |
| No-till | 2 | 1.00 | 0.00 | 0.00 | 0.00 | 1.00 ab | 1.00 | 0.00 | 8.44 | |
| P | 0.088 | 0.292 | - | 0.608 | 0.014 | 0.221 | 0.387 | 0.153 | ||
| Silage maize | CT | 281 | 1.03 a | 0.10 a | 0.00 | 0.23 | 1.36 | 0.81 | 0.55 | 38.16 |
| RT | 97 | 1.25 b | 0.21 b | 0.02 | 0.09 | 1.57 | 1.01 | 0.56 | 37.00 | |
| No-till | 12 | 0.83 ab | 0.25 ab | 0.00 | 0.17 | 1.25 | 0.83 | 0.42 | 39.18 | |
| P | 0.005 | 0.021 | 0.242 | 0.098 | 0.061 | 0.106 | 0.838 | 0.531 | ||
| Poppy | CT | 53 | 1.96 | 0.23 | 0.57 | 0.83 a | 3.58 | 1.26 | 2.32 | 0.90 |
| RT | 71 | 1.54 | 0.23 | 0.38 | 1.01 a | 3.15 | 1.25 | 1.90 | 0.93 | |
| No-till | 2 | 1.50 | 0.50 | 0.00 | 3.50 b | 5.50 | 2.50 | 3.00 | 0.79 | |
| P | 0.185 | 0.707 | 0.132 | 0.001 | 0.139 | 0.467 | 0.422 | 0.338 | ||
| Sugar beet | CT | 176 | 3.02 | 0.09 | 0.90 | 0.57 | 4.58 | 1.53 | 3.05 | 65.01 a |
| RT | 47 | 3.30 | 0.13 | 0.79 | 0.30 | 4.51 | 1.00 | 3.51 | 59.25 b | |
| No-till | 0 | - | - | - | - | - | - | - | - | |
| P | 0.212 | 0.455 | 0.271 | 0.075 | 0.780 | 0.211 | 0.175 | 0.023 | ||
P: probability; different letters indicate significant differences for Tukey HSD (α = 0.05); CT—conventional tillage, RT—reduced tillage, H—herbicides, I—insecticides, F—fungicides, M—mixed and T—total protections; P—preventive and U—urgent protections.
Table A13.
Coefficients of mineral N, chemical treatment, yields.
| Crops | K1 | K2 | K3 |
|---|---|---|---|
| Sugar beet | 1.13 | 0.93 | 0.98 |
| Spring barley | 0.89 | 1.10 | 1.01 |
| Winter barley | 0.88 | 0.85 | 0.98 |
| Silage maize | 1.02 | 1.13 | 0.96 |
| Grain maize | 0.92 | 1.21 | 0.97 |
| Poppy seeds | 0.87 | 0.83 | 0.96 |
| Oat | 1.08 | 0.92 | 1.00 |
| Winter wheat | 1.04 | 1.01 | 0.95 |
| Winter rape | 1.07 | 1.01 | 0.96 |
| Triticale | 0.95 | 1.16 | 0.98 |
| Winter rye | 0.79 | 1.01 | 0.99 |
Table A14.
Coefficients’ value of economic and environmental indicators.
| K1 (Coeff. of Mineral N) | K2 (Coeff. of Chemical Treatment) | K3 (Crop Yield) | K4 (Costs) | KE1 (CO2eq Coeff.) | KE2 (Energy Coeff.) | |
|---|---|---|---|---|---|---|
| Grain maize | 0.95 | 1.26 | 0.97 | 0.96 | 0.92 | 0.97 |
| Silage maize | 1.04 | 1.14 | 0.96 | 0.98 | 0.95 | 0.99 |
| Oat | 1.07 | 0.91 | 1.00 | 0.93 | 0.87 | 1.03 |
| Poppy | 0.87 | 0.83 | 0.96 | 0.91 | 0.97 | 1.08 |
| Spring barley | 0.89 | 1.11 | 1.01 | 0.92 | 0.92 | 1.02 |
| Sugar beet | 1.15 | 0.95 | 0.98 | 0.98 | 0.99 | 0.98 |
| Winter triticale | 0.98 | 1.19 | 0.98 | 0.90 | 0.92 | 0.94 |
| Winter barley | 0.89 | 0.86 | 0.98 | 0.86 | 0.98 | 1.02 |
| Winter rape | 1.09 | 1.03 | 0.96 | 0.97 | 0.87 | 1.04 |
| Winter rye | 0.80 | 1.01 | 0.99 | 0.86 | 0.95 | 1.03 |
| Winter wheat | 1.06 | 1.04 | 0.95 | 0.94 | 0.96 | 0.98 |
References
- Lemaire, G.; Franzluebbers, A.; de Faccio Carvalho, P.C.; Dedieu, B. Integrated crop-livestock systems: Strategies to achieve synergy between agricultural production and environmental quality. Agric. Ecosyst. Environ. 2014, 190, 4–8. [Google Scholar] [CrossRef]
- Doran, J.W.; Elliott, E.T.; Paustian, K. Soil microbial activity, nitrogen cycling, and long-term changes in organic carbon pools as related to fallow tillage management. Soil Tillage Res. 1998, 49, 3–18. [Google Scholar] [CrossRef]
- Liu, E.; Teclemariam, S.G.; Yan, C.; Yu, J.; Gu, R.; Liu, S.; He, W.; Liu, Q. Long-term effects of no-tillage management practice on soil organic carbon and its fractions in the northern China. Geoderma 2014, 213, 379–384. [Google Scholar] [CrossRef]
- Francaviglia, R.; Álvaro-Fuentes, J.; Di Bene, C.; Gai, L.; Regina, K.; Turtola, E. Diversification and management practices in selected European regions. A data analysis of arable crops production. Agronomy 2020, 10, 297. [Google Scholar] [CrossRef] [Green Version]
- Bindraban, P.S.; van der Velde, M.; Ye, L.; van den Berg, M.; Materechera, S.; Kiba, D.I.; Tamene, L.; Ragnarsdóttir, K.V.; Jongschaap, R.; Hoogmoed, M.; et al. Assessing the impact of soil degradation on food production. Curr. Opin. Environ. Sustain. 2012, 4, 478–488. [Google Scholar] [CrossRef]
- Scherer, L.A.; Verburg, P.H.; Schulp, C.J.E. Opportunities for sustainable intensification in European agriculture. Glob. Environ. Chang. 2018, 48, 43–55. [Google Scholar] [CrossRef]
- Corrochano-Monsalve, M.; Huérfano, X.; Menéndez, S.; Torralbo, F.; Fuertes-Mendizábal, T.; Estavillo, J.M.; González-Murua, C. Relationship between tillage management and DMPSA nitrification inhibitor efficiency. Sci. Total Environ. 2020, 718. [Google Scholar] [CrossRef]
- Haruna, S.I.; Nkongolo, N.V. Influence of cover crop, tillage, and crop rotation management on soil nutrients. Agriculture 2020, 10, 225. [Google Scholar] [CrossRef]
- Simić, M.; Dragičević, V.; Mladenović Drinić, S.; Vukadinović, J.; Kresović, B.; Tabaković, M.; Brankov, M. The Contribution of Soil Tillage and Nitrogen Rate to the Quality of Maize Grain. Agronomy 2020, 10, 976. [Google Scholar] [CrossRef]
- Lal, R.; Reicosky, D.C.; Hanson, J.D. Evolution of the plow over 10,000 years and the rationale for no-till farming. Soil Tillage Res. 2007, 93, 1–12. [Google Scholar] [CrossRef]
- Schlüter, S.; Großmann, C.; Diel, J.; Wu, G.M.; Tischer, S.; Deubel, A.; Rücknagel, J. Long-term effects of conventional and reduced tillage on soil structure, soil ecological and soil hydraulic properties. Geoderma 2018, 332, 10–19. [Google Scholar] [CrossRef]
- Blanco-Canqui, H.; Wortmann, C.S. Does occasional tillage undo the ecosystem services gained with no-till? A review. Soil Tillage Res. 2020, 198, 104534. [Google Scholar] [CrossRef]
- Curci, M.; Pizzigallo, M.D.R.; Crecchio, C.; Mininni, R.; Ruggiero, P. Effects of conventional tillage on biochemical properties of soils. Biol. Fertil. Soils 1997, 25, 1–6. [Google Scholar] [CrossRef]
- Abdalla, M.; Osborne, B.; Lanigan, G.; Forristal, D.; Williams, M.; Smith, P.; Jones, M.B. Conservation tillage systems: A review of its consequences for greenhouse gas emissions. Soil Use Manag. 2013, 29, 199–209. [Google Scholar] [CrossRef]
- Tan, Z.; Liu, S.; Li, Z.; Loveland, T.R. Simulated responses of soil organic carbon stock to tillage management scenarios in the Northwest Great Plains. Carbon Balance Manag. 2007, 2. [Google Scholar] [CrossRef] [Green Version]
- Guardia, G.; Tellez-Rio, A.; García-Marco, S.; Martin-Lammerding, D.; Tenorio, J.L.; Ibáñez, M.Á.; Vallejo, A. Effect of tillage and crop (cereal versus legume) on greenhouse gas emissions and Global Warming Potential in a non-irrigated Mediterranean field. Agric. Ecosyst. Environ. 2016, 221, 187–197. [Google Scholar] [CrossRef]
- Stošić, M.; Ivezić, V.; Tadić, V. Tillage systems as a function of greenhouse gas (GHG) emission and fuel consumption mitigation. Environ. Sci. Pollut. Res. 2021, 28, 16492–16503. [Google Scholar] [CrossRef] [PubMed]
- Rochette, P. No-till only increases N2O emissions in poorly-aerated soils. Soil Tillage Res. 2008, 101, 97–100. [Google Scholar] [CrossRef]
- Plaza-Bonilla, D.; Álvaro-Fuentes, J.; Bareche, J.; Pareja-Sánchez, E.; Justes, É.; Cantero-Martínez, C. No-tillage reduces long-term yield-scaled soil nitrous oxide emissions in rainfed Mediterranean agroecosystems: A field and modelling approach. Agric. Ecosyst. Environ. 2018, 262, 36–47. [Google Scholar] [CrossRef]
- Ozkan, B.; Akcaoz, H.; Fert, C. Energy input-output analysis in Turkish agriculture. Renew. Energy 2004, 29, 39–51. [Google Scholar] [CrossRef]
- Gołębiowska, H.; Pląskowska, E.; Weber, R.; Kieloch, R. The effect of soil tillage and herbicide treatments on the incidence of Fusarium fungi genus in the grain of rye. Plant Soil Environ. 2016, 62, 435–440. [Google Scholar] [CrossRef] [Green Version]
- Krupinsky, J.M.; Tanaka, D.L.; Merrill, S.D.; Liebig, M.A.; Lares, M.T.; Hanson, J.D. Crop Sequence Effects on Leaf Spot Diseases of No-Till Spring Wheat. Agron. J. 2007, 99, 912–920. [Google Scholar] [CrossRef]
- Sharma, A.; Shukla, A.; Attri, K.; Kumar, M.; Kumar, P.; Suttee, A.; Singh, G.; Barnwal, R.P.; Singla, N. Global trends in pesticides: A looming threat and viable alternatives. Ecotoxicol. Environ. Saf. 2020, 201, 110812. [Google Scholar] [CrossRef]
- Strand, J.F. Some agrometeorological aspects of pest and disease management for the 21st century. Agric. For. Meteorol. 2000, 103, 73–82. [Google Scholar] [CrossRef]
- Stehle, S.; Schulz, R. Agricultural insecticides threaten surface waters at the global scale. Proc. Natl. Acad. Sci. USA 2015, 112, 5750–5755. [Google Scholar] [CrossRef] [Green Version]
- Lal, R. Carbon emission from farm operations. Environ. Int. 2004, 30, 981–990. [Google Scholar] [CrossRef] [PubMed]
- Helsel, Z.R. Energy Use and Efficiency in Pest Control, Including Pesticide Production, Use, and Management Options. Available online: https://farm-energy.extension.org/energy-use-and-efficiency-in-pest-control-including-pesticide-production-use-and-management-options/ (accessed on 30 March 2021).
- Kremen, C.; Miles, A. Ecosystem services in biologically diversified versus conventional farming systems: Benefits, externalities, and trade-offs. Ecol. Soc. 2012, 17, 40. [Google Scholar] [CrossRef]
- Durlinger, B.; Consultants, B.; Koukouna, E.; Broekema, R.; Van Paassen, M.; Scholten, J. Agri-footprint 4.0; Blonk Consultants: Gouda, The Netherlands, 2017. [Google Scholar]
- Huijbregts, M.A.J.; Steinmann, Z.J.N.; Elshout, P.M.F.; Stam, G.; Verones, F.; Vieira, M.; Zijp, M.; Hollander, A.; van Zelm, R. ReCiPe2016: A harmonised life cycle impact assessment method at midpoint and endpoint level. Int. J. Life Cycle Assess. 2017, 22, 138–147. [Google Scholar] [CrossRef]
- Voltr, V. Concept of soil fertility and soil productivity: Evaluation of agricultural sites in the Czech Republic. Arch. Agron. Soil Sci. 2012, 58. [Google Scholar] [CrossRef]
- Voltr, V.; Hruška, M.; Nobilis, L. Complex Valuation of Energy from Agricultural Crops including Local Conditions. Energies 2021, 14, 1415. [Google Scholar] [CrossRef]
- Voltr, V.; Bartlová, J.; Brtnický, M.; Denešová, O.; Froněk, P.; Honz, J.; Hlavsa, T.; Hruška, M.; Khel, T.; Kohút, M.; et al. Evaluation of Land in Environmental Conditions (Hodnocení Půdy v Podmínkách Ochrany Životního Prostředí); ÚZEI: Prague, Czech Republic, 2012; ISBN 978-80-86671-86-4. [Google Scholar]
- Voltr, V.; Froněk, P.; Hruška, M.; Šařec, P. Impact assessment of trim levels of mechanization in company on yield of winter wheat. Trends Agric. Eng. 2013, 5, 651–656. [Google Scholar]
- Voltr, V.; Hruška, M.; Nobilis, L.; Fuksa, P. Methodology for Economic, Energy and Environmental Assessment of Crop Production. (Metodika Ekonomického, Energetického a Environmentálního Hodnocení Výroby Plodin); ÚZEI: Prague, Czech Republic, 2019; ISBN 978-80-7271-242-7. [Google Scholar]
- Voltr, V. Characteristic of the Main Soil Units. Available online: https://www.uzei.cz/data/usr%7B%5C_%7D001%7B%5C_%7Dcz%7B%5C_%7Dsoubory/210218%7B%5C_%7Dcharacteristic%7B%5C_%7Dof%7B%5C_%7Dthe%7B%5C_%7DMain%7B%5C_%7DSoil%7B%5C_%7DUnits.pdf (accessed on 18 February 2021).
- Voltr, V. Economy of Crops on SCVU. Available online: https://www.uzei.cz/data/usr_001_cz_soubory/210210_Description_of_SCVU.pdf. (accessed on 18 February 2021).
- Voltr, V. Emission of Organic Fertilizers. Available online: https://www.uzei.cz/data/usr_001_cz_soubory/210218_organic_fertilizers.pdf (accessed on 18 February 2021).
- Voltr, V. Ecologic Indicators on SCVU. Available online: https://www.uzei.cz/data/usr_001_cz_soubory/midp_ind_En.pdf (accessed on 18 February 2021).
- Voltr, V. Emission of Pesticides. Available online: https://www.uzei.cz/data/usr_001_cz_soubory/210218_pesticides_emission.pdf (accessed on 18 February 2021).
- Voltr, V. Description on SCVU. Available online: https://www.uzei.cz/data/usr_001_cz_soubory/210210_Description_of_SCVU.pdf (accessed on 18 February 2021).
- Voltr, V. Diesel Emission. Available online: https://www.uzei.cz/data/usr_001_cz_soubory/210218_Diesel_emission.pdf (accessed on 18 February 2021).
- Jánský, J.; Živělová, I.; Poláčková, J.; Boudný, J.; Redlichová, R. Trend analysis of revenues and costs within the chosen commodities under the conditions of organic agriculture. Agric. Econ. Zemědělská Ekon. 2018, 52, 436–444. [Google Scholar] [CrossRef] [Green Version]
- Voltr, V.; Hruška, M.; Nobilis, M.; Fuksa, P.; Pokorný, J. Procedure of economic, energy and environmental evaluation of crop production in the Czech Republic. Eur. Biomass Conf. Exhib. 2020, 251409, 55–61. [Google Scholar]
- Klír, J.; Kunzová, E.; Čermák, P. Rámcová Metodika Výživy Rostlin a Hnojení (Framework Methodology Plant Nutrition and Fertilization); Výzkumný Ústav Rostlinné Výroby (Crop Research Institute): Prague, Czech Republic, 2008; ISBN 978-80-87011-61-4. [Google Scholar]
- Voltr, V.; Hruška, M.; Šařec, P.; Leština, J.; Froněk, P. The Methodology for the Valuated Soil-é Soil-Ecological Units (BPEJ). (Metodika Ocenění Půdy pro Bonitované Půdně-Ekologické Jednotky (BPEJ)); ÚZEI, Ed.; ÚZEI: Prague, Czech Republic, 2012. [Google Scholar]
- Voltr, V.; Hofman, Z.; Šarec, P. Soil resistance in the relation to the used technology of the soil cultivation. In Proceedings of the 4th International Conference, TAE 2010, Prague, Czech Republic, 7–10 September 2010. [Google Scholar]
- Fuksa, P.; Hakl, J.; Míchal, P.; Hrevušová, Z.; Šantrůček, J.; Tlustoš, P. Effect of silage maize plant density and plant parts on biogas production and composition. Biomass Bioenergy 2020, 142. [Google Scholar] [CrossRef]
- Herrmann, A.; Rath, J. Biogas production from maize: Current state, challenges, and prospects. 1. Methane yield potential. Bioenergy Res. 2012, 5, 1027–1042. [Google Scholar] [CrossRef]
- Arvidsson, J.; Etana, A.; Rydberg, T. Crop yield in Swedish experiments with shallow tillage and no-tillage 1983–2012. Eur. J. Agron. 2014, 52, 307–315. [Google Scholar] [CrossRef]
- Townsend, T.J.; Ramsden, S.J.; Wilson, P. Analysing reduced tillage practices within a bio-economic modelling framework. Agric. Syst. 2016, 146, 91–102. [Google Scholar] [CrossRef]
- Sharma, A.; Kumar, V.; Shahzad, B.; Tanveer, M.; Sidhu, G.P.S.; Handa, N.; Kohli, S.K.; Yadav, P.; Bali, A.S.; Parihar, R.D.; et al. Worldwide pesticide usage and its impacts on ecosystem. SN Appl. Sci. 2019, 1, 1446. [Google Scholar] [CrossRef] [Green Version]
- Bolzonella, C.; Lucchetta, M.; Teo, G.; Boatto, V.; Zanella, A. Is there a way to rate insecticides that is less detrimental to human and environmental health? Glob. Ecol. Conserv. 2019, 20, e00699. [Google Scholar] [CrossRef]
- Pisa, L.; Goulson, D.; Yang, E.C.; Gibbons, D.; Sánchez-Bayo, F.; Mitchell, E.; Aebi, A.; van der Sluijs, J.; MacQuarrie, C.J.K.; Giorio, C.; et al. An update of the Worldwide Integrated Assessment (WIA) on systemic insecticides. Part 2: Impacts on organisms and ecosystems. Environ. Sci. Pollut. Res. 2017, 1–49. [Google Scholar] [CrossRef] [PubMed] [Green Version]
- Rosenheim, J.A.; Cass, B.N.; Kahl, H.; Steinmann, K.P. Variation in pesticide use across crops in California agriculture: Economic and ecological drivers. Sci. Total Environ. 2020, 733, 138683. [Google Scholar] [CrossRef]
- Rose, M.T.; Cavagnaro, T.R.; Scanlan, C.A.; Rose, T.J.; Vancov, T.; Kimber, S.; Kennedy, I.R.; Kookana, R.S.; Van Zwieten, L. Impact of Herbicides on Soil Biology and Function; Elsevier Inc.: Amsterdam, The Netherlands, 2016; Volume 136, ISBN 9780128046814. [Google Scholar]
- Elias, D.; Wang, L.; Jacinthe, P.A. A meta-analysis of pesticide loss in runoff under conventional tillage and no-till management. Environ. Monit. Assess. 2018, 190, 79. [Google Scholar] [CrossRef] [Green Version]
- Lechenet, M.; Dessaint, F.; Py, G.; Makowski, D.; Munier-Jolain, N. Reducing pesticide use while preserving crop productivity and profitability on arable farms. Nat. Plants 2017, 3, 17008. [Google Scholar] [CrossRef]
- Blackshaw, R.E.; O’Donovan, J.T.; Harker, K.N.; Clayton, G.W.; Stougaard, R.N. Reduced herbicide doses in field crops: A review. Weed Biol. Manag. 2006, 6, 10–17. [Google Scholar] [CrossRef]
- Haruna, S.I.; Nkongolo, N.V.; Anderson, S.H.; Eivazi, F.; Zaibon, S. In situ infiltration as influenced by cover crop and tillage management. J. Soil Water Conserv. 2018, 73, 164–172. [Google Scholar] [CrossRef]
- Ghimire, R.; Lamichhane, S.; Acharya, B.S.; Bista, P.; Sainju, U.M. Tillage, crop residue, and nutrient management effects on soil organic carbon in rice-based cropping systems: A review. J. Integr. Agric. 2017, 16, 1–15. [Google Scholar] [CrossRef]
- Smith, P.; Martino, D.; Cai, Z.; Gwary, D.; Janzen, H.; Kumar, P.; McCarl, B.; Ogle, S.; O’Mara, F.; Rice, C.; et al. Greenhouse gas mitigation in agriculture. Philos. Trans. R. Soc. B Biol. Sci. 2008, 363, 789–813. [Google Scholar] [CrossRef] [Green Version]
- Zhang, L.; Zheng, J.; Chen, L.; Shen, M.; Zhang, X.; Zhang, M.; Bian, X.; Zhang, J.; Zhang, W. Integrative effects of soil tillage and straw management on crop yields and greenhouse gas emissions in a rice-wheat cropping system. Eur. J. Agron. 2015, 63, 47–54. [Google Scholar] [CrossRef]
- de Cárcer, P.S.; Sinaj, S.; Santonja, M.; Fossati, D.; Jeangros, B. Long-term effects of crop succession, soil tillage and climate on wheat yield and soil properties. Soil Tillage Res. 2019, 190, 209–219. [Google Scholar] [CrossRef]
- Koga, N.; Sawamoto, T.; Tsuruta, H. Life cycle inventory-based analysis of greenhouse gas emissions from arable land farming systems in Hokkaido, northern Japan. Soil Sci. Plant Nutr. 2006, 52, 564–574. [Google Scholar] [CrossRef]
- Camargo, G.G.T.; Ryan, M.R.; Richard, T.L. Energy use and greenhouse gas emissions from crop production using the farm energy analysis tool. Bioscience 2013, 63, 263–273. [Google Scholar] [CrossRef] [Green Version]
- Halvorson, A.D.; Wienhold, B.J.; Black, A.L. Tillage, Nitrogen, and Cropping System Effects on Soil Carbon Sequestration. Soil Sci. Soc. Am. J. 2002, 66, 906–912. [Google Scholar] [CrossRef]
- Tabatabaeefar, A.; Emamzadeh, H.; Varnamkhasti, M.G.; Rahimizadeh, R.; Karimi, M. Comparison of energy of tillage systems in wheat production. Energy 2009, 34, 41–45. [Google Scholar] [CrossRef]
- Voltr, V.; Menšík, L.; Hlisnikovský, L.; Hruška, M.; Pokorný, E.; Pospíšilová, L. The Soil Organic Matter in Connection with Soil Properties and Soil Inputs. Agronomy 2021, 11, 779. [Google Scholar] [CrossRef]
- Preininger, M. Energetic Evaluation of Production Process in Crop Production (Energetické Hodnocení Výrobních Procesů v Rostlinné Výrobě). Praha: Ústav Vědeckotechnických Informací pro Zemědělství. 1987. Available online: https://www.cistbrno.cz/Record/mzk.MZK01-000535029/UserComments#tabnav (accessed on 3 March 2021).
- 227/2018 Sb. Decree on the Characteristics of Rated Soil Ecological Units and the Procedure for Their Management and Updating (Vyhláška o Charakteristice Bonitovaných Půdně Ekologických Jednotek a Postupu pro Jejich Vedení a Aktualizaci. Available online: https://www.zakonyprolidi.cz/cs/2018-227 (accessed on 18 February 2021).
Figure 1.
Statistically important correlation coefficients for the production of specific nitrogen consumption per tonne of yield.
Figure 1.
Statistically important correlation coefficients for the production of specific nitrogen consumption per tonne of yield.

Figure 2.
Silage maize yield and specific nitrogen consumption per tonne of production depending on soil fertility.
Figure 2.
Silage maize yield and specific nitrogen consumption per tonne of production depending on soil fertility.

Figure 3.
The change of specific consumption of nitrogen in crops.
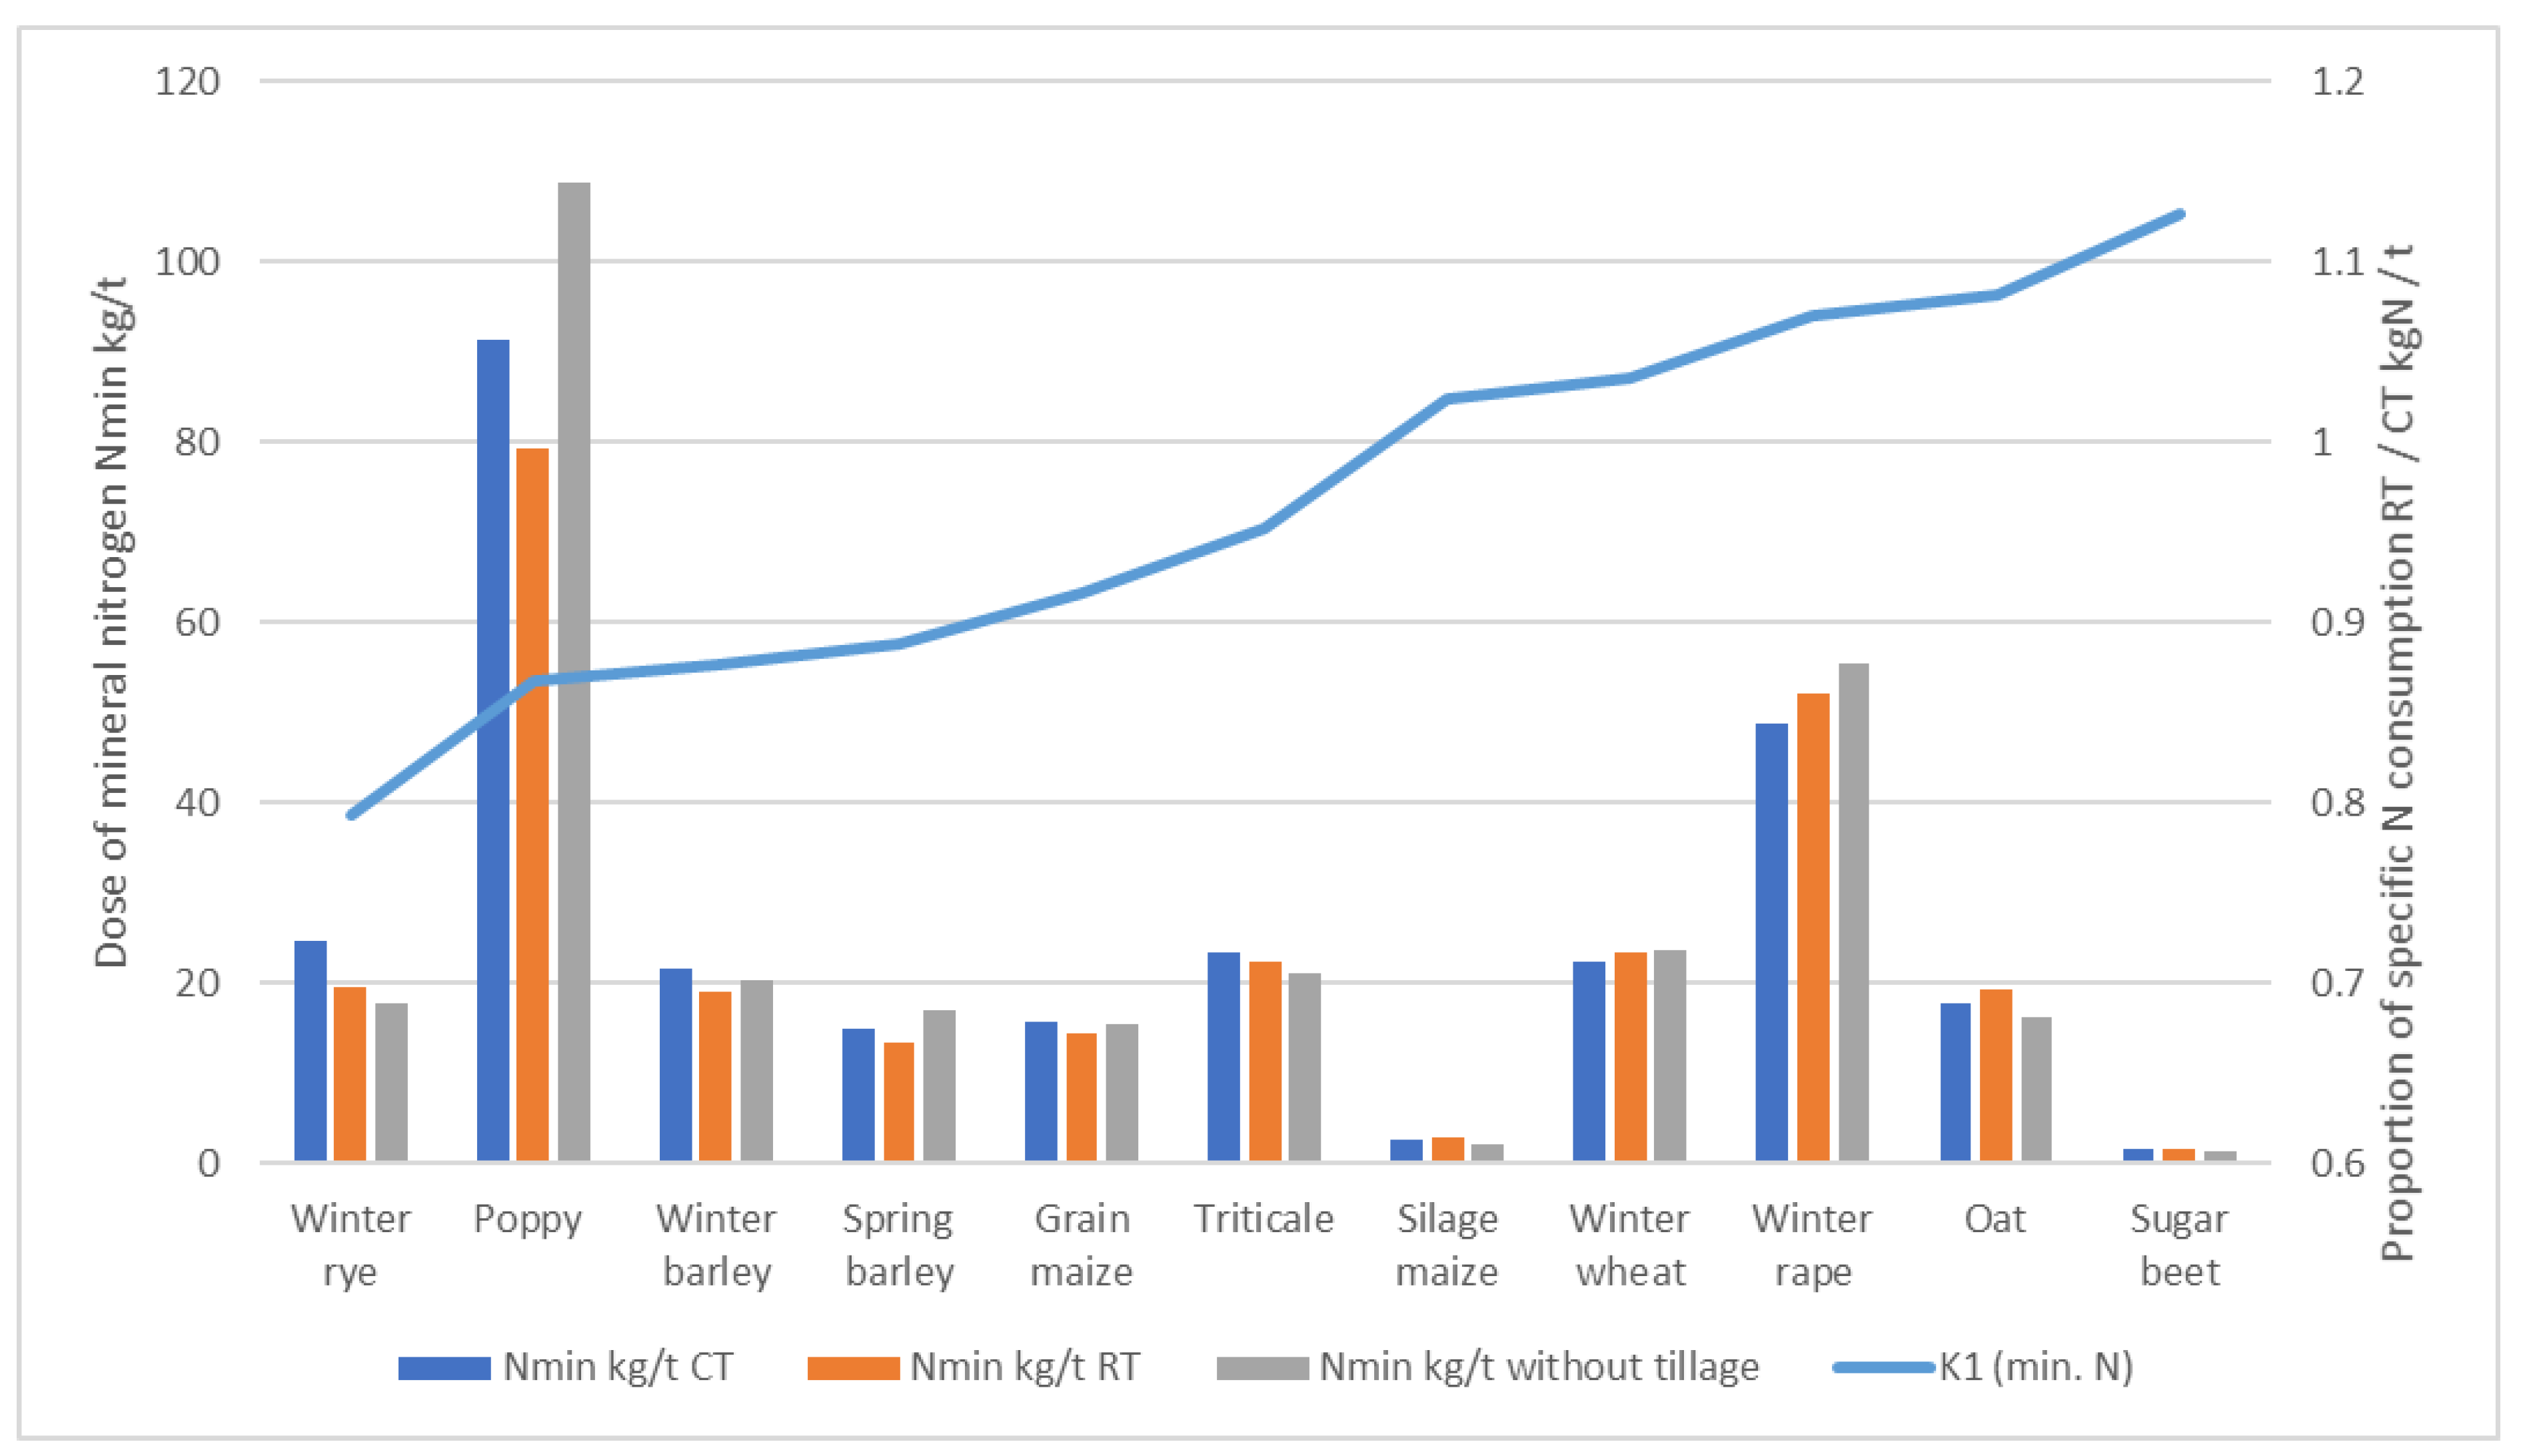
Figure 4.
Share of yields K3 and costs K4 on main crops.

Figure 5.
The number of chemical protections of evaluated crops.

Figure 6.
Coefficient Ki of the ratio of the individual monitored indicators.

Figure 7.
Changes of economic, energy and environmental parameters of crops between RT and CT.
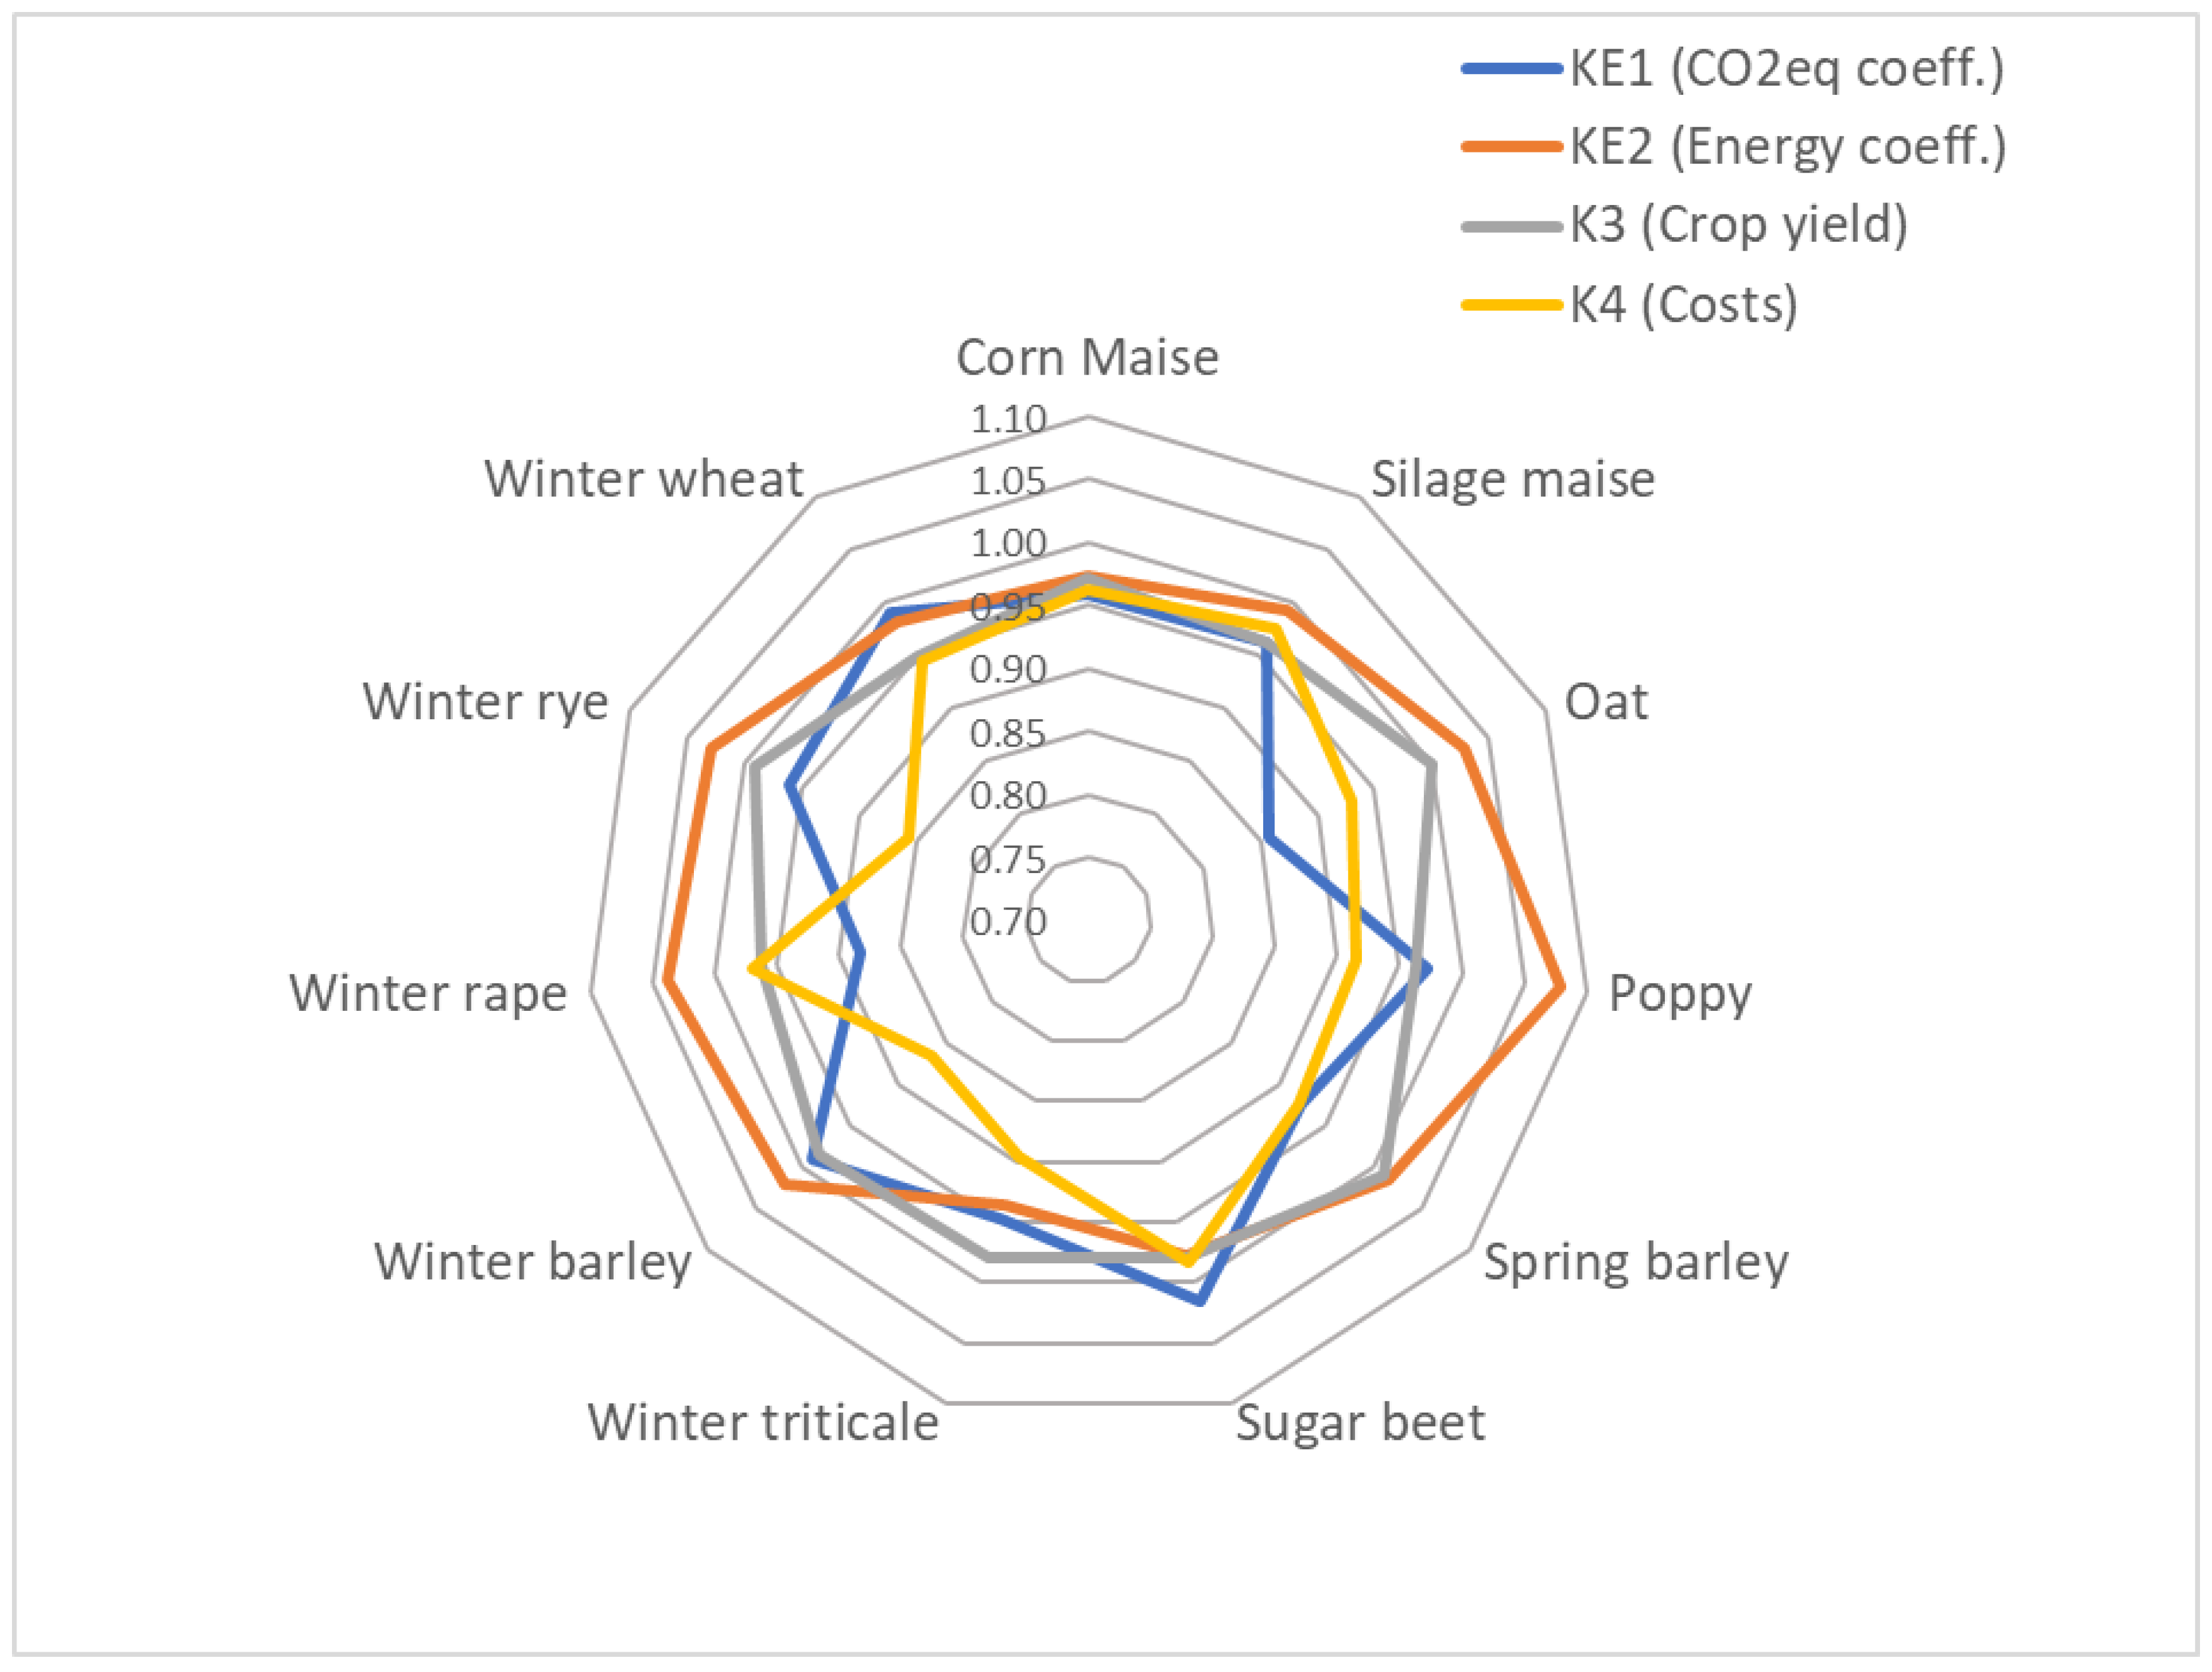
Table 1.
Correlation coefficients for a number of CT on the land into 9 year.
| Yield of Crops | Penetrometric Resistance Topsoil | Penetrometric Resistance Undersoil | Soil Moisture Topsoil | Chemical Treatment Intensity | |
|---|---|---|---|---|---|
| Pearson Correlation | 0.100 ** | −0.050 ** | −0.160 ** | −0.095 ** | 0.093 ** |
| Sig. (2-tailed) | 0.0000 | 0.0090 | 0.0000 | 0.0000 | 0.0000 |
| N | 3200 | 2681 | 2681 | 2681 | 3200 |
** Correlation is significant at the 0.01 level (2-tailed).
Table 2.
GHG emissions as CO2eq by CT and RT technology.
| Crops | Emission Values | ||
|---|---|---|---|
| CT | RT | Difference | |
| kg CO2eq/t | kg CO2eq/t | kg CO2eq/t | |
| Grain maize | 369.7 | 354.5 | −15.2 |
| Silage maize | 70.4 | 67.6 | −2.7 |
| Oat | 460.3 | 394.9 | −65.3 |
| Poppy | 2428.6 | 2362.0 | −66.6 |
| Spring barley | 387.1 | 357.7 | −29.4 |
| Sugar beet | 44.1 | 44.7 | 0.7 |
| Winter triticale | 487.1 | 461.2 | −25.9 |
| Winter barley | 1387.7 | 1373.1 | −14.6 |
| Winter rape | 539.1 | 476.4 | −62.8 |
| Winter rye | 578.0 | 554.9 | −23.1 |
| Winter wheat | 548.1 | 542.1 | −6.0 |
Table 3.
Differences between RT and CT.
| Crops | Economics Values | Energy Values | GHG Emission | ||||
|---|---|---|---|---|---|---|---|
| Difference SO | Difference COGS | Difference GMo | Difference ECOGS RT-CT | Difference EnSO RT-CT | Difference EGMo | Difference | |
| EUR/t | EUR/t | EUR/t | MJ/t | MJ/t | MJ/t | kg CO2eq/t | |
| Grain maize | −9.0 | −7.3 | −1.7 | −513.0 | −1257.2 | −744.1 | −15.2 |
| Silage maize | −0.5 | −1.0 | 0.5 | −54.3 | −101.3 | −47.0 | −2.7 |
| Oat | 3.3 | −13.9 | 17.2 | −355.6 | 455.4 | 811.0 | −65.3 |
| Poppy | −7.1 | −109.1 | 101.9 | −2391.4 | −206.7 | 2184.7 | −66.6 |
| Spring barley | −1.7 | −17.1 | 15.4 | −542.2 | −198.7 | 343.5 | −29.4 |
| Sugar beet | −1.1 | −0.6 | −0.5 | −15.6 | −122.0 | −106.4 | 0.7 |
| Winter triticale | −5.5 | −22.2 | 16.7 | 787.9 | −845.4 | −1633.3 | −25.9 |
| Winter barley | −3.8 | −48.8 | 45.0 | −1250.1 | −539.0 | 711.1 | −14.6 |
| Winter rape | −6.2 | −10.9 | 4.8 | −1613.6 | −596.3 | 1 017.3 | −62.8 |
| Winter rye | −1.6 | −32.4 | 30.8 | −1050.0 | −230.1 | 819.9 | −23.1 |
| Winter wheat | −5.8 | −13.1 | 7.3 | −343.2 | −807.9 | −464.6 | −6.0 |
Publisher’s Note: MDPI stays neutral with regard to jurisdictional claims in published maps and institutional affiliations. |
© 2021 by the authors. Licensee MDPI, Basel, Switzerland. This article is an open access article distributed under the terms and conditions of the Creative Commons Attribution (CC BY) license (https://creativecommons.org/licenses/by/4.0/).
Share and Cite
MDPI and ACS Style
Voltr, V.; Wollnerová, J.; Fuksa, P.; Hruška, M. Influence of Tillage on the Production Inputs, Outputs, Soil Compaction and GHG Emissions. Agriculture 2021, 11, 456. https://0-doi-org.brum.beds.ac.uk/10.3390/agriculture11050456
AMA Style
Voltr V, Wollnerová J, Fuksa P, Hruška M. Influence of Tillage on the Production Inputs, Outputs, Soil Compaction and GHG Emissions. Agriculture. 2021; 11(5):456. https://0-doi-org.brum.beds.ac.uk/10.3390/agriculture11050456
Chicago/Turabian StyleVoltr, Václav, Jana Wollnerová, Pavel Fuksa, and Martin Hruška. 2021. "Influence of Tillage on the Production Inputs, Outputs, Soil Compaction and GHG Emissions" Agriculture 11, no. 5: 456. https://0-doi-org.brum.beds.ac.uk/10.3390/agriculture11050456
Note that from the first issue of 2016, this journal uses article numbers instead of page numbers. See further details here.