
A Motor-Driven and Computer Vision-Based Intelligent E-Trap for Monitoring Citrus Flies


1
School of Computer and Information Science, Southwest University, Chongqing 400715, China
2
National Engineering Research Center for Citrus Technology, Citrus Research Institute, Southwest University, Chongqing 400712, China
*
Author to whom correspondence should be addressed.
Agriculture 2021, 11(5), 460; https://0-doi-org.brum.beds.ac.uk/10.3390/agriculture11050460
Submission received: 16 March 2021
/
Revised: 7 May 2021
/
Accepted: 12 May 2021
/
Published: 19 May 2021
(This article belongs to the Section Crop Protection, Diseases, Pests and Weeds)
Abstract
:Citrus flies are important quarantine pests in citrus plantations. Electronic traps (e-traps) based on computer vision are the most popular types of equipment for monitoring them. However, most current e-traps are inefficient and unreliable due to requiring manual operations and lack of reliable detection and identification algorithms of citrus fly images. To address these problems, this paper presents a monitoring scheme based on automatic e-traps and novel recognition algorithms. In this scheme, the prototype of an automatic motor-driven e-trap is firstly designed based on a yellow sticky trap. A motor autocontrol algorithm based on Local Binary Pattern (LBP) image analysis is proposed to automatically replace attractants in the e-trap for long-acting work. Furthermore, for efficient and reliable statistics of captured citrus flies, based on the differences between two successive sampling images of the e-trap, a simple and effective detection algorithm is presented to continuously detect the newly captured citrus flies from the collected images of the e-trap. Moreover, a Multi-Attention and Multi-Part convolutional neural Network (MAMPNet) is proposed to exploit discriminative local features of citrus fly images to recognize the citrus flies in the images. Finally, extensive simulation experiments validate the feasibility and efficiency of the designed e-trap prototype and its autocontrol algorithm, as well as the reliability and effectiveness of the proposed detection and recognition algorithms for citrus flies.
1. Introduction
Citrus flies such as Bactrocera minax and B. dorsalis are significant pests in citrus plantations because large-scale citrus fly disasters will lead to serious yield reduction and economic loss [1]. However, it is challenging to control and prevent extensive disaster propagation due to the characteristics of citrus flies, e.g., rapid reproduction, flying across wide areas, and insecticide resistance [2,3]. Therefore, in order to predict a critical point of the occurrence of a large-scale disaster for early warning and conducting prevention measures, it is very important to continuously monitor their community structures, quantitative distributions, and corresponding weather conditions [4,5]. However, it is difficult to build an automatic system for continuously monitoring citrus fly pests in an extensive area because such a system involves the multiple disciplines of biology, automation, communication, and information. Currently, the task of monitoring citrus flies is usually done manually by technicians, which requires a great deal of human resources to collect and analyze the data from orchards.
Recently, advancements in electronic traps (e-traps) have made it possible to construct a distributed system for monitoring citrus flies. In the previous works [4,5,6,7,8,9], a popular and promising system scheme is deployed using a large number of e-traps with computer vision and wireless communication. Therein, such an e-trap mainly consists of two parts: a trap and an embedded device. In general, the trap is in charge of attracting and capturing flies. An embedded device with a camera, meteorological sensors, and a wireless communication module is usually installed in the trap. It is responsible for collecting images of flies captured on the trap and weather data and transmitting them to the remote server. By deploying the e-traps at some distributed locations, the area-wide field data can be collected for statistical analysis of citrus fly pests [5,9].
For monitoring citrus flies, an effective and easily-used trap is a prerequisite because the number and species of captured flies on e-traps contain essential information regarding their communities and distributions. There are two commonly-used categories of traps, i.e., the McPhail trap [7,10] and the yellow sticky paper [4,11]. The McPhail trap is the plastic and barrel-like equipment with several special entries, which contains liquid attractants. Flies are trapped in the liquid, and images of the liquid surface are sampled for detecting them. The yellow sticky paper is usually made by smoothly smearing some sticky materials on a special kind of yellow paper, where attractants are integrated into the paper or sticky materials. Citrus flies are stuck on the sticky paper, and the images of the paper are directly sampled to monitor the citrus flies. The previous research shows that the two kinds of traps can effectively capture citrus flies when using some appropriate attractants [4,5,7,8,9,10,11].
However, the images sampled by the current e-traps are possibly low-quality for pest recognition and statistics. For example, the trapped insects may be overlapped in the liquid or on the paper when a certain number of insects are captured [4,5,9], which will seriously affect the subsequent steps, i.e., detecting and recognizing the insects in the sampled images. Furthermore, a more significant shortcoming is that the attractants must be replaced manually every week due to the gradually reduced attractant efficacy [12,13]. To address the problems, we design an automatic motor-driven e-trap and its control algorithm based on image analysis, in which the yellow paper is rolled and stored, as shown in Figure 1. By evaluating the sampled images of the e-trap, the yellow paper can be automatically renewed according to the density of captured insects. Furthermore, the yellow paper can also be renewed by using a timer, which ensures that the validation date of the attractants is not expired. To our best knowledge, few previous pest traps may operate continuously without human maintenance of replacing attractants, except for the traps developed by the Trapview company https://www.trapview.com (accessed on 8 April 2021), whose principles of reserving and automatically replacing attractants are different from ours.
Besides the efficient acquisition of high-quality images of the e-trap, detecting insects in the e-trap images and recognizing their species are the keys to pest statistics. The detection task pays attention to locating the insects and segmenting them from the images of the e-trap. In general, insect detectors can be classified into two categories: hand-crafted detectors [7,14] and feature-learning-based ones [6,9,15,16,17]. For example, a combination of feature matching and Kalman filters in the HSV color space was designed to detect the B. dorsalis [14]. Romanos et al. fine-trained the complicated R-CNN model to detect the olive fruit fly [16]. However, the above methods operate on a single image and omit the relations between two successively sampled images. In this work, according to the pure image background of the e-trap, a simple and efficient detector based on the inter-sampling difference algorithm [18] is designed to detect the newly captured insects in the current sampled image.
Differing from the insect detection, recognizing the species of one citrus fly in an image is a fine-grained visual classification (FGVC) task [19,20], which focuses on the classification of similar categories in a super-category, e.g., classifying different breeds of dogs [21] and species of birds [22]. This is because most species of citrus flies fall in the same order of Diptera and some species have subtle differences only on some parts, e.g., the wings and thoraces. The recognition accuracy relies specifically on the robustness and capability of an image feature representation because the inter-species differences are much less than the intra-species variations, which are caused by different viewpoints, poses, illuminations, and scales, etc. In the early work of fruit fly identification [9,23,24,25], some hand-crafted local descriptors, e.g., the Gabor in [9], SIFT and SURF in [24], were adopted to extract colors, textures, contours and other features, and the Support Vector Machine (SVM) [26] was used to perform classifications. The work mostly operates on small datasets or in constrained conditions, e.g., requiring manual image alignment and segmentation in [25].
Recently, advancements in deep learning have led to a great deal of Convolution Neural Networks (CNNs)-based works for the identification of fruit flies’ species [27,28,29,30,31], which demonstrates the strong robustness and capability of CNNs in contrast to the hand-crafted descriptors. However, most work directly adopts existing pre-trained models or fine-trains them to perform classifications [27,28,29,30,31], which omits the characteristic of fine-grained classification in this recognition task of citrus flies. Inspired by the advancements of CNNs in the FGVC domain [32,33,34,35,36,37,38], e.g., the network architectures detecting and combining parts [32,33,34] and the attention mechanism based schemes [35,36,37,38], we proposed a Multi-Attention and Multi-Part convolutional neural Network (MAMPNet) to exploit the discriminative features of local vital parts such as wings, thoraces, and abdomens according to the expert knowledge of identifying the species of citrus flies.
To validate our work, we first synthesize images and videos to simulate the trap with insects and the process of replacing the yellow paper. Then, extensive experiments on the simulated images and videos are designed to analyze and verify the image-analysis-based autocontrol algorithm of the e-trap and the insect detection method. The experiment results show that our autocontrol algorithm can enable the e-trap to successfully replace the yellow sticky paper with an accuracy of 100% by controlling the motor in the simulation environment. The target citrus fly pests can be detected with an accuracy of 99.3% while holding a low False Acceptance Rate (FAR). Furthermore, a large number of evaluation and comparison experiments of citrus fly identification are performed on the constructed dataset Citrus flies, which consists of about 6000 images and covers 15 species of insects possibly captured by the e-trap. The recognition accuracy of 95.6% shows the deployment of e-traps can statistically count up each species of citrus fly pests, evaluate their propagation trends and community distributions, and further provide an early warning of a large-scale disaster of citrus fly pests, e.g., the B. minax and B. dorsalis.
In this work, in order to efficiently monitor citrus fly pests, our design e-trap and monitoring system have the following characteristics. (1) Our designed motor-driven e-trap and its autocontrol algorithm based on image analysis can ensure continuous monitoring of citrus fly pests without human participation maintenance. Namely, it preserves the new, unused yellow paper in its cavity, and its motor-driven electromechanical parts automatically replace the used paper with the preserved new paper according to the insect density on the e-trap or its working time. (2) The proposed fast detection algorithm of insects can detect and segment the target citrus fly pests with an accuracy of 99.3%, and our MAMPNet can identify the species of citrus flies captured on the e-trap with an accuracy of 95.6%. This completely meets the practical requirement of monitoring the citrus fly pests. (3) The proposed scheme for an automatic monitoring system of citrus flies may raise the efficiency of pest management and reduce labor costs because it may automatically collect images of citrus flies, recognizes their species, and analyzes pest data. (4) Our e-trap and monitoring scheme possibly applies to some other species of agricultural pests that are flyable and attractable by adopting appropriate attractants in the sticky paper.
2. Materials and Methods
Two essential factors for monitoring citrus fly pests are to effectively trap citrus flies and statistically count up their species and quantities. In the following subsections, the design scheme of our e-trap is described in detail to explain why our designed e-trap can effectively and continuously trap citrus fly pests and sample their images in Section 2.1. Then, in Section 2.2, the image analysis-based autocontrol algorithm of the e-trap is presented to ensure that the e-trap continuously operates for several months, which depends on the frequency of replacing the sticky paper and the quantity of reserved sticky paper in the e-trap. Finally, to evaluate the statistics information of citrus fly pests captured by the e-trap, the detection algorithms of citrus flies and the MAMPNet for the classification of citrus flies are proposed in Section 2.3 and Section 2.4, respectively.
2.1. Automatic Motor-Driven Citrus Fly E-Trap with Computer Vision
A brief overview of the e-trap and the corresponding monitoring system for citrus flies is first given in this part. Then, the critical designs of the e-trap, e.g., the processing of yellow sticky trap and the electromechanical designs, are introduced in detail.
2.1.1. Overview
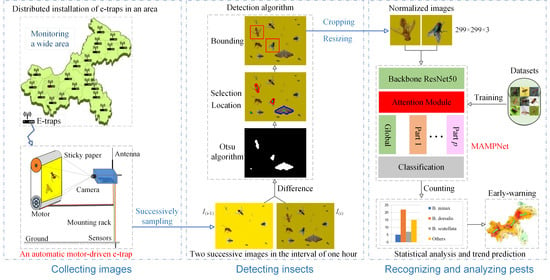
In this work, a motor-driven e-trap with computer vision is designed, and the monitoring system is constructed by the e-traps, as shown in Figure 1a,b. In the system, e-traps are the most significant devices. The e-trap mainly consists of a motor-driven trap and an embedded device with a camera. A kind of yellow sticky paper with a plastic mask, in which attractants are added, is designed and reserved in the trap, and the sticky paper is exposed to trap insects. The opposite camera monitors the sticky paper and samples insect images. Further, the computer vision algorithms are designed to detect and recognize insects, as well as control the motor to automatically replace the paper to reduce the human maintenance costs.
In the system runtime, an e-trap possibly operates in two different modes: the monitoring mode and the paper replacement mode. The monitoring mode, from the e-trap samples images, estimates the insect density on the exposed sticky paper, runs detection and recognition algorithms, and transmits data to the remote server. In the paper replacement mode, it mainly runs the autocontrol algorithm of the motor to replace the paper, and it omits the newly captured insects in the short replacement process. However, this has little effect on the pest statistics since the process takes only a minute [1,2]. Initially, the e-trap operates in the monitoring mode, and the insect density is estimated successively. When the density reaches a limit, namely, more insects are fully stuck on the paper, it switches to the paper replacement mode. After finishing the replacement of paper, it switches back to the monitoring mode. In short, the two modes alternately switch in the system runtime.
In practical applications, the costs of the monitoring system include the device costs and the operating costs. The device costs mainly indicate the expense of e-traps and servers in the initial creation of the system. According to our evaluation, the costs of an e-trap, including the costs of software and hardware, can be reduced below $150 after engineering optimization. A server with GPU cards can take charge of thousands of e-traps. The operating costs mainly contain the costs of communication and sticky paper, which are low—about $10 per year for one e-trap when running the monitoring system. In general, the monitoring system may be deployed in a large citrus orchard by managers or in a district by governmental departments. Therefore, the expense of a monitoring system is acceptable in consideration of the systemic functionalities.
In summary, our designed system has the following functions. (1) The e-trap effectively traps citrus flies and collects their high-quality images as well as the weather data in time, e.g., updating the collected images and sensor data each hour. (2) The e-trap preprocesses images to reduce the communication cost of transmitting the images, e.g., only detecting the newly captured insects each hour, segmenting them from the total sticky paper image, and transmitting them to the remote server. (3) The system recognizes the tapped insects and statistically counts up their species and quantities. The recognition algorithm can be flexibly deployed in the e-trap or the remote server. (4) Less human maintenance cost is required. For example, the e-trap preserves the new and used paper in it and controls the motor to replace the sticky paper automatically, including lures. (5) Pest and weather data in a region can be easily collected by wireless communication, and they are further analyzed to estimate the possibility of a large-scale pest disaster and the population trends of pests.
2.1.2. Processing of Yellow Sticky Trap
The yellow sticky paper with attractants is the critical component, which attracts and captures insects. In order to enable the paper to keep good attracting effects and reserve sufficient sticky paper in the e-trap, we mainly carry out two measures: (1) Selecting reasonable lures applicable to the yellow sticky paper; (2) Adding the lures into the yellow paper by scientific means.
Selection of attractants. Attractants usually can be classified into two categories: food lures and chemical synthesis lures [12]. In general, a food lure is effective for multiple species of flies, and a synthesized one is specific for certain species. The latter is made according to sex pheromones, aggregation pheromones, and attractants of plant origin. Selection of attractants refers to the trapping efficacy, persistence, characters (liquid or solid) of lures, and their usages on the yellow sticky paper. Aiming at the target pest species, e.g., B. minax and B. dorsalis, according to the field comparison experiments in [12,13], we selected the liquid of methyl eugenol and cuelure and added them into a special kind of yellow paper, which is made of fibers and adsorbent materials. Moreover, we selected the common solid food lures of protein baits for all the species of citrus fly pests, and they were processed as fine particles that were evenly adsorbed to the sticky surface of the yellow paper. The previous works [39,40] have proved that the incorporation of appropriate attractants into the surface of sticky traps will efficiently capture flies.
Paper processing. As shown in Figure 2a, the liquid lures are firstly injected into the adsorptive yellow paper, and its surface V is handled as a smooth and hermetic plane. Then, the sticky material is spread onto the surface U, wherein the tiny holes are set apart in the level of sticky material when spreading the sticky material on the paper so that the liquid lures in the paper can better volatilize out from the holes after uncovering the plastic mask. Furthermore, the fine particles of solid lures are evenly adsorbed onto the sticky surface U, and Sides 1 and 2 are sealed by dissolving greases, such as the paraffin wax and oil. Finally, a thin plastic mask is covered onto the sticky material (Surface U) to seal and protect the liquid attractants in the paper and the solid attractants on the sticky materials. By rolling the paper on an axle, a great deal of paper can be reserved in a confined space, e.g., in the shell shown in Figure 2c, and the new paper can easily be extracted.
Significantly, the paper needs to be replaced when the attractants have no efficacy after some days. However, there may be no or few insects stuck on the paper. In this case, it is challenging to adopt an image analysis to distinguish the used paper without insects and the new paper. To better monitor the boundary between new and used paper in the replacing process, some blanking stamps are printed on the Surface U in the same interval as shown in Figure 2b. Moreover, the interval length is set as the length of the exposed paper’s sticky surface of the e-trap in Figure 2c. Namely, after finishing the replacement process, the exposed new paper’s sticky surface should be purely yellow, not containing blanking stamps. This makes it easier to utilize image analysis to determine whether the paper is correctly replaced or not, which will prevent the used paper from being partially replaced when no or few insects are trapped.
In summary, according to our processing method, in virtue of the excellent tightness, the attractants in the yellow paper and on the sticky material are well preserved when the paper is rolled on an axle, and the plastic mask is not uncovered. When uncovering the mask, the solid lures are disclosed in the air, and the liquid lures slowly volatilize into the air through the tiny holes on the surface U, which are not covered by the sticky materials. Furthermore, other attractants can be directly mixed into the sticky material to further improve the trapping efficacy.
2.1.3. Electromechanical Designs of E-Trap
The electromechanical designs involve schemes of mechanical structures, hardware, electronic devices, and the appearance of the e-trap. According to the structure of the e-trap, the design schemes can be grouped into two main parts: a motor-driven trap for reserving and replacing the yellow paper and an embedded device for collecting, processing, and transmitting data.
Motor-driven trap equipment. The appearance and sectional view of the trap are demonstrated in Figure 2c,d. Firstly, from the viewpoint of appearance, the trap’s inner components are protected by the outer framework (shell), and only the yellow sticky paper is exposed and visible, whose plastic mask is uncovered. The exposed sticky paper is used to trap insects. Its Panel is detachable so that the rolled paper can be installed into the trap. Its other parts are integrated. All inner components are fixed in Panel . The slicker is used to clear the insects with large sizes when replacing the paper. The motor’s signal and power lines are arranged in the pipy installation frames to connect to the embedded device so that the process of replacing paper can be controlled by switching on or off the motor.
From the sectional view, a scroll linkage mechanism is designed to reserve and replace the paper. The Scroll S rolled by the yellow sticky paper is used to reserve the unused paper, as shown in Figure 2a. Scroll M is used to withdraw and store the used paper containing the captured insects. The rollers numbered 7 and 8 are used to separate the yellow paper and plastic mask. Two pairs of rollers, i.e., No.3 and No.4, No.5 and No.10, are set to extrude and flatten the stuck insects on the sticky paper so that the sticky paper tightly touches with the plastic mask, and the flattened insects are contained between them. The other rollers help convey the sticky paper and plastic mask. A speed-reducing gear set is used to link the scroll M with a motor for driving the linkage mechanism composed of two scrolls. When the motor is switched on, the two scrolls will turn synchronously. The new paper is pulled out from the Scroll S, and the used paper that contains the flattened insects is taken back and rolled on Scroll M.
Significantly, in order to smoothly retrieve the used paper containing the stuck insects, it is important that the extruding and flattening roller pairs have flexible gaps, which may be implemented by using two elastic rubber rollers. In our design scheme, the suitable gap is set apart between the No.5 and No.10 rollers. The No.10 roller does not touch the sticky paper, and it is used to extrude possible large-size insects preliminarily. The No.3 and No.4 rollers, which have strong extruding power, are used to flatten the stuck insects and merge the plastic mask and sticky paper. To obtain the strong extruding power, the two pairs of rollers can be directly driven by the motor by using chains. In conclusion, the design scheme is feasible because the stuck insects, e.g., flies and butterflies, can be easily flattened, and the sticky paper will not be jammed when the paper advances forward.
Embedded device. According to the requirements of the e-trap, the embedded device should include the functions: (1) data collection of the images and weather statuses; (2) preprocessing the images, operating the autocontrol algorithms, even the detection and recognition tasks; (3) wireless communication. Considering a rapid development and trade-off between hardware performances and costs, an existing development toolkit and other integrated modules were directly selected to assemble the device.
For a powerful computing capability and a future extension, we directly selected the high performance–cost ratio NVIDIA Jetson Nano Developer Kit (NVIDIA, Santa Clara, CA, USA) with a 3280×2464 resolution Raspberry Pi Camera V2 (Raspberry Pi Foundation, Cambridge, England, UK) as the main body. It has suitable hardware configurations and rich interfaces, e.g., the 4-core ARM A57, 128-core Maxwell GPU, and 4G memory. A 4G wireless communication module SIM7600CE-L (SIMCom, Shanghai, SH, China) is connected to the Nano through a MINI-PCIe interface. Two integrated temperature and humidity sensors are also connected to the Nano. The motor and Nano are connected using a controllable switch chip. Both motor and Nano are supplied by a 24 V DC power. It is noted that the hardware designs may be further improved for the lower cost according to the future practical citrus orchard tests.
2.2. Image Analysis Based Autocontrol of E-Trap
The autocontrol of the e-trap indicates it automatically switches between the monitoring mode and the paper placement mode and controls the motor to replace the sticky paper in the second mode. The key issues are to solve when to switch to the paper replacement mode and how to control the motor in this mode. According to the aforementioned two operating modes of the e-trap in Section 2.1.1, it needs to switch to the paper replacement mode in the following two cases: (1) too many insects are stuck on the paper, which can be estimated by image analysis; (2) the lures in the sticky paper of the e-trap become less valid, which can be determined by timing. Correspondingly, the paper replacement mode can be triggered by an image analysis result or a timer signal.
In the first case, by analyzing the detected insects on the image of yellow sticky paper in the monitoring mode, we estimate the insect density on the yellow sticky paper to determine whether the e-trap should be switched to the paper replacement mode or not. Assuming that is the total image pixel number of the monitored area (the exposed yellow sticky paper) on the trap, is the pixel number of an insect on the yellow sticky paper image, which can be estimated by the size of the candidate region in the detection module shown in Figure 3, the insect density r on the e-trap can be computed as the following,
where n is the total number of captured insects. In the second case, the system time t can be used to monitor the expiration date of the lures. In summary, if , , and respectively indicate the last time of finishing yellow paper replacement, the valid session of lures, and the threshold about the insect density, the conditions ( OR ) can be used to start the mode of replacing the paper.
When the above conditions are met and the e-trap switches to the paper replacement mode, all other tasks, e.g., detection and recognition, are temporarily suspended, and the control algorithm of the motor is started to roll the two scrolls S and M for replacing the sticky paper in Figure 2d. Since their radii and rolling speeds are time-varying, it is difficult to adopt the rolling time to control the paper’s moving distance accurately. Considering that the used paper stuck by insects and the new, unused paper without insects are visually different, it is feasible to utilize the camera to monitor the exposed sticky paper of the e-trap to control the motor. Namely, by sampling the exposed sticky paper’s image in Figure 2c and analyzing whether it is completely the new paper or not, if not, the motor is switched on to continue rolling and replacing; otherwise, switched off to finish the replacement. Specifically, when adding the blanking stamps in Figure 2b, it is easier to determine whether the replacement is finished or not visually. Through these inspections, we proposed a simple control Algorithm 1 based on image analysis.
| Algorithm 1 Autocontrol of trap. |
|
In this algorithm, the input signal is the current image I of the yellow paper, and the output is the switch signal s of the motor. The signal s can be estimated by comparing the image I with a reference background image , which can be obtained by sampling the new paper in advance. Assuming that indicates computing a feature vector of an image with the Local Binary Pattern (LBP) descriptor [41] and is a Euclidean distance between two vectors, the switch signal s can be computed as the following,
where is a distance threshold, which can be determined by some experimental trials. The LBP descriptor is adopted to reduce the effects of illumination variations in evaluating the difference between I and , which are possibly sampled in the different conditions. Moreover, before attracting the LBP descriptor of an image, smooth filtering operations [42] on the image are conducted to reduce the local noises caused by the dust on the sticky paper. In summary, the efficient and straightforward LBP completely meets the non-real-time autocontrol requirements of the e-trap. Once the replacement is started, the switch signal s is kept on until the exposed sticky surface is similar to the pure yellow background, namely, the exposed paper is completely new when .
Especially in practice, it is possible that a new insect is stuck on the moving paper or an insect is flying between the sticky paper and camera when replacing the paper, as shown in Figure 1a. In the latter case, the flying insect will interrupt the view of the camera, and the sampled images will fail to reflect the real situations of sticky paper. However, the two special cases will not affect the estimation of pest propagation trends and the replacement of paper. Firstly, since the paper is replaced once a few weeks and the insects rarely fly onto the moving paper, the insects stuck insects when replacing the paper will be few. Even if they are not counted, the total statistics of pests will be rarely affected. Secondly, the motor’s stopping condition is that the sampled image I is similar to the reference image with the pure yellow background. When an insect is flying before the camera, the sampled I will not be similar to the . Only at the time of stopping the motor, this case may mean that the motor will not stop. However, after the insect flies away from between the sticky paper and the camera, the motor will stop correctly.
2.3. Citrus Fly Detection Based on Differences of Two Successive Samplings
Detecting the target pests stuck on the e-trap is the basis of pest statistics in the monitoring mode. Differing from the general object detection in a single image [43], this task is to find the new insects on the current image compared with the last sampled image an hour before. Therefore, the difference between the two images is essential for detecting the newly captured insects in the last hour. Accordingly, we propose a simple and efficient method shown in the left part of Figure 3. It mainly consists of two steps: sampling and detecting procedures.
Sampling procedure. For monitoring and managing pests, it is enough to sample an image to update the pest data each hour. For example, and in Figure 3, respectively, indicate two successive samplings in the interval of one hour, i.e., the current sampled image and the image an hour before. In order to accurately detect the newly captured insects between two samplings, the quality of single sampling is essential. To ensure the sampling quality, multiple measures are conducted. Firstly, the camera is set in the photographing mode, and the subsidiary light source of the camera is switched on to sample a high-solution still image. Secondly, to avoid sampling the occluded image caused by the flying insect between the sticky paper and camera, in practice, for one single sampling, three still images are sampled at an interval of 2 seconds, and then one of them is selected as the final sampled image by comparing them. This is because they are nearly identical only when no moving objects exist between the sticky paper and camera in the sampling process. Finally, by setting a timer, it is possible to enable the e-trap to sample one image of the e-trap each hour only in the daytime because citrus flies are rarely active at night.
Detection procedure. The procedure includes six steps totally, as shown in Figure 3. Firstly, the difference estimation and binarization [44] in steps (1) and (2) can generate and highlight the regions caused by the newly captured insects. This is less affected by illumination variations because and are sampled in one hour under the help of the subsidiary light source of the camera. Secondly, the morphological opening and closing operations [45] in step (3) are helpful for deleting the small noise regions, separating the slightly-overlapped insects, and filling the holes in some regions. This will generate better candidate areas and further estimate their contours, areas, and centers to localize objects in step (4). Finally, due to the fixed distance between the trap and camera, the size of each target kind of citrus fly pests in the images remains nearly invariable. Accordingly, in steps (5) and (6), according to the sizes of candidate regions, some non-targeting insects, e.g., a small mosquito and large butterfly, can be deleted, and the remaining objects can be segmented using a fixed size that matches the size of target species of pests.
In a word, when comparing with the filter-based algorithm [46] and the recent deep CNNs based methods [15,16,17,47], our method is far faster than them because only some image processing operations are conducted on the whole image. Despite the simpleness of our method, it works effectively in this particular case of the yellow paper, which is validated by our extensive experiments. The main reasons are that the image background of the yellow paper with insects is pure, and the illuminate variation between two successive samplings is slight. Furthermore, the invariable position of a previously-captured insect in the e-trap image is the key to our method, which ensures that the previously-captured insects are removed in the subtraction operation of in step (1) of the detection procedure.
2.4. MAMPNet for Recognition of Citrus Flies
2.4.1. Structures of MAMPNet
The classification of citrus fly pests is an FGVC task [19,20] since some different species of citrus flies belong to the same family and are visually similar. In this task, local part features, e.g., the wings and thoraces, play an important role in distinguishing different species of citrus flies. To explore such local features, inspired by the advances of attention mechanisms [32,33,34,35,36,37,38], we proposed the MAMPNet, as shown in Figure 4. In the network, a multi-attention module is implanted between Blocks c and d of the backbone ResNet50 [48]. It derives multiple 3D attention matrices for feature extractions of local parts and aggregates them to form an object-level attention matrix to improve global feature learning. In order to enable the module to capture the meaningful semantic parts with better discriminations, two loss functions, i.e., the loss estimating channel selection of parts and the loss constraining parts’ spacial distributions on the feature maps, are introduced, and they are combined with the classification loss to drive the feature learning.
From Figure 4, we find that the 3D attention matrix for a meaningful semantic part is a key part of the network. In order to excavate such a part attention matrix, a scheme of two steps, i.e., from channels and spatial positions, is proposed. Namely, we individually adopt channel and spacial attention mechanisms to discover “a meaningful semantic part is composed of which specific feature channels” and “where the part is” according to [34,35,38].
Channel attention. Inspired by [34,38], we adopt the squeezing and gating mechanism in the SENet [51] to model the channel attention. Formally, given an input feature map , a channel-wise global average pooling is first performed on to obtain a vector . Then, in order to select the specific channels for a part, a gating mechanism is applied on V to form the part’s channel attention as follows
where and indicate the Sigmoid and ReLU functions, and are the learnable parameters. Here r controls the reduction rate. With the channel attention , the channel and part-specific features can be obtained from by a channel-wise weighting, i.e., where is the k-th channel feature map of .
Spacial attention. To emphasize the part spatially, the spacial attention is further developed on the channel re-weighted according to [34,38]. Firstly, we apply a global average pooling on across all channels to obtain the average spacial response map . Ideally, the part-specific shapes or patterns will appear on and the responses of other parts will be weak due to the gating role of channel attention. In order to exploit such part-specific information and highlight the responses spatially, two dilated convolutions are performed on to compute the spacial attention and the part maximal response position can be further obtained as follows:
Here, and refer to the Sigmoid function and convolution operation. The indicates a coordinate position of the spacial attention , where .
Attention-aware part and object features. Assuming that p parts are available, their channel attention, spacial attention, and spacial maximal response position, i.e., , can be obtained according to the above description. Further, the 3D part attention matrix is generated and the attention-weighted features are obtained as follows
Here, the symbol ⊗ refers to an element-wise multiplication. Specifically, the matrices and are resized to by broadcast or copy operations [50] before the multiplication. Finally, an RoI pooling [49] around is then performed on to obtain the local dimension-reduced part features from , which are formulated as follow:
where , . Here, the parameter e specifies the entry size of RoI and the parameter o sets the RoI output size, i.e., a spacial square area around , which can be determined according to the ratio of part and object sizes, e.g., and , as shown in Figure 4.
As for the object-level feature, the whole attention matrix is first generated by averaging all part attentions. Then, a residual idea is applied on to obtain the object-level features as
The residual operation will enable the module parameter to be easily optimized. It is noted that all the part and object-level features and are the outputs of the proposed multi-attention module. They will be individually fed to the following CNN blocks of multiple part branches for further exploring their discrimination, as illuminated in Figure 4. The multiple outputs of part branches and object branches are concatenated and dimension-reduced in the FC layer for the final classification.
2.4.2. Learning and Reference
The goal of the proposed multi-attention module is to utilize attention mechanisms to discover different semantic parts and learn their discriminative features not only from local parts but also from global objects. To this end, we introduce several loss functions to enable learned attention matrices to achieve the objectives in feature learning according to the ideas in the literature [34,35,37,38].
Ideally, for an input image’s p different parts, the spacial attention matrices generated in Equation (4) should meet so that a single has a compact distribution and all matrices for have diverse distributions due to different local part positions. To achieve these spacial constraints, according to [34], we introduce a loss function as follows:
Here, the symbols and , respectively, indicate the response values at coordinate positions of and , . The enables the distribution of spatially compacted around the part’s maximal response position . The encourages that only one of the spacial attention matrices for all parts has a maximal response on a spacial position . Namely, a local region around should only belong to one part. The margin is to improve the loss function’s robustness to noises. The parameter balances the roles of and .
Moreover, some semantic meaningful parts, e.g., the wing and abdomen, are across all categories of flies, which are important in discriminating different categories. To capture such parts, inspired by [35], we introduce a loss function on a batch of samples in the training network so that the channel attention of a part selects similar channels and different attentions of p parts chooses different sets of channels for all batch samples, regardless of their object-level class labels. This objective can be implemented by a clustering idea. Assuming that there are n samples in a batch, the vector denotes the channel attention of the i-th part for the j-th sample, where . Correspondingly, for the i-th part, the channel attention center of all samples can be computed. To measure similarity, we update , with a normalization. Based on them, we compute the loss,
where T indicates the transpose operator, and i and k are the indices of parts. The operations , and are equivalent to cosine similarities. In nature, the loss expresses the clustering of all , which drives the i-th part’s vectors of all samples closer and separates their centers far. Namely, the first term encourages that part of the attention focuses on similar channels, and the second term ensures that different parts of attention select different sets of channels.
Finally, considering the image classification loss corresponding to the output of MAMPNet, our final loss function for feature learning can be expressed as
where is the softmax cross entropy loss [50] for the final classification, whose input is the joint features (FC layer) combining the part and object branches in Figure 4. In feature learning, the loss term drives the part and object branches to capture the discriminative local and global features and balances their roles in the FC layer. On the other hand, the loss terms and help the image classification loss to locate the discriminative and semantic meaningful parts and improve their roles in distinguishing different species. Here, the hyperparameters and balance the roles of the three loss terms. When training the classifiers, i.e., only updating the FC layer, and are omitted by setting .
2.4.3. Training MAMPNet
In our system, the recognition task is to accurately classify three kinds of citrus fly pests (B. minax, B. dorsalis, B. scutellata) and 12 other species of insects that are possibly captured by the e-trap. For validating the task, the dataset Citrus flies in Table 1 is built to report classification performances. However, the small-scale is not enough to learn the multiple attention matrices and multiple branches in the MAMPNet. To address this, we utilize the existing datasets, e.g., iNaturalist [52], ImageNet [53], and IP102 [54], to construct two auxiliary datasets (Fruit flies and Winged insects) in Table 1 for training the MAMPNet. In a word, the procedure of a training network can be divided into the following two phases: feature learning and training classifiers.
In the feature learning, we firstly combine the train subsets split from , , and to fine-train the pre-trained ResNet50 in [55] and take its Blocks a–c as the backbone of our MAMPNet so that its backbone focuses on the classification of winged insects. Then, in order to enable the part attention matrices to better capture the significant parts of the fly categories, e.g., the wing, thorax, and abdomen, the training subsets from and are together used to train the multiple attention blocks and part branches of the MAMPNet while freezing the backbone, as shown in Figure 3 and Figure 4. In the training classifiers for evaluating recognition performances on the dataset , the FC and Softmax layers of MAMPNet are modified to match the classification task for 15 species of insects in the and their parameters are learned.
3. Experimental Results and Discussion
3.1. Experiment Settings
3.1.1. Dataset Settings
Data sources. To validate the algorithms of autocontrol, pest detection, and pest recognition designed for the e-trap, image samples of citrus flies are necessary. We collected the insect images to construct experiment datasets in the following ways. (1) Extracting from the existing datasets containing insect images according to their category information, e.g., iNaturalist [52], ImageNet [53], and IP102 [54]; (2) synthesizing the insect images on the yellow sticky paper of the e-trap; (3) collecting the insect images from some professional websites, e.g., https://www.inaturalist.org (accessed on 1 August 2020); (4) photographing the laboratory insect specimens collected in the citrus orchards.
Simulation of yellow paper images. The critical algorithms in our system mainly operate on the images or videos of yellow sticky paper on the e-trap. However, in practice, it possibly requires several years to collect all possible species of adequate pest images from the practical yellow sticky paper on the e-trap in the citrus orchard since it is affected by many factors, e.g., the seasons, climates, and quantities of pests. Therefore, in order to better represent the variations of insect images from the yellow sticky paper in practice, we synthesize the yellow paper images containing possible insects by using a yellow background image and different kinds of insects to simulate the realistic environments of the yellow sticky paper on the e-trap.
In the synthesizing process, we first pick some source images with simple backgrounds and adopt image matting operations to obtain basic insect images with transparent backgrounds and suitable sizes. Then, we randomly add some basic insect images onto an image to produce a new image , where indicates an initial pure yellow image or one sampled image in the monitoring process and the added insect images represent the newly stuck insects between two samplings in an interval of an hour. In a word, starting from indicating an image of new paper, an iterative process of the above basic operations will simulate the practical image sampling process of yellow paper on the e-trap.
Further, based on the above basic synthesizing operation, we adopt the following image operations to simulate the practical environmental factors in the system runtime of the e-trap. (1) Two parameters distributed as uniform distributions individually control the number and species of added insect images to simulate the scale of pests and dynamic pest data. (2) We resize the basic insect images in a certain range, randomly rotate them, and select positions before adding them onto to simulate different captured poses. (3) Some parameters randomly adjust the exposure, brightness, and contrast of and to simulate the practical illumination variations. Figure 5b,c shows our synthesized images of the yellow paper in different cases. In summary, the above simulation method considers the possible factors that affect the sampling of images or videos of the e-trap in practice. Accordingly, the simulated images and videos of yellow paper can credibly validate the insect detection and recognition algorithm and the autocontrol algorithms for the e-trap.
Datasets for citrus fly recognition. According to the application scene of the e-trap’s yellow paper, the recognition of citrus flies only needs to be validated on the simulated citrus fly images with a yellow background. However, the recognition algorithm based on MAMPNet requires enough samples for training the networks, and it is labor-intensive to utilize image matting operations to synthesize the images of yellow paper with insects. Moreover, the background of insect images plays fewer roles in feature learning and image classification. Therefore, we adopt the synthesized yellow background images and source images to construct the -Citrus flies in Table 1 for evaluating the recognition performances, in which the ratio of two categories of images is about 10% and 90%, namely about 600 synthesized images and 5352 source images. Its 15 species (B. minax, B. dorsalis, B. scutellata, and others) are shown in Figure 5a.
To avoid overfitting in training the MAMPNet, the two auxiliary datasets, i.e., -“Fruit flies” and -“Winged insects”, are built for feature learning according to the biological taxonomy by utilizing the image samples of some species of insects, which are available in iNaturalist [52], ImageNet [53], and IP102 [54], etc. When selecting the image samples to construct the datasets, the species of and are from the orders of Diptera and Hymenoptera in Insecta. Namely, they are the winged insects with similar appearances or textures. Therein, the species in are mainly from the families Tephritidae and Drosophila, which have similar parts compared with the citrus fly pests. In a word, they are helpful for enabling the network to capture low-level features and high-level meaningful parts in training.
3.1.2. Parameter Settings
In the insect detection and control of the e-trap, the size of the yellow paper image is approximatively set to the maximum resolution of the camera, e.g., , by adjusting the distance between the yellow paper and camera to enable it to monitor just the whole exposed paper of the e-trap, whose size matches the resolution of camera, e.g., the length of 30 cm and the width of 20 cm. Correspondingly, due to the fixed distance, the sizes of detected citrus flies in the images vary less, and the bounding boxes in detection can be set to a fixed size, e.g., . Further, all bounded and cropped insect images are resized into the size of for the following recognition. When controlling the e-trap in Algorithm 1, the LBP descriptor adopts the parameter settings in [41]. The parameters , (day), and are set respectively.
In training the MAMPNet, each of , , and are randomly split into the train, validation, test subsets according to the ratio (7:1:2). Firstly, when combining – to fine-tune the backbone network, i.e., the ResNet50 pre-trained in [55], the training process and parameter settings refer to [55]. Then, when further utilizing and to train the MAMPNet constructed by the Blocks a–d of the fine-tuned backbone, its attention modules, part branches, and FC layers are initialized randomly. The part number and other hyperparameters , , and are empirically set. The batch size (32), momentum (0.9), learning rate (), and exponential decay (0.9 per 2 epochs) are set, and the Optimizer RMSprop is adopted. Finally, when training the classifiers on for reporting recognition performances, i.e., only updating the FC and Softmax layers, they are modified to match the 15 species, and their parameters are initialized randomly.
3.2. Experiments for Autocontrol of E-Trap
The key to automatically replacing the yellow paper is to generate the right stopping signal of the motor after starting the mode of replacing paper by monitoring the yellow paper and comparing its images with a reference image of the new, unused yellow paper. In practical applications, the generation of a stopping signal may be affected by the following conditions. (1) Comparing with the reference image, the illumination conditions of sampled images in replacing the paper possibly vary since the replacing process can be started at any time. (2) When fewer insects are stuck and the timer triggers the replacing process, the partial old paper but without insects may be thought as the new paper visually. (3) An insect is flying past the camera during the replacement process. In this subsection, we design the simulation experiments to validate the proposed autocontrol algorithm and give a detailed analysis of the above conditions.
Video simulation. We synthesize the videos to simulate replacing the yellow paper, as shown in Figure 6a. Firstly, a basic yellow paper image with some insects, namely the starting frame of a video, is generated and loaded into a matrix. Then, a shift-operation on the matrix is conducted at a speed of p pixels per second and the shifted parts at the end are replaced by its yellow background. By this method, we generate 200 videos to validate the autocontrol algorithm. Specifically, as shown in Figure 6b,c, by controlling the illumination conditions of the basic images and the number of insects on it, the practical conditions (1) and (2) can be simulated in the videos. By composing a moving insect image into a video, condition (3) can be simulated by controlling its sizes and moving route. Therefore, it is reasonable to evaluate our control algorithm on the 200 simulated videos.
Validation of autocontrol algorithm. In the evaluation, we use a pure yellow image as a reference image of the new paper, as the first from the left in Figure 6b. For each video, the distances of all its frames to are computed sequentially. When the distance decreases to the threshold , the stopping signal of the motor is generated and the corresponding frame is regarded as the stop position. If the yellow paper is properly renewed at the position, namely, the stopping frame is the pure yellow image of new paper, this control is right. Correspondingly, the ratio of the number of right-controlled videos and the number of total videos is defined as the control accuracy. Specifically, when computing the distance between a sampled frame and , an image is firstly resized as the image. Then, it is partitioned into the grids, and the histogram of each grid on the LBP image is extracted. All of its histograms are concatenated and normalized with the normalization to generate the feature vector for computing the distance. For the gray-level features, the extracting procedure is similar to the LBP features, except the histograms are extracted from the gray image.
To evaluate our method and analyze the roles of LBP and blanking stamps in our system, we compare the control accuracies in the following three cases: A. Evaluate the distances between each frame and to determine the stop position directly using the gray-level features in the condition of yellow sticky paper without blanking stamps; B. Evaluate the distances by extracting the LBP features in the condition of no blanking stamps; C. Evaluate the distances using the LBP descriptor on the images with the blanking stamps. The evaluation results are shown in Table 2. Furthermore, a more detailed analysis of the special cases, e.g., the illumination variations, few insects, and an insect flying before the camera, is shown in Figure 6.
Firstly, by comparing the cases A and B in Table 2, it is obvious that the LBP descriptor is better than directly using the gray-level features for estimating the difference between the reference image and a frame of video to generate the motor’s control signal. The main reason is that the LBP descriptor eliminates the negative influences of illumination variations. This can be explained by the analysis of several videos. By inspecting the three videos (starting frames) with different illuminations and their distance variations in Figure 6b,d, on the three videos, all the proper stop signals are generated when adopting the LBP, but only one when using the gray level features. This is because the illuminations in the three videos of the new paper are different from the illumination in the reference image and the evaluation of distances is less affected by the illumination variations when adopting the LBP descriptor.
Secondly, from the contrast results of case C and B in Table 2, we can conclude that the blanking stamps on the paper shown in Figure 2b are helpful to prevent an incorrect early-stop of the motor in the case of fewer insects on the paper, which needs to be replaced due to the out-of-date attractants. In this case, the partial monitoring area may be bare, as shown by the first from left in Figure 6c. In replacing the paper, if there are no blanking stamps, the distance will drop early below the threshold , as shown by the red dotted line in Figure 6d. This will cause the incorrect partial replacement shown by the second from left in Figure 6c. If with the stamps, the distance will drop below at the correct position until the monitored area contains no blanking stamps (complete replacement), as shown by the third from left in Figure 6c and the red line in Figure 6d.
Finally, as for the occlusion caused by a flying insect in the process of replacing the paper, shown by the sampled frame in Figure 6c, it only causes a peak change of the distance curve, but never affects the generation of the stopping signal at the end, except that the occlusion occurs at the stop time, as shown by the pinkish-red line in Figure 6d. This is mainly because the reference image and the sampled image containing the occlusion are fairly different, and the estimated distance between them will not generate the stop signal. Especially, even if the incorrect control occurs just because of the occlusion at the stop time, the moving paper will stop right between the following two blanking stamps. In practice, the above occlusion very rarely occurs due to the short replacing time.
3.3. Experiments for Detection of Insects on Synthesized Yellow Paper Images
Data preparation. Our detection task is to find the newly captured insects between two neighbor samplings (, ) in one hour. Therefore, our detection algorithm’s input is a pair of images, and it detects the newly added insects on by comparing with . In the experiments, we prepare pairwise yellow paper images (, ) to simulate two samplings in one hour. For each pair, we first generate , and then randomly append some insects onto to obtain , using this means to simulate the new insects flying onto the paper. In this process, some parameters as described in Section 3.1.1 are used to control the number and species of added insects so that it better simulates the practical application. Totally, we generate 1200 such image pairs to evaluate the effectiveness of our detection method, where each pair indicates one sampling for detection.
Detection accuracy measure. In this application, our detection task is similar to selecting candidate areas in classical object detection. Namely, the new insects on are located and bounded. Therefore, we evaluate our detection algorithm by inspecting whether a newly stuck insect is right bounded rather than using IoU (Intersection over Union) [43] because a detected object is already at the center of the bounding box and the sizes of bounding boxes are invariable in our method. Assuming that there are m target insects whose sizes are similar to the citrus flies and n non-target insects that are too small or oversized, the t true and f false boxes are respectively bounded, the False Acceptation Rate (FAR), False Reject Rate (FRR), and Positive Detection Rate (PDR) are, respectively, defined as
In the detection, if multiple overlapped insects are detected as one insect, this is regarded as error detection. For example, several overlapped small insects, such as mosquitos, are detected as one target object, and several overlapped target insects are detected as one oversize non-target insect.
Experimental results and analysis. Based on the above 1200 simulated samplings, we statistically analyze the stuck insects and the detection results in Table 3. On the whole, 3809 insects are stuck on the e-trap in this simulated experiment, containing 1324 target insects, and 2485 non-target insects, respectively. Among them, 1315 target insects are detected correctly and a large number of non-target insects are efficiently discarded by setting the appropriate parameters of and . Due to the overlap and occlusion, as shown in Figure 7c, 32 false target insects are obtained and 9 true target insects are omitted. The evaluation results of FAR, FRR, and PDR show of target insects can be correctly detected while of non-target insects are accepted as target insects, and of target insects are rejected as non-target insects.
In our detection algorithm, some too small or oversize candidate regions are thought as non-target insects, and they are discarded according to the area or in order to reduce transmitting the images of the detected insects to the remote server. Therefore, the settings of and directly affect the , , and . As shown in Figure 7a, when increasing , the FAR goes down rapidly until about at . This shows that most of the small insects are discarded at this point. Then, after this point, the FRR will increase fast, which means the target objects (fruit flies) will be rejected and the PDR will decrease. Similarly, from Figure 7b, the FRR will drastically go up and the PDR will go down fast when decreasing after . In conclusion, when setting and , 99.32% of PDR together with the low FAR and FRR can be achieved.
It is noted that the high FRR (discarding the target objects) will bring worse effects to the final pest statistics than the high FAR (accepting the false objects) because the false accepted objects will be further eliminated in the following classification and the high FAR only results in some extra computations. Therefore, we can set the parameters and to suppress the FRR and enhance the PDR until 100% with less consideration of the FAR. For example, in the extreme case, all located objects in Figure 3 are bounded and segmented as the input images in the classification phase. Specifically, we also show some incorrectly detected images in Figure 7c. The main reason for error detections is the overlapping between objects. However, in practice, the possibility of objects overlapping is low because insects prefer to fly onto a blank yellow area, and the yellow paper will be renewed when more insects are available. This means that the PDR may be further enhanced in practical applications.
3.4. Experiments for Recognition of Citrus Flies
In order to analyze and validate our algorithm of citrus fly identification, we conduct ablation studies on our algorithm to evaluate the roles of multiple attentions and multiple parts. Namely, we adopt the different combinations of losses , , to learn features so that the roles of and are analyzed. This can be implemented by setting or in feature learning. Furthermore, we compare ours with several classical networks, e.g., the MobileNet-V2 [56], VGG16 [57], DenseNet121 [58], ResNet50 [48], and bilinear CNN models [59,60], which were estimated in fruit fly identification or pest recognition previously. For all the methods, the training subsets of , , and are combined to conduct feature learning, and classification accuracies are estimated on the test subset of . The average accuracy of five repetitions is reported as the final result. For more details about dataset settings and training MAMPNet, refer to Section 3.1.1 and Section 2.4.3. All the methods have been implemented in the Pytorch platform [50], and their results are reported in Table 4.
Firstly, comparing with the baseline ResNet50, our MAMPNet (No.10), the “Bilinear ResNet50” [59], and the “CBAM ResNet50” [38], respectively, achieve the accuracy gains of , , and . Therefore, our MAMPNet obtains the highest accuracy of 95.6%. On the one hand, these results show that the recognition accuracy of citrus flies can be improved by exploiting local features and improving their discriminations. For example, the bilinear operations in “Bilinear ResNet50” and the attention blocks in “CBAM ResNet50”, respectively, develop the correlations between local features and find the important local features. On the other hand, the contrast results show our MAMPNet far outperforms the “Bilinear ResNet50” and “CBAM ResNet50”. This is mainly because the structure and loss function of MAMPNet enable it to better locate and combine multiple local regions (parts), such as the wings and thoraces, and then explore their discriminations to improve the recognition rate of citrus flies.
To further analyze the attention modules and the corresponding loss terms in the loss function, the ablation studies on the loss function are demonstrated by the results of No.7–10 settings in Table 4. Comparing with the setting of MAMPNet, when adding the loss terms of and in feature learning, the MAMPNet and MAMPNet, respectively, obtain the accuracy gains of and . Their combination for the No.10 setting improves the accuracy of compared with the No.7 setting. These contrast results confirm that and are beneficial to the attention modules. This is mainly because and , respectively, append the spacial position relation constraints and the across-category channel constraints on the attention modules, which enable the attention matrices to better locate the common meaningful parts of citrus flies and explore their discriminations. The visualization of attention matrices in Figure 8a also confirms this point. Moreover, the ideas of developing spacial attentions and channel attentions have been proved effective in the other FGVC tasks [34,35,36,37]. To sum up, the highest accuracy of for MAMPNet and the ablation studies of loss terms and , together they show and are indeed helpful for exploiting discriminative local features of key parts.
Especially, to offer guidance on a selection of the backbone for citrus fly identification, we also evaluated several classical networks, i.e., MobileNet [56], VGG16 [57], DenseNet121 [58], and ResNet50 [48]. The contrast results demonstrate that a more advanced or deeper network architecture usually obtains a higher accuracy for the task of citrus fly identification to some extent. This shows our accuracy may be further improved when deeper backbone networks are adopted without considering computation costs, e.g., the ResNet101 [48] and DenseNet161 [58].
Considering that it is more important to recognize three species of target pests (B. minax, B. dorsalis, and B. scutellata) on the e-trap than the others for monitoring pest disasters, we further statistically analyze their accuracies in the cases of synthesized yellow-background images and non-yellow-background source images in Table 5. Several conclusions can be obtained from these results. (1) The accuracy of on the synthesized images is higher than the source images on average. This is mainly because the synthesized images contain fewer low-quantity images and part occlusions than the source images, which accords with the characteristic of e-trap sampling images. (2) The obvious accuracy difference is caused by the sample images’ contents rather than their backgrounds. The backgrounds of insect images affect the feature extraction and classification of citrus flies less, which can be confirmed by the classification scores of some images with the yellow background of sticky paper and the other backgrounds in Figure 8b. In a word, the accuracy evaluation of the synthesized and non-synthesized images may simulate the pest recognition on the yellow sticky paper of the e-trap. Moreover, the accuracy of for target pests can be improved in practice because of the high-quality sampling images from the e-trap.
Finally, to analyze the reasons for incorrectly recognizing a minority of difficult samples, we deeply investigate the incorrectly recognized samples shown in Figure 8c. We find this is mainly caused by two reasons as follows. (1) The key parts of a citrus fly are unclear or invisible due to the poor image qualities or photographing views of insects. (2) The recognition accuracy of a species of citrus fly pests is possibly affected by similar species because the subtle differences between them only exist in key parts, e.g., the wings and thoraces. A citrus fly may be easily recognized as another similar species when lacking information about the key parts. In fact, this characteristic also exists in all the FGVC tasks [19,20,21,22]. For instance, in Table 5, each species of target pests represents slightly different accuracies, and the average accuracy of is slightly lower than the accuracy of for all 15 species in Table 4. The main reason is that a sample of three target species is more easily recognized as a similar non-target species, e.g., B. cucurbitae and B. tau, especially when the key parts of the sample are unclear or invisible. In contrast, for some non-target species, e.g., Apis mellifera and Lucilia cuprina, the higher recognition accuracies can be obtained because they are visually different from the other species in all 15 species.
In summary, the recognition accuracy of for citrus fly pests completely meets the requirement of monitoring and early warning of the large-scale disaster of citrus fly pests. Firstly, the early warning of pest disaster mainly relies on the propagation trends and quantity distributions at many installation locations of e-traps. The incorrect recognition rate of less than will not affect the evaluation of total pest trends, e.g., the increasing speeds of pests at different installation positions and the spreading speeds from some installation positions to others. Secondly, in practice, the recognition accuracy may be improved since the distance between the camera and e-trap is fixed, and the quantities of sampled insect images are higher than those in this experiment. Moreover, after the practical installations of e-traps, more pest images will be collected to fine-train the network model and further improve the accuracy.
4. Discussion
4.1. Discussion on Design Schemes of E-Trap
Compared with the e-traps in the previous monitoring systems [1,4,5,6,7,8,9], our designed e-trap prototype has the following advantages. (1) It can operate for a long time (several months) without manual maintenances by reserving enough sticky paper in the e-trap and automatically replacing the paper. The previous e-traps [4,5,6,8] mostly adopted the yellow sticky card or the McPhail trap with liquid attractants. It is difficult to automatically replace the trap materials. They are replaced by termly manual operations. (2) Our design scheme can duly retrieve too many stuck insects so that the newly stuck insects are not overlapped on the old ones, and their sampled images are of high quality. The previous e-traps depend on manually replacing the sticky card or the liquid attractants, which may mean that too many insects are overlapped on the sticky card or in the liquid due to the late replacing.
The main disadvantage of our scheme may be the complicated mechanical structures, as shown in Figure 2d. When installing the new rolled sticky paper, the separated paper and mask, respectively, need to be correctly merged along the rollers. The installation process is a bit complex compared with the previous ones based on the yellow sticky card and the McPhail trap. However, such an installation process is required every several months. In addition, the complicated mechanical structures and the specifically processed yellow sticky paper will increase some manufacturing costs of e-traps.
4.2. Discussion on Recognition of Citrus Flies
The recognition of citrus flies is different from the other recognition tasks of crop pests [54,61,62,63], e.g., the recognition of paddy pests [62] and tomato pests [63]. In those recognition tasks, most species of pests are from different families, and their appearances represent large variances. It is easy to distinguish the different species of pests by viewing their whole appearances. However, in our task, most species of citrus flies are in the same or similar families, and different species have a similar appearance. Without viewing the whole appearance of two citrus flies, it is difficult to differentiate their species. Local features of some parts of a citrus fly are important for identifying its species. Therefore, the characteristics of our recognition task mean that the recognition algorithm of citrus flies is different from the algorithms for recognizing the across-family pests.
Our designed MAMPNet adopts the advanced attention mechanism in feature learning [35,36,37,38]. It assigns different weights for local parts of an insect when recognizing the species of the insect. Namely, for each species, some specific parts play more important roles in identifying the species. If adopting the classic deep networks directly, e.g., the MobileNet-V2 [56], VGG16 [57], DenseNet121 [58], and ResNet50 [48], the roles of local features from local parts will not be well executed because the global high-level semantic features are used for the classification of species. Especially, most of the recent research on recognizing fruit flies [24,27,28,29,30,60] directly utilized or combined the existing classic networks. Compared with them, in our MAMPNet, the local parts are located by and focused on the attention mechanism, and their features are combined with the global features for classifying the species. Therefore, the MAMPNet’s rationale better matches the way in which entomologists identify species of citrus flies, and it will obtain a higher recognition accuracy.
5. Conclusions
In this work, we design the prototype of an automatic motor-driven e-trap based on the yellow sticky paper and computer vision and further propose its algorithms of automatic control, insect detection, and pest recognition, which together construct the scheme of an automatic monitoring system of citrus flies. The motor control algorithm based on image analysis can automatically replace the yellow sticky paper containing attractants according to the validity period of attractants and the insect density on the e-trap, enabling it to operate for several months without human maintenance. Furthermore, in order to obtain the statistics of citrus flies on the e-trap, the simple, effective insect detection algorithm and the MAMPNet for citrus fly classification are, respectively, proposed to detect new trapped insects and recognize their species successively. The extensive experiments on the simulated yellow paper images confirm that our designed e-trap and its algorithms can effectively monitor the citrus fly pests.
In the future, on the one hand, field tests will be conducted to check and improve our designed e-trap prototype and corresponding algorithms. Firstly, through the field tests, a large number of realistic images of citrus fly pests and other insects on the e-trap will be collected. More images of citrus fly pests will be beneficial to improve their recognition accuracies by fine-tuning the proposed MAMPNet. Moreover, the attractant efficiency of the e-trap may be further enhanced by the field tests. On the other hand, the prediction of large-scale citrus fly pests will be studied, namely, how to utilize the pest data collected by the distributed e-traps to evaluate the outbreak probability of a large-scale disaster. It is noted that our e-trap is possibly applicable to the surveillance of other flyable and attractable Diptera pests. It can be easily applied to monitor other kinds of flyable pests by using the appropriate insect attractants. Therefore, we will also study how to extend the application scenarios of the e-trap.
6. Patents
China Patent: A replacing-paper and trapping equipment based on a kind of two-layer sticky paper with mask for sticking insects. Patent No. ZL201921710966.9.
Author Contributions
Conceptualization, methodology, R.H.; investigation, resources, T.Y.; project administration and funding acquisition, Y.Z.; software, visualization, and validation, C.Z.; formal analysis, data curation, and supervision, G.Z.; writing—original draft preparation, review, and editing, R.H. and T.Y. All authors have read and agreed to the published version of the manuscript.
Funding
This research was funded by the Chongqing Science and Technology Bureau under Grant cstc2018jscx-msybX0232, the Fundamental Research Funds for the Central Universities under Grant XDJK2019B057, the earmarked fund for the China Agriculture Research System (CARS-26) and the Chongqing Municipal Human Resources and Social Security Bureau under Grant cx2018099, in part by Grants cstc2019jcyj-msxmX0265 and NSFC 61702426.
Institutional Review Board Statement
Not applicable.
Informed Consent Statement
Not applicable.
Data Availability Statement
Not applicable.
Acknowledgments
We thank iNaturalist for the high-quantity image samples of insects with category information on the website: https://www.inaturalist.org (accessed on 1 August 2020).
Conflicts of Interest
The authors declare no conflict of interest.
Abbreviations
The following abbreviations are used in this manuscript:
| CNN | Convolution Neural Networks |
| LBP | Local Binary Pattern |
| HSV | Hue Saturation Value |
| FGVC | Fine-Grained Visual Classification |
| RoI | Region of Interest |
| GAP | Global Average Pooling |
| FC | Full Connection |
| FAR | False Accept Rate |
| FRR | False Reject Rate |
| PDR | Positive Detection Rate |
Appendix A. Datasets
Appendix A.1. Dataset D 1 -Citrus Flies
The dataset -Citrus flies mainly contains the insect species (Diptera and Hymenoptera) that could possibly be stuck on the e-trap in China. Their species and number of images are listed as follows. 1. B. minax (267); 2.B. dorsalis (578); 3. B. scutellata (153); 4. B. cucurbitae (319); 5. B. tau (926); 6. B. diaphora (181); 7. Apis mellifera (464); 8. Episyrphus balteatus (379); 9. Vespa bicolor (320); 10. Olistes rothneyi (285); 11. Vespula vulgaris (386); 12. Diplazon laetatorius (413); 13. Musca domestica (429); 14. Lucilia cuprina (435); 15. Calliphora vicina (417); in total: 15 species, 5952 images.
References
- Cardim Ferreira Lima, M.; Damascena de Almeida Leandro, M.E.; Valero, C.; Pereira Coronel, L.C.; Gonçalves Bazzo, C.O. Automatic Detection and Monitoring of Insect Pests—A Review. Agriculture 2020, 10, 161. [Google Scholar] [CrossRef]
- Lloyd, A.C.; Hamacek, E.L.; Kopittke, R.A.; Peek, T.; Wyatt, P.M.; Neale, C.J.; Eelkema, M.; Gu, H. Area-wide management of fruit flies (Diptera: Tephritidae) in the Central Burnett district of Queensland, Australia. Crop Prot. 2010, 29, 462–469. [Google Scholar] [CrossRef]
- Jessup, A.J.; Dominiak, B.; Woods, B.; De Lima, C.P.F.; Tomkins, A.; Smallridge, C.J. Area-wide management of fruit flies in Australia. In Area-Wide Control of Insect Pests; Vreysen, M.J.B., Robinson, A.S., Hendrichs, J., Eds.; Springer: Dordrecht, The Netherlands, 2007; pp. 685–697. [Google Scholar]
- Shaked, B.; Amore, A.; Ioannou, C.; Valdes, F.; Alorda, B.; Papanastasiou, S.; Goldshtein, E.; Shenderey, C.; Leza, M.; Pontikakos, C.; et al. Electronic traps for detection and population monitoring of adult fruit flies (Diptera: Tephritidae). J. Appl. Entomol. 2017, 142, 43–51. [Google Scholar] [CrossRef]
- Doitsidis, L.; Fouskitakis, G.N.; Varikou, K.N.; Rigakis, I.I.; Chatzichristofis, S.A.; Papafilippaki, A.K.; Birouraki, A.E. Remote monitoring of the Bactrocera oleae (Gmelin) (Diptera: Tephritidae) population using an automated McPhail trap. Comput. Electron. Agric. 2017, 137, 69–78. [Google Scholar] [CrossRef]
- Hong, S.J.; Kim, S.Y.; Kim, E.; Lee, C.H.; Lee, J.S.; Lee, D.S.; Kim, G. Moth Detection from Pheromone Trap Images Using Deep Learning Object Detectors. Agriculture 2020, 10, 170. [Google Scholar] [CrossRef]
- Wang, J.; Chen, X.; Hou, X.; Zhou, L.; Zhu, C.; Ji, L. Construction, implementation and testing of an image identification system using computer vision methods for fruit flies with economic importance (Diptera: Tephritidae). J. Appl. Entomol. 2016, 73, 1511–1528. [Google Scholar] [CrossRef] [PubMed]
- Alorda, B.; Valdes, F.; Mas, B.; Leza, M.; Almenar, L.; Feliu, J.; Ruiz, M.; Miranda, M. Design of an energy efficient and low cost trap for Olive fly monitoring using a ZigBee based Wireless Sensor Network. In Proceedings of the 10th European Conference on Precision Agriculture (ECPA), Rishon LeTsiyon, Israel, 12–16 July 2015; pp. 1–23. [Google Scholar]
- Philimis, P.; Psimolophitis, E.; Hadjiyiannis, S.; Giusti, A.; Perello, J.; Serrat, A.; Avila, P. A centralised remote data collection system using automated traps for managing and controlling the population of the Mediterranean (Ceratitis capitata) and olive (Dacus oleae) fruit flies. In Proceedings of the International Conference on Remote Sensing and Geoinformation of the Environment (RSGY), Paphos, Coral Bay Cyprus, 5 August 2013; pp. 8–16. [Google Scholar]
- George, S.C. History and use of the McPhail trap. Florida Entomol. 1977, 60, 11–16. [Google Scholar]
- Hall, D.G. An assessment of yellow sticky card traps as indicators of the abundance of adult Diaphorina citri (Hemiptera: Psyllidae) in citrus. J. Econ. Entomol. 2009, 10, 446–452. [Google Scholar] [CrossRef]
- Zhou, X.; Niu, C.; Han, P.; Desneux, N. Field evaluation of attractive lures for the fruit fly Bactrocera minax (Diptera: Tephritidae) and their potential use in spot sprays in Hubei Province (China). J. Econ. Entomol. 2012, 105, 1277–1284. [Google Scholar] [CrossRef]
- Hall, D.G. Field comparison of chemical attractants and traps for Caribbean fruit fly (Diptera: Tephritidae) in Florida citrus. J. Econ. Entomol. 2005, 98, 1641–1647. [Google Scholar] [CrossRef]
- Xiao, D.; Yang, Q.; Fu, J.; Deng, X.; Feng, J.; Ye, Y.; Lu, Y. A multi-target trapping and tracking algorithm for Bactrocera Dorsalis based on cost model. Comput. Electron. Argic. 2016, 123, 224–231. [Google Scholar]
- Ding, W.; Taylor, G. Automatic moth detection from trap images for pest management. Comput. Electron. Agric. 2016, 123, 17–28. [Google Scholar] [CrossRef] [Green Version]
- Kalamatianos, R.; Karydis, I.; Doukakis, D.; Avlonitis, M. DIRT: The Dacus Image Recognition Toolkit. J. Imaging 2018, 4, 129. [Google Scholar] [CrossRef] [Green Version]
- Sun, Y.; Liu, X.; Yuan, M.; Ren, L.; Wang, J.; Chen, Z. Automatic in-trap pest detection using deep learning for pheromone-based Dendroctonus valens monitoring. Biosyst. Eng. 2018, 176, 140–150. [Google Scholar] [CrossRef]
- Zhan, C.; Duan, X.; Xu, S.; Song, Z.; Luo, M. An improved moving object detection algorithm based on frame difference and edge detection. In Proceedings of the Fourth International Conference on Image and Graphics (ICIG), Chengdu, China, 22–24 August 2007; pp. 519–523. [Google Scholar]
- Deng, J.; Krause, J.; Li, F. Fine-grained crowdsourcing for fine-grained recognition. In Proceedings of the 2013 IEEE Conference on Computer Vision and Pattern Recognition, Portland, OR, USA, 23–28 June 2013; pp. 580–587. [Google Scholar]
- Wei, X.S.; Wu, J.; Cui, Q. Deep learning for fine-grained image analysis: A survey. arXiv 2019, arXiv:1907.03069. [Google Scholar]
- Khosla, A.; Jayadevaprakash, N.; Yao, B.; Li, F.F. Novel dataset for fine-grained image categorization: Stanford dogs. In Proceedings of the CVPR Workshop on Fine-Grained Visual Categorization (FGVC), Colorado Springs, CO, USA, 20–25 June 2011. [Google Scholar]
- Berg, T.; Liu, J.; Woo Lee, S.; Alexander, M.L.; Jacobs, D.W.; Belhumeur, P.N. Large-scale fine-grained visual categorization of birds. In Proceedings of the 2014 IEEE Conference on Computer Vision and Pattern Recognition, Columbus, OH, USA, 23–28 June 2014; pp. 2011–2018. [Google Scholar]
- Martineau, M.; Conte, D.; Raveaux, R.; Arnault, I.; Munier, D.; Venturinia, G. A survey on image-based insect classification. Pattern Recognit. 2017, 65, 273–284. [Google Scholar] [CrossRef] [Green Version]
- Leonardo, M.M.; Avila, S.; Zucchi, R.A.; Faria, F.A. Mid-level image representation for fruit fly identification (diptera: Tephritidae). In Proceedings of the 2017 IEEE 13th International Conference on e-Science (e-Science), Auckland, New Zealand, 24–27 October 2017; pp. 202–209. [Google Scholar]
- Faria, F.A.; Perre, P.; Zucchi, R.A.; Jorge, L.R.; Lewinsohn, T.M.; Rocha, A.; Torres, R. Automatic identification of fruit flies (Diptera: Tephritidae). J. Vis. Commun. 2014, 25, 1516–1527. [Google Scholar] [CrossRef]
- Fan, R.; Chang, K.; Hsieh, C.; Wang, X.; Lin, C. LIBLINEAR: A library for large linear classification. J. Mach. Learn. Res. 2008, 115, 1871–1874. [Google Scholar]
- Leonardo, M.M.; Carvalho, T.; Rezende, E.; Zucchi, R.; Faria, F.A. Deep feature-based classifiers for fruit fly identification (diptera: Tephritidae). In Proceedings of the 31st SIBGRAPI Conference on Graphics, Patterns and Images (SIBGRAPI), Parana, Brazil, 29 October–1 November 2018; pp. 1–7. [Google Scholar]
- Remboski, T.B.; Souza, W.D.; Aguiar, M.S.; Ferreira, P.R. Identification of fruit fly in intelligent traps using techniques of digital image processing, machine learning. In Proceedings of the 33rd ACM/SIGAPP Symposium On Applied Computing (ACM-SAC), Pau, France, 9–13 April 2018; pp. 260–267. [Google Scholar]
- Jiang, Z.; Chazot, P.L.; Celebi, M.E.; Crookes, D.; Jiang, R. Social Behavioral Phenotyping of Drosophila with a 2D–3D Hybrid CNN Framework. IEEE Access 2019, 7, 67972–67982. [Google Scholar] [CrossRef]
- Peng, Y.; Liao, M.; Huang, W.; Deng, H.; Ao, L.; Hua, J. Fruit fly classification via convolutional neural network. In Proceedings of the 2018 Chinese Automation Congress (CAC), Xi’an, China, 30 November–2 December 2018; pp. 3395–3399. [Google Scholar]
- Murali, N.; Schneider, J.; Levine, J.; Taylor, G. Classification and re-identification of fruit fly individuals across days with convolutional neural networks. In Proceedings of the IEEE Winter Conference on Applications of Computer Vision (WACV), Hawaii, HI, USA, 8–10 January 2019; pp. 570–578. [Google Scholar]
- Huang, S.; Xu, Z.; Tao, D.; Zhang, Y. Part-stacked cnn for fine-grained visual categorization. In Proceedings of the 2016 IEEE Conference on Computer Vision and Pattern Recognition (CVPR), Las Vegas, NV, USA, 27–30 June 2016; pp. 1173–1182. [Google Scholar]
- Xie, L.; Tian, Q.; Hong, R.; Yan, S.; Zhang, B. Hierarchical part matching for fine-grained visual categorization. In Proceedings of the 2013 IEEE International Conference on Computer Vision, Sydney, NSW, Australia, 1–8 December 2013; pp. 1641–1648. [Google Scholar]
- Han, J.; Yao, X.; Cheng, G.; Feng, X.; Xu, D. P-CNN: Part-based convolutional neural networks for fine-grained visual categorization. IEEE Trans. Pattern Anal. Mach. Intell. 2019. [Google Scholar] [CrossRef]
- Luo, W.; Yang, X.; Mo, X.; Lu, Y.; Davis, L.S.; Li, J.; Lim, S.N. Cross-X learning for fine-grained visual categorization. In Proceedings of the 2019 IEEE/CVF International Conference on Computer Vision (ICCV), Seoul, Korea, 27 October–2 November 2019; pp. 8242–8251. [Google Scholar]
- Zheng, H.; Fu, J.; Mei, T.; Luo, J. Learning multi-attention convolutional neural network for fine-grained image recognition. In Proceedings of the 2017 IEEE International Conference on Computer Vision (ICCV), Venice, Italy, 22–29 October 2017; pp. 5209–5217. [Google Scholar]
- Sun, M.; Yuan, Y.; Zhou, F.; Ding, E. Multi-attention multi-class constraint for fine-grained image recognition. In Proceedings of the European Conference on Computer Vision (ECCV), Munich, Germany, 8–14 September 2018; pp. 805–821. [Google Scholar]
- Woo, S.; Park, J.; Lee, J.Y.; So Kweon, I. CBAM: Convolutional block attention module. In Proceedings of the European Conference on Computer Vision (ECCV), Munich, Germany, 8–14 September 2018; pp. 3–19. [Google Scholar]
- Lucchi, A.; Sambado, P.; Royo, A.B.; Bagnoli, B.; Benelli, G. Lobesia botrana males mainly fly at dusk: Video camera-assisted pheromone traps and implications for mating disruption. J. Pest Sci. 2018, 91, 1327–1334. [Google Scholar] [CrossRef]
- Preti, M.; Verheggen, F.; Angeli, S. Insect pest monitoring with camera-equipped traps: Strengths and limitations. J. Pest Sci. 2021, 94, 203–217. [Google Scholar] [CrossRef]
- Ojala, T.; Pietikainen, M.; Maenpaa, T. Multiresolution gray-scale and rotation invariant texture classification with local binary patterns. IEEE Trans. Pattern Anal. Mach. Intell. 2002, 24, 971–987. [Google Scholar] [CrossRef]
- Lee, J.S. Digital image smoothing and the sigma filter. Comput. Vision, Graph. Image Process. 1983, 24, 255–269. [Google Scholar] [CrossRef]
- Leibe, B.; Schindler, K.; Cornelis, N.; Van Gool, L. Coupled object detection and tracking from static cameras and moving vehicles. IEEE Trans. Pattern Anal. Mach. Intell. 2008, 30, 1683–1698. [Google Scholar] [CrossRef] [PubMed] [Green Version]
- Moghaddam, R.F.; Cheriet, M. AdOtsu: An adaptive and parameterless generalization of Otsu’s method for document image binarization. Pattern Recognit. 2012, 45, 2419–2431. [Google Scholar] [CrossRef]
- Vincent, L. Morphological transformations of binary images with arbitrary structuring elements. Signal Process. 1991, 22, 3–23. [Google Scholar] [CrossRef]
- Chen, S.Y. Kalman filter for robot vision: A survey. IEEE Trans. Ind. Electron. 2012, 59, 4409–4420. [Google Scholar] [CrossRef]
- Ren, S.; He, K.; Girshick, R.; Sun, J. Faster r-cnn: Towards real-time object detection with region proposal networks. In Proceedings of the Twenty-ninth Conference on Neural Information Processing Systems (NeurIPS), Montreal, QC, Canada, 7–10 December 2015; pp. 91–99. [Google Scholar]
- He, K.; Zhang, X.; Ren, S.; Sun, J. Deep residual learning for image recognition. In Proceedings of the 2016 IEEE Conference on Computer Vision and Pattern Recognition (CVPR), Las Vegas, NV, USA, 27–30 June 2016; pp. 770–778. [Google Scholar]
- Dai, J.; Li, Y.; He, K.; Sun, J. Multi-attention multi-class constraint for fine-grained image recognition. arXiv 2016, arXiv:1806.05372. [Google Scholar]
- Ketkar, N. Introduction to Pytorch. In Deep Learning with Python; Apress: Berkeley, CA, USA, 2017; pp. 195–208. [Google Scholar]
- Hu, J.; Shen, L.; Sun, G. Squeeze-and-excitation networks. In Proceedings of the 2018 IEEE/CVF Conference on Computer Vision and Pattern Recognition, Salt Lake City, UT, USA, 18–23 June 2018; pp. 7132–7141. [Google Scholar]
- Horn, G.V.; Aodha, O.M.; Song, Y.; Cui, Y.; Sun, C.; Shepard, A.; Adam, H.; Perona, P.; Belongie, S. The inaturalist species classification and detection dataset. In Proceedings of the 2018 IEEE Conference on Computer Vision and Pattern Recognition, Salt Lake City, UT, USA, 18–22 June 2018; pp. 8769–8778. [Google Scholar]
- Russakovsky, O.; Deng, J.; Su, H.; Krause, J.; Satheesh, S.; Ma, S.; Huang, Z. Imagenet large scale visual recognition challenge. Int. J. Comput. Vis. 2015, 115, 211–252. [Google Scholar] [CrossRef] [Green Version]
- Wu, X.; Zhan, C.; Lai, Y.; Cheng, M.; Yang, J. IP102: A Large-Scale Benchmark Dataset for Insect Pest Recognition. In Proceedings of the 2019 IEEE Conference on Computer Vision and Pattern Recognition, Long Beach, CA, USA, 15–20 June 2019; pp. 8787–8796. [Google Scholar]
- Cui, Y.; Song, Y.; Sun, C.; Howard, A.; Belongie, S. Large scale fine-grained categorization and domain-specific transfer learning. In Proceedings of the 2018 IEEE Conference on Computer Vision and Pattern Recognition, Salt Lake City, UT, USA, 18–22 June 2018; pp. 4109–4118. [Google Scholar]
- Sandler, M.; Howard, A.; Zhu, M.; Zhmoginov, A.; Chen, L.C. Mobilenetv2: Inverted residuals and linear bottlenecks. In Proceedings of the 2018 IEEE Conference on Computer Vision and Pattern Recognition, Salt Lake City, UT, USA, 18–22 June 2018; pp. 4510–4520. [Google Scholar]
- Simonyan, K.; Zisserman, A. Very deep convolutional networks for large-scale image recognition. arXiv 2019, arXiv:1409.1556. [Google Scholar]
- Huang, G.; Liu, Z.; Van Der Maaten, L.; Weinberger, K.Q. Densely connected convolutional networks. In Proceedings of the 2017 IEEE Conference on Computer Vision and Pattern Recognition Workshops, Honolulu, HI, USA, 21–26 July 2017; pp. 4700–4708. [Google Scholar]
- Lin, T.Y.; RoyChowdhury, A.; Maji, S. Bilinear cnn models for fine-grained visual recognition. In Proceedings of the 2015 IEEE International Conference on Computer Vision (ICCV), Santiago, Chile, 7–13 Decemebre 2015; pp. 1449–1457. [Google Scholar]
- Peng, Y.; Liao, M.; Song, Y.; Liu, Z.; He, H.; Deng, H.; Wang, Y. FB-CNN: Feature Fusion-Based Bilinear CNN for Classification of Fruit Fly Image. IEEE Access 2019, 8, 3987–3995. [Google Scholar] [CrossRef]
- Li, Y.; Wang, H.; Dang, L.M.; Sadeghi-Niaraki, A.; Moon, H. Crop pest recognition in natural scenes using convolutional neural networks. Comput. Electron. Agric. 2020, 169, 105174. [Google Scholar] [CrossRef]
- Rahman, C.R.; Arko, P.S.; Ali, M.E.; Khan, M.A.I.; Apon, S.H.; Nowrin, F.; Wasif, A. Identification and recognition of rice diseases and pests using convolutional neural networks. Biosyst. Eng. 2020, 194, 112–120. [Google Scholar] [CrossRef] [Green Version]
- Pattnaik, G.; Shrivastava, V.K.; Parvathi, K. Transfer Learning-Based Framework for Classification of Pest in Tomato Plants. Appl. Artif. Intell. 2020, 34, 981–993. [Google Scholar] [CrossRef]
Figure 1.
(a) Basic structures and functions of the designed e-trap. (b) The monitoring system of citrus flies by deploying the distributed e-traps.
Figure 1.
(a) Basic structures and functions of the designed e-trap. (b) The monitoring system of citrus flies by deploying the distributed e-traps.

Figure 2.
(a) Processing of two-layer sticky paper with attractants. (b) A demonstration of the unrolled paper with blanking stamps. (c) Appearance of trap. (d) A sectional view of a motor-driven trap.
Figure 2.
(a) Processing of two-layer sticky paper with attractants. (b) A demonstration of the unrolled paper with blanking stamps. (c) Appearance of trap. (d) A sectional view of a motor-driven trap.
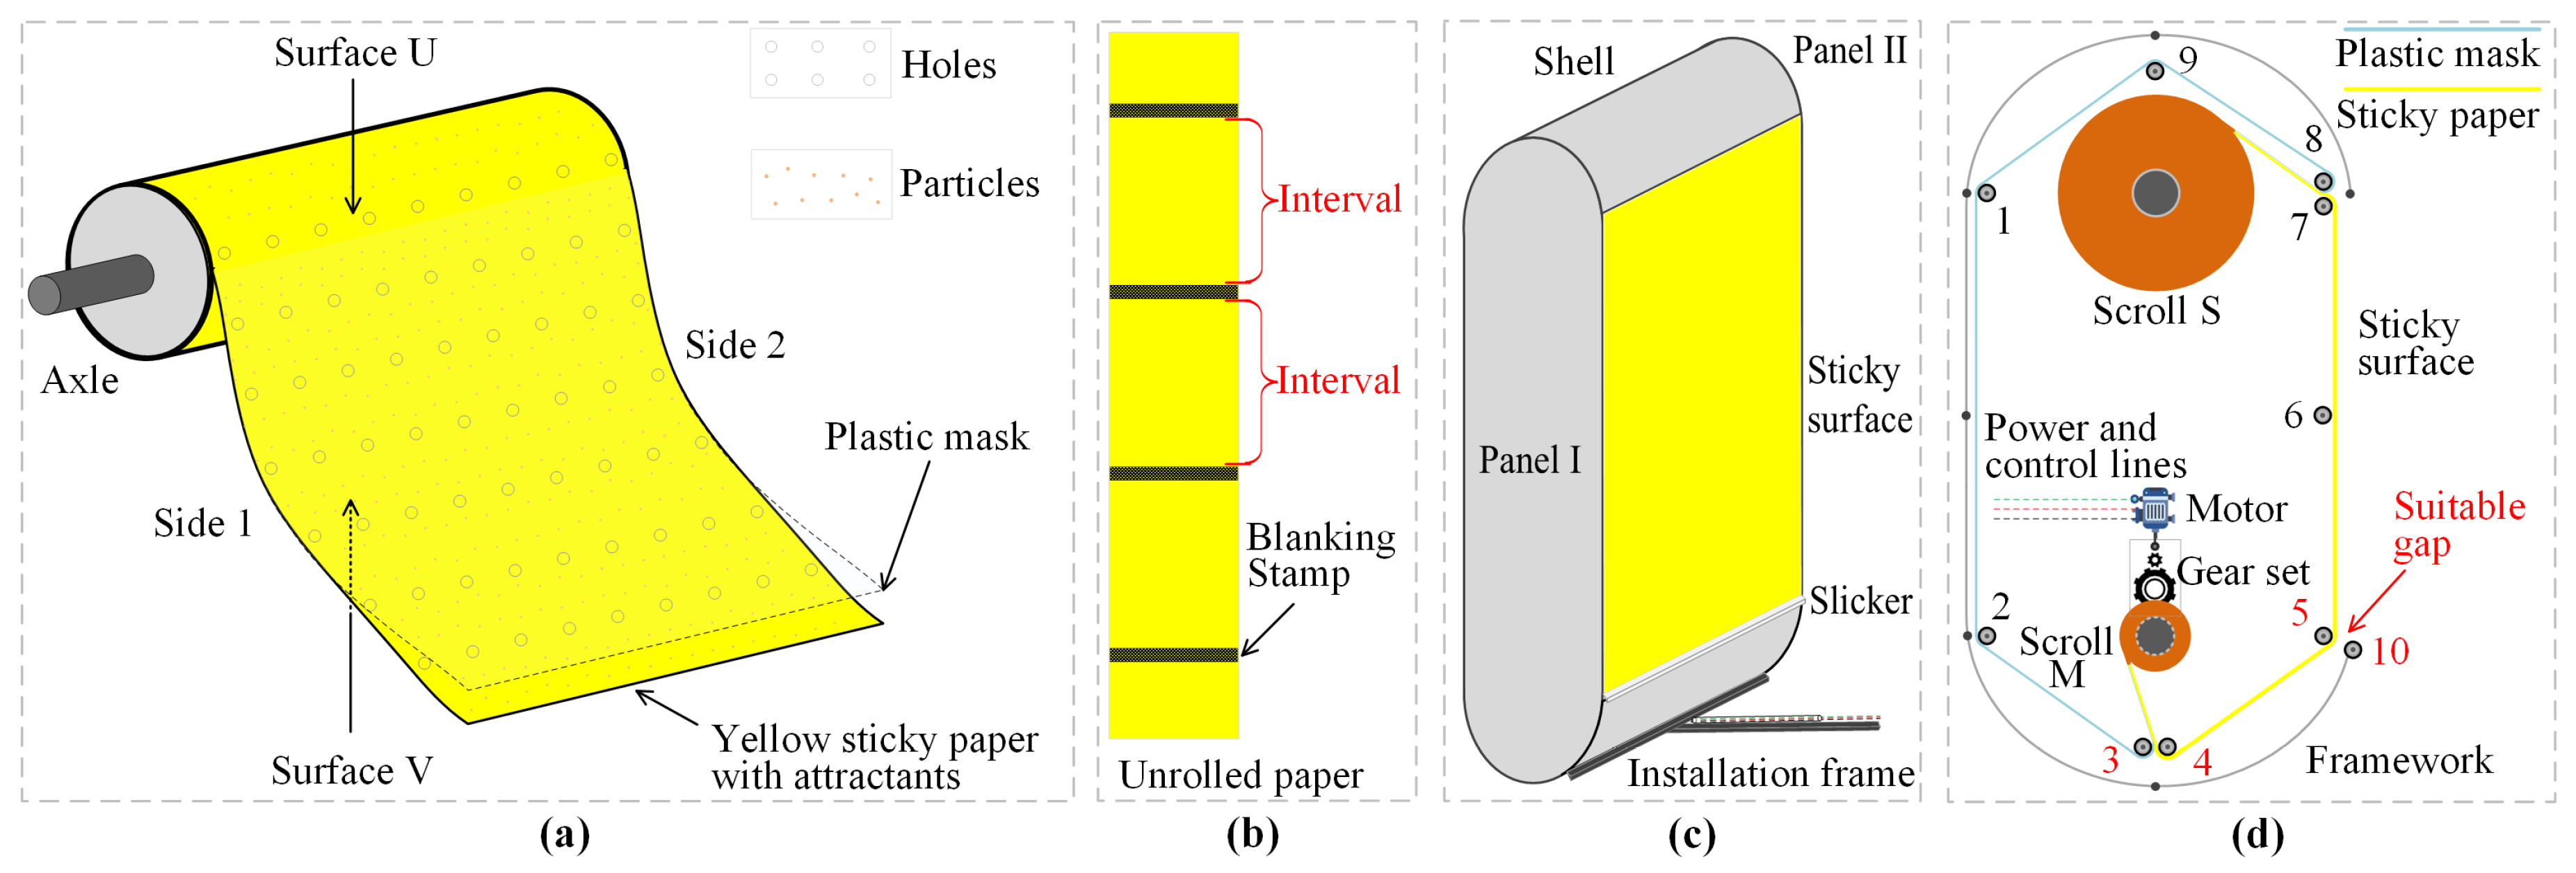
Figure 3.
An overview of detecting and recognizing citrus flies. (a) Detection and segmentation. (1) The difference between two successive sampled images is converted to a gray image. (2) The Otsu algorithm [44] is performed to obtain a binary image. (3) The morphological transformations are deployed on the white regions of the binary image to generate the candidate areas. (4) The contours, centers, and areas of candidate regions are estimated, and the possible objects in are localized. (5) Some small and large objects are further filtered out according to the objects’ areas. (6) Finally, the remained objects are segmented using a fixed-size bounding box, and the segmented images are resized. (b) Classification and statistics. The segmented and resized insect images from the detection phase are fed to the trained MAMPNet (Multi-Attention and Multi-Part convolutional neural Network), which learn the object-level and attention-aware part features of citrus flies on the multiple constructed datasets. Each detected insect is classified as one of 15 possible species of insects. Finally, the statistical results of three target species of citrus fly pests, i.e., B. minax, B. dorsalis and B. scutellata, are counted up. Especially, the FC layer indicates the Full Connection layer and the CNN means the Convolutional Neural Network.
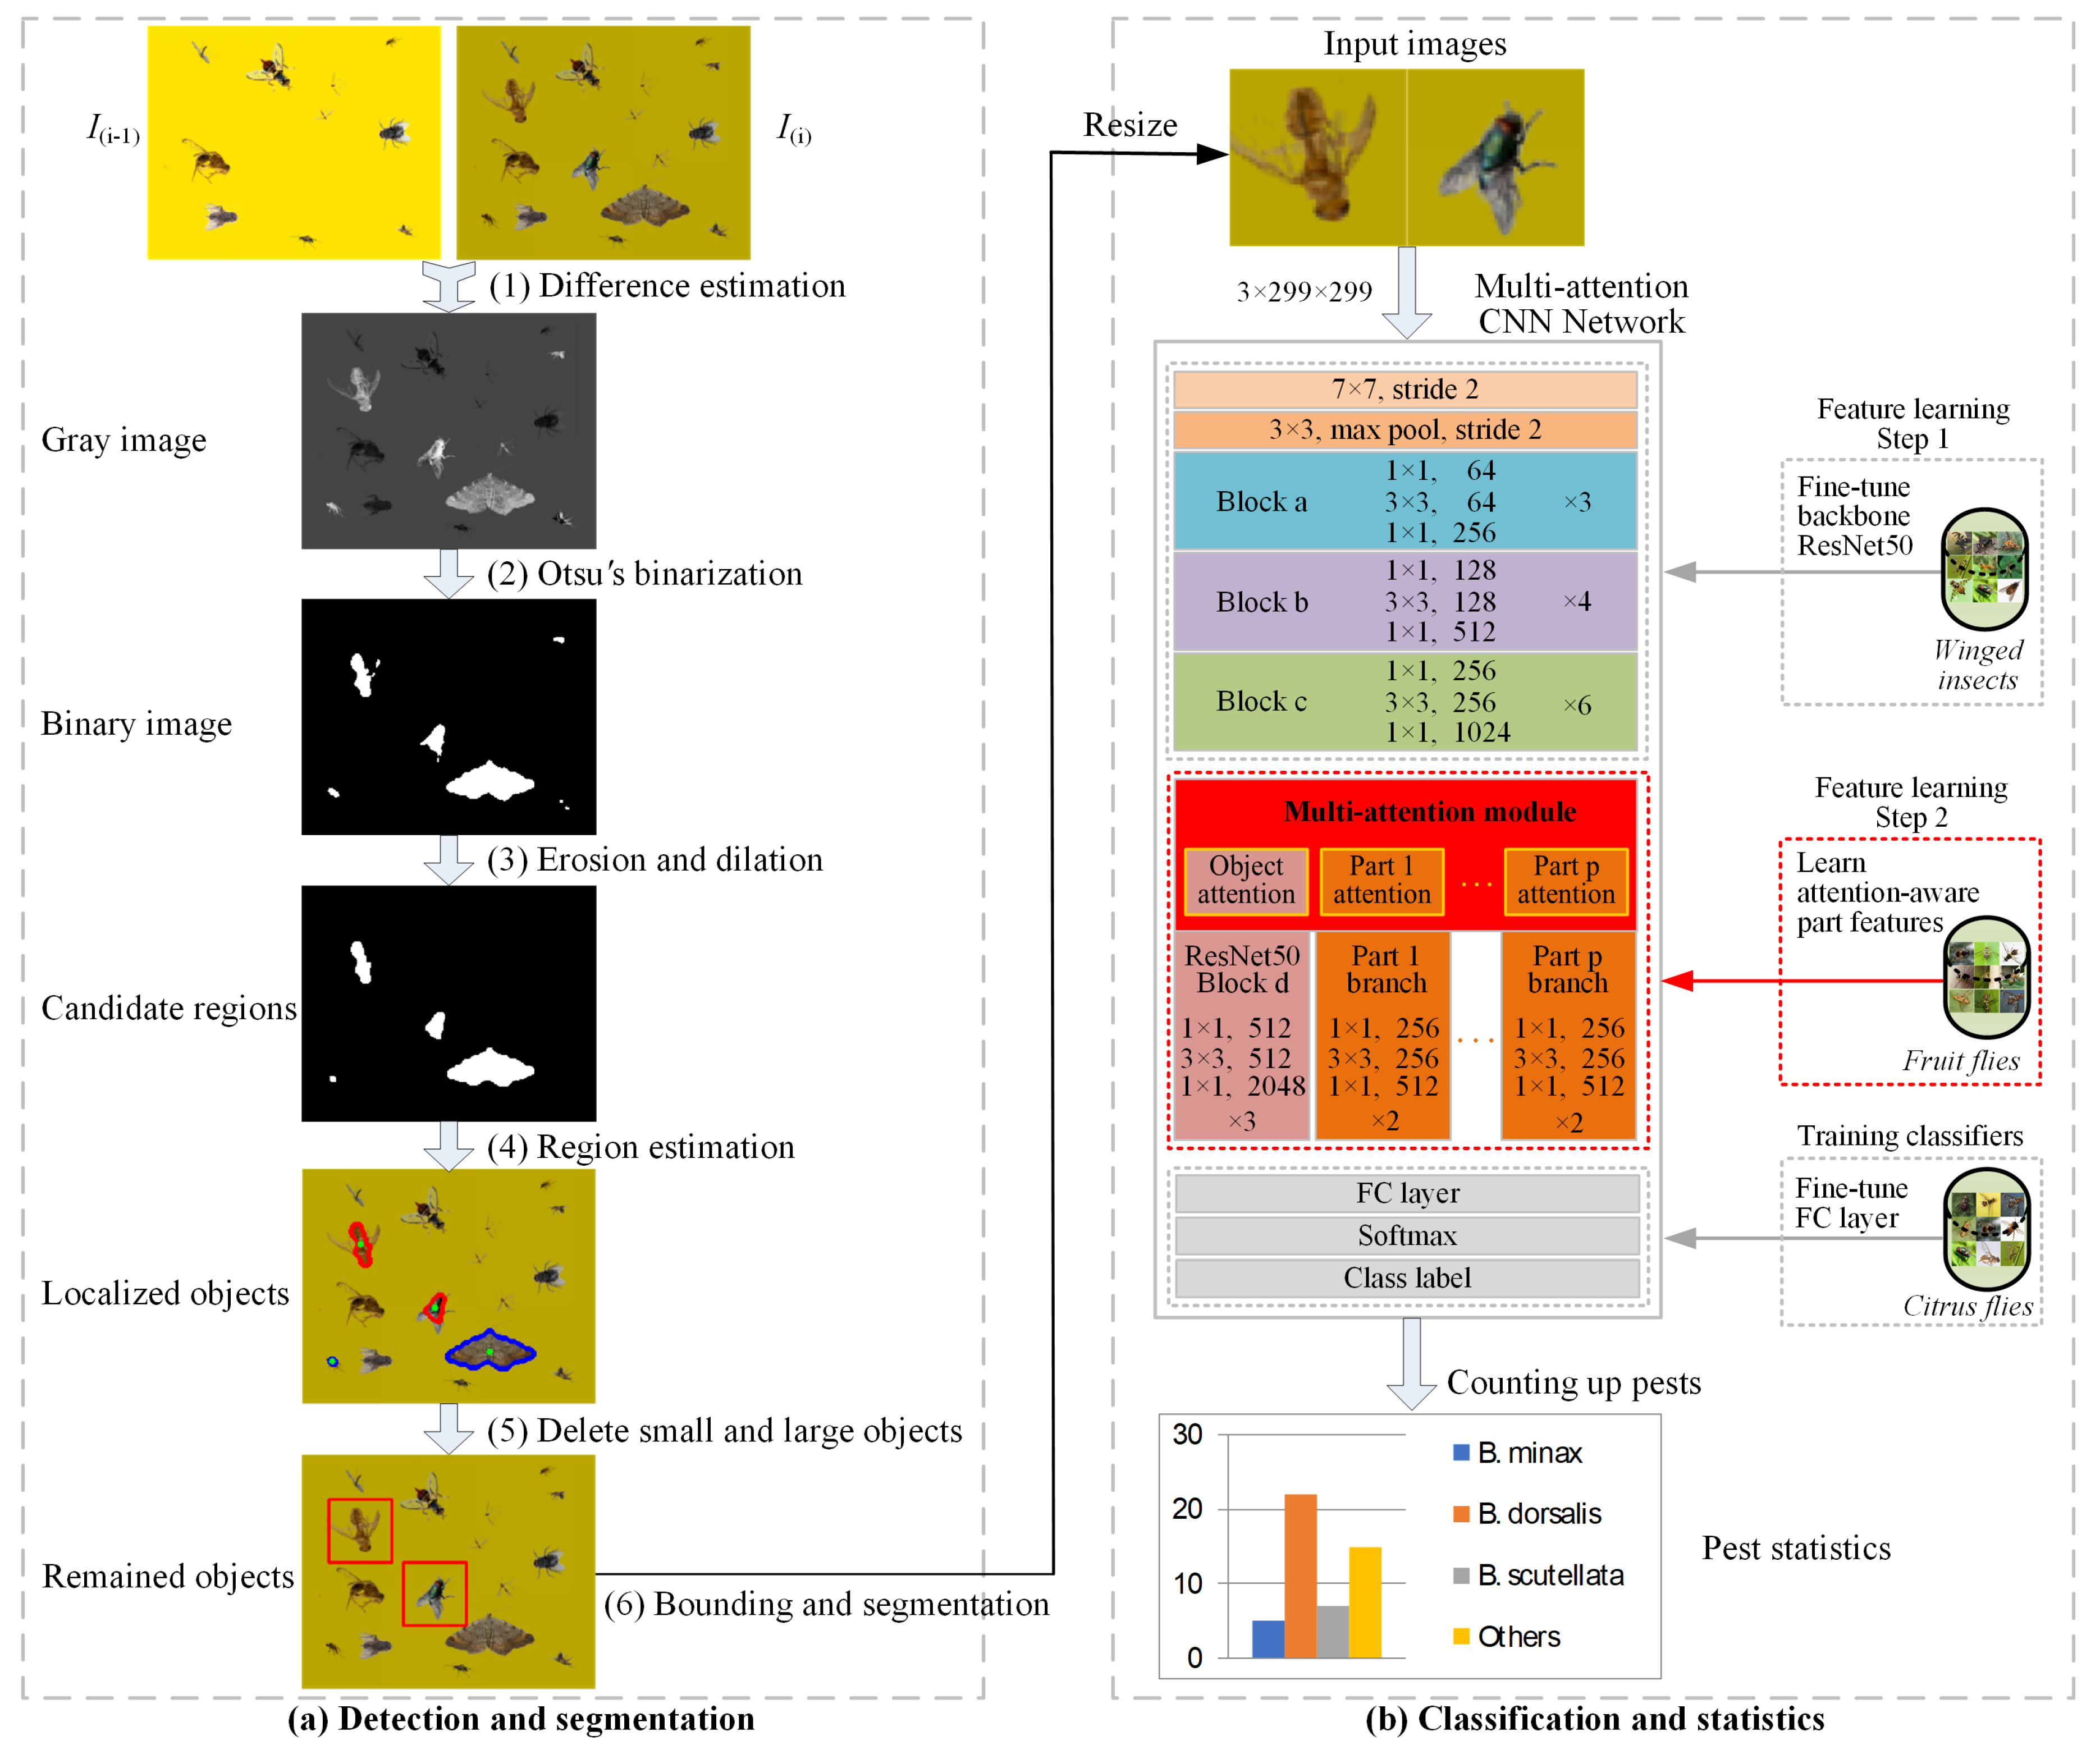
Figure 4.
Structures of MAMPNet (Multi-Attention and Multi-Part convolutional neural Network). (a) Network framework. A multi-attention module is implanted between block c and d of backbone ResNet50. The multiple attention matrices for parts and one object-level matrix are learned, and they are combined with the input feature maps to generate part features using RoI operations and attention-aware object-level global features in different branches. Finally, the local part features and global object features are concatenated and reduced to 1024 dimensions in the FC layer for the followed classification. (b) Attention module and part branch. (1) The channel attention of the i-th part is learned to select such part-related channels. (2) The spacial attention is further learned to localize and focus the i-th part. (3) The RoI operation [49] is used to discard the unrelated features and extract uniform local features of the i-th part. (4) The part branch, constructed by the stacked convolutional layers and average pooling layer, is used to explore the discrimination of local features of the i-th part. Its structure is similar to the basic residual unit in the ResNet50 implemented in Pytorch [50], where Convs indicates the stacked convolutional layers using the sequential , , and filters. Here, the GAP indicates Global Average Pooling, the FC means Full Connection, and the RoI means Region of Interest.

Figure 5.
(a) The main insect species are possibly stuck on the e-trap and their categories information is described in Appendix A.1. (b) The simulated yellow paper images for e-trap’s autocontrol and insect detection. (c) The synthesized and cropped insect images for validating the recognition algorithm.
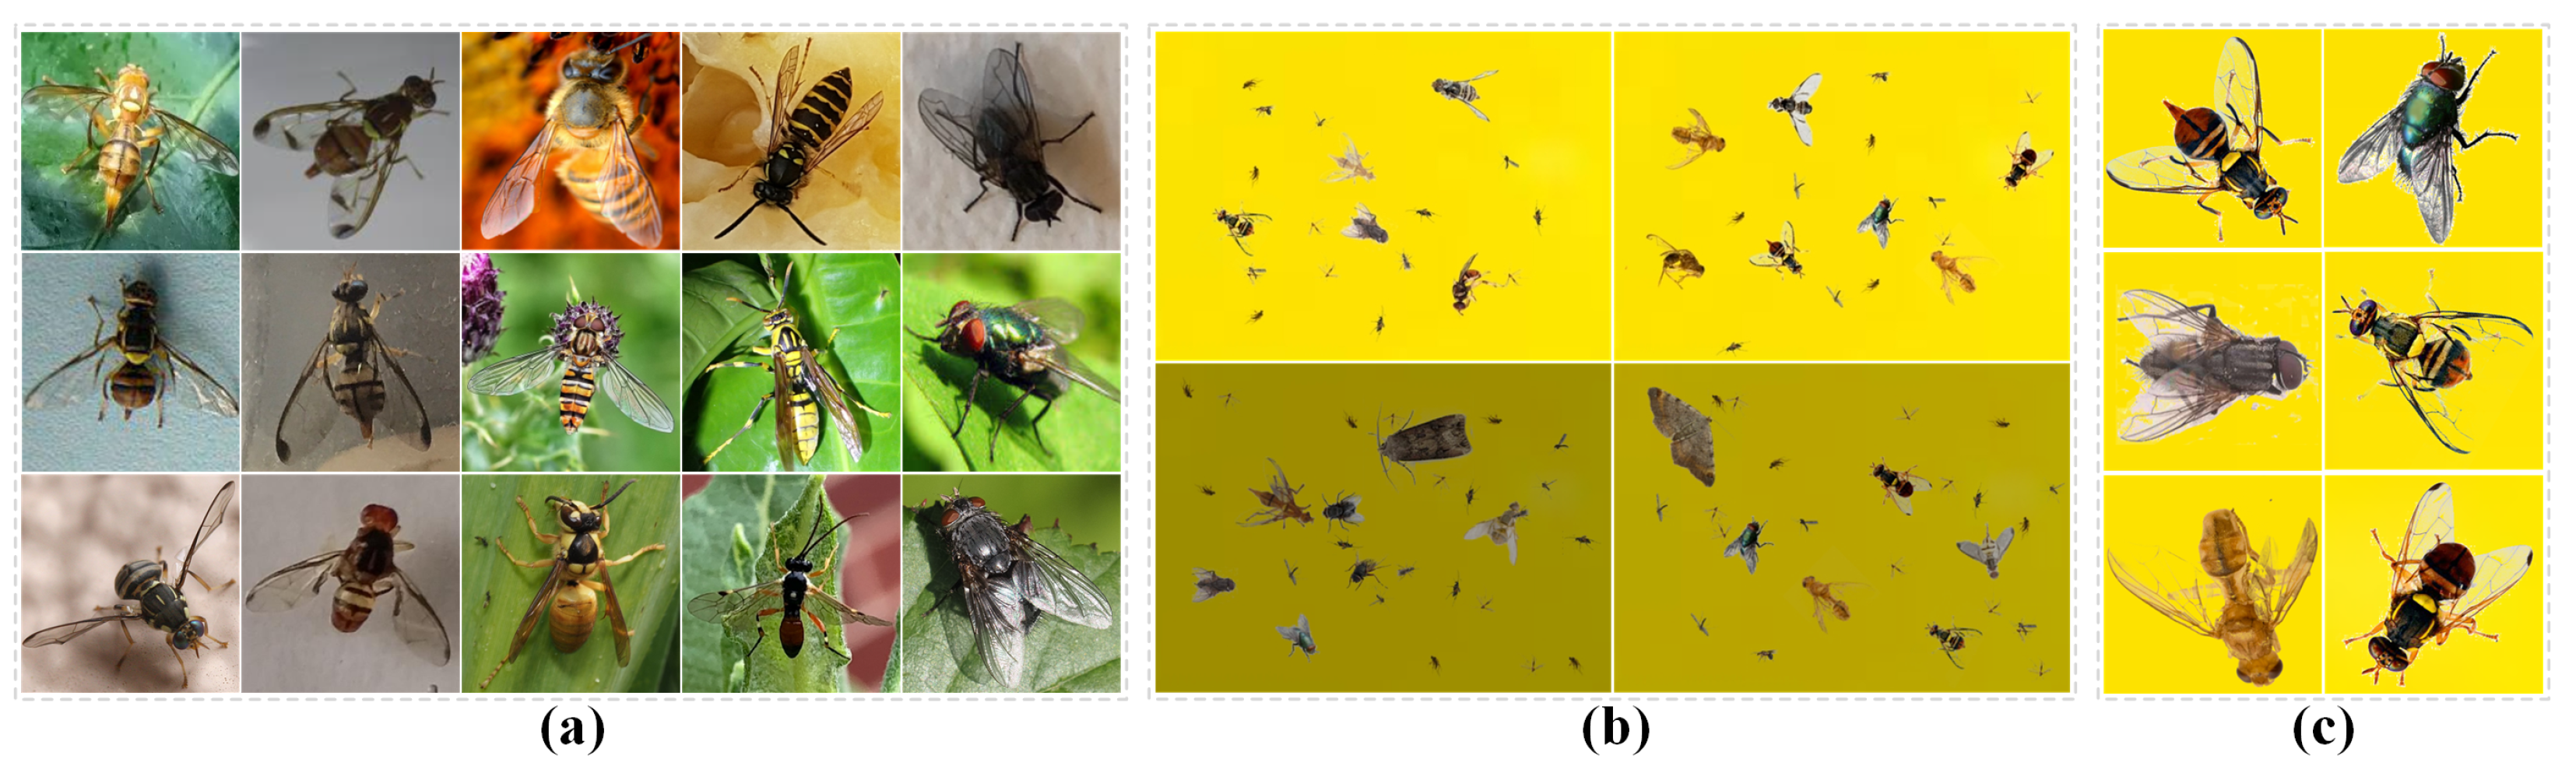
Figure 6.
The image analysis for controlling the motor signal. (a) The starting, intervening, stopping frames of a simulated video of the replacing process. The red rectangle is the visible monitored area of the e-trap. Its left and right indicate the old and new papers, respectively, which are invisible and protected in the e-trap in practice. The right moving rectangle simulates rolling the paper. (b) The reference image and starting frames of three videos with different illuminations (Illu1, Illu2, Illu3). (c) Special cases for fewer insects on the paper and occlusions caused by a flying insect before the camera. (d) The analysis of the replacing processes for different videos. A curve describes the distance variations between and frames of a video. If a distance falls below the threshold , the stop signal of the motor is generated. Here, the LBP indicates Local Binary Pattern.

Figure 7.
Analysis of the detection algorithm. (a) Effects of setting different without considering ; (b) effects of setting different without considering ; (c) error detections. The green-border image indicates a false acceptation. The blue and red-border images are the incorrectly rejected cases. Here, the FAR, FRR, and PDR respectively indicate the False Acceptation Rate, False Reject Rate, and Positive Detection Rate.
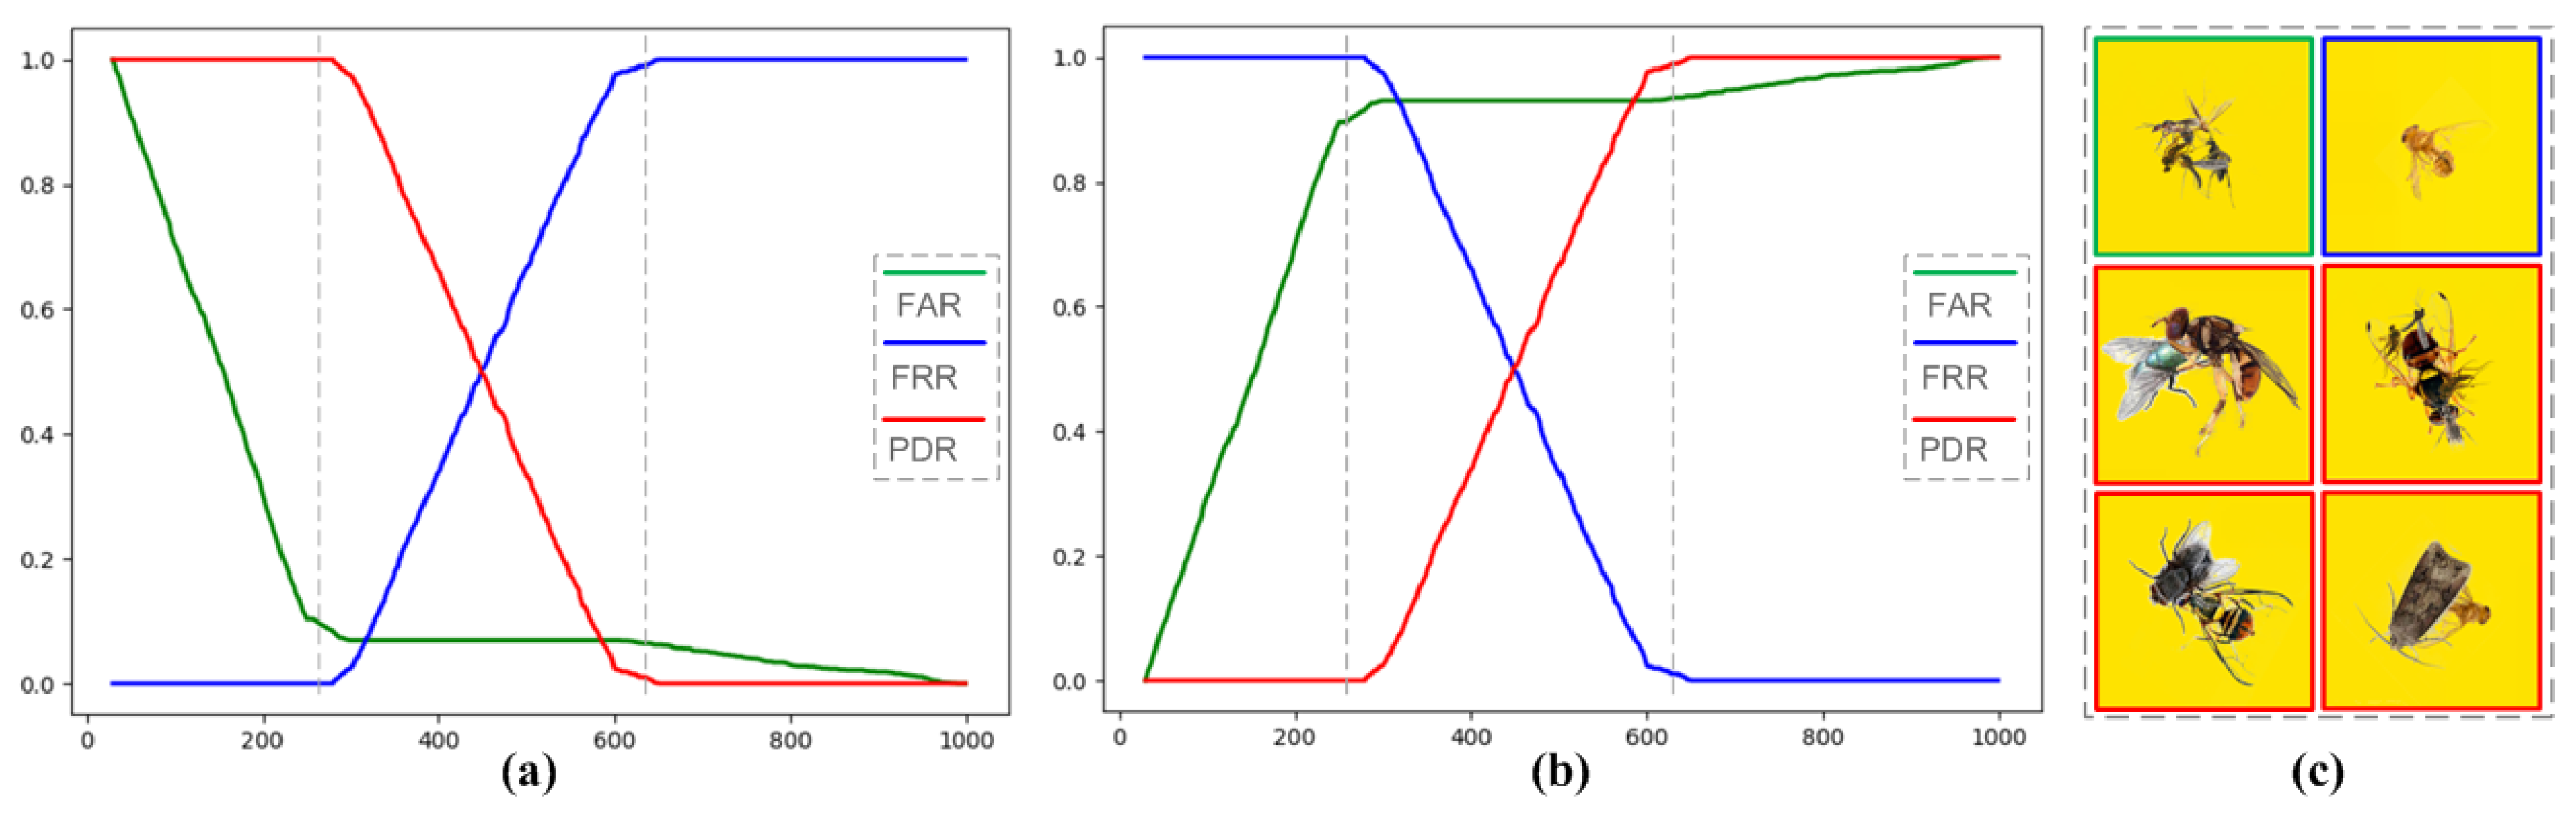
Figure 8.
Analysis of the recognition of some samples. (a) Visualization of the attention modules. The blue and magenta areas visualize the and modules, respectively. (b) Comparison of classification scores of sample pairs with different backgrounds. (c) Incorrectly recognized samples in the cases of occlusion, special poses, and low image qualities.
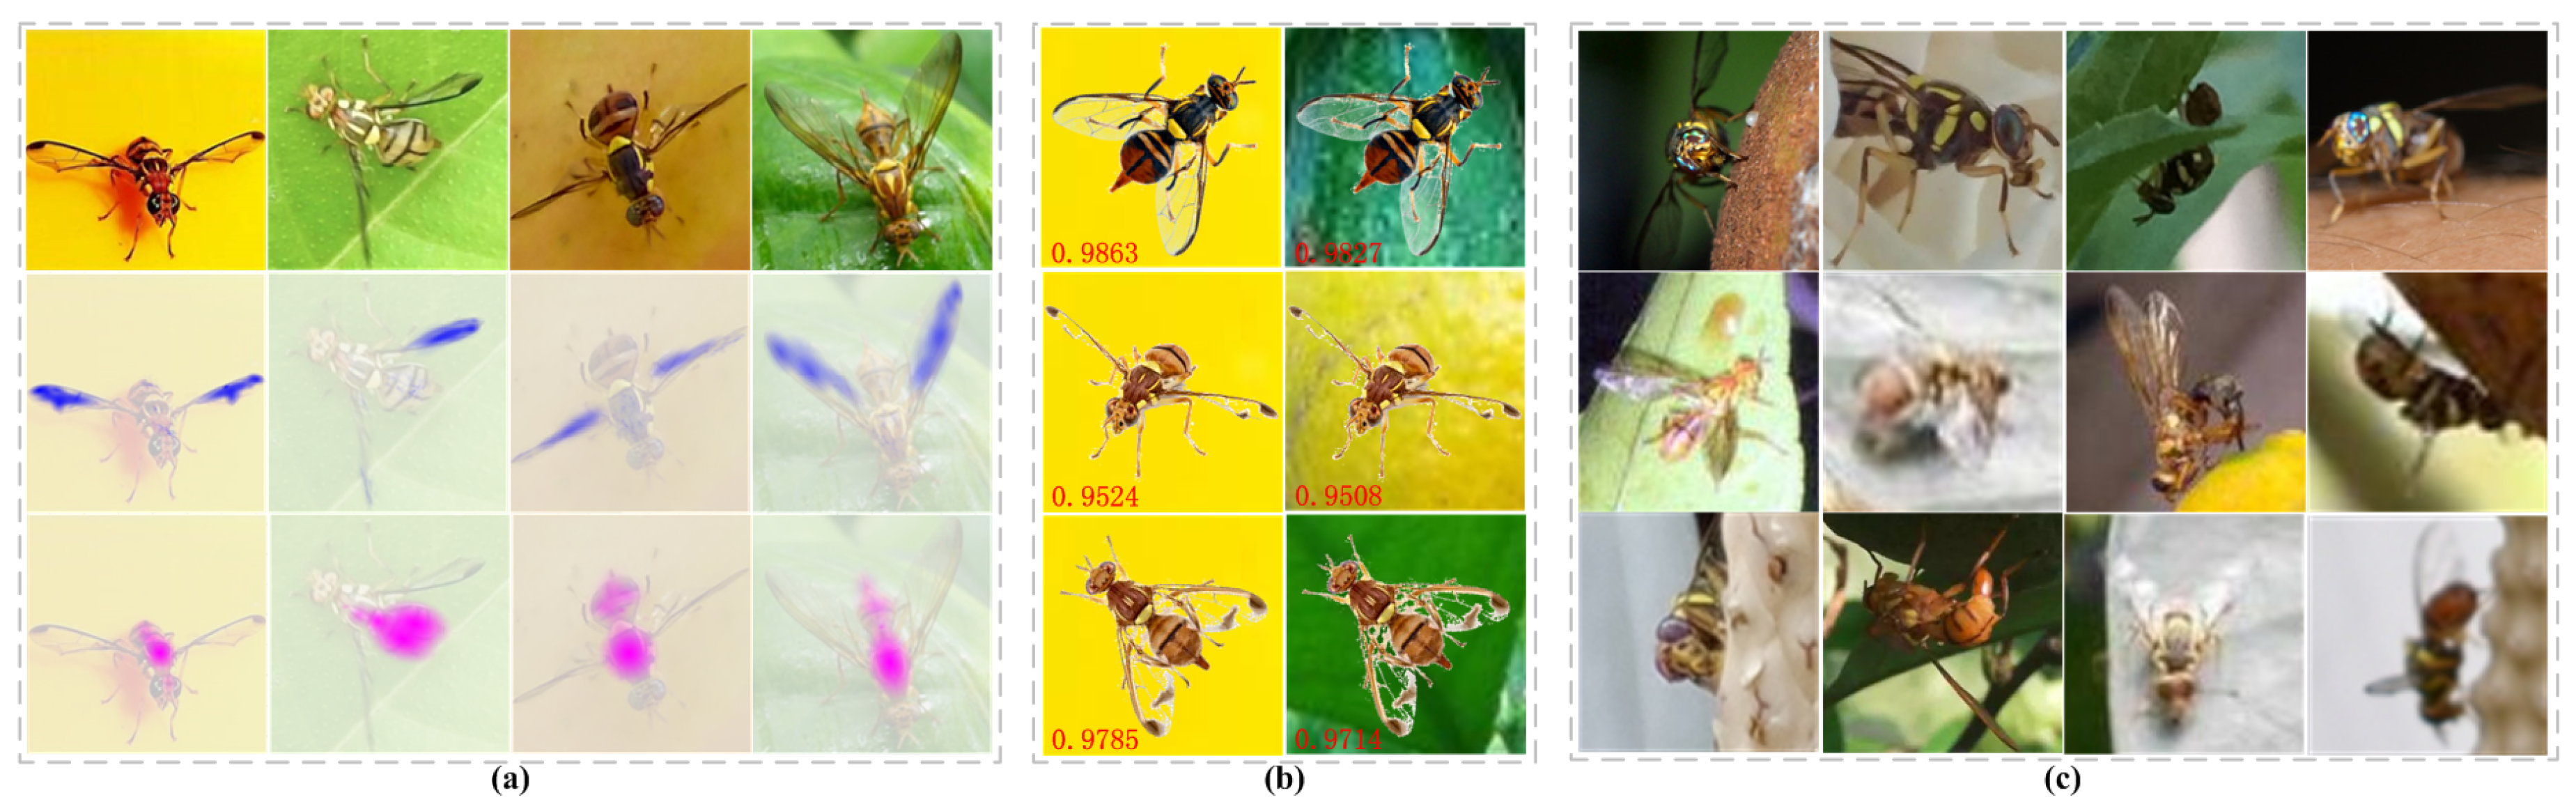

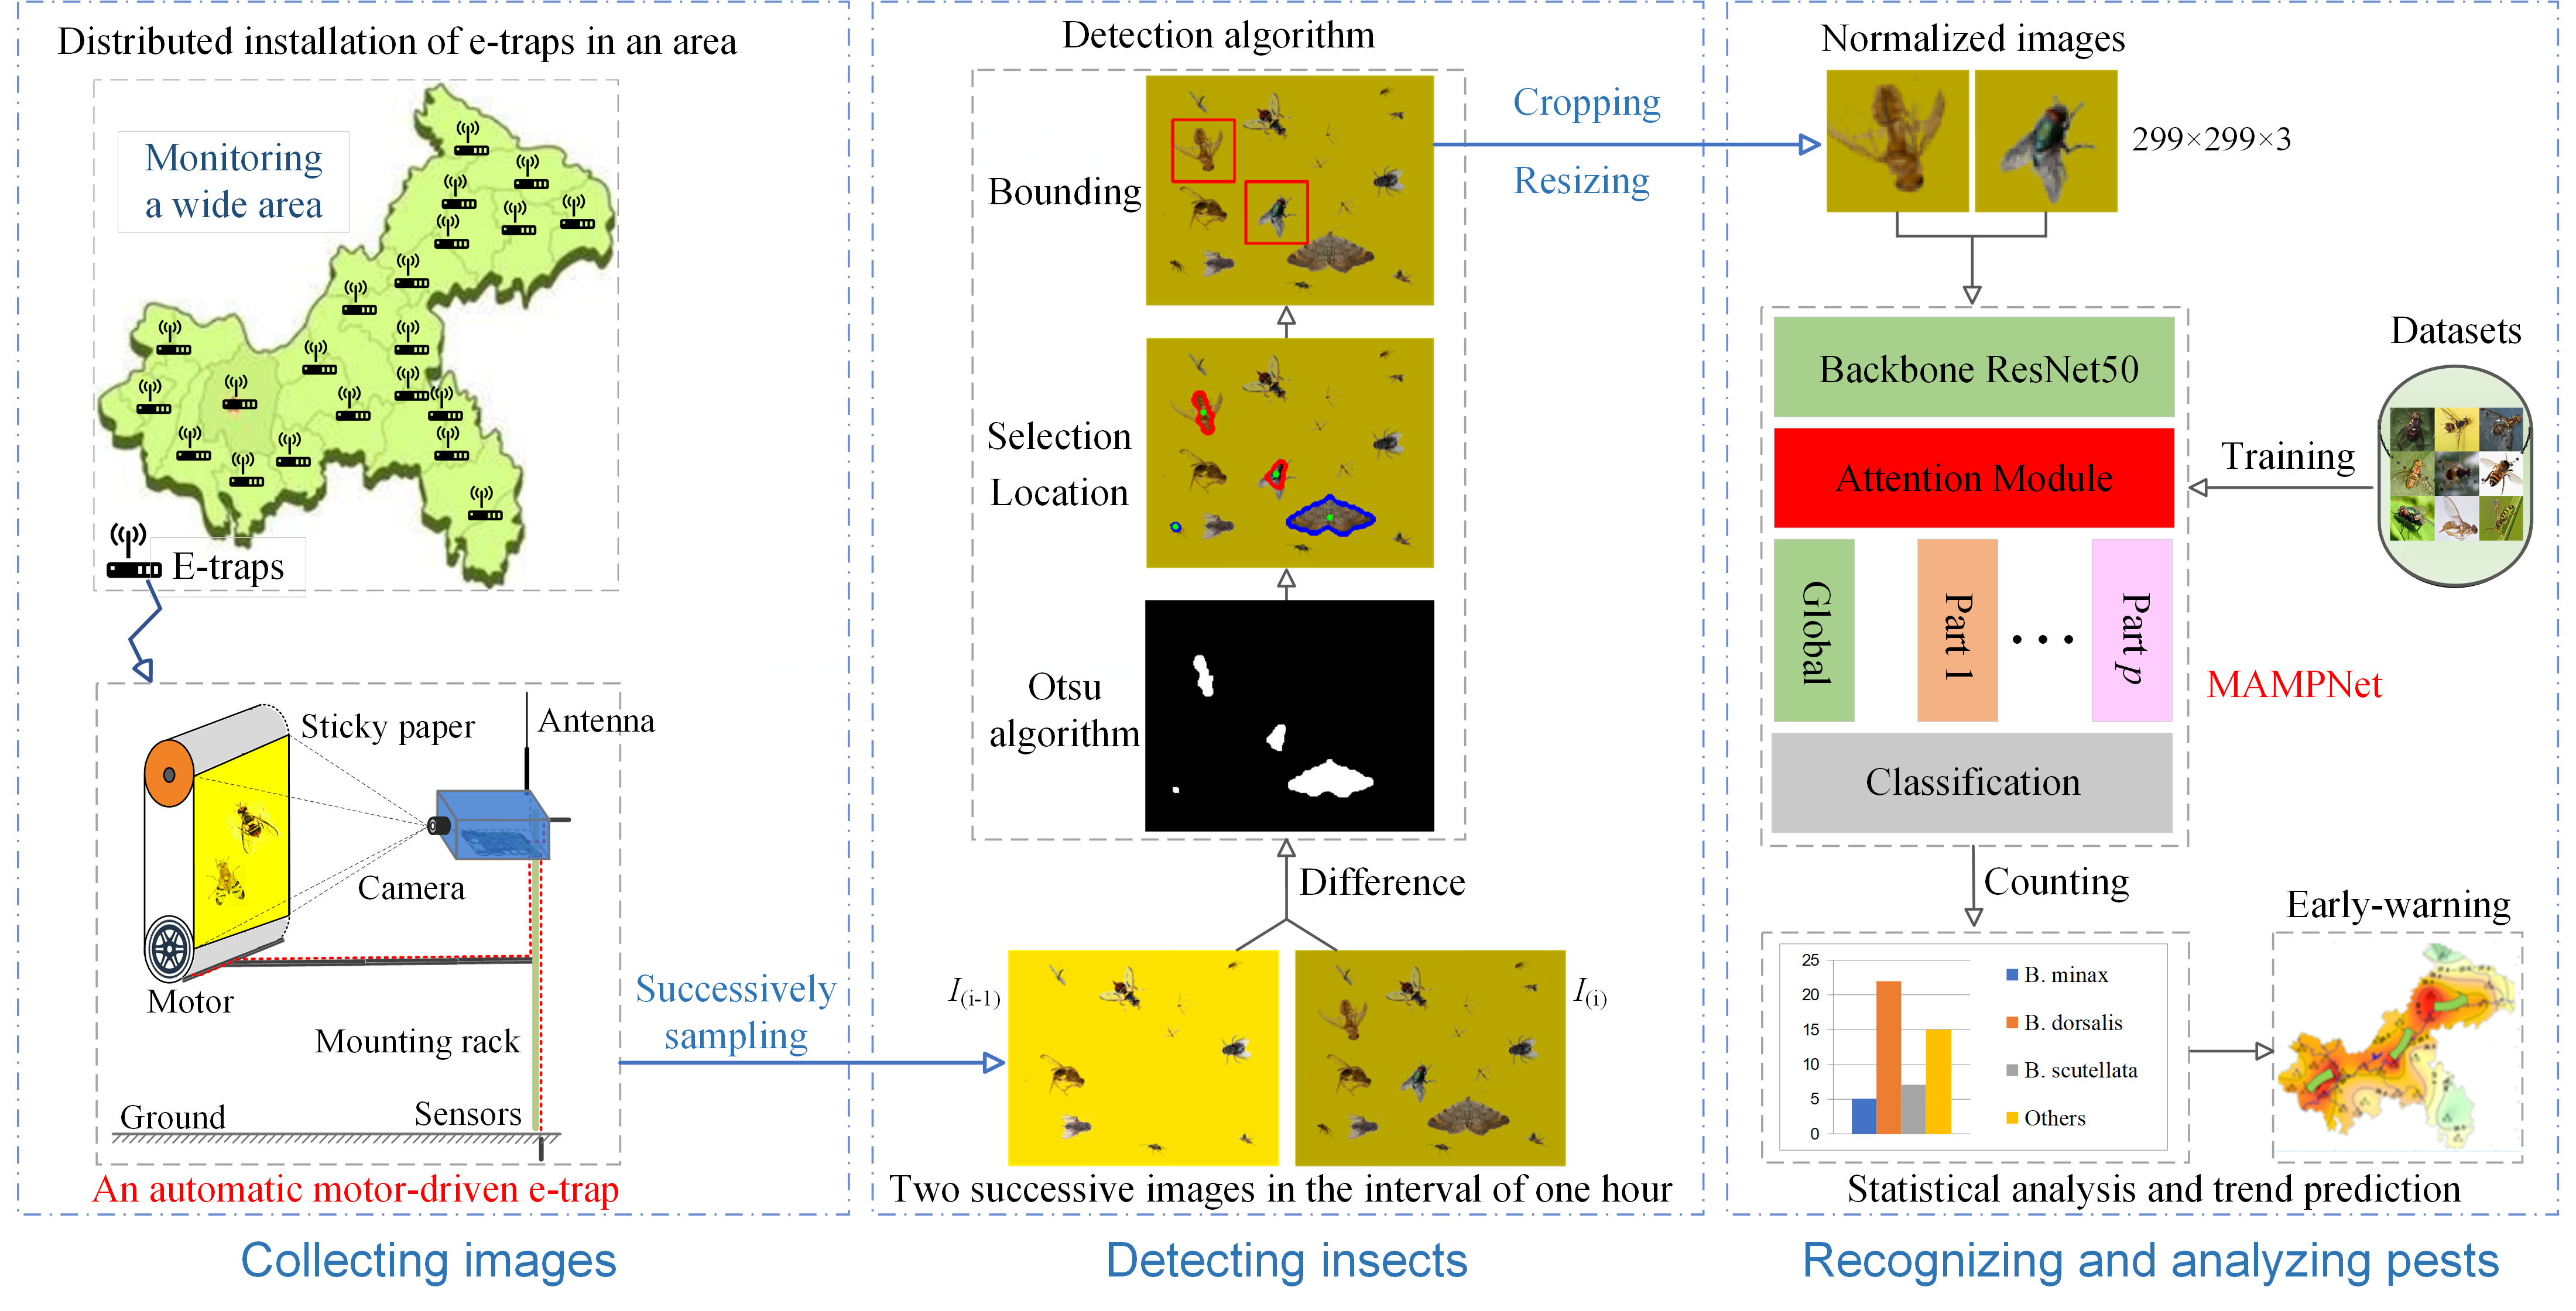
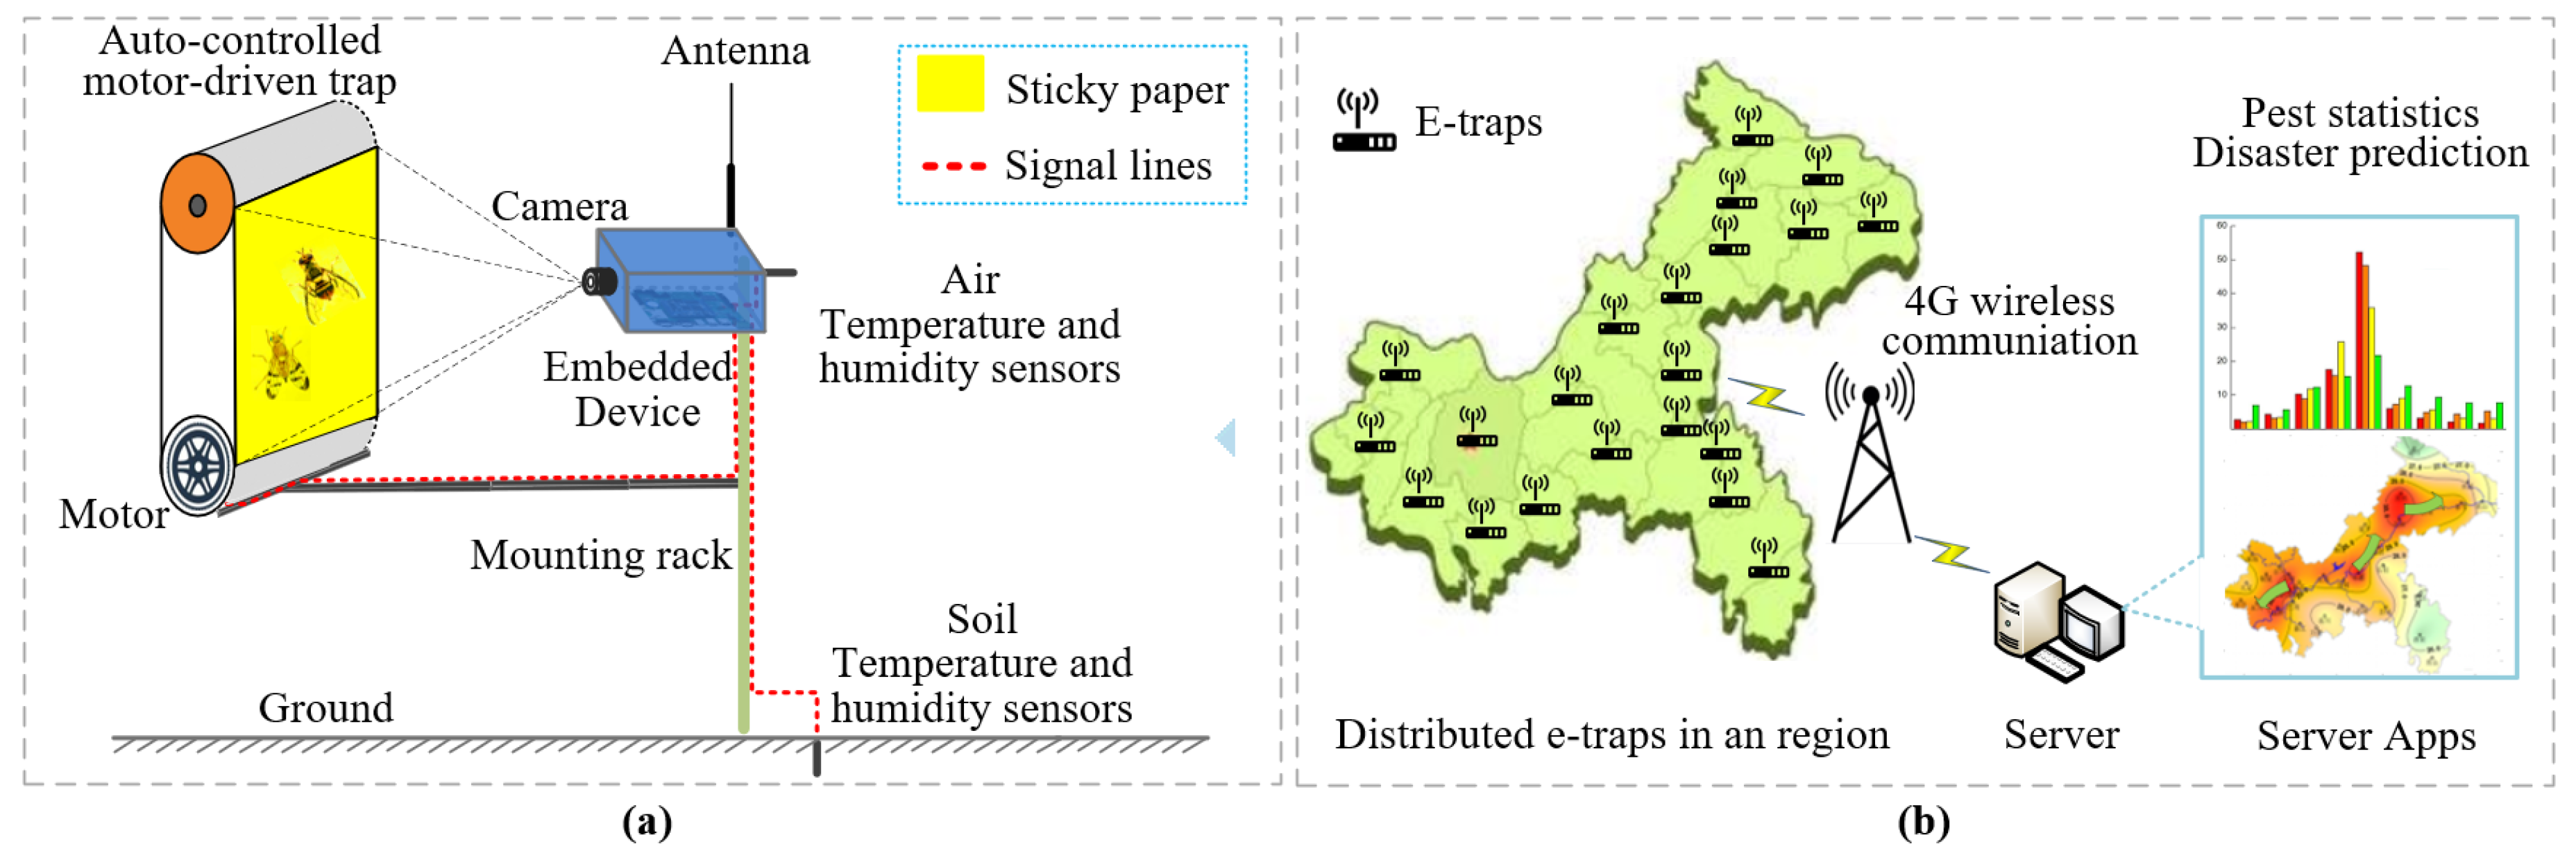
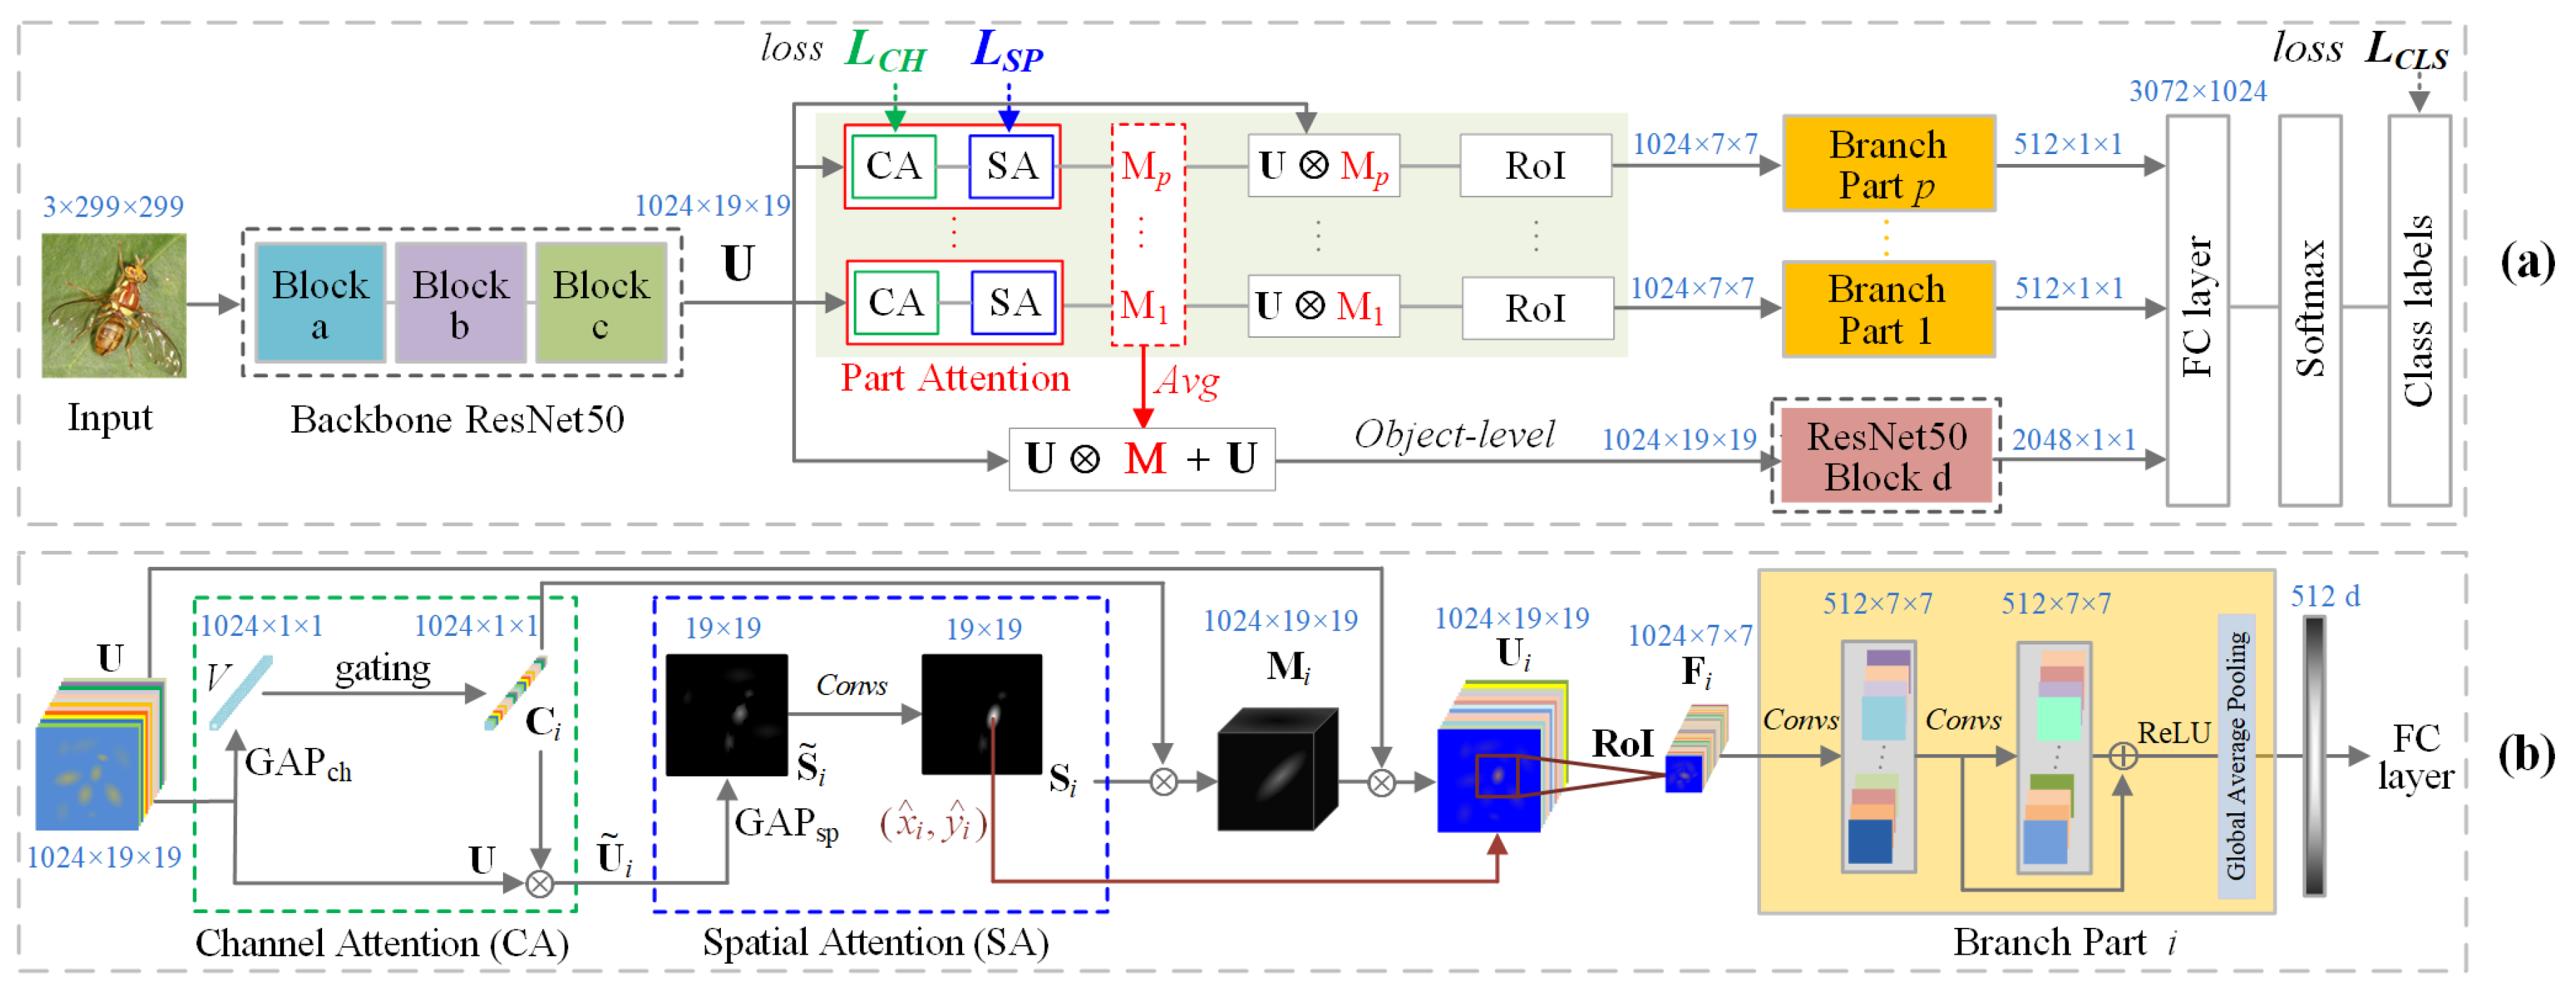
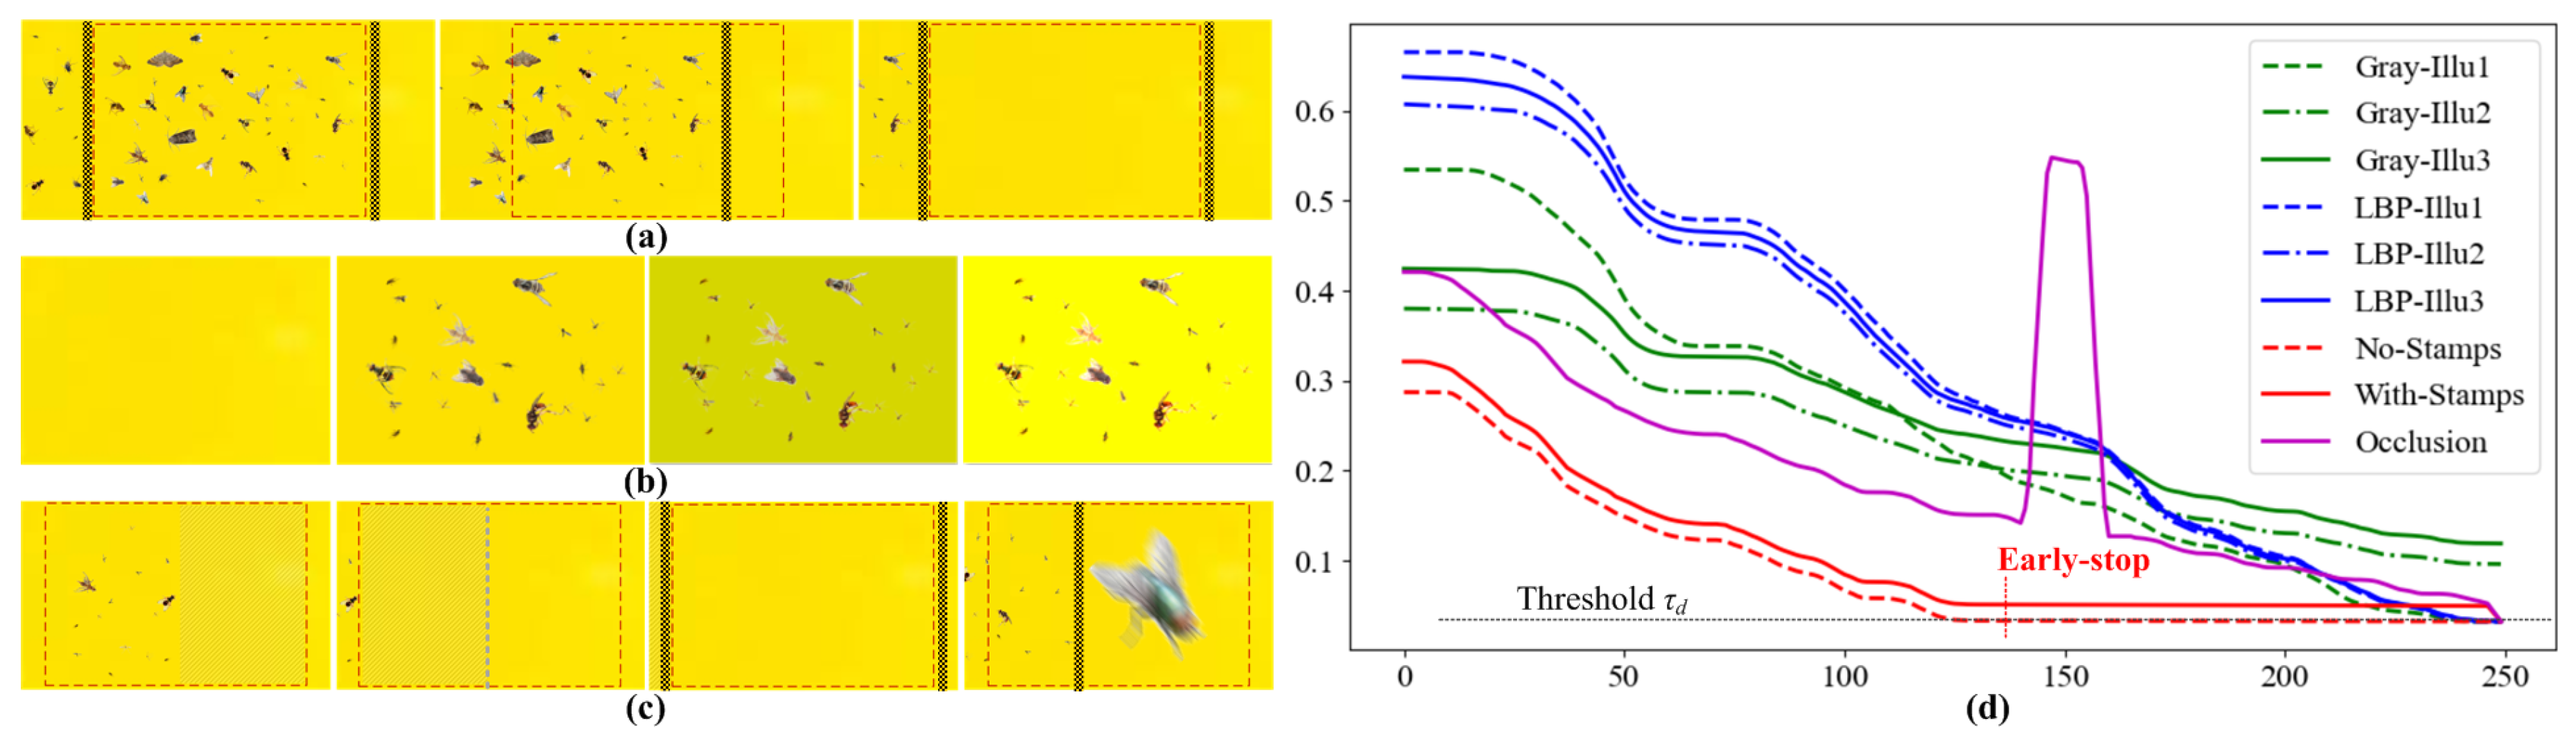
Table 1.
Datasets for classifier training and feature learning. The second column describes the number of samples (t) and the number of species (s). The species in , , and are not overlapped.
Table 1.
Datasets for classifier training and feature learning. The second column describes the number of samples (t) and the number of species (s). The species in , , and are not overlapped.
| Dataset | Amount | Characteristics and Purposes |
|---|---|---|
| -Citrus flies | t = 5952, s = 15 | The dataset for validating the identification of citrus fly pests.
It contains the three species of citrus fly pests and the other 12 species of insects possibly captured by the yellow paper (See Appendix A.1). |
| -Fruit flies | t = , s = 25 | Flies similar to the citrus flies, namely with the similar
parts of wings, thoraxes and abdomens. They are additionally used to help to learn the attention module and improve the discrimination of part features. |
| -Wingedinsects | t = , s = 60 | Winged insects (Diptera and Hymenoptera) with
the similar ideotype and rich textures. They are collected to learn the common features of textures, micro-structures, and contours for citrus flies. |
Table 2.
The control accuracies of the motor on the simulated videos in the different settings. Here, the LBP indicates Local Binary Pattern.
Table 2.
The control accuracies of the motor on the simulated videos in the different settings. Here, the LBP indicates Local Binary Pattern.
| Case | Accuracy | Settings |
|---|---|---|
| A | Gray-level features, no blanking stamps; | |
| B | LBP features, no blanking stamps; | |
| C | LBP features, having blanking stamps; |
Table 3.
Statistical analysis of the detection accuracies on the simulated 1200 samplings. For each sampling, multiple newly stuck insects may be captured or nothing may be stuck on the e-trap. Here, the FAR, FRR, and PDR respectively indicate the False Acceptation Rate, False Reject Rate, and Positive Detection Rate.
| Statistical Results | Detailed Descriptions |
|---|---|
| Stuck target insects, whose sizes are similar to citrus fly pests; | |
| Stuck non-target insects that are small or oversize, e.g., the mosquitos and butterflies; | |
| Correctly detected target insects; | |
| False target insects caused by non-target insects; | |
| What ratio of stuck non-target insects are incorrectly accepted as target insects; | |
| What ratio of stuck target insects are incorrectly rejected; | |
| What ratio of stuck target insects are correctly detected; |
Table 4.
Comparison with the related methods on the -Citrus flies. The methods used in No.7–10 indicate our algorithms learning features by the different combinations of three loss functions.
Table 4.
Comparison with the related methods on the -Citrus flies. The methods used in No.7–10 indicate our algorithms learning features by the different combinations of three loss functions.
| No. | Method | Accuracy | Notes |
|---|---|---|---|
| 1 | MobileNet V2 [56] | Initialized by the pre-trained model from Pytorch; | |
| 2 | VGG16 [57] | Similar to No. 1; | |
| 3 | DenseNet121 [58] | Similar to No. 1; | |
| 4 | ResNet50 [48] | Baseline method, it will be used the backbone network as the following methods; | |
| 5 | Bilinear ResNet50 [59] | Backbone-ResNet50, Bilinear network architecture according to [59]; | |
| 6 | CBAM ResNet50 [38] | Backbone-ResNet50, Attention Blocks according to CBAM [38]; | |
| 7 | MAMPNet | Only utilize the classification loss to drive network training for feature learning; | |
| 8 | MAMPNet | Compared with No.7, the loss on attention matrices is combined with in feature learning; | |
| 9 | MAMPNet | Compared with No.7, the loss of across-category part constraints is combined with ; | |
| 10 | MAMPNet | All loss functions together. |
Table 5.
Statistical analysis of the recognition accuracies for three species of target citrus fly pests on the synthesized yellow paper images and source (non-synthesized) images.
Table 5.
Statistical analysis of the recognition accuracies for three species of target citrus fly pests on the synthesized yellow paper images and source (non-synthesized) images.
| Category | Synthesized Images | Source Images | All Images |
|---|---|---|---|
| B. minax | |||
| B. dorsalis | |||
| B. scutellata | |||
| Average |
Publisher’s Note: MDPI stays neutral with regard to jurisdictional claims in published maps and institutional affiliations. |
© 2021 by the authors. Licensee MDPI, Basel, Switzerland. This article is an open access article distributed under the terms and conditions of the Creative Commons Attribution (CC BY) license (https://creativecommons.org/licenses/by/4.0/).
Share and Cite
MDPI and ACS Style
Huang, R.; Yao, T.; Zhan, C.; Zhang, G.; Zheng, Y. A Motor-Driven and Computer Vision-Based Intelligent E-Trap for Monitoring Citrus Flies. Agriculture 2021, 11, 460. https://0-doi-org.brum.beds.ac.uk/10.3390/agriculture11050460
AMA Style
Huang R, Yao T, Zhan C, Zhang G, Zheng Y. A Motor-Driven and Computer Vision-Based Intelligent E-Trap for Monitoring Citrus Flies. Agriculture. 2021; 11(5):460. https://0-doi-org.brum.beds.ac.uk/10.3390/agriculture11050460
Chicago/Turabian StyleHuang, Renjie, Tingshan Yao, Cheng Zhan, Geng Zhang, and Yongqiang Zheng. 2021. "A Motor-Driven and Computer Vision-Based Intelligent E-Trap for Monitoring Citrus Flies" Agriculture 11, no. 5: 460. https://0-doi-org.brum.beds.ac.uk/10.3390/agriculture11050460
Note that from the first issue of 2016, this journal uses article numbers instead of page numbers. See further details here.