Article

Automated Chicken Counting in Surveillance Camera Environments Based on the Point Supervision Algorithm: LC-DenseFCN

1
College of Information Engineering, Sichuan Agricultural University, Ya’an 625000, China
2
Sichuan Key Laboratory of Agricultural Information Engineering, Ya’an 625000, China
*
Author to whom correspondence should be addressed.
These authors contributed to the work equally and should be regarded as co-first authors.
Submission received: 12 April 2021 / Revised: 14 May 2021 / Accepted: 20 May 2021 / Published: 26 May 2021
(This article belongs to the Special Issue Digital Innovations in Agriculture)

Abstract

:
The density of a chicken population has a great influence on the health and growth of the chickens. For free-range chicken producers, an appropriate population density can increase their economic benefit and be utilized for estimating the economic value of the flock. However, it is very difficult to calculate the density of chickens quickly and accurately because of the complicated environmental background and the dynamic number of chickens. Therefore, we propose an automated method for quickly and accurately counting the number of chickens on a chicken farm, rather than doing so manually. The contributions of this paper are twofold: (1) we innovatively designed a full convolutional network—DenseFCN—and counted the chickens in an image using the method of point supervision, which achieved an accuracy of 93.84% and 9.27 frames per second (FPS); (2) the point supervision method was used to detect the density of chickens. Compared with the current mainstream object detection method, the higher effectiveness of this method was proven. From the performance evaluation of the algorithm, the proposed method is practical for measuring the density statistics of chickens in a farm environment and provides a new feasible tool for the density estimation of farm poultry breeding.

Graphical Abstract

1. Introduction

Refined agriculture is a significant trend of agricultural development for the future, among which agricultural informatization is a development direction vigorously advocated for at present [1]. Realizing the informatization of the agricultural industry is helpful to promote the intellectualization of agricultural management, increase the output of agricultural products, and obtain greater economic benefits [2,3].
The aquaculture industry also has great prospects in the trend of agricultural informatization. As with other production technologies in the agricultural field, the main goal of intelligent farming is to increase productivity and take operational measures related to the environment to reduce costs [4,5,6,7]. In intelligent aquaculture, some of the main parameters concerned include temperature, humidity, light intensity, and population density. Welfare considerations affect the sale of poultry products, and breeding density is seen as a priority for animal welfare [8]. For broiler breeding, compared with cage rearing, group rearing is more reliable [9]. An appropriate breeding density will improve the growth performance of chickens as well as their immunity and carcass yield [10,11,12]. However, there are few studies on the rapid monitoring of chicken population density. Most methods of monitoring chicken populations involve studying the morphology of the chickens and observing their physiological behaviors. For example, Yao Y. et al. [13] designed a classifier to determine the sex of chickens. A. Aydin [14] used 3D vision cameras to observe chickens’ walking posture to assess whether they had lameness or other behavioral problems. Tu X. et al. [9] developed a real-time automatic feed weight monitoring system which could automatically detect the intake and weight of individual turkeys. Chakchai so-in et al. [15] used traditional image processing methods and four algorithms, such as K-means, to classify images of chickens taken by cameras arranged in a chicken farm; the accuracy of the logic filter algorithm was the highest, achieving an accuracy of 80%. Similarly to Chakchai so-in, we also monitored the density of chickens and counted them from images taken with a camera in a chicken farm. The difference is that we chose to use a deep learning method to process the images. In free-range chicken farms, the traditional method of counting chickens is often manual, which has the following challenges:
  • The motility of the flock makes it difficult to perform a complete count of the flock;
  • The process is time consuming.
Deep learning has been widely used in different environments of many fields and has proven to be a very efficient method. Of course, it is also widely used in various agriculture-related fields [16], such as animal density detection and animal counting. Beibei Xu et al. [17] used drones to collect images of cattle raised on a large scale and used the method of instance segmentation to detect and count the photos of these cattle, with the highest accuracy of 94%. Hung Nguyen et al. [18] used object detection to identify and count wild animals, and they were able to identify the animals with 96% accuracy by setting up a fixed camera position to photograph the path. Mengxiao Tian et al. [19] used the density map method to count pigs in a pigsty and finally achieved a mean absolute error (MAE) of 1.67. According to a recent survey of deep learning in agriculture [20], deep learning has a wide application value in poultry breeding. This article focuses on the detection and counting of free-range chickens on a poultry farm to achieve rapid management of the poultry farm.
In this study, we used a deep learning method to automate the counting of free-range chickens on a poultry farm. The chicken farm was indoors and covered by greenhouses; therefore, we used surveillance cameras to collect data from the chicken farm. Due to the high density of the chicken population, there was a high degree of overlap between the individual chickens, and the overlapping chicken population made it difficult to distinguish the individuals. Therefore, the object detection and density map methods were not suitable for this task; as such, we chose to use the method of point supervision for processing. We innovatively combined the segmentation loss function designed by Issam H. Laradji et al. [21] and DenseNet [22] to create a new semantic segmentation model, LC-DenseFCN, to meet the actual requirements.

2. Related Work

2.1. DenseNet

Since ResNet [23] was put forward, a variety of ResNet networks have emerged in an endless stream, and each has its own characteristics; the network performance has also been improved to some extent. With its excellent performance, the Dense Convolutional Network (DenseNet) won the best paper of IEEE Conference on Computer Vision and Pattern Recognition (CVPR) 2017. The DenseNet (Dense Convolutional Network) proposed in the paper is mainly a comparison with ResNet and Inception Network, which has some reference in thought but is a new structure. The network structure is not complicated, but it is effective and comprehensively outperforms ResNet in the CIFAR index. It can be said that DenseNet has absorbed the best part of ResNet and has had more innovative work conducted on it, further improving the network performance.

2.2. FCN

The fully convolutional network (FCN) [24] is the pioneering work that applied the convolutional neural network (CNN) structure to the field of image semantic segmentation and achieved outstanding results; accordingly, it was awarded the Best Paper Honorable Mention of CVPR in 2015. CNNs have been driving progress in the field of image recognition in recent years. Whether it is whole-picture classification or object detection, key point detection has been greatly developed with the help of CNNs. However, image semantic segmentation is different from the above task, which is a space-intensive prediction task. In other words, it needs to predict the categories of all pixels in an image. FCN trains an end-to-end, point-to-point network for semantic segmentation and represents the state of the art. This is the first time that an end-to-end FCN has been trained for pixel-level prediction.

2.3. Localization-Based Counting Algorithm

Issam H. Laradji et al. proposed a positioning counting method based on point supervision, i.e., an object counting model in which the dataset labels are all point labels of unit pixels [21]. In this model, a compound loss function (LC-Loss) is designed for monitoring counting. The structure of the model itself can use most of the semantic segmentation models of FCN, so there is only a need to modify the function to achieve a good counting effect. This model is suitable for object counting tasks in the order of 10 or 100, and the annotation of datasets is relatively simple. Its backbone network structure is not complicated and has great value in migration applications. In the localization-based counting algorithm model, the backbone networks used are LC-FCN [21] and LC-ResFCN [21]. The reasons for choosing to use both networks are as follows: (1) FCN is relatively simple and has a fast segmentation result in semantic segmentation; (2) based on FCN, combined with ResNET-50 network, the accuracy can be relatively improved, and due to the unique residual structure of ResNet, the computing speed will not be greatly affected.

2.4. Object Detection Algorithms for Contrast Experiment

In recent years, great progress has been made in object detection algorithms, and current object detection algorithms are mainly divided into two categories. The first are two-stage algorithms, such as R-CNN [25], Fast R-CNN [26], Faster R-CNN [27], and Mask R-CNN [28], which rely on a CNN to generate a region proposal network first, and then classify and regress on the region proposal network. The other are one-stage algorithms, which can directly predict the bounding box and class probability from the input image by using only a convolutional neural network structure. The three algorithms used in this paper are Mask R-CNN, YOLOv3 [29], and EfficientDet [30].
The early YOLOv1 [31] has several shortcomings: (1) the input size is fixed, and the output layer is a fully connected layer; (2) it is not suitable for detecting small objects—although each grid can predict many bounding boxes, only the bounding box with the highest IoU (intersection over union) is selected as the object detection output. To address these problems, YOLOv2 [32] was proposed. In YOLOv2, by using a convolution layer, the output layer replaces the fully connected layer of YOLOv1. YOLOv2 cancels all dropout and uses batch normalization in the convolution layer. Compared with the previous YOLOv1 and YOLOv2, YOLOv3 shows great improvements. The backbone network of YOLOv3 is Darknet53, and its most important feature is the use of the residual network structure. Furthermore, the DarknetConv2D structure is used in the convolution part. As a result, YOLOv3 largely improves the detection accuracy while maintaining a high detection speed. Based on the excellent performance of Yolov3, Yao Y. et al. [13] used the YOLOv3 algorithm to detect the images of chickens, to achieve the purpose of counting chickens and segmenting single chickens.
Mask R-CNN is a compact, versatile object detection framework. It can not only detect the objects in an image, but also give a high-quality detection result for each object. Beibei Xu et al. [17] used Mask R-CNN to detect and count cattle, and achieved good results in the field of animal detection and counting. Mask R-CNN extends the Faster R-CNN by parallel adding a new branch to the bounding box recognition branch for predicting the object mask. Mask R-CNN (an extension of Faster R-CNN) which also allows for instance segmentation (associating specific image pixels to the detected object) is selected for further study. Instance segmentation allows not only the detection of each animal, but also the delineation of its boundaries within the image, thereby allowing further potential applications for livestock welfare monitoring. The benefits provided by instance segmentation allow for diverse future applications including estimations of animal pose and direction of travel. In this work, however, we constrain interest to the object detector capabilities of Mask R-CNN.
The EfficientDet algorithm was proposed by the Google brain team. By means of improving the multiple dimensioned feature fusion structure of FPN and borrowing ideas from the EfficientNet [33] model scaling method for reference, its contribution mainly includes two points: (1) EfficientDet proposed the BiFPN network, which allows simple and fast multi-scale feature fusion; (2) a compound scaling method was proposed, which can uniformly scale the resolution, depth, and width of all the backbone, characteristic and predictive networks. Based on these improvements, EfficientDet can provide high-accuracy and rapid testing with fewer parameters.

3. Materials and Methods

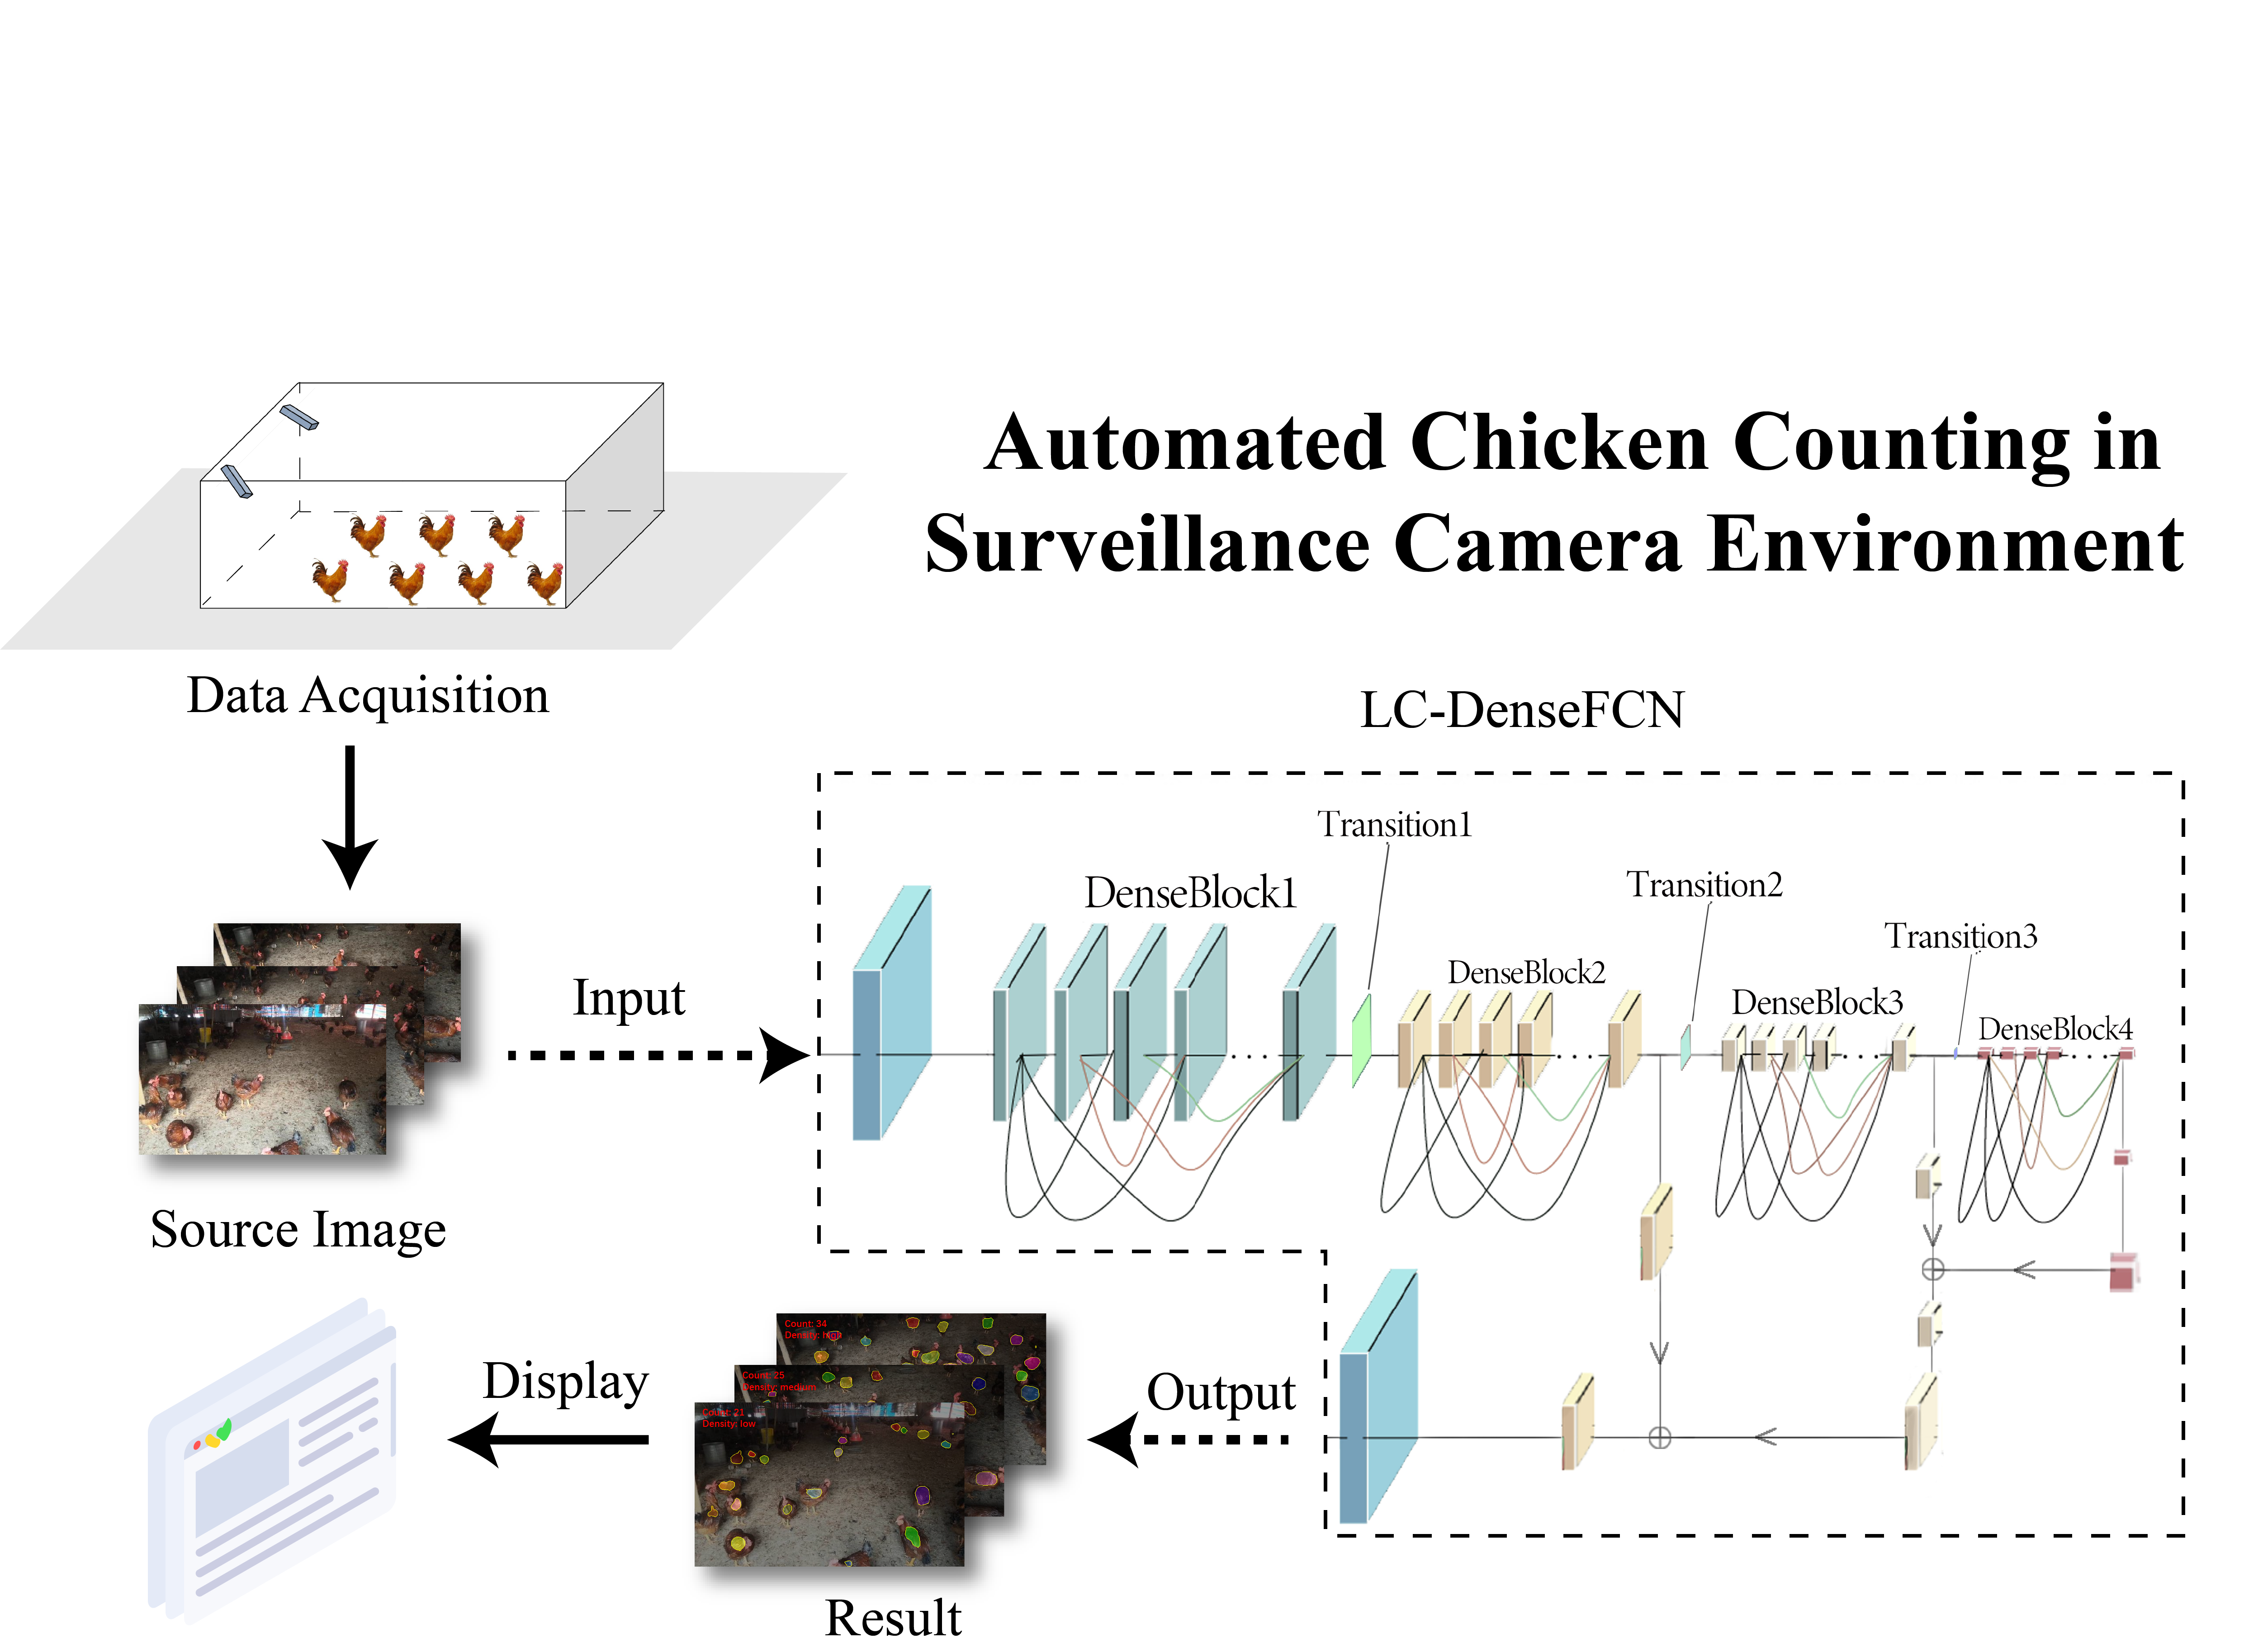
3.1. Overview of Our Framework

This section describes the pipeline which is proposed for processing RGB images that are captured by camaras to detect and count chickens using a deep learning algorithm. The structure of chicken detection and counting in camera images is illustrated in Figure 1. The RGB images acquired by the camera are used to extract features from the full image using DenseNet (our DenseFCN network is a fully convolutional network; therefore, we removed the full connection layer for processing pixel-level predictions). Then, a deconvolution operation is carried out to up-sample the feature map of the last convolutional layer and restore it to the same size as the input image; in this way, a prediction can be generated for each pixel while retaining the spatial information in the original input image. Finally, the feature map of the up-sampled is classified, pixel by pixel. The ground truth was annotated manually for every chicken in the training sets (we used LC-Loss as the loss function for the network; therefore, we only needed to mark one pixel of the chicken); then, network training was performed after labeling for parameter optimization, followed by chicken detection and counting in testing sets.

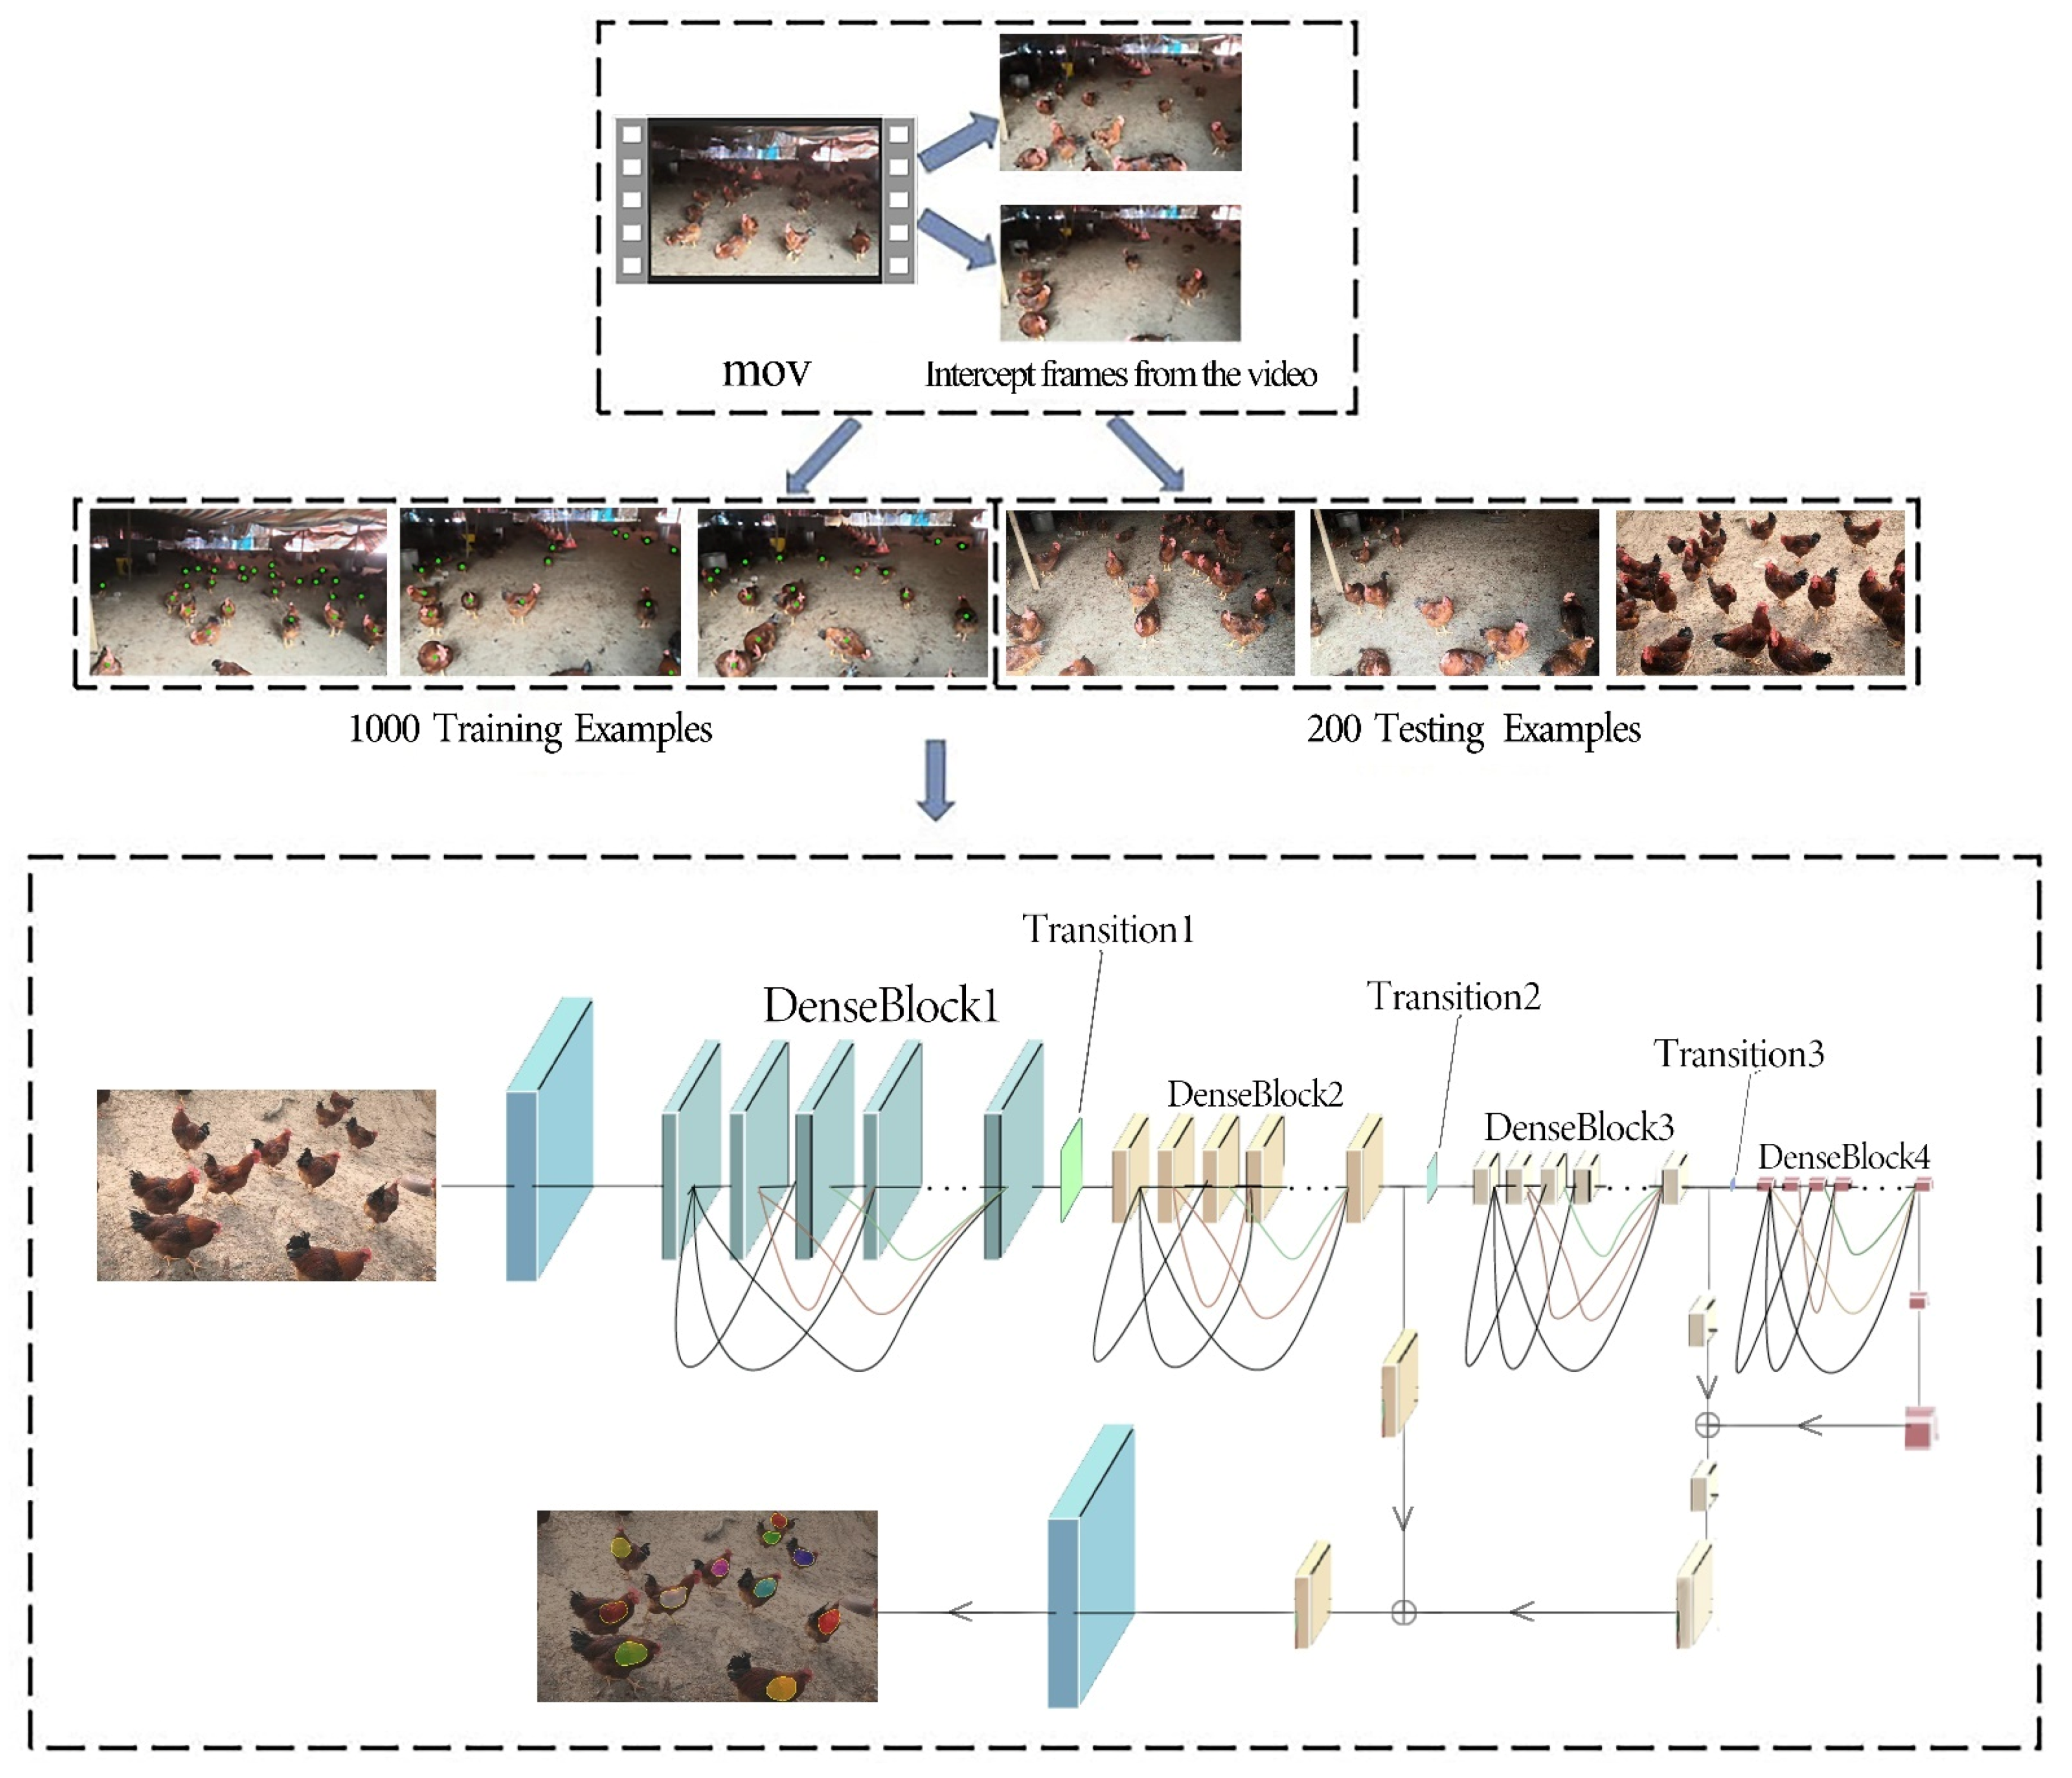
3.2. Dataset Preparation and Pre-Processing

The provision of sufficient and diverse chicken population datasets was a pre-requisite for this work. As the research area is at an advanced level in the industry, there was a lack of appropriate publicly available datasets; therefore, we completed the whole process of data collection by ourselves. The images used in this research were taken at Sichuan Meishan City Song’s chicken farm. Part of the chicken farm is indoors and covered by greenhouses; therefore, we used surveillance cameras to collect data on the environment of the free-range chicken farm. We installed multiple Hikvision DS-IPC-B12-I cameras in the chicken farm and filmed it from different locations. The shooting angle was mainly from top to bottom, and the collection time was in March 2020. The collected videos were pre-processed, the monitoring videos were framed, the invalid fragments were deleted, and the key frames were then extracted. Some images that were not easy to identify in morphology, did not have obvious features, or were too blurred were abandoned, and most of the images obtained were clear. However, due to the movement characteristics of chickens, a small number of images were relatively fuzzy. In order to improve the robustness of the model, we added some relatively fuzzy images into the dataset. In addition, the dataset also contained some daily behaviors of chickens, such as eating, drinking, and jumping, which improved the richness and diversity of the dataset. We finally selected 1200 valid images of chickens with a resolution of 1080P as the dataset, including images of chickens with different densities. The detection dataset was divided in a ratio of 5:1 to build the training set and the test set. For data annotation, we used the deep learning annotation tool LabelMe to manually label the images and marked the position of a single chicken in the image with RGB (255.0.0) pixels.
The environment in which chickens are raised is complex and sometimes affected by inclement weather, such as low temperatures and heavy rain. In the process of digital image acquisition, coding, transmission, and processing, noise always exists [34]. Due to the advanced equipment we used, and the good weather conditions during the data collection stage, there was less noise in the collected dataset. In an actual scene, the equipment is often affected by aging circuits and the environment, and the noise level is very high. In order to improve the robustness of the model, we randomly selected 200 images from the dataset and added salt and pepper noise to simulate a more realistic shooting environment. Noise brings a lot of difficulties to image processing, which has a direct impact on image segmentation, feature extraction and image recognition. Therefore, it was necessary to filter the collected images. Median filtering is based on the theory of order statistics of a nonlinear signal processing technology and can effectively restrain noise. Its basic principle is to replace the value of a point in a digital image or sequence with the median value of each point in a neighborhood of the point, so that it becomes the true value close to the surrounding pixel value, to eliminate the isolated noise points, which is particularly useful for speckle noise and salt and pepper noise, because it does not depend on the surroundings of those values with a typical value difference that is very large. Figure 2 shows some of the filtered images with salt and pepper noise.

3.3. The Detection and Counting Algorithm

LC-DenseFCN is an extension of LC-FCN, which takes DenseNet as the backbone network, removes the full connection layer, and fuses and deconvolves the feature map with rich semantic information, eventually forming a fully convolutional network that can perform pixel-level prediction. Like FCN, LC-DenseFCN is divided into two stages: (1) the convolution process of feature extraction from the image; and (2) the deconvolution process of fusion and deconvolution of the extracted feature maps of different layers.

3.3.1. Convolution

The process of feature extraction mainly consists of four DenseBlocks and three Transition layers. The DenseBlock is composed of several composite functions, including batch normalization, ReLU activation function, and a convolutional layer. DenseNet is a convolutional neural network with tight connections. Any two layers in this neural network are directly connected, i.e., the input of each layer in the network is the union of the output of all previous layers, and the features learned by this layer will be directly transmitted to all subsequent layers as inputs. This tight connection only exists in the same DenseBlock, but there is no such tight connection in different DenseBlocks. This structure can reduce the network parameters, reduce gradient disappearance, and improve feature utilization.

3.3.2. Deconvolution

In general CNN structures, a pooling layer is used to reduce the size of the output image. The input image of VGG16 [35] was shrunk 32 times after pooling five times; in ResNet, some convolutional layers are also involved in the process of reducing the image size. What we needed to obtain was a segmented image with the same size as the original image; therefore, we needed to deconvolve the last layer. In the process of DenseNet’s feature extraction of the image, the size of the feature image is gradually reduced. Firstly, we deconvolved the feature graph of DenseBlock4 to make its size the same as that of the feature graph of DenseBlock3 and fused them. Then, deconvolution was performed on the feature map obtained after fusion to make its size the same as that of DenseBlock2, and we then fused it with the feature map of DenseBlock2. Finally, deconvolution with a stride of 8 was performed on the fused feature image to obtain the detection results.

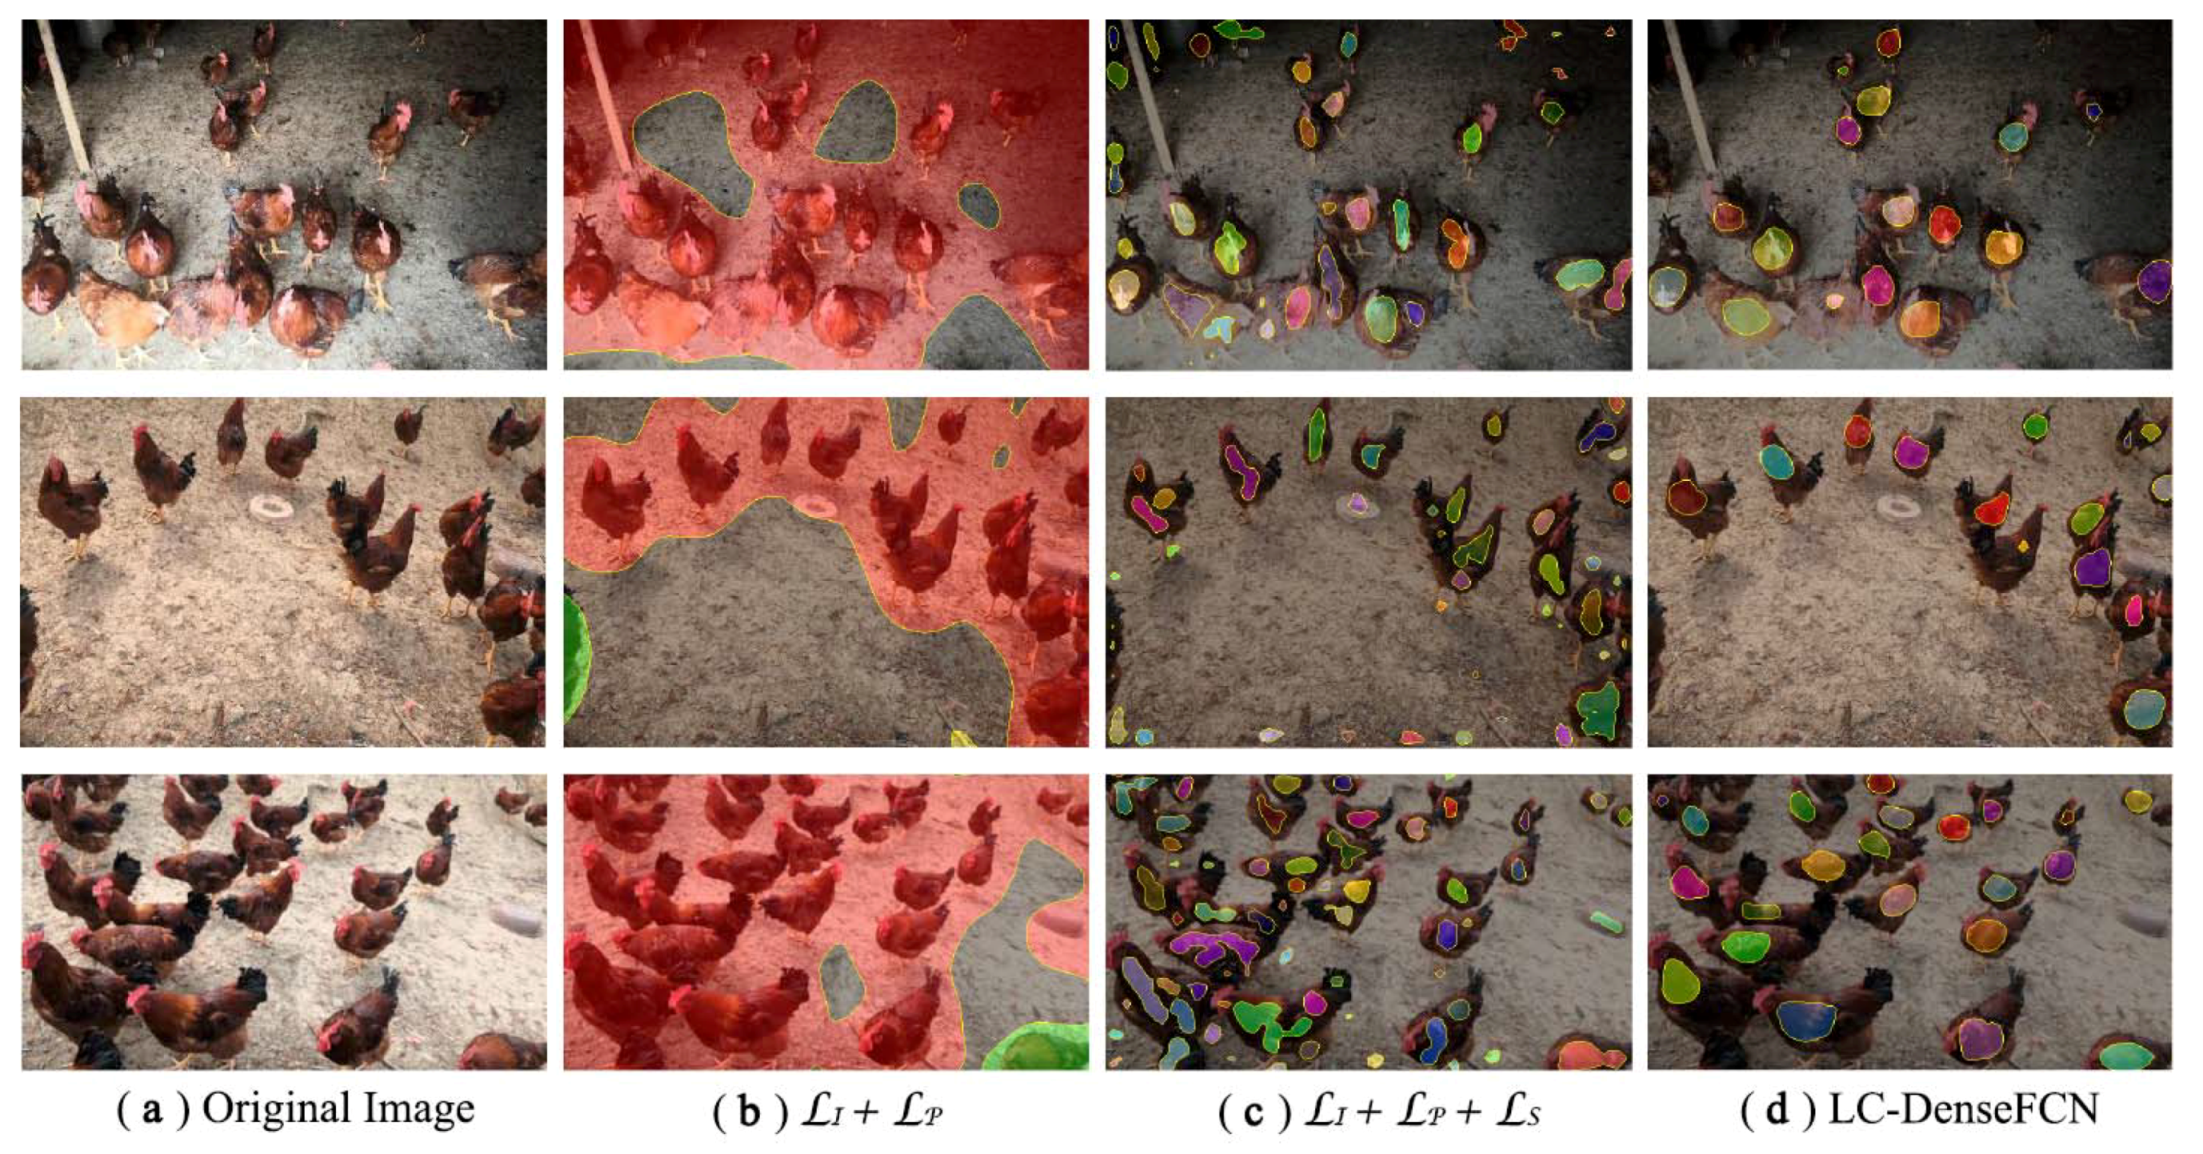
3.3.3. Loss Function

LC-Loss enables the model to produce an area block where each object is and finally counts the number of areas; the required monitoring signal is a position point for each object, not a bounding box. The loss function is called location-based counting loss, and it has four items. The first two require the model to give the semantic label of each pixel of the graph, while the last two require the model to learn to separate the areas with multiple objects and remove the areas without objects.
( S , T ) = I ( S , T ) + P ( S , T ) + S ( S , T ) + F ( S , T )
Here, S is the figure given by the ground truth (GT), and T is the output of the network. On each pixel is a softmax vector, which represents the probability that this pixel belongs to each kind of object. Finally, Argmax is taken on each output pixel to divide the region.
Image-level loss: C e is given by the GT of this figure and the set of object classes that exist in the figure; C ¬ e represents the set of object classes that do not exist. S t c c is the maximum probability of category c of S per pixel. That is, the model is encouraged to predict c if there is class c in the GT and is penalized to predict c if there is.
I ( S , T ) = 1 | C e | c C e l o g ( S t c c ) 1 | C ¬ e | c C ¬ e l o g ( 1 S t c c )
Point-level loss: This loss is normal softmax cross-entropy loss; thus, the background category needs to be ignored, and this item will only be calculated for the marked position points.
P ( S , T ) = i I s l o g ( S i T i )
Split-level loss: The loss contains two implementation methods—the line split method and the watershed split method.
1.
Line split method.
z ( E ) = 1 | E | i E S i 0
Each blob in the blob set B is formed by a series of point sets around the central coordinate p of the blob. For any point in the point set BP, it will form a pairing with its surrounding points ( P i , P j ). Additionally, a line can then be used to separate P i and P j . The position where the lines separate will be the background with the highest probability of learning. This separates one blob from the surrounding blobs.
2.
Watershed split method.
S ( S , T ) = i T b α i l o g ( S i 0 )
Here, S i 0 represents the probability that pixel I belongs to background 0, and ai represents the number of pixels in each blob that belong to that blob. This loss lets the model learn so that there is a clear dividing line between the two adjacent blobs.
False positive loss: F discourages the model from predicting a blob with no point annotations in order to reduce the number of false positive predictions (FP). The loss function is defined as follows:
F ( S , T ) = i B f p l o g ( S i 0 ) B f p
where B f p represents the pixels that predict which category the blob belongs to, excluding the background category, which is a circle of pixels around a point; and S i 0 represents the probability that the category i belongs to the background category. The probability of category i belonging to the background category in the whole process optimization is 1, to achieve the purpose of removing false positive predictions, where the loss is optimized only when there is an false positive prediction; otherwise, the loss is not optimized.

3.4. Experimental Environment and Evaluation Protocol

The operating system of the experiment was Ubuntu 16.04, the deep learning framework used in all experiment was Pytorch 0.4, and all experimental results were obtained on an NVIDIA Geforce RTX 2080 super GPU (Santa Clara, CA, USA), with a video memory of 8 GB.
In this paper, there are some differences between the evaluation criteria of point supervision algorithms and object detection algorithms. Mean Absolute Error (MAE), Mean Square Error (MSE), Root-Mean-Square Error (RMSE), Mean Relative Error (MRE), and accuracy are used as the evaluation metrics of the point supervision algorithms, including LC-FCN, LC-ResFCN and LC-DenseFCN. MAE is the most commonly used index to measure accuracy. It is the average error in a more general form and also an important ruler for evaluating models in machine learning. MSE is the most commonly used error in regression loss function. It is the mean of the sum of squares of the difference between the predicted value, f ( x ) , and the target value, y. RMSE reflects the square root of the mean of the square variance between the predicted value and the actual observed value. MRE is generally used to analyze the accuracy of results. Accuracy represents the ratio of correctly predicted samples to the total number of predicted samples; the definition formula is as follows:
Accuracy = T P + T N T P + T N + F P + F N
where TP, FP, TN and FN represent true positive, false positive, true negative and false negative, respectively.
Moreover, the precision, recall and average precision (AP) and frames per second (FPS) are utilized as the evaluation metrics of point supervision algorithms and object detection algorithms, including LC-DenseFCN, YOLOv3, Mask R-CNN and EfficientDet. The precision reflects the proportion of true predicted positive in all the predicted positive, but the recall reflects the proportion of true predicted positive in all of the positives. For the precision–recall curve [36], the larger the area enclosed by the curve, the better the performance. Another important performance index is speed; only fast speed can realize real-time detection, which was extremely important for our application scenario. A common measure of speed is FPS, i.e., the number of images that can be processed per second.

4. Results

This section presents the performance evaluation of the proposed method to detect and count chickens in different experimental settings. First, we conducted a performance comparison of the segmentation model under different backbones; then, we conducted a loss function analysis; and finally, we performed a comparison with the state-of-the-art object detection algorithms.

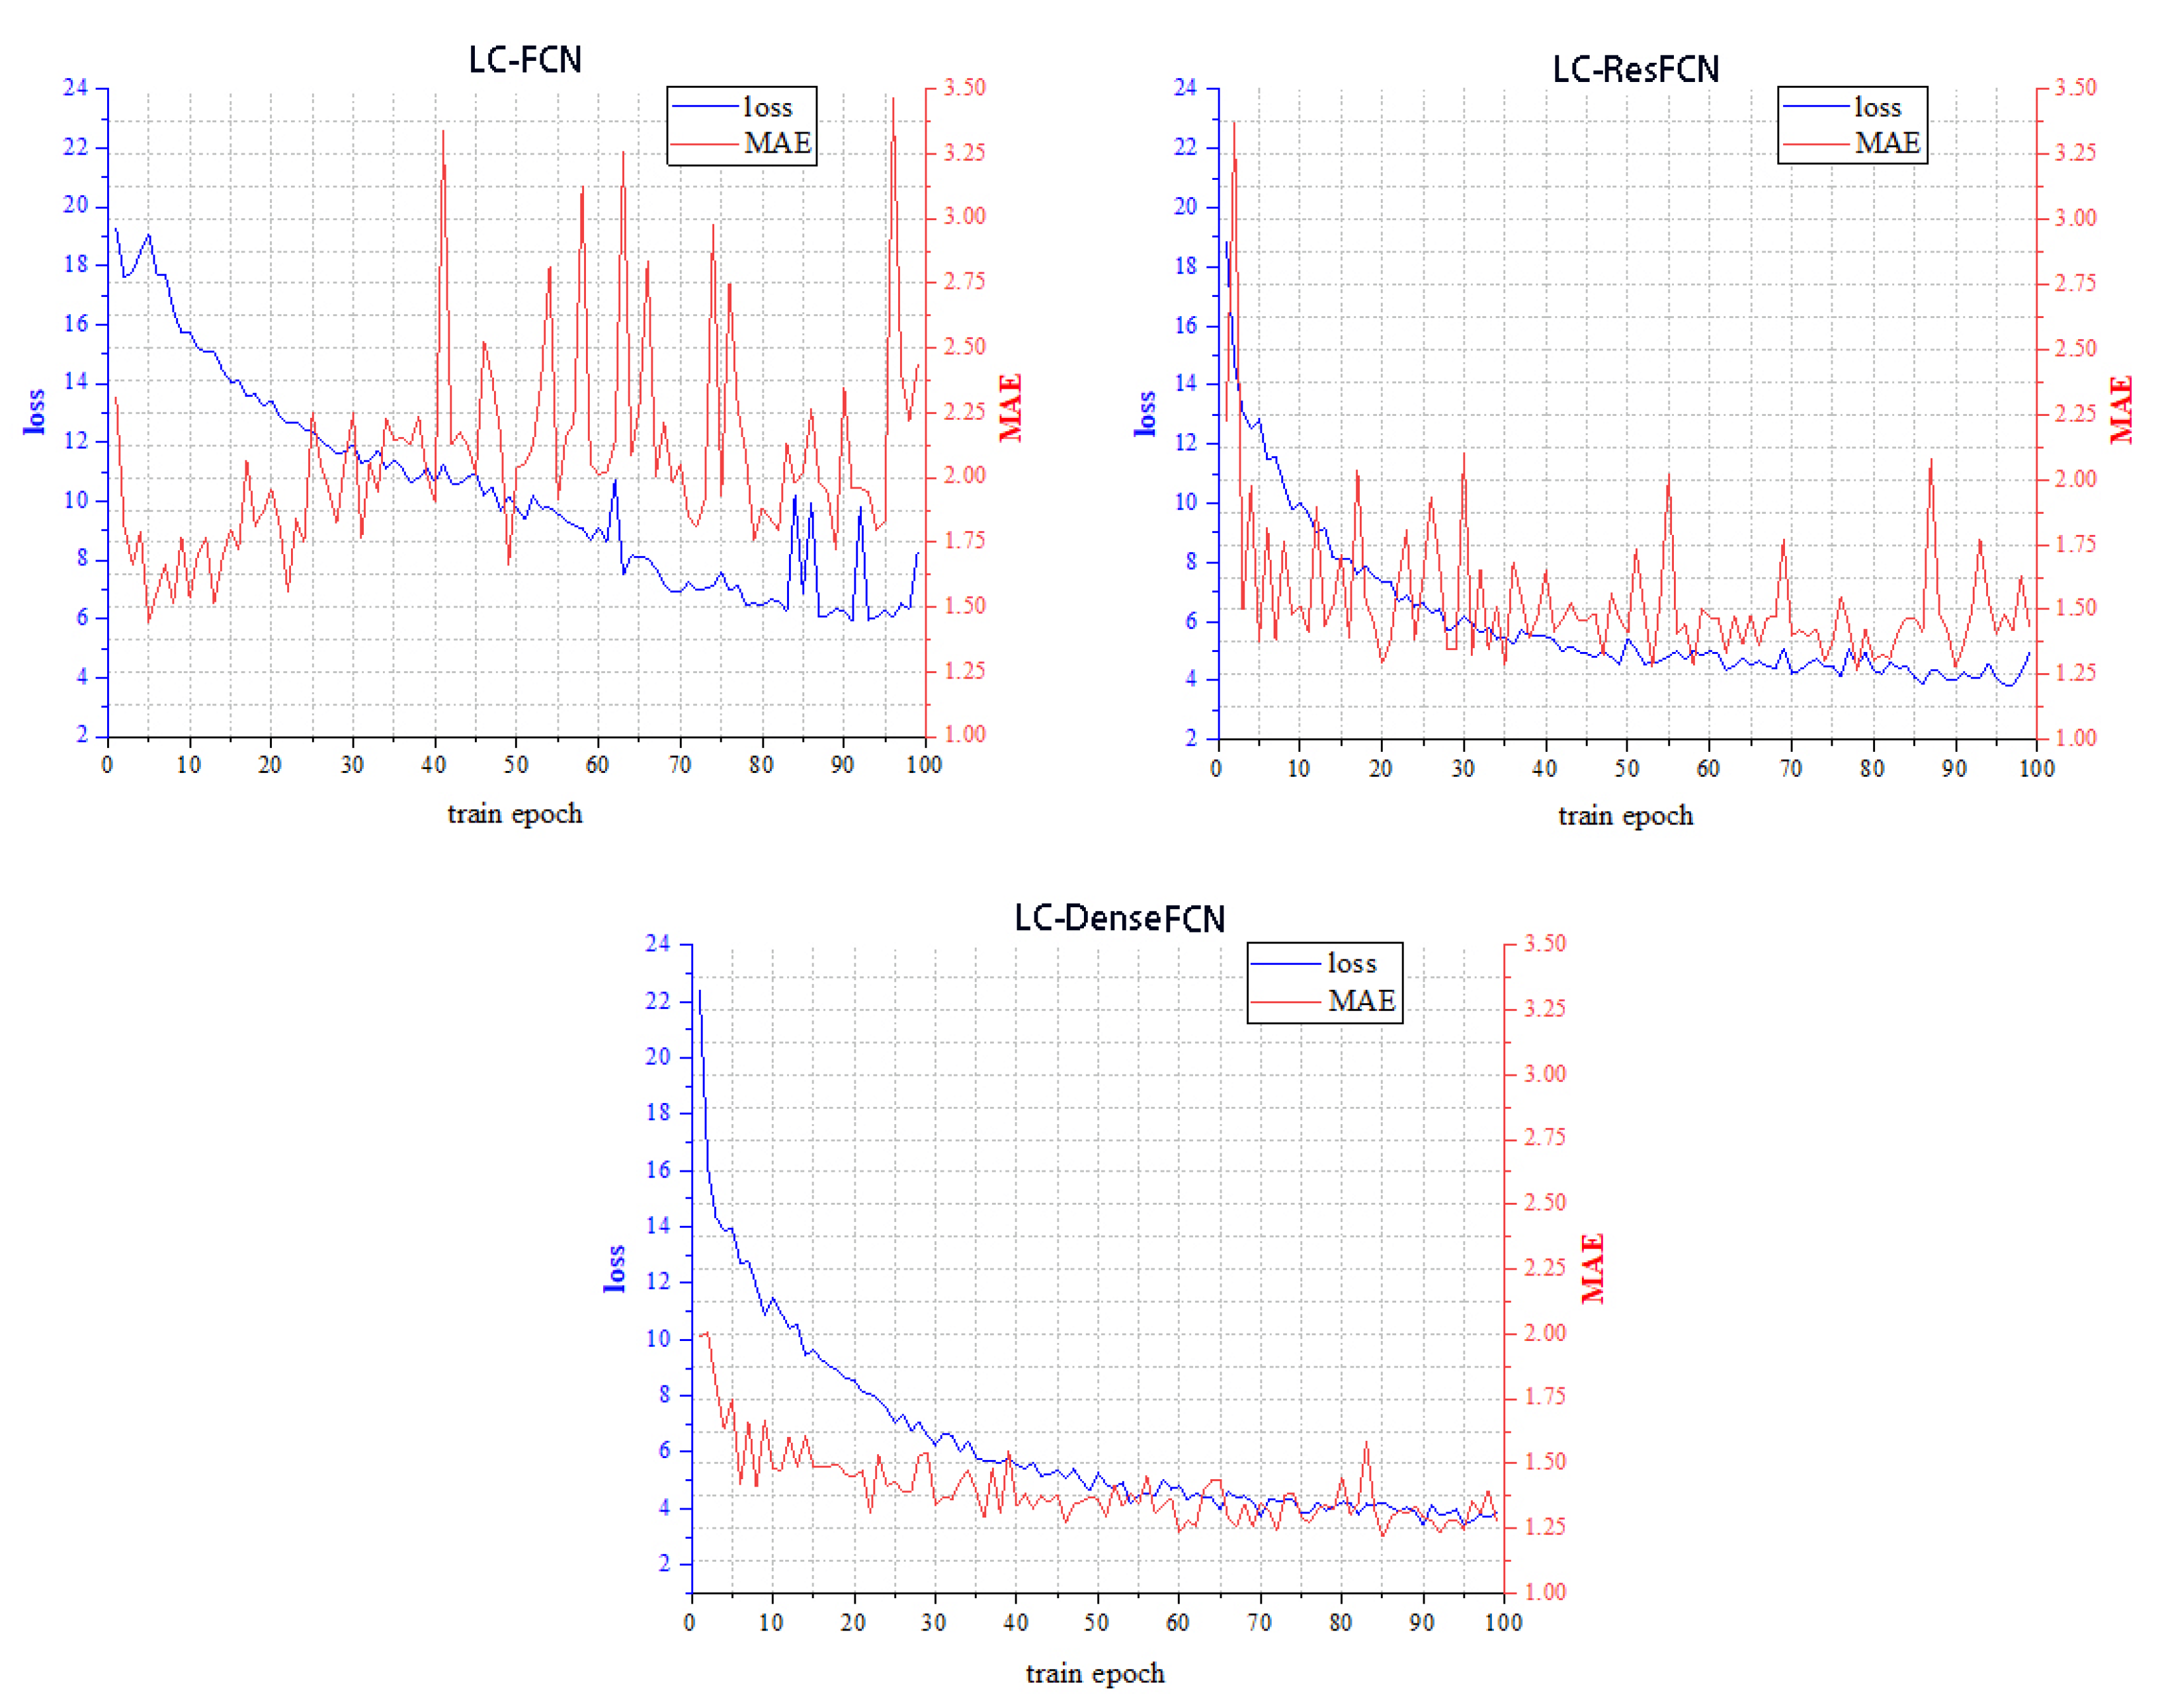
4.1. Performance Comparison of Segmentation Model under Different Backbones

We compared the proposed LC-DenseFCN model with two typical existing methods: LC-FCN and LC-ResFCN. We evaluated the two competing methods on the same test images collected from the chicken farm; the training process of these competing methods is shown in Figure 3. The following can be noted: (1) the loss of LC-FCN converged slowly and fluctuated greatly, while Mean Absolute Error (MAE) jittered greatly and even showed an upward trend with the increase in epoch; (2) the loss of LC-ResFCN converged faster, but the MAE was not stable enough and the jitter was obvious; (3) the MAE of the early training process oscillated, but the late convergence effect was better. The convergence speed of loss was a little slower than that of LC-ResFCN in the early stage, but the overall convergence was more stable without large fluctuations. After analysis, the deep network framework was not suitable for such a small dataset. LC-DenseFCN uses DenseNet as the backbone network, and its smaller number of parameters makes the network easier to train; therefore, LC-DenseFCN had better convergence. Moreover, we have summarized the performances in terms of error and accuracy in Table 1. As can be seen from the table, LC-DenseFCN, in this paper, achieved the best accuracy of 93.84%, and all errors were the lowest in test datasets. It is obvious that the dense connection structure and feature reuse method of DenseNet achieved better results than the other two methods in our experiment.

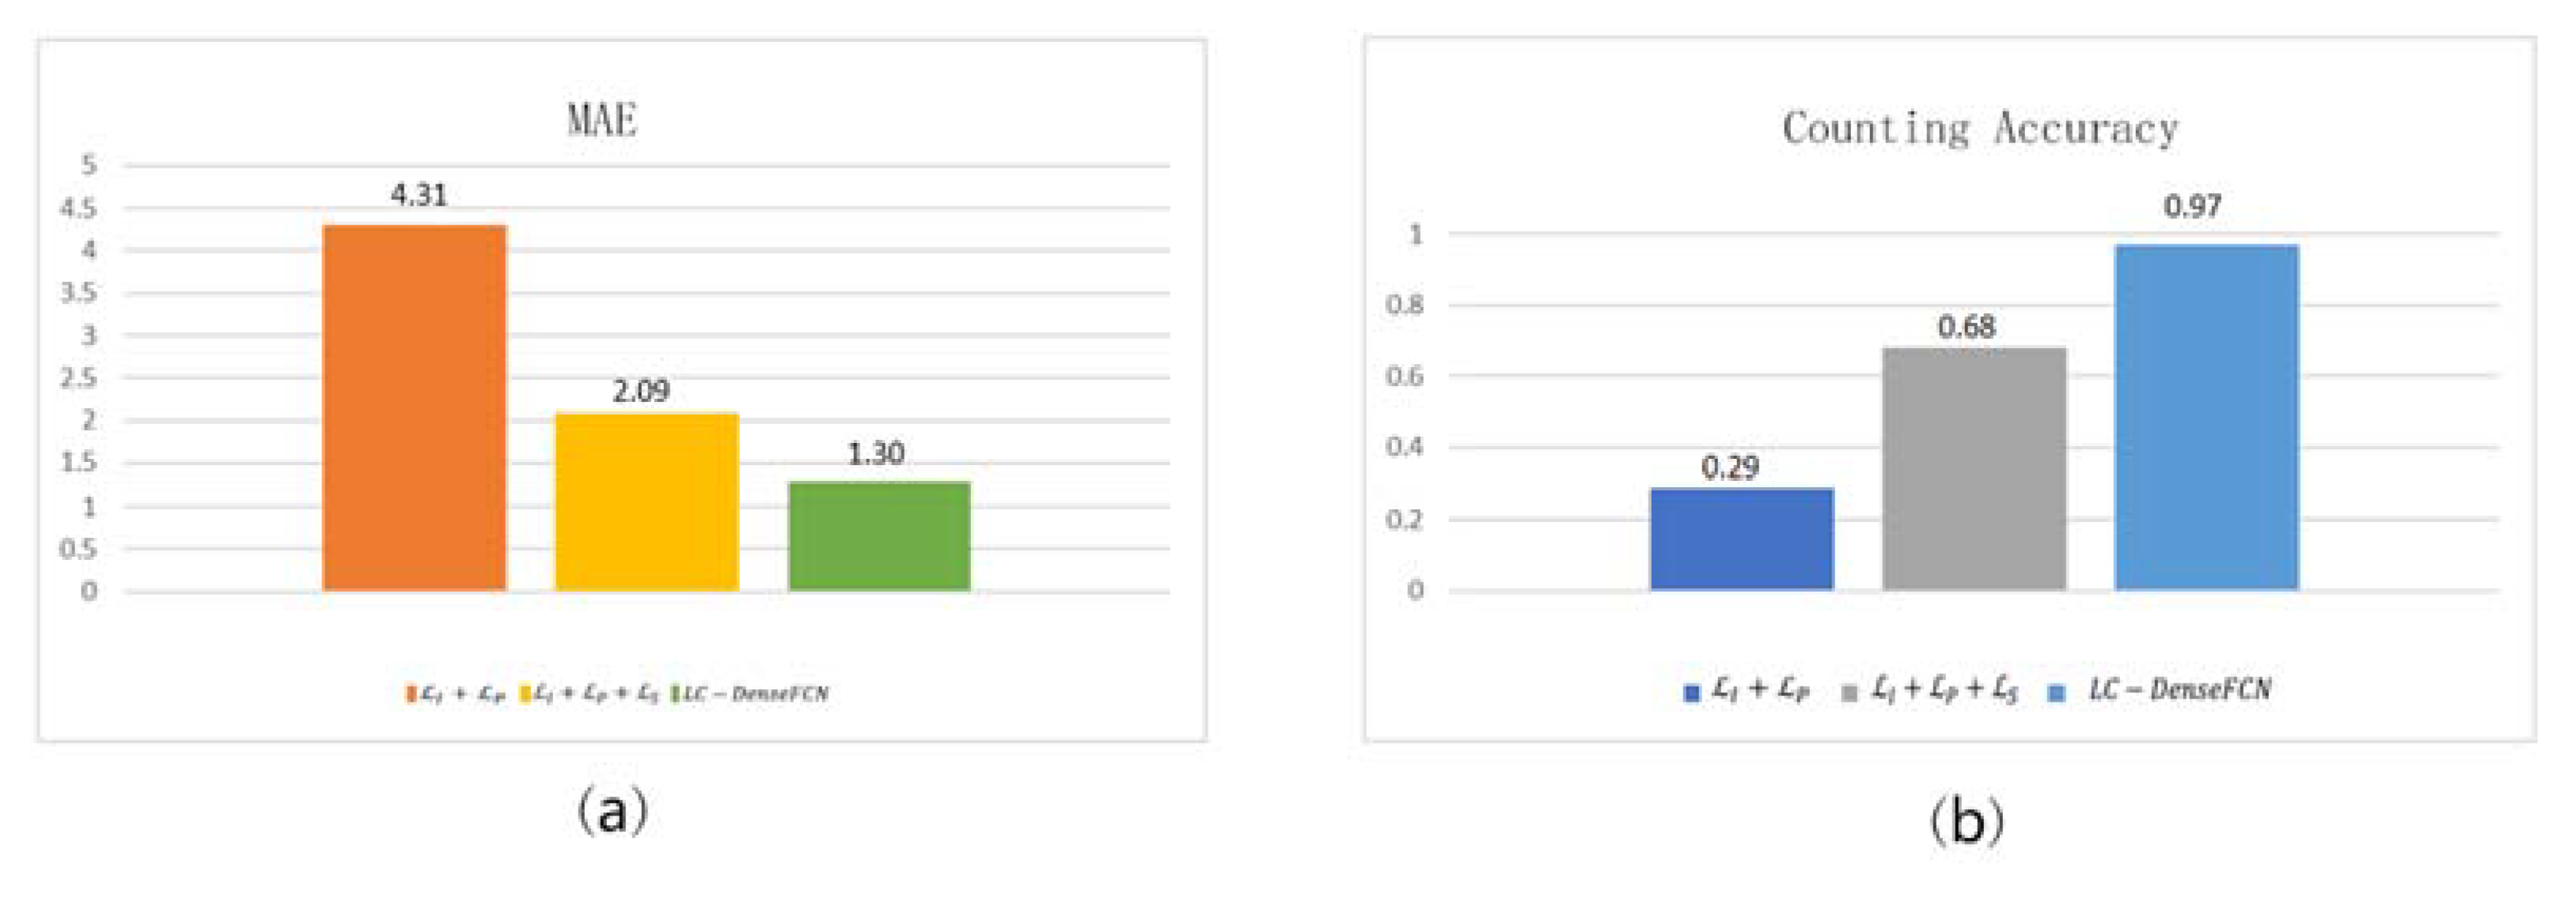
4.2. Loss Function Analysis

In this section, we present assessments of the effect of each term of the loss function on the counting and localization results. As can be seen from Figure 4b, the model using only two terms (the image-level loss I and the point-level loss P ) resulted in a single blob that grouped many object instances together. From Figure 5, we can see that this performed poorly in terms of the MAE and counting accuracy. Then, we introduced the split-level loss function S to encourage the model to predict blobs that did not contain more than one point-annotation. As shown in Figure 4c, the model after adding S predicted several blobs as object instances rather than one large single blob. However, because I + P + S did not penalize the model for predicting blobs with no point annotations, it caused the model to make false predictions, which also resulted in a model counting accuracy of only 0.68 (see Figure 5b). Finally, we introduced the false positive loss F which discouraged the model from predicting blobs with no point annotations. By adding this loss term to the optimization, LC-DenseFCN achieved significant improvements, as seen in the qualitative and quantitative results, which are shown in Figure 4d and Figure 5. Furthermore, the results of Figure 4 and Figure 5 also verify the role played by each part of LC-Loss on the whole network. Each term of the loss function plays a corresponding role, which is well adapted to the model that we proposed, and a complete LC-Loss can make our network achieve the best performance.

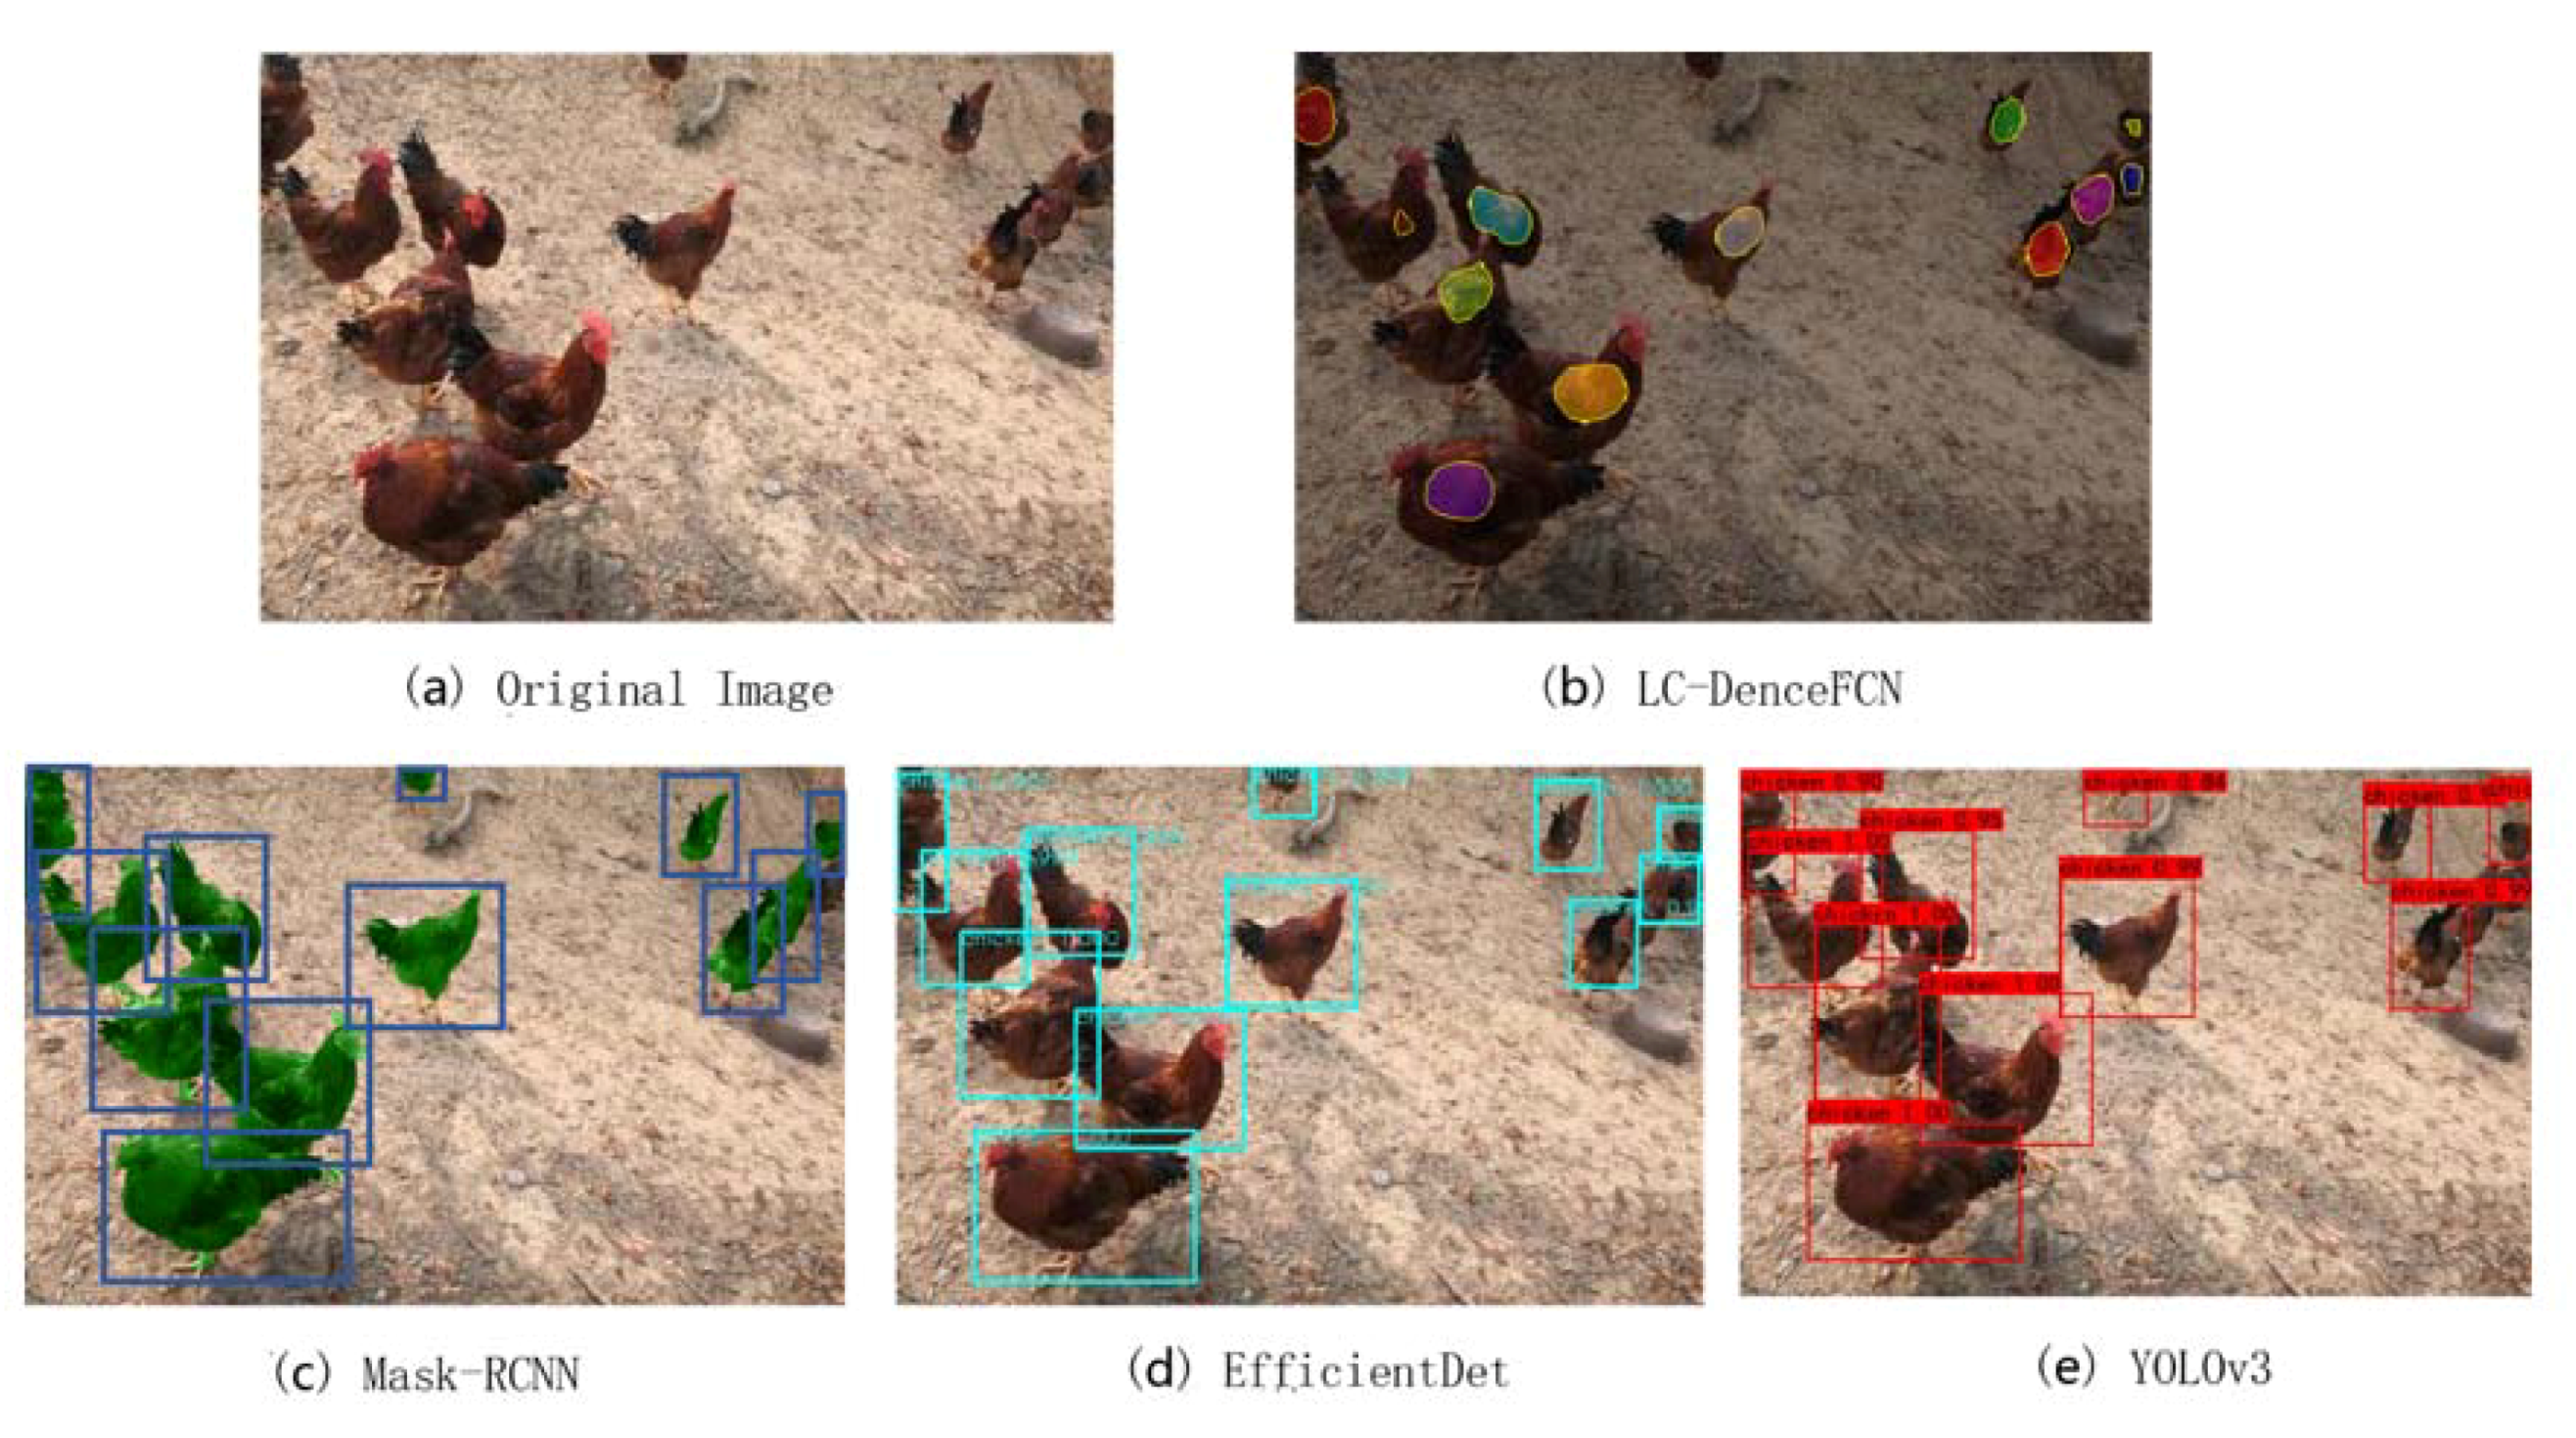
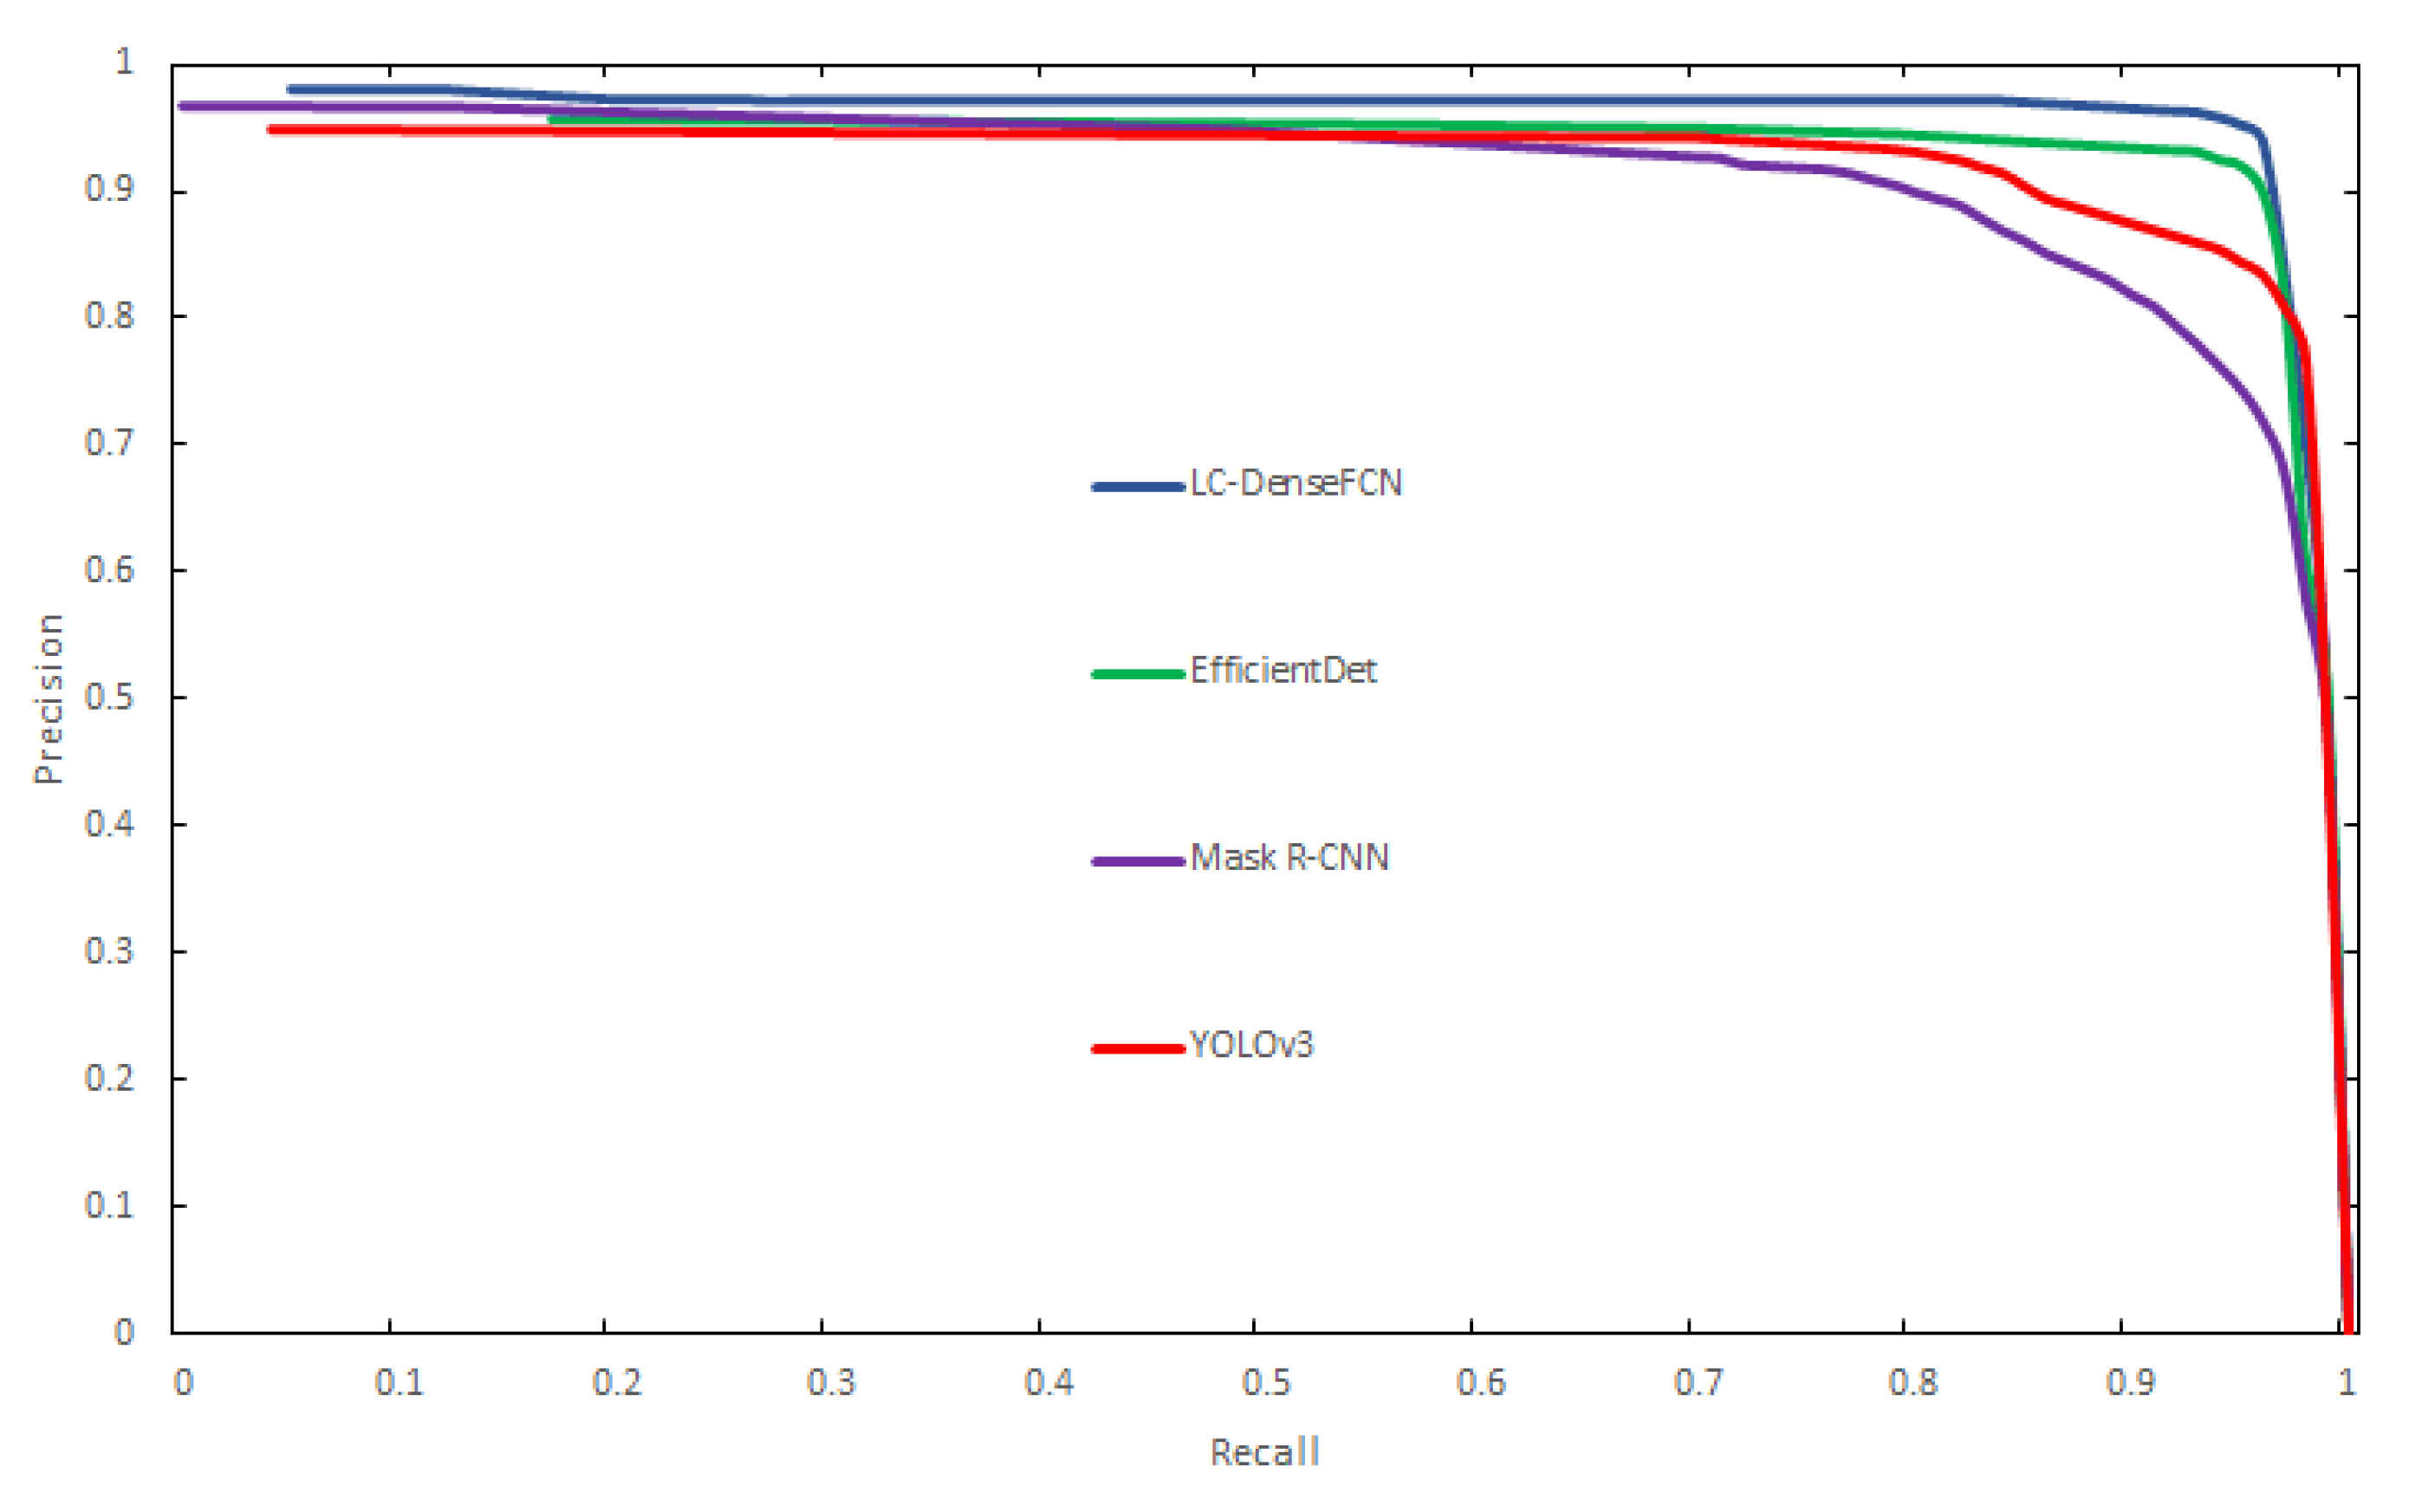
4.3. Comparison with State-of-the-Art Object Detection Algorithms

Object counting is a computer vision task that can be applied to surveillance and vehicle counting. In the past, object detection has been regarded as the mainstream method for counting tasks. We compared LC-DenseFCN with three state-of-the-art object detection algorithms, namely, YOLOv3, EfficientDet and Mask R-CNN. To allow the readers to visually compare the results of the different methods, the predictions processed by the competing methods are visualized in Figure 6. As shown, all four methods used in the experiment achieved a good performance for the less dense image of chickens. However, object detection methods did not perform well for dense or heavily overlapped parts of the image. After a preliminary analysis, the purpose of the object detection method is to frame the object out; as such, it requires more complete characteristics of the object, resulting in a poor detection effect for multiple overlapping objects. As a point supervision method, LC-DenseFCN does not need the full features of the object; hence, it can perform well in processing images where multiple objects overlap.
It can be seen from Figure 7 there is an inverse relationship between the precision and recall, which means the higher the precision, the lower the recall. However, we expected to detect all the target objects, which means higher recall rates, and also expected higher precision rates of the detected objects. At around recall = 0.82, 0.93, 0.95, 0.96, the inflection point appeared in all four curves known as balance points where the precision and recall achieved the best values, and then the precision dropped sharply.
The counting experiment results of the test image set are shown in Table 2. It can be seen from the table that the counting accuracy of LC-DenseFCN reached 0.97, which was the highest among the four methods, and the values of FPS and AP were also higher than those of the other three object detection methods. Among the three object detection algorithms, the counting accuracy of EfficientDet reached 0.96, which was only 0.01% lower than that of LC-DenseFCN. Moreover, the AP of EfficientDet was also very close to that of LC-DenseFCN, but the FPS value was only 4.33. The counting accuracy and AP of Mask R-CNN were not good enough, because compared with other object detection algorithms, it also needed to segment the objects, which increased the difficulty of detection and resulted in a low FPS. If using cameras to observe a chicken farm in real time, a high detection speed is very necessary. The result indicates that LC-DenseFCN is most effective in real-world datasets, because such datasets consist of data from different, complex scenes with different density distributions and different degrees of occlusion.

5. Discussion

In this paper, we have proposed LC-DenseFCN, a deep learning algorithm, for the detection and counting of chickens from camera images. The key novelty of the work is the presentation of the LC-DenseFCN algorithm and the demonstration of its effectiveness for this important poultry monitoring task. As for the feasibility of this approach, we discuss the following:
(1)
In terms of processing accuracy, the source of detection was images collected by only two cameras on the chicken farm. Due to the fixed collection angle, the information of the overall environment could not be obtained; as a result, the information acquired was limited. Meanwhile, the movement characteristics of the chickens could also lead to a large error. In this regard, multiple cameras can be installed at different angles of the chicken farm, and the images collected by multiple cameras can be integrated to assess the overall situation of the chicken farm. Moreover, the overlapping situation of multiple chickens can be improved by installing cameras on top of the farm, which helps to effectively reduce counting errors. In general, although some individuals may have been missing in the test process, we finally achieved real-time monitoring of the number of chickens. The number of chickens should, theoretically, be in a dynamic range, and the final data can be obtained by statistical methods; thus, it will not have a significant impact on the overall accuracy;
(2)
In terms of processing speed, in order to meet a farmer’s need to obtain information on their chickens at any time, real-time processing of images collected by the camera is required. This is why we considered using the point supervision method. Compared to object detection methods, the point supervision method does not need to know the exact size of the object; therefore, the processing method is much simpler, and for counting tasks, the size of an object is of no practical use. The current semantic segmentation and instance segmentation methods were not considered due to their slow processing speed and the large amount of time spent on data annotation. The experimental results indicate that the LC-DenseFCN algorithm performs well; the detection speed was 9.27 FPS, which is sufficient for real-time detection.
Based on the above discussion, we believe that the proposed method is effective for automatic poultry management and the development of refined agriculture. Furthermore, we have provided a new idea for the application of agricultural intelligence in the breeding industry.

6. Conclusions

In this study, deep learning technology was applied to the detection and counting of chickens, and a high-precision algorithm for chicken detection and counting was proposed. Firstly, we obtained video data from a camera installed on a chicken farm. Then, we took frames from the video and created a dataset of 1200 images. For meeting the needs of practical applications, we designed a point supervision model (LC-DenseFCN) and compared it with other point supervision models (LC-FCN and LC-ResFCN) and object detection models (EfficientDet, YOLOv3 and SSD). The experimental results indicate that the LC-DenseFCN algorithm performs well; the detection accuracy was 93.84%, and the counting accuracy reached up to 97%. Moreover, LC-DenseFCN could process images at 9.27 FPS, which was faster than any other model; therefore, its performance meets the requirements of practical applications. In order to prove the effectiveness of the combination of LC-Loss and model, we conducted a split experiment on LC-Loss, and the results showed that each loss of LC-Loss had a corresponding effect, and our model was matched with LC-Loss. As for the experimental results, we discussed the realization method of the automatic estimation of the quantity of chickens on the farm, which provided the train of thought for the automatic management of chicken farms. In future work, we will concentrate on assessing the performance of LC-DenseFCN in counting poultry species and further explore the impact of stocking density on animal welfare.

Author Contributions

Conceptualization, L.C. and X.L.; methodology, H.P.; software, Z.X.; validation, K.W.; formal analysis, Y.Y.; investigation, J.M.; resources, H.P.; data curation, J.M.; project administration, J.L.; writing—original draft preparation, L.C. and Z.X.; writing—review and editing, H.P. All authors have read and agreed to the published version of the manuscript.

Funding

This work was supported by the Sichuan Province Department of Education (Grant No. JG2018-348) and the Sichuan Agricultural University (Grant No.2021993069).

Institutional Review Board Statement

Not applicable.

Informed Consent Statement

Not applicable.

Acknowledgments

Thanks to Song’s chicken farm for their help in collecting the dataset and Haoyang Yu for his advice on methods. Thanks to Xiao Chen and Yuanjiang Luo for their advice on drawing.

Conflicts of Interest

The authors declare no conflict of interest.

References

  1. Abbasi, A.Z.; Islam, N.; Shaikh, Z.A. A review of wireless sensors and networks’ applications in agriculture. Comput. Stand. Interfaces 2014, 36, 263–270. [Google Scholar]
  2. Ruiz-Garcia, L.; Lunadei, L.; Barreiro, P.; Robla, I. A Review of Wireless Sensor Technologies and Applications in Agriculture and Food Industry: State of the Art and Current Trends. Sensors 2009, 9, 4728–4750. [Google Scholar] [CrossRef] [PubMed] [Green Version]
  3. Ning, W.; Zhang, N.; Wang, M. Wireless sensors in agriculture and food industry—Recent development and future perspective. Comput. Electron. Agric. 2006, 50, 1–14. [Google Scholar]
  4. Neethirajan, S.; Tuteja, S.K.; Huang, S.T.; Kelton, D. Recent advancement in biosensors technology for animal and livestock health management. Biosens. Bioelectron. 2017, 98, 398–407. [Google Scholar] [CrossRef] [PubMed]
  5. Handcock, R.N.; Swain, D.L.; Bishop-Hurley, G.J.; Patison, K.P.; Wark, T.; Valencia, P.; Corke, P.; O’Neill, C. Monitoring Animal Behaviour and Environmental Interactions Using Wireless Sensor Networks, GPS Collars and Satellite Remote Sensing. Sensors 2009, 9, 3586–3603. [Google Scholar] [CrossRef] [Green Version]
  6. Neethirajan, S. Recent advances in wearable sensors for animal health management. Sens. Bio-Sens. Res. 2017, 12, 15–29. [Google Scholar] [CrossRef] [Green Version]
  7. Frost, A.R.; Schofield, C.P.; Beaulah, S.A.; Mottram, T.T.; Lines, J.A.; Wathes, C.M. A review of livestock monitoring and the need for integrated systems. Comput. Electron. Agric. 1997, 17, 139–159. [Google Scholar] [CrossRef]
  8. Brown, K.H.; Hollingsworth, J. The Food Marketing Institute and the National Council of Chain Restaurants: Animal welfare and the retail food industry in the United States of America. Rev. Sci. Tech. 2005, 24, 655–663. [Google Scholar] [CrossRef]
  9. Tu, X.; Du, S.; Tang, L.; Xin, H.; Wood, B. A real-time automated system for monitoring individual feed intake and body weight of group housed turkeys. Comput. Electron. Agric. 2011, 75, 313–320. [Google Scholar] [CrossRef]
  10. Thaxton, J.P.; Dozier, W.A., III; Branton, S.L.; Morgan, G.W. Environment, Well-Being, and behavior Stocking Density and Physiological Adaptive Responses of Broilers. Poult. Sci. 2006. [Google Scholar] [CrossRef]
  11. Tong, H.B.; Lu, J.; Zou, J.M.; Wang, Q.; Shi, S.R. Effects of stocking density on growth performance, carcass yield, and immune status of a local chicken breed. Poult. Sci. 2012, 91, 667. [Google Scholar] [CrossRef]
  12. Dozier, W.A.; Thaxton, J.P.; Purswell, J.L.; Olanrewaju, H.A.; Roush, W.B. Stocking density effects on male broilers grown to 1.8 kilograms of body weight. Poult. Sci. 2006, 85, 344–351. [Google Scholar] [CrossRef]
  13. Yao, Y.; Yu, H.; Mu, J.; Li, J.; Pu, H. Estimation of the Gender Ratio of Chickens Based on Computer Vision: Dataset and Exploration. Entropy 2020, 22, 719. [Google Scholar] [CrossRef] [PubMed]
  14. Aydin, A. Using 3D vision camera system to automatically assess the level of inactivity in broiler chickens. Comput. Electron. Agric. 2017, 135, 4–10. [Google Scholar] [CrossRef]
  15. So-In, C.; Poolsanguan, S.; Rujirakul, K. A hybrid mobile environmental and population density management system for smart poultry farms. Comput. Electron. Agric. 2014, 109, 287–301. [Google Scholar] [CrossRef]
  16. Alahmari, S.S.; Goldgof, D.; Hall, L.; Phoulady, H.A.; Patel, R.H.; Mouton, P.R. Automated Cell Counts on Tissue Sections by Deep Learning and Unbiased Stereology. J. Chem. Neuroanat. 2019, 96, 94–101. [Google Scholar] [CrossRef]
  17. Xu, B.; Wang, W.; Falzon, G.; Kwan, P.; Schneider, D. Automated cattle counting using Mask R-CNN in quadcopter vision system. Comput. Electron. Agric. 2020, 171, 12. [Google Scholar] [CrossRef]
  18. Nguyen, H.; Maclagan, S.J.; Tu, D.N.; Nguyen, T.; Phung, D. Animal Recognition and Identification with Deep Convolutional Neural Networks for Automated Wildlife Monitoring. In Proceedings of the 2017 IEEE International Conference on Data Science and Advanced Analytics (DSAA), Tokyo, Japan, 19–21 October 2017; pp. 40–49. [Google Scholar]
  19. Tian, M.; Guo, H.; Chen, H.; Wang, Q.; Long, C.; Ma, Y. Automated pig counting using deep learning. Comput. Electron. Agric. 2019, 163, 104840. [Google Scholar] [CrossRef]
  20. Zhang, Q.; Liu, Y.; Gong, C.; Chen, Y.; Yu, H. Applications of Deep Learning for Dense Scenes Analysis in Agriculture: A Review. Sensors 2020, 20, 1520. [Google Scholar] [CrossRef] [PubMed] [Green Version]
  21. Laradji, I.H.; Rostamzadeh, N.; Pinheiro, P.O.; Vazquez, D.; Schmidt, M. Where are the blobs: Counting by localization with point supervision. In Proceedings of the European Conference on Computer Vision (ECCV), Munich, Germany, 8–14 September 2018; pp. 547–562. [Google Scholar]
  22. Huang, G.; Liu, Z.; Van Der Maaten, L.; Weinberger, K.Q. Densely connected convolutional networks. In Proceedings of the IEEE conference on computer vision and pattern recognition, Honolulu, HI, USA, 21–26 July 2017; pp. 4700–4708. [Google Scholar]
  23. He, K.; Zhang, X.; Ren, S.; Sun, J. Deep residual learning for image recognition. In Proceedings of the IEEE conference on computer vision and pattern recognition, Las Vegas, NV, USA, 27–30 June 2016; pp. 770–778. [Google Scholar]
  24. Long, J.; Shelhamer, E.; Darrell, T. Fully Convolutional Networks for Semantic Segmentation. IEEE Trans. Pattern Anal. Mach. Intell. 2015, 39, 640–651. [Google Scholar]
  25. Girshick, R.; Donahue, J.; Darrell, T.; Malik, J. Rich feature hierarchies for accurate object detection and semantic segmentation. In Proceedings of the IEEE Conference on Computer Vision and Pattern Recognition, Columbus, OH, USA, 23–28 June 2014; pp. 580–587. [Google Scholar]
  26. Girshick, R. Fast R-Cnn. In Proceedings of the IEEE International Conference on Computer Vision, Santiago, Chile, 7–13 December 2015; pp. 1440–1448. [Google Scholar]
  27. Ren, S.; He, K.; Girshick, R.; Sun, J. Faster R-CNN: Towards Real-Time Object Detection with Region Proposal Networks. IEEE Trans. Pattern Anal. Mach. Intell. 2017, 39, 1137–1149. [Google Scholar] [CrossRef] [PubMed] [Green Version]
  28. He, K.; Gkioxari, G.; Dollár, P.; Girshick, R. Mask R-Cnn. In Proceedings of the IEEE International Conference on Computer Vision, Venice, Italy, 22–29 October 2017; pp. 2961–2969. [Google Scholar]
  29. Redmon, J.; Farhadi, A. YOLOv3: An Incremental Improvement. In Proceedings of the CVPR 2018: IEEE Conference on Computer Vision and Pattern Recognition, Salt Lake, UT, USA, 18–22 June 2018. [Google Scholar]
  30. Tan, M.; Pang, R.; Le, Q.V. Efficientdet: Scalable and efficient object detection. In Proceedings of the IEEE/CVF Conference on Computer Vision and Pattern Recognition, Seattle, WA, USA, 13–19 June 2020; pp. 10781–10790. [Google Scholar]
  31. Redmon, J.; Divvala, S.; Girshick, R.; Farhadi, A. In You only look once: Unified, real-time object detection. In Proceedings of the IEEE Conference on Computer Vision and Pattern Recognition, Las Vegas, NV, USA, 27–30 June 2016; pp. 779–788. [Google Scholar]
  32. Redmon, J.; Farhadi, A. In YOLO9000: Better, faster, stronger. In Proceedings of the IEEE Conference on Computer Vision and Pattern Recognition, Honolulu, HI, USA, 21–26 July 2017; pp. 7263–7271. [Google Scholar]
  33. Tan, M.; Le, Q. In Efficientnet: Rethinking model scaling for convolutional neural networks. In Proceedings of the International Conference on Machine Learning, Long Beach, CA, USA, 9–15 June 2019; pp. 6105–6114. [Google Scholar]
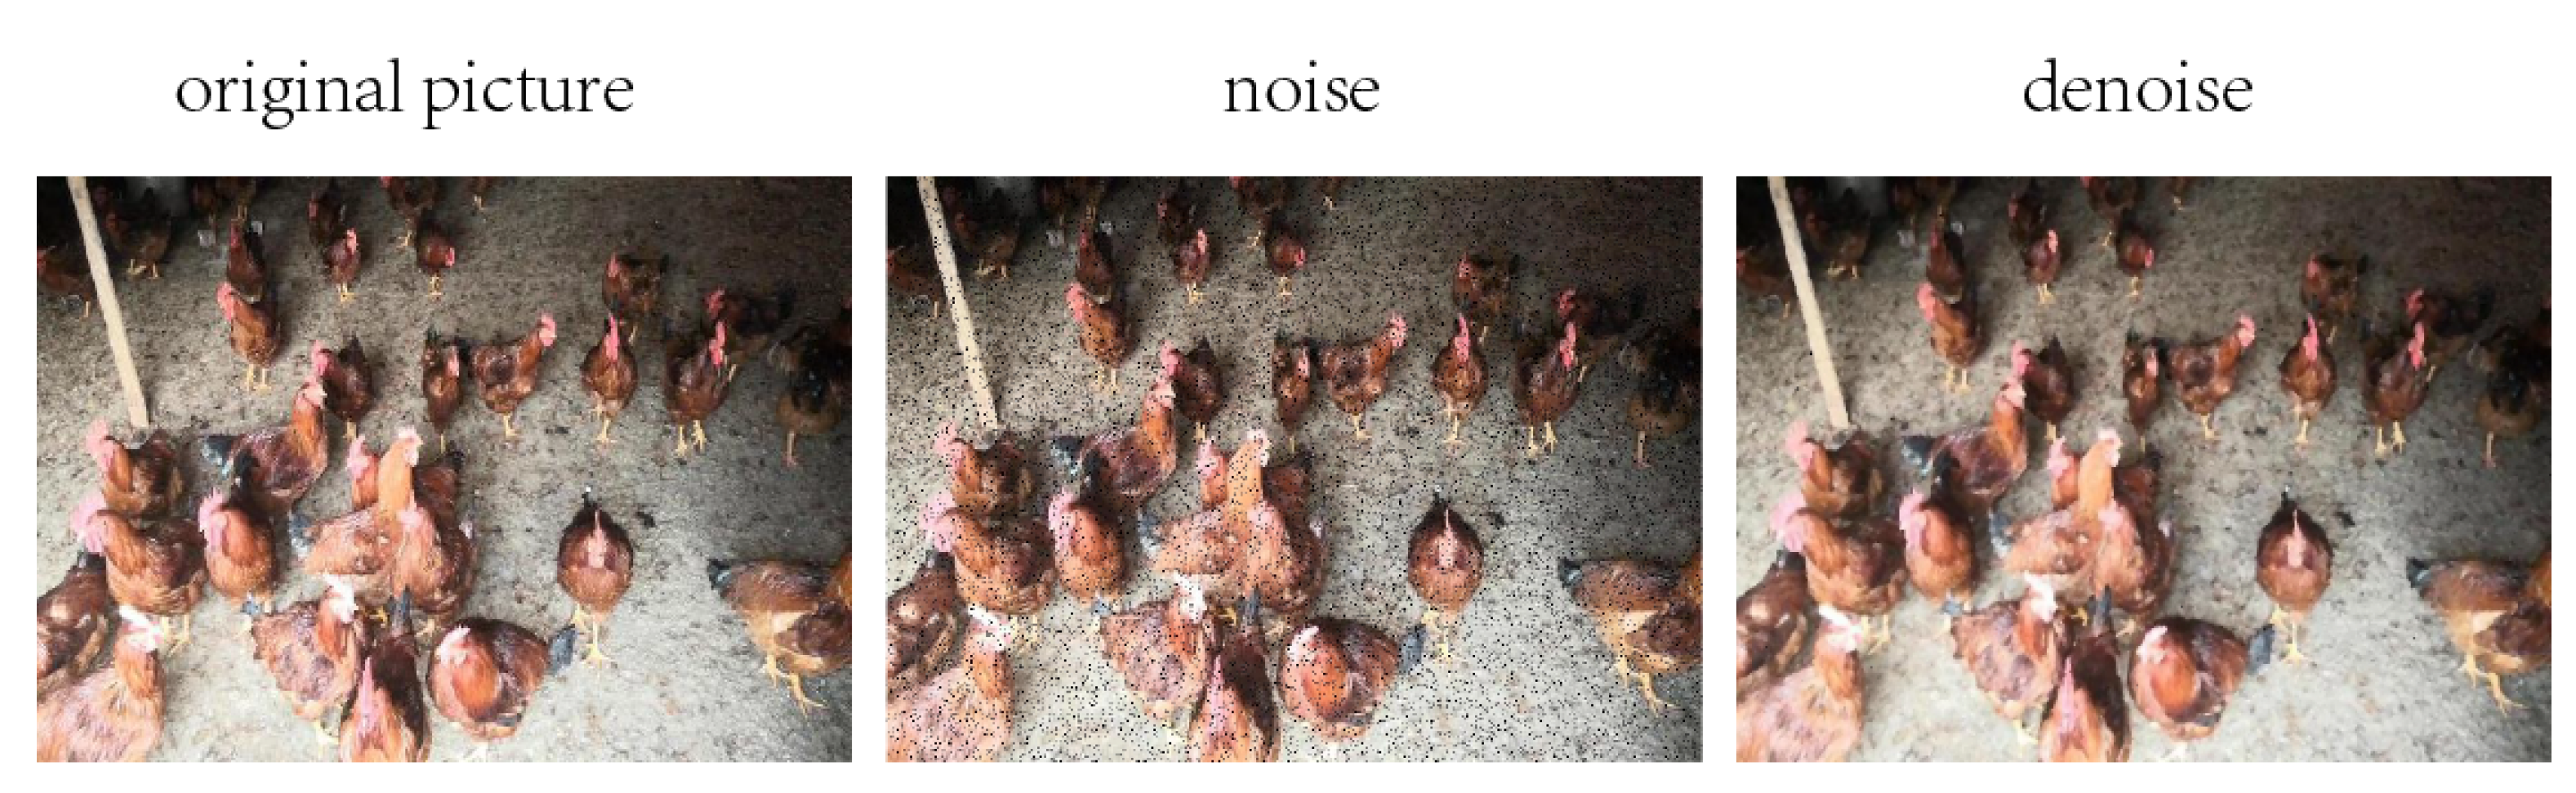
  34. Boyat, A.K.; Joshi, B.K. A Review Paper: Noise Models in Digital Image Processing. Signal Image Process. Int. J. 2015, 6, 63–75. [Google Scholar] [CrossRef]
  35. Simonyan, K.; Zisserman, A. Very deep convolutional networks for large-scale image recognition. arXiv 2014, arXiv:1409.1556. [Google Scholar]
  36. Kuznetsova, A.A. Statistical Precision-Recall Curves for Object Detection Algorithms Performance Measurement. In Cyber-Physical Systems Modelling and Intelligent Control; Springer: Berlin/Heidelberg, Germany, 2021; pp. 335–348. [Google Scholar]
Figure 1. The structure of the chicken detection and counting algorithm.
Agriculture 11 00493 g001
Figure 2. Adding salt and pepper noise and median filtering process.
Agriculture 11 00493 g002
Figure 3. The point supervision algorithm training progress through 100 epochs (MAE means Mean Absolute Error).
Agriculture 11 00493 g003
Figure 4. Qualitative results of LC-DenseFCN trained with different terms of the proposed loss function. (a) Test images obtained from our test dataset. (b) Prediction results using only image-level and point-level loss terms. (c) Prediction results using image-level, point-level and split-level loss terms. (d) Prediction results trained with the full proposed loss function.
Agriculture 11 00493 g004
Figure 5. Comparison of different parts of the proposed loss function for counting and localization performance. (a) The mean absolute error (MAE) performance of the three loss functions. (b) The counting accuracy of the three loss functions.
Agriculture 11 00493 g005
Figure 6. Predictions on the test images for four detection algorithms.
Agriculture 11 00493 g006
Figure 7. Comparisons of precision–recall curves for four detection cases.
Agriculture 11 00493 g007
Table 1. Accuracy and error values of three point supervision methods.
Accuracy (%)Mean Absolute ErrorMean Square ErrorRoot-Mean-Square ErrorMean Relative
Error
LC-FCN91.401.605.142.270.86
LC-ResFCN92.321.383.711.930.77
LC-DenseFCN93.841.302.251.510.67
Table 2. Comparison of counting results with three competing methods.
Ground TruthDetectedCounting AccuracyCounting ErrorAverage PrecisionFrames Per Second
LC-DenseFCN487247480.970.030.949.27
YOLOv3487243960.900.100.895.11
EfficientDet487246970.960.040.924.33
Mask R-CNN487242130.860.140.862.04
Publisher’s Note: MDPI stays neutral with regard to jurisdictional claims in published maps and institutional affiliations.

