
Choice of Modern Food Distribution Channels and Its Welfare Effects: Empirical Evidence from Taiwan


1
Department of Agricultural Economics, National Taiwan University, Taipei 10617, Taiwan
2
Department of Agricultural and Consumer Economics, University of Illinois at Urbana-Champaign, Champaign, IL 61820, USA
*
Authors to whom correspondence should be addressed.
Agriculture 2021, 11(6), 499; https://0-doi-org.brum.beds.ac.uk/10.3390/agriculture11060499
Submission received: 30 April 2021
/
Revised: 23 May 2021
/
Accepted: 25 May 2021
/
Published: 28 May 2021
(This article belongs to the Special Issue Agricultural Food Marketing, Economics and Policies)
Abstract
:The determinants and/or economic effects of modern food distribution channels have attracted much attention in previous research. Studies on the welfare consequences of modern channel options, however, have been sparse. Based on a broader definition of modern food distribution channels including midstream processors and downstream retailers (supermarkets, hypermarkets, brand-named retailers), this study contributes to the existing body of knowledge by exploring the distributional implications of farm households’ choice of modern food distribution channels using a large and unique farm household dataset in Taiwan. Making use of the two-step control function approach, we identify the effect of modern food distribution options on farm households’ profitability. The results reveal selling farm produce to modern food distributors does not produce a positive differential compared to the traditional outlets. Another dimension of farm household welfare affected by the choice of modern food distribution channel is income inequality. We apply the Lerman and Yitzhaki decomposition approach to gain a better understanding of the effect of the marketing channel option on the overall distribution of farm household income. The Gini decomposition of different income sources indicates that the choice of modern food distribution channels results in an inequality-equalizing effect among the farm households in Taiwan, suggesting the inclusion of smallholder farmers in the modern food distribution channels improves the overall welfare of the rural society.
1. Introduction
The development of modern food supply chains, especially that of supermarkets and/or hypermarkets, has attracted much attention in past research of developing countries [1,2,3,4,5]. This farm–market linkage is deemed important for increasing smallholder farm income or net return [2,4,6,7], reducing poverty [2], and catering to the needs and quality requirements of consumers nowadays [8]. The literature on modern food supply chains generally follows two tracks. The first track concerns the identification of the factors determining the choice of modern marketing channels. The second track focuses on examining the economic outcomes (farm income, profitability, farm household income) for farmers selling farm produce to modern food distributors.
A considerable body of research explored the determinants of choice of supermarkets as the food distribution channel. For instance, in Kenya, farmers who sell to supermarkets were mostly well-educated operators with medium-sized commercial farms [7]. It was found in one of the previous studies that tomato growers in Guatemala who sell their farm produce to supermarkets are larger, more capital-intensive, and more specialized and use more inputs [9]. Instead of focusing on supermarkets, some other studies focused on examining the choice among different marketing channels [10,11,12]. For example, in the case of the cassava sector in Nigeria, human, physical, and social capitals were found to affect farmers’ decision to sell to midstream processors [13]. Among others, some focused the attention on the institutional arrangements between farmers and different marketing options [14]. It was found that Thai sweet pepper growers in general prefer marketing channels that do not involve contracting [14]. On the other hand, some previous studies [15] examined the relationship between the choice of marketing strategies and the socio-economic characteristics of Taiwanese farm households. It was found that the level of education, household and farm size, and types of farms are determinants of farm households’ choice of marketing channel. A study in Ghana also showed that farm size, the price of rice, access to the market, access to credit, and a household’s assets are correlated with rice farmers’ choice of marketing channels [16]. In the identification of the key factors driving the choice of modern food retailers over traditional marketing channels, Indian vegetable growers who are younger and more experienced and have a higher educational level were found to be more likely to choose to sell their farm produce to supermarkets [6]. Farmers also tend to choose modern marketing channels if they can receive a higher price for their product and reduce the transaction costs [17].
Empirical evidence concerning the economic effects of modern food distribution channels, especially those of supermarkets, has been mixed. For example, in the study of Kenyan vegetable farmers, an average farm income gain of 48% was found for growers participating in supermarket channels [2]. Similarly, it was found that there are differences in profitability resulting from different marketing practices, and supermarket channel farmers earned a 40% higher gross profit than traditional channel farmers [7]. Nevertheless, Guatemalan tomato growers’ profit rates were found to be similar to those selling farm produce through the traditional marketing channels due to higher input use [9]. Some similar studies, [5], for example, found that the market channel choice of China’s apple growers does not contribute significantly to their household income except for cooperative members. It was also concluded that selling farm produce to modern supply chains does not produce a positive income differential compared with supplying to traditional markets [14].
The contribution of the present study is threefold. First, in the modern food supply chain, there have been three concurrent changes including retail sector consolidation, processing sector expansion, and service industry growth [18]. The existing literature concerning modern food supply channels focused mostly on the first aspect of change. Motivated by the emerging expansion and/or growth of food processing and service industries, this study intends to examine if farm households’ choice of the modern food distribution channel contributes positively to farm household welfare from two dimensions—farm income and income inequality—based on a broader definition of modern marketing channels. In the present study, modern marketing channels are composed of supermarkets, hypermarkets, other downstream retailers [14,19,20,21,22], and midstream processors [21,23,24,25]. Second, while some studies have addressed the welfare implications of the choice of food distribution channel concerning poverty reduction [2], consumption expenditure per capita [26], multidimensional poverty [27], and food security [28], this study contributes to the existing body of knowledge by exploring its income-equalizing effects. Moreover, unlike the small-scale and commodity-specific datasets that previous studies were based on, a large and unique farm household dataset containing information on farm income shares of multiple distribution channels in Taiwan is used in the present study. Therefore, this study provides more general and comprehensive insights into the inequality-reducing or inequality-enlarging effects of modern food supply chains.
2. Materials and Methods
2.1. The Farm Household Survey Data
The data used in this study were taken from the 2013 Primary Farm Household Survey (PFHS), a nationwide survey conducted by the Directorate-General of Budget, Accounting and Statistics, Executive Yuan, Taiwan. The PFHS collected Taiwanese farm household information, including socio-demographic status, major commodity produced, production area, income from different sources, and shares of farm produce sold to different marketing channels. The farm households surveyed are farm households whose annual income from the agricultural sector is no less than NTD 200,000 (USD 6836), and where at least one household member under 65 years old works on the farm.
The survey used a stratified random sampling approach in drawing the sample, with households as the primary sampling units stratified by the produce items. The data are appropriate for the present research for three reasons. First, the survey was targeted at non-substance farm households, enabling us to examine the status quo and trend of primary agricultural operators in Taiwan. Second, the survey was conducted by the central government and comprised observations across 224 townships. Thus, it is considered a reliable and representative source of data. Moreover, the dataset contains data of income from different sources and shares of farm produce sold to different marketing channels, which make the investigation of the distributional effects of the major marketing channel choice possible.
Eight primary marketing options taken by the farm households: consumers, supermarkets/hypermarkets, wholesalers, wholesale markets, processors, farmer organizations and government purchases, retailers, and household self-consumption, were categorized in the original survey. In this study, we categorized the primary marketing channels into traditional outlets (wholesalers and wholesale markets), modern distributors (supermarkets/hypermarkets and processors), consumers, and farmer organizations and government purchases. Furthermore, farm households’ primary marketing channels were defined as those with a share greater than 50% in the farm households’ total sales of farm produce.
There are 8524 farm households with a major distribution channel in the dataset. In the empirical analysis, we focused on the welfare implications of modern food distribution channels relative to the traditional outlets; therefore, farm households that chose direct sales to consumers, farmer organizations, and government purchases as their major marketing channels were excluded. The final dataset used in the present study contained 7076 observations.
2.2. The Empirical Model
An issue of endogeneity is present when modeling the economic outcome of producers’ choice of modern food distribution outlets relative to the traditional ones. The endogeneity problem arises from the possibility that the unobservable characteristics that affect a producer’s choice of marketing options may also be affecting their economic performance. This study follows the two-step control function approach [29] to examine the welfare implications of modern food distribution, correcting for possible endogeneity. The control function approach is preferable in terms of providing consistent estimators for the model with endogenous explanatory variables [29].
The two-step control function procedure in this study starts with estimating the probit model of modern channel choice as follows:
In (1), denotes the indicator variable which takes the value of one if the farm household chooses modern channels as their major outlets to distribute the farm produce, and zero otherwise. The vector of explanatory variables including farm and farm household socio-economic characteristics is denoted by and the instrumental variable to control for endogeneity of modern channel choice in determining economic performance is denoted by . This study uses the number of supermarkets, hypermarkets, and other branded stores as the instrumental variable for modern distribution channels. and are the coefficients (vector). The random disturbance term is denoted as in (1).
Let denote the standard normal probability density function and the cumulative standard normal density function. The generalized residuals of the endogenous explanatory variable [29], i.e., the choice of modern food distribution channels, can be calculated from the probit estimates as
The two-step control function approach ends with incorporating the generalized residual calculated from the first step into the outcome determination equation:
In (3), denotes the outcome (either profitability or farm income) resulting from farm households’ choice of modern food distribution channel. At the right-hand side of (3), denotes the ith farm household’s vector of socio-economic characteristics which systematically affect the farm household’s economic performance. The endogeneity test of the endogenous explanatory variable, , can be tested by the heteroscedasticity-corrected (robust) t statistics of the coefficient of the generalized residual [29].
Another dimension of farm household welfare is income inequality. To gain a better understanding of the overall contribution of different factor sources to income inequality, we applied the decomposition approach [30]. Let Y denote household income and F the cumulative distribution; then, the decomposition starts with defining half of Gini’s mean difference, , as
In the above equation, can be expressed as the covariance of household income and the cumulative distribution of income, i.e., . Let and be the kth income component and its average and the cumulative density of . The Gini coefficient can be expressed as the ratio of over the sample mean of household income (). Accordingly, the Gini coefficient of the kth income component is expressed as
Household income is the sum of the k income components. Making use of the additive property of covariance, the Gini coefficient of household income, , can be expressed as
Multiplying and dividing (6) by and , income inequality can be decomposed as
In the above equation, denotes the Gini correlation coefficient ( of household income and the kth income component, is and represents the share of the kth income component in household income, .
2.3. Variable Definition and Summary Statistics
Table 1 presents the definition and summary statistics of all the variables used in the empirical models and the summary statistics. The socio-economic characteristics of the principal farm operators include gender, age, educational level, previous work experience, and years of farming experience. The farm households’ characteristics are captured by farmland size, total labor input, and major farm produce.
The farm households earn approximately an average annual income of NTD 710,000 (USD 24,287) from agricultural produce. If we observe farm households by food distribution channels, the average income of farm households that chose the modern channels is NTD 178,000 (USD 6089) lower than those adopting the traditional ones.
The principal farm operator of the farm households in the dataset generally consists of an elderly male that attained the middle levels of education. A total of 88% of the farmers are male, and the average age is 57, reflecting the current trend of the aging agricultural labor population in Taiwan. While more than 66% received no more than a junior high school degree, less than 6% were able to finish college education. The low educational attainments somewhat explain that almost half of the farmers were not employed before participating in farm household production. On the other hand, however, most of the farm operators have more than 30 years of farming experience.
Based on the by-group summary statistics reported in Table 1, we also observe significant between-group differences in terms of farm households’ socio-economic characteristics conditioned on their choice of major food distribution channel. Farm households that chose the traditional channels differ from those that chose the modern food distributors. Specifically, the proportion of principal farm operators relying on the traditional marketing channel is 2% higher than those selling farm produce to the modern channel. Moreover, farm households relying on modern channels tend to have a larger farm size than the traditional ones (1.14 ha versus 0.91 ha).
While around 85% of farm households choosing traditional wholesale as their primary marketing channel are vegetable and fruit growers, the proportion of farm households producing two crop commodities is more than 50% lower in the group choosing modern marketing outlets, which only takes up approximately 34%. Farm households selling their farm produce to the modern distribution channel are growers of, in order, rice (38%), specialties (23%), vegetables (20%), fruits (12.4%), other crops (3.5%), and flowers (0.5%).
3. Results
To the research end of exploring the welfare consequences of modern food distribution participation, we present the results in order as follows:
- Determinants of the choice of modern food distribution channels;
- Impacts on farm household welfare (determination of economic outcomes and decomposition of income inequality by sources).
3.1. Determinants of Choice of Modern Marketing Channels
Estimates of the probit regression are presented in Table 2. The marginal effects of the explanatory variables are also reported in Table 2. The estimates of the coefficients indicate that younger and more experienced farm operators are more inclined to choose modern food distribution channels. The results are basically consistent with the findings in some previous studies, for example, [31,32,33]. Principal farm operators’ farm experience and the industry he/she previously worked in are also found to be significant drivers of selling farm produce to modern food distributors.
The results in Table 2 indicate that farm households with a larger farm size tend to sell the farm produce through modern distribution channels. This result is in line with the findings in previous studies, for example, [6], which found Indian vegetable growers with a more sizable total farmland were more inclined to using modern food distribution channels. This result also concurs with the observed un-inclusiveness of modern marketing channels for smallholders due to the incapability of meeting the food quality/safety requirements [20,34,35,36]. It is also found in Table 2 that rice and specialty growers are more likely to rely on modern distribution channels. Although emerging modern channels such as supermarkets and hypermarkets provide new opportunities for access to the market, vegetable, fruit, and flower farmers, on the other hand, are less likely to choose modern channels. This result indicates that the probability of modern channel choice varies with commodities, with differing attributes, as in some previous research works, for example, [34]. Similarly, the type of agricultural practices (livestock or vegetable) was found to influence farmers’ choice of marketing channel [11]. The reason for this difference may be due to the growers’ fear of retail–industrial monopoly and monopsony power [37]. Another possible reason to explain this result concerns product-specific barriers [11] or perishability. Vegetables, fruits, and flowers are relatively more perishable compared to rice and specialty crops. Perishability was shown to be influential to vegetable producers’ choice of marketing or procurement channel [38,39].
Finally, the significance of the instrumental variable which measures the number of supermarkets, hypermarkets, or restaurants located within the same region is significant and positive, suggesting the presence of the endogeneity problem while investigating the economic effect of modern food distribution options.
3.2. Impacts on Farm Household Welfare
This section aims at investigating whether farm households’ food distribution option improves their well-being through the investigation of its impact on farm households’ economic performance and income inequality among the farm households. Since farm income and profitability are crucial factors to the sustainability of agriculture [40,41], the two performance indicators are used to depict the economic outcomes of distribution channel choice.
We start by looking into the effects of distribution channel choice on farm income and profitability. The two-step control function estimates are reported in Table 3. Model 1 and Model 2 report, respectively, the regression results of the profitability- and income-determining equations. The generalized residual is included in the model to control for the endogeneity of distribution channel choice. The coefficient of the modern channel is negative and significant, indicating that farm households relying on traditional channels outperform those adopting modern ones. The results of the positive effect of modern marketing channel participation are supported by previous studies on developing countries such as Pakistan [25], Indonisia [4,22], and Eswatini [42]. However, there were no significant differences in profitability found for those relying on modern distributors including multinationals and domestic processors [43]. Similarly, contract farming with modern distributors including processors and supermarkets was found to impact Ghanaian maize producers’ profitability negatively [44]. With regard to a highly commercialized farm sector such as that in Taiwan, our result suggests empirical evidence contradicting that of developing countries.
The results in Table 3 indicate the differential influence of each socio-economic factor on farm households’ cash returns. The results are, in general, consistent with previous research. Gender and age are found to be significant determinants of farm revenue. Farm households with female or elderly (older than 65 years old) farm operators, on average, have a lower level of farm income. Relatively speaking, the majority of the farm operators in our final dataset have an educational level of junior high or below. These results indicate that the farm income for farm operators with an educational level of junior high school is higher than that of other educational groups.
Educational level is one crucial element of human resource/capital which has a significant influence on both the choice of marketing channels and economic outcome [25,45]. The other variable concerning the farm operators’ characteristics is years of experience in farm work. The estimate of the farm operators’ farming experience is positive and significant, indicating a positive association between experience and income from farm produce. Principal farm operators’ previous work experience being devoted to farming is considered to be another human capital-like variable in our empirical specification. Previous work experience is categorized into agricultural work, employed, and employer (self-employed). The coefficients of employee and employer are negative and significant, indicating that non-farm work experience undermines farm households’ current performance.
There are three types of attributes considered at the household level in the present study: size of farmland, total labor count including household and hired labor, and the major types of commodity produced by the farm household. The results in Table 3 indicate the positive effect of the first two household characteristics on both farm income and profitability from farm produce. This result implies that a large farm size, either measured in farmland size or labor employed, contributes positively to farm households’ farm income and net cash return. Our finding concurs with empirical evidence provided in previous studies. In a study of dairy farms’ profitability in member states of the EU [46], land and herd sizes were found to be positively associated with the milk production margin. A similar relationship was found in the study of Indian Punjab dairy farms [43] and US broiler farms [47]. We also find a significant effect of the major commodity produced on farm income and profitability. Livestock farms in Taiwan are, in general, large in operation scale; therefore, compared to the other crop group, livestock farms’ income and profitability are, on average, higher. The effect of commodity type is, in general, unanimous on farm income and net return, except for rice farms. If evaluated in terms of farm income, rice farms are, on average, lower than growers of other crops. However, rice farms are found to outperform the other crop group in terms of the level of profitability.
Another dimension of farm household welfare is income inequality. We applied the decomposition approach [30] to gain a better understanding of the welfare effect of modern distribution channel options. The decomposition results reported in Table 4 are both for total observed income and total income with farm income adjusted for endogeneity. The results list the contribution of different factor sources to income inequality.
4. Discussion
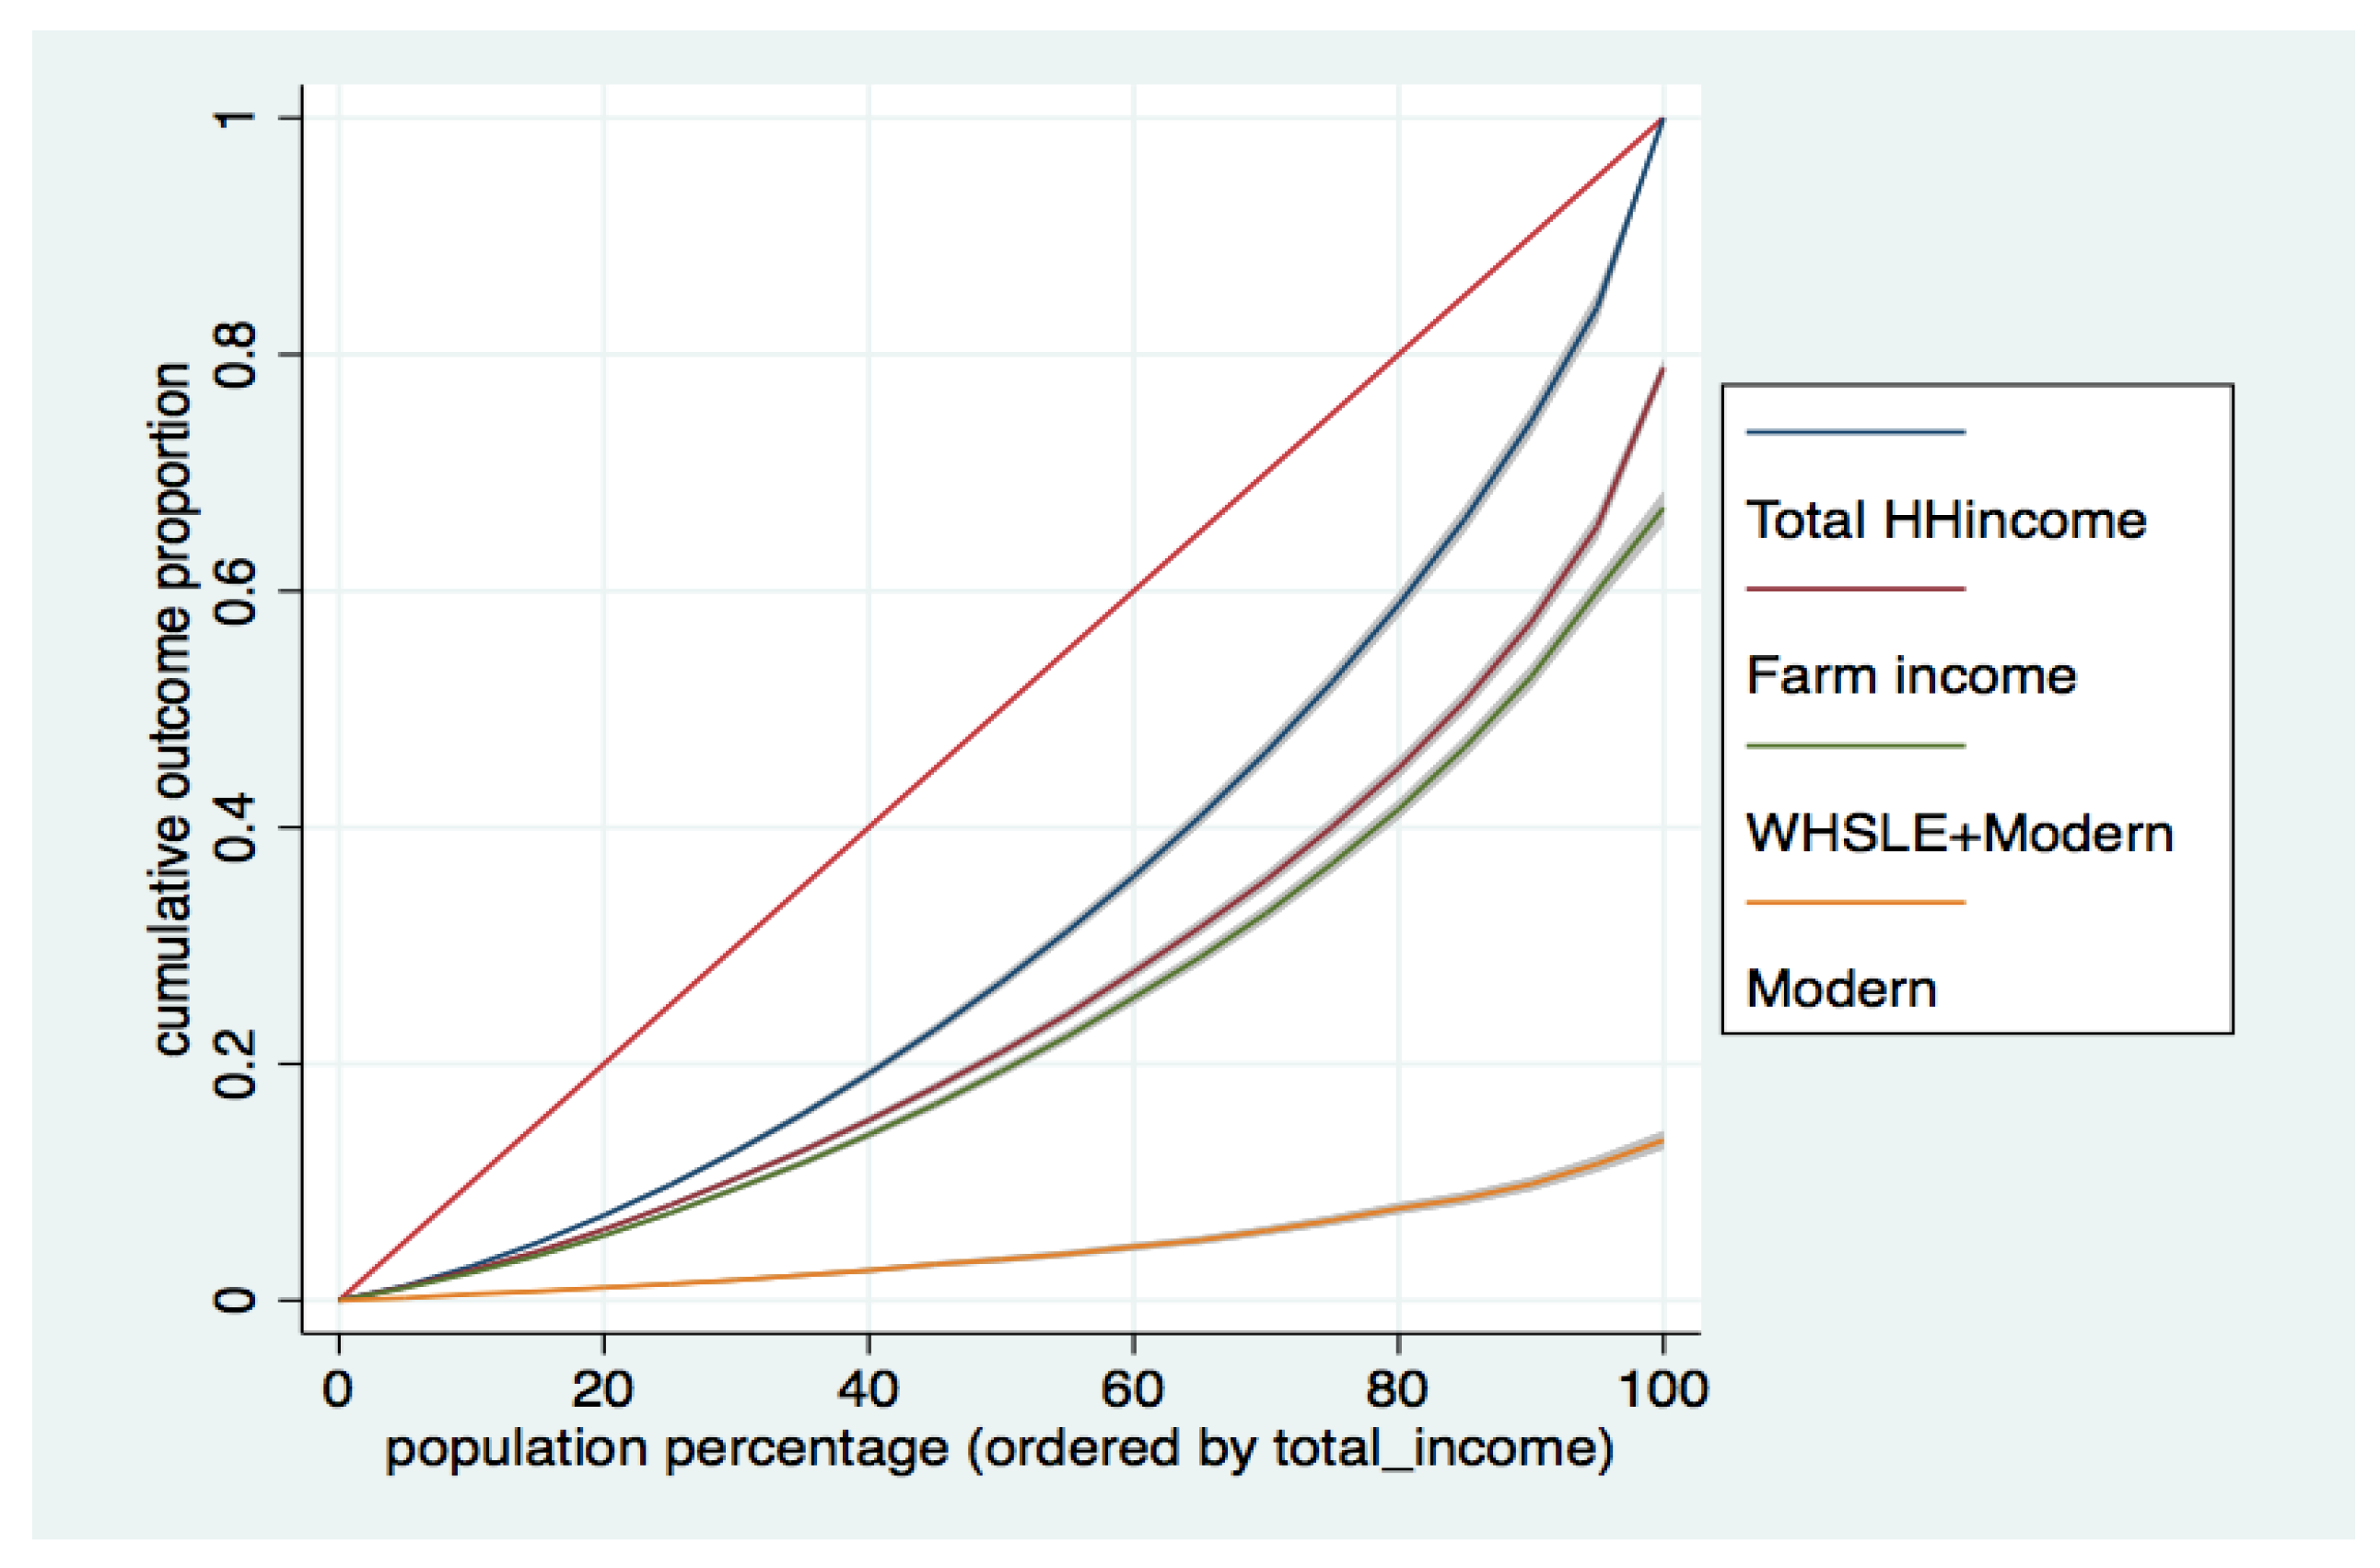
Lorenz curves (Figure 1) are used to further depict income inequality and redistribution among the farm households in Taiwan. In Figure 1, “Total HHincome” denotes total household income including farm income, transfer income, and non-farm income. “Farm income” includes income from processed commodities and fresh produce sold to food distributors.
Even though our analyses focus on farm households choosing modern or traditional channels as their major food distributors, as shown in Table 5, some of the farm households sell their farm produce to a combination of four channels: (1) traditional outlets (wholesalers and wholesale markets); (2) modern distributors (supermarkets/hypermarkets and processors); (3) direct sale to consumers; and (4) farmer organizations and government purchases. Therefore, we include sales to all four channels in constructing “Farm sale”. Additionally, “WHSLE + Modern” represents income from selling farm produce to wholesalers/wholesale markets and modern channels, and “Modern” represents income from selling to the midstream processors and downstream retailers (supermarkets, hypermarkets, and brand-named retailers).
According to Figure 1, at the 25th percentile of total household income, the cumulative income proportion is 1.394% and 7.391%, respectively, for “Modern” and “WHSLE + Modern”, indicating that sale to modern distributors (wholesalers and/or wholesale markets) by farm households at the bottom 25% takes up 1.394% (5.997%) of Taiwan’s total farm household income. On the other hand, at the 75th (100th) percentile of total household income, the cumulative income proportion is 6.783% (13.55%) and 36.962% (67.023%), respectively, for “Modern” and “WHSLE + Modern”. These Lorenz estimates reveal that sale to modern distributors and wholesalers and wholesale markets by farm households at the top 25% takes up, respectively, 6.769% and 23.292%, of Taiwan’s total farm household income. Moreover, based on the Lorenz curve of “Farm income”, around 50% of the farm income is contributed by farm households at the top 25% of the total household income distribution.
The results obtained from the Gini decomposition (Table 4) indicate that the source of interest, farm sale or unprocessed income, is the primary source accounting for 69.60% of the total farm household income. Decomposition corrected for endogeneity indicates that farm sale income is positively correlated with total income (Gini correlation = 0.529) and relatively equally distributed (Gini = 0.164) compared to other income sources.
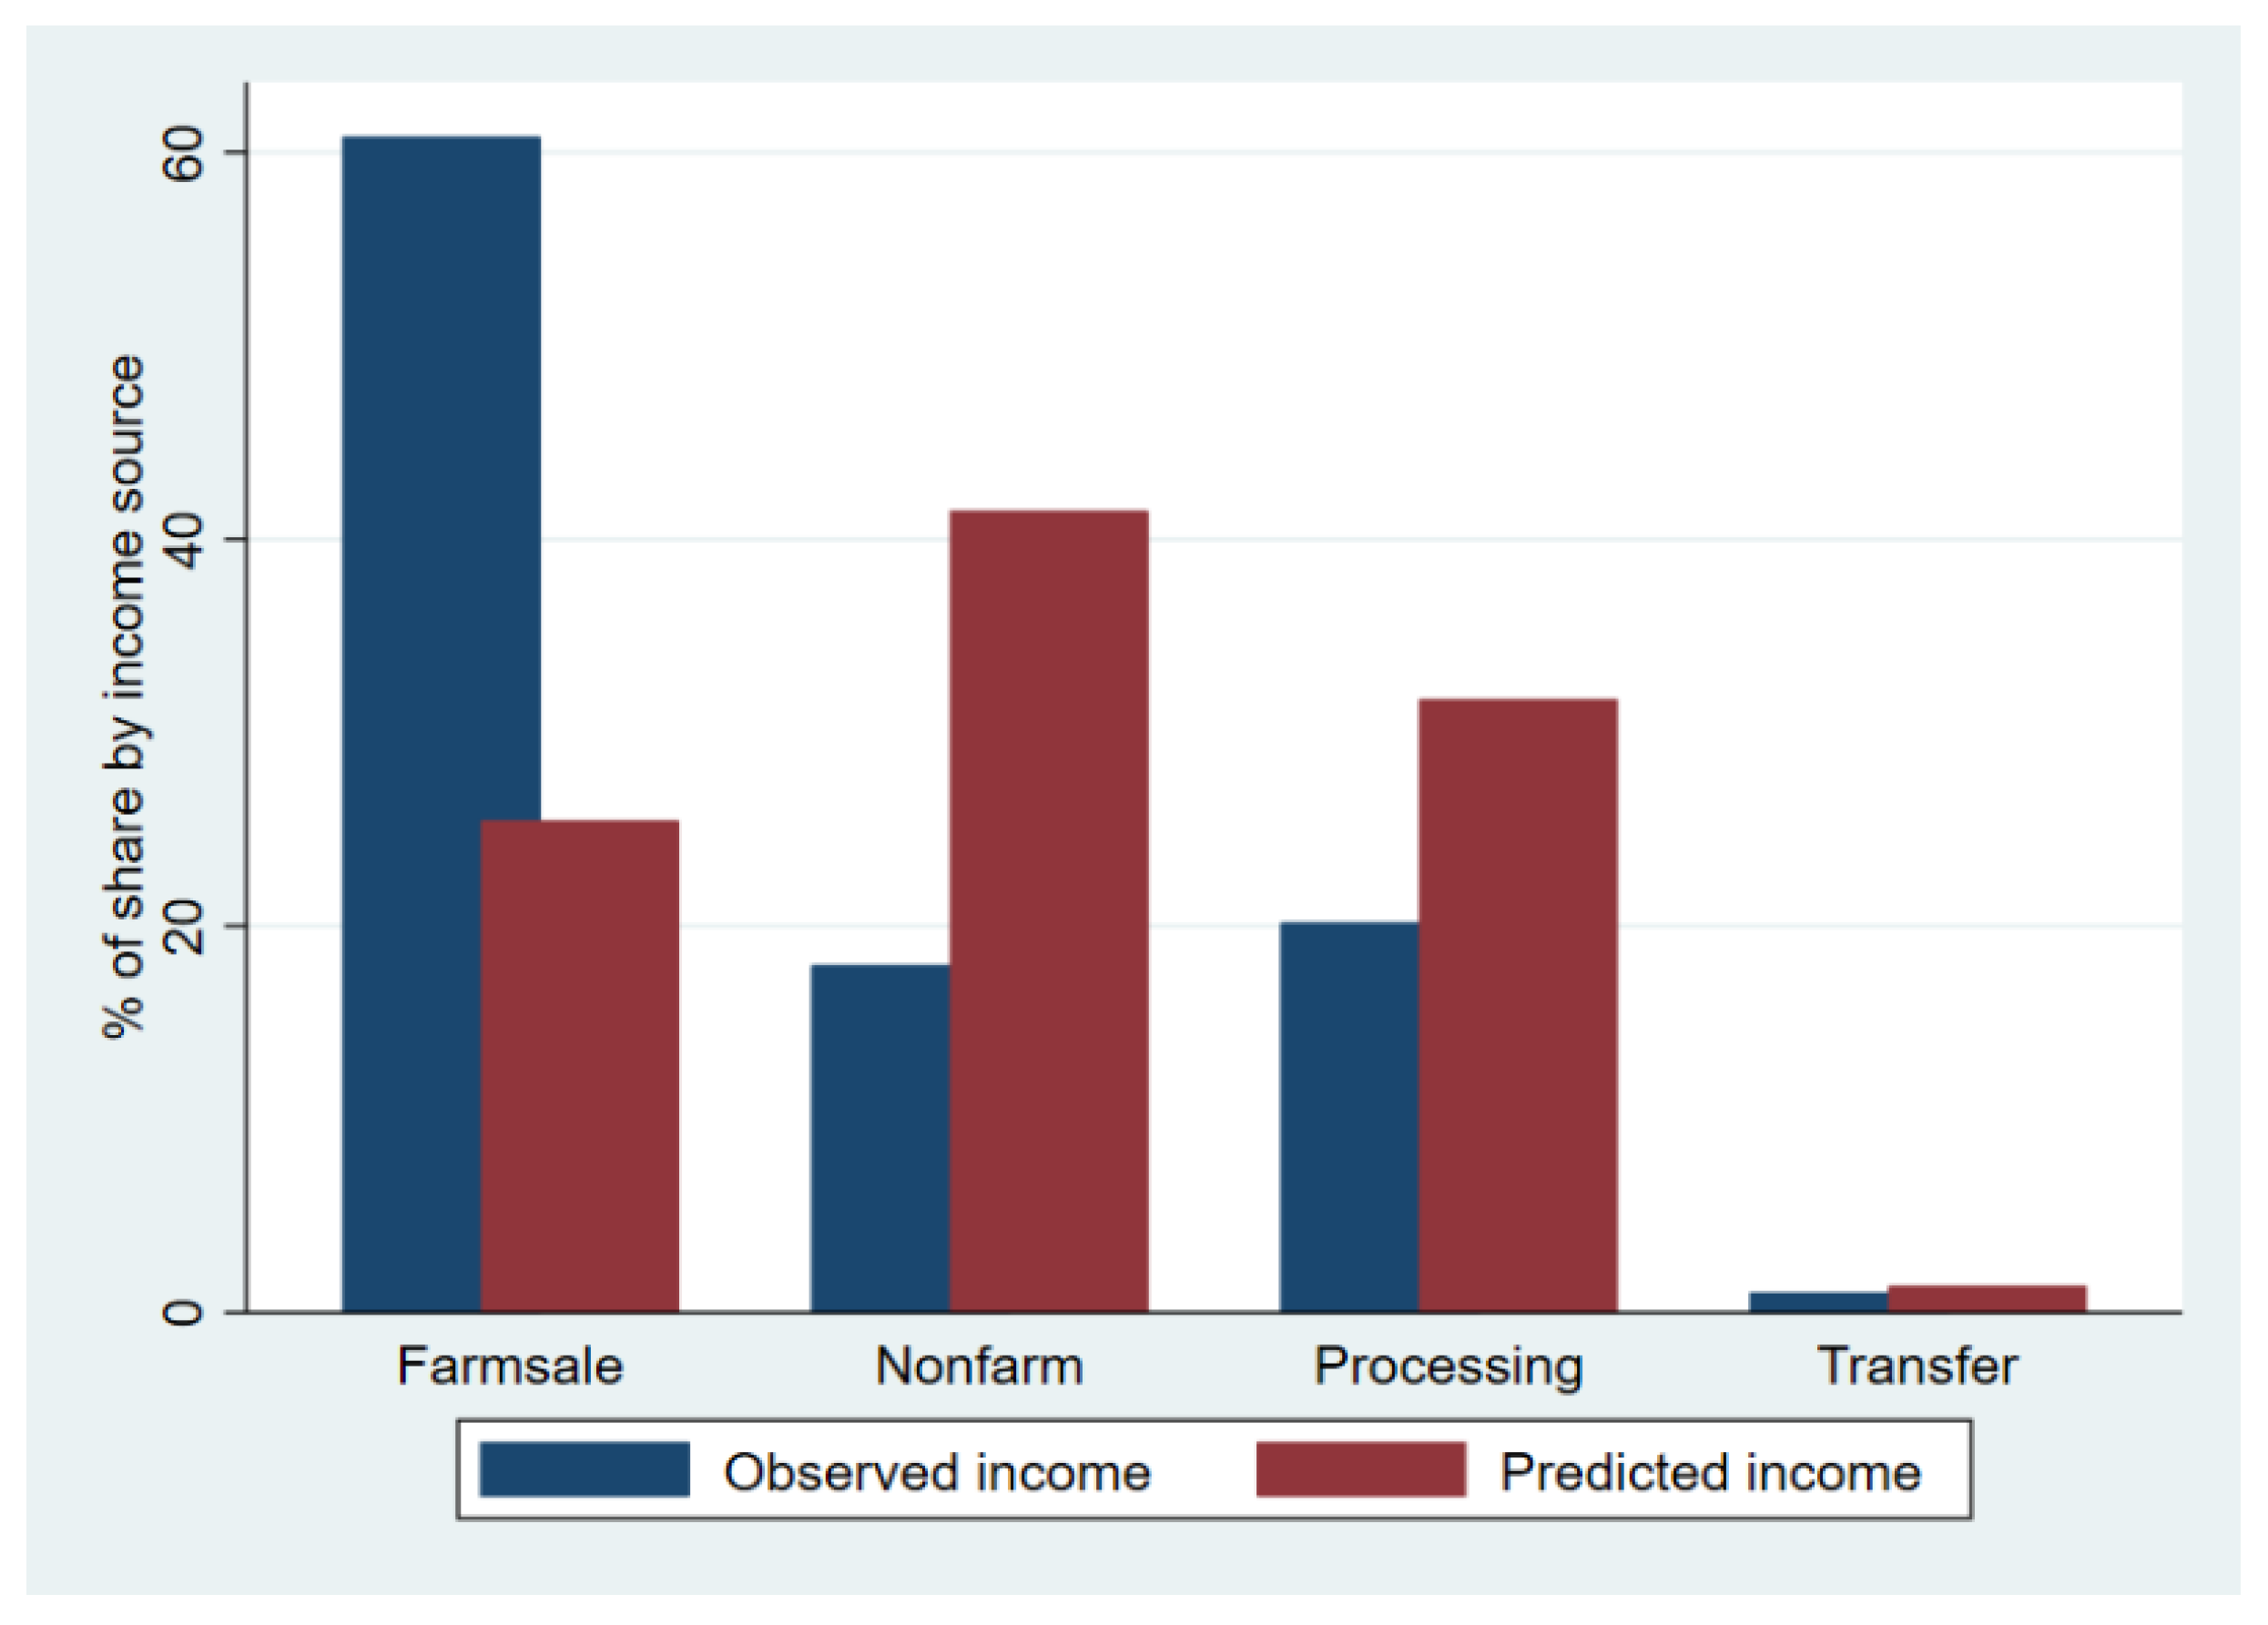
A comparison of the original contribution of each income source to income inequality, for both observed income and endogeneity-corrected income, is portrayed in Figure 2. Figure 2 reveals a less dominant contribution of fresh produce sale to farm household income inequality once the endogeneity is taken into account. While the contribution of sale to distributors contributed to income inequality at 60.8% before correction, the contribution reduced to 25.44% when the endogeneity of the choice of distribution channel was controlled for.
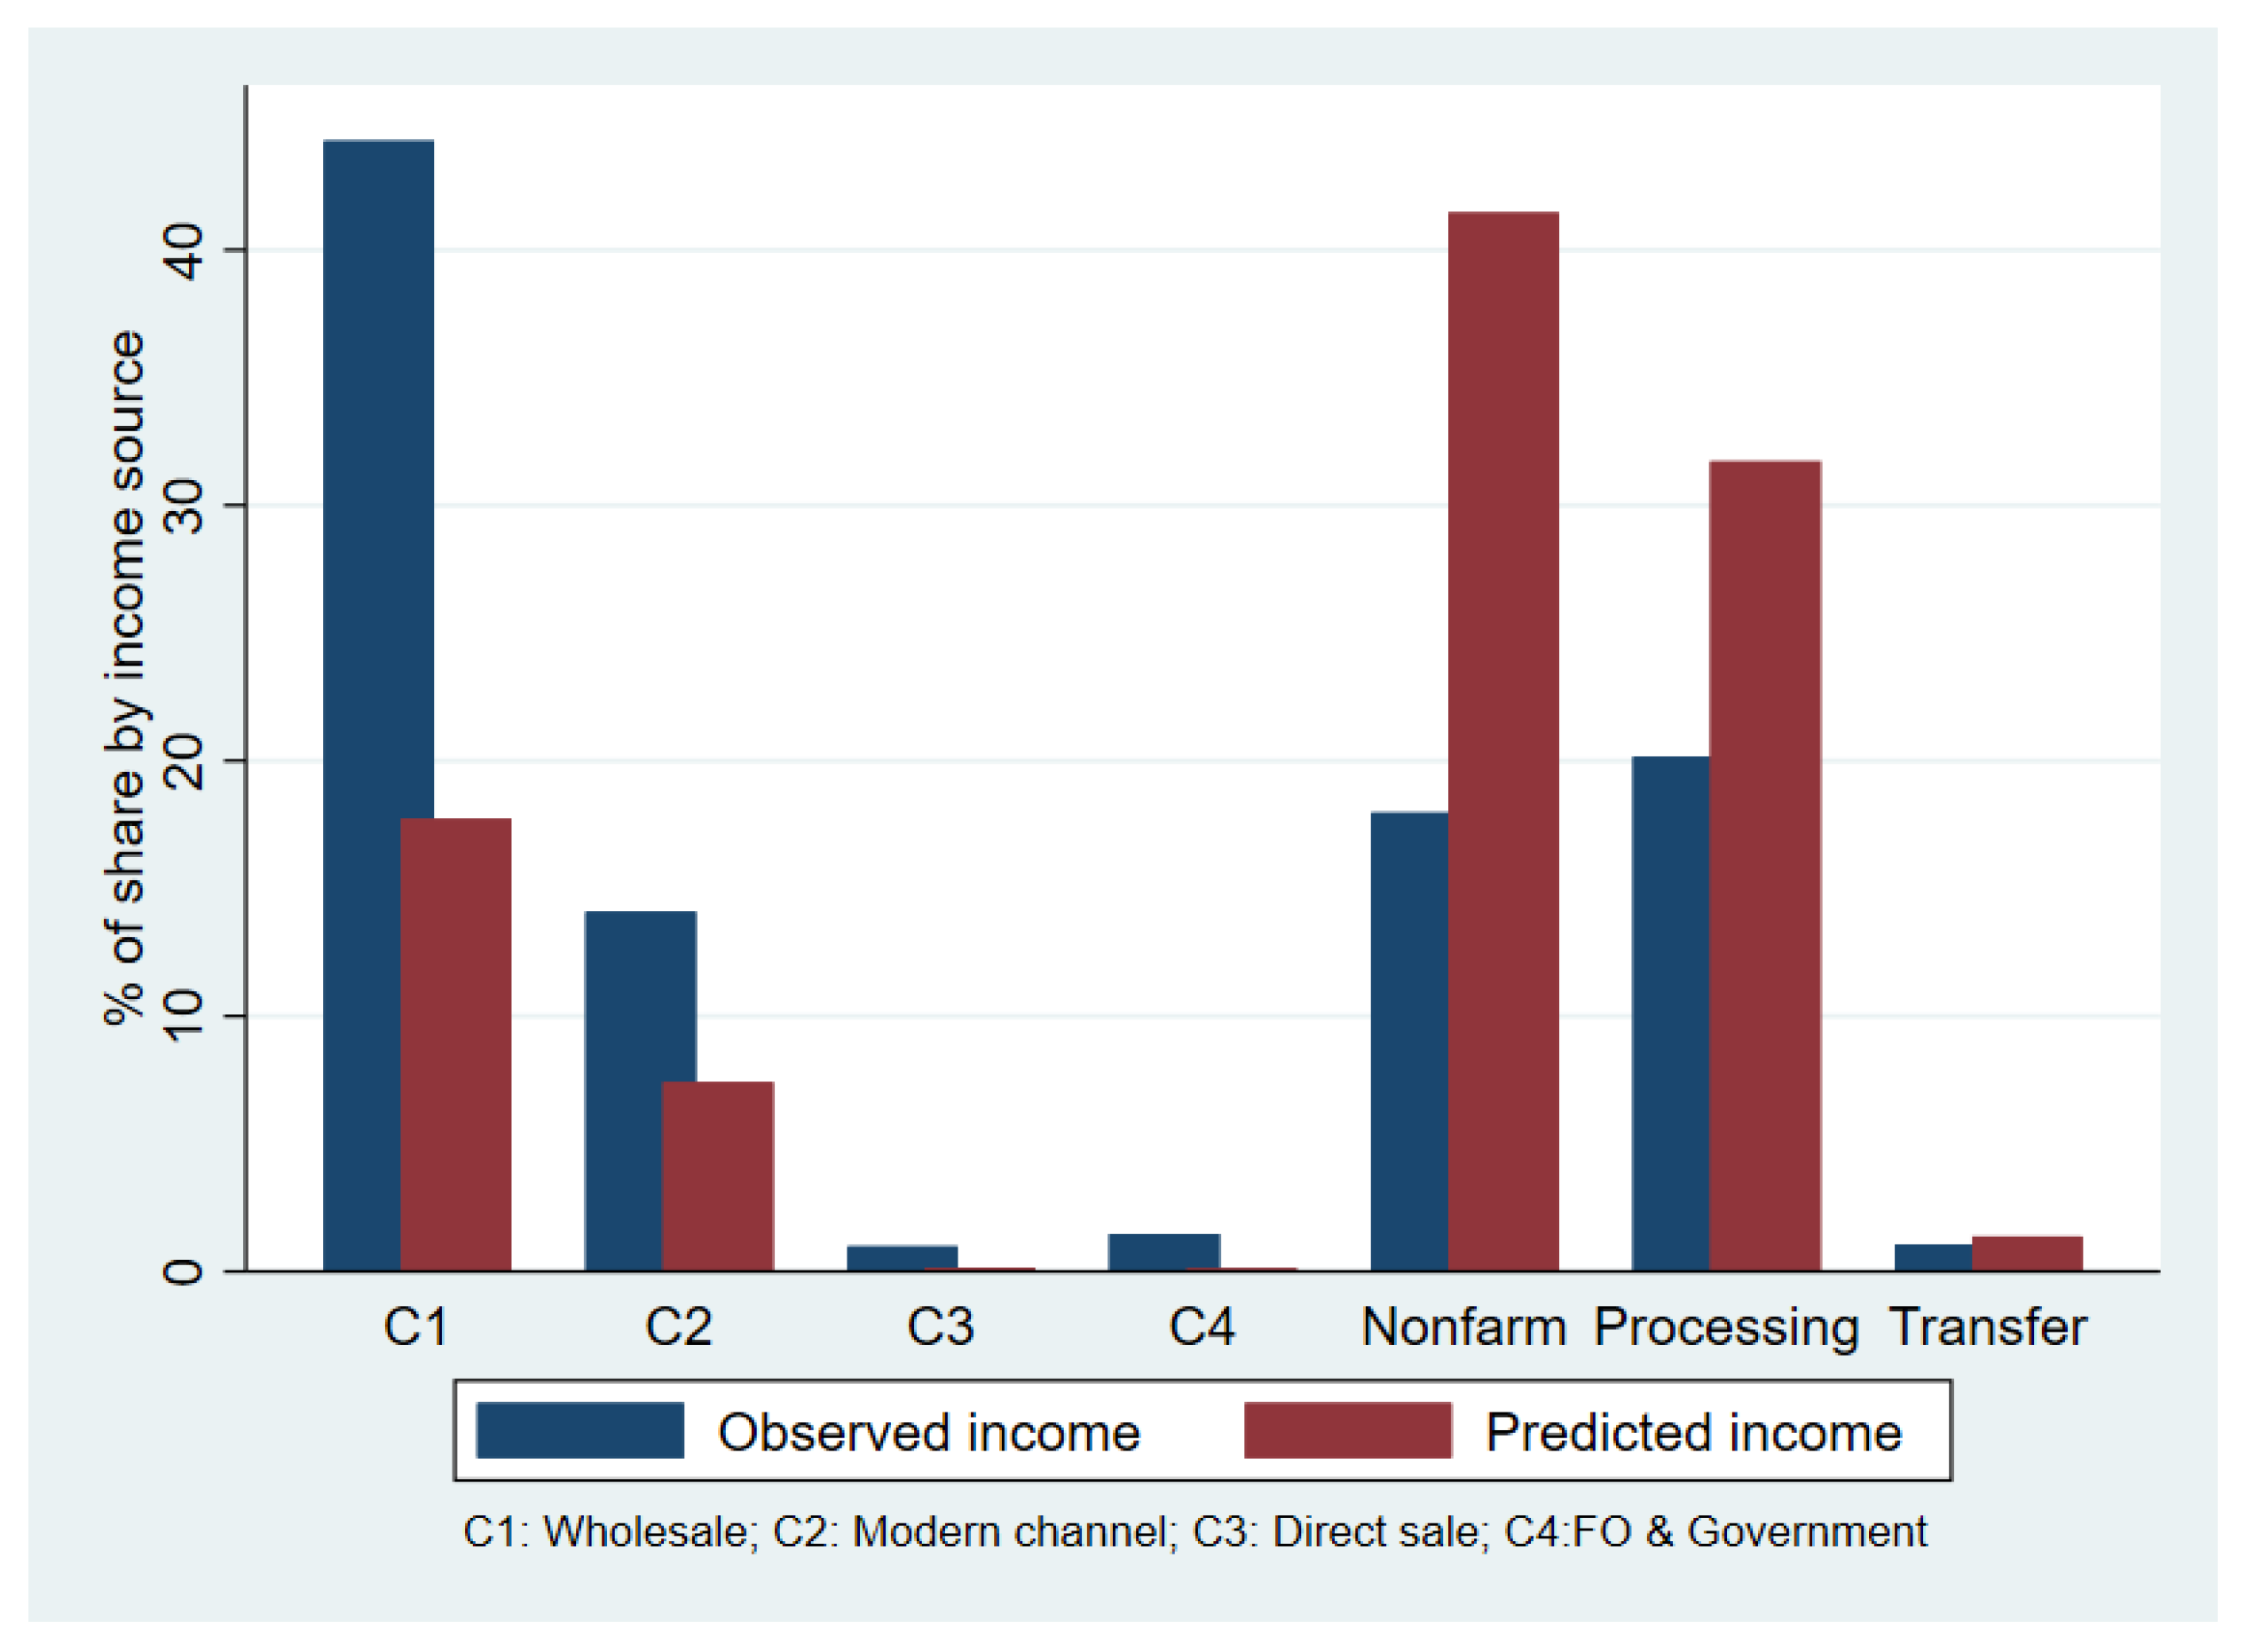
The detailed decomposition of the contribution of unprocessed farm income (Figure 3) is based on selling farm produce to four distribution channels: (1) wholesalers and wholesale markets; (2) supermarkets/hypermarkets, processors, and other retailers; (3) direct sale to consumers; and (4) farmer organizations and government purchases. The result suggests a less sizable contribution of wholesalers and wholesale markets to household income inequality when the endogeneity problem was corrected.
While farm sale has a relatively mild effect on inequality reduction from the observed income, this income source has a much more sizable effect when endogeneity is taken into account, with a 1% change in farm sale income reducing the total income inequality by 44.2% (Table 4). Moreover, each distribution channel contributes to narrowing the income inequality of farm households. Among them, the effect is found to be more substantial for those relying mainly on wholesale or modern channels. A notable change in the marginal effect, either inequality-enlarging or equalizing, occurs in the income source of interest, the modern food distribution channel. The observed income inequality decomposition indicates a 0.5% increase in income inequality due to a 1% increase in selling farm produce to modern distributors. However, when the endogeneity problem is explicitly corrected, selling farm produce to modern distribution channels lowers the total income inequality by 7.4%, the size of which was preceded only by the wholesale channels. This study thereby provides empirical evidence in support of the welfare-improving feature of the modern food supply chain.
5. Conclusions
In light of the contention that participation in modern food marketing channels is a viable way of linking smallholders to the market and thus is capable of welfare improvement, this study examined the welfare effects of modern food distribution channels including midstream processors and downstream retailers such as supermarkets, hypermarkets, and brand-named retailers. Drawn for a population-based dataset in Taiwan, this study provides new insights into the effects of modern marketing channels on farm households’ profitability and income inequality while accounting for the potential endogeneity issue on the channel options.
Using the two-step control function approach, this study finds that the modern marketing channel choice does not produce a positive gross or net return differential compared to the traditional outlets. In addition, empirical evidence from the Gini coefficient decomposition indicates that the choice of modern food distribution channels results in an inequality-equalizing effect among the farm households in Taiwan. A less sizable contribution of sales to modern outlets to household income inequality is found when the endogeneity problem was corrected. This finding concurs with our contention that the choice of modern food distribution channels results in welfare improvement in the rural society.
The findings reported here shed new light on two current agricultural policy issues. First, to improve the welfare of smallholder farmers, policies encouraging the adoption of remunerative production and marketing strategies deserve further evaluation. This is because a majority of farm households in Taiwan rely primarily on wholesalers, wholesale markets, and modern channels regardless of the government’s effort in promoting direct sales to consumers in recent years. Second, the positive effect of farm size on the probability of participation in modern marketing channels suggests that farm households endowed with more production resources tend to self-select into adopting the modern food distribution channels. Therefore, to enhance the modern food supply chain’s inclusiveness, a policy that provides low-interest financial loans to the disadvantaged farm households lacking production resources is needed.
One of the major limitations of the present study is its failing to take into account farm households’ production or marketing strategies that may be influential on their welfare, in addition to the choice of major food distribution outlets. Some previous research emphasized the significance of specialization, as opposed to diversification, in determining farm profitability, for example, [47,48,49]. Integrating the production specialization or diversification strategies smallholders may take is a promising avenue for future research.
Author Contributions
Conceptualization, Y.-H.L.; methodology, Y.-H.L.; software, Y.-C.C. and Y.-H.L.; validation, Y.-H.L.; formal analysis, Y.-H.L. and Y.-C.C.; investigation, Y.-H.L.; resources, Y.-H.L.; data curation, Y.-C.C. and Y.-H.L.; writing—original draft preparation, Y.-C.C., M.-F.W., and Y.-H.L.; writing—review and editing, M.-F.W. and Y.-H.L.; visualization, Y.-C.C. and Y.-H.L.; supervision, Y.-H.L.; project administration, Y.-H.L.; funding acquisition, Y.-H.L. All authors have read and agreed to the published version of the manuscript.
Funding
Part of this research was funded by the Ministry of Technology and Science (MOST) in Taiwan, grant number: MOST-106-2410-H-002-018.
Data Availability Statement
The data used in this study are available from the Survey Research Data Archive, Center for Survey Research, Academia Sinica, through application.
Conflicts of Interest
The authors declare no conflict of interest.
References
- Jhamb, D.; Kiran, R. Emerging trends of organized retailing in India: A shared vision of consumers and retailers perspective. Middle East J. Sci. Res. 2012, 11, 481–490. [Google Scholar]
- Rao, E.J.; Qaim, M. Supermarkets, farm household income, and poverty: Insights from Kenya. World Dev. 2011, 39, 784–796. [Google Scholar] [CrossRef]
- Reardon, T.; Timmer, C.P.; Minten, B. Supermarket revolution in Asia and emerging development strategies to include small farmers. Proc. Natl. Acad. Sci. USA 2012, 109, 12332–12337. [Google Scholar] [CrossRef] [PubMed] [Green Version]
- Sahara, S.; Minot, N.; Stringer, R.; Umberger, W.J. Determinants and effects of small chilli farmers’ participation in supermarket channels in Indonesia. Bull. Indones. Econ. Stud. 2015, 51, 445–460. [Google Scholar] [CrossRef]
- Zhang, M.; Kagatsume, M.; Yu, J. Market channel choice and its impact on farm household income: A case study of 243 apple farmers in Shaanxi province, China. Jpn. Agric. Res. Q. 2014, 48, 433–441. [Google Scholar] [CrossRef] [Green Version]
- Aparna, B.; Hanumanthaiah, C.V. Organised retailing of vegetables: A farmer, retailer and consumer perspective in India. Am.-Eurasian J. Agric. Environ. Sci. 2013, 13, 1258–1265. [Google Scholar]
- Neven, D.; Odera, M.M.; Reardon, T.; Wang, H. Kenyan supermarkets, emerging middle-class horticultural farmers, and employment impacts on the rural poor. World Dev. 2009, 37, 1802–1811. [Google Scholar] [CrossRef]
- Kanetkar, M. A Study of Impact and Effects on Consumers of Organized Retailing in India. In Proceedings of the International Conference on Social Science Research, ICSSR (e-ISBN 978-967-11768-1-8), Penang, Malaysia, 4–5 June 2013. [Google Scholar]
- Hernández, R.; Reardon, T.; Berdegué, J. Supermarkets, wholesalers, and tomato growers in Guatemala. Agric. Econ. 2007, 36, 281–290. [Google Scholar] [CrossRef]
- Mensah-Bonsu, A.; Owusu, C.; Amegashie, D.P.; Kuwornu, J.K. Determinants of marketing channel choice among smallholder beef cattle farmers in Ghana’s forest-savannah transitional zone. Int. J. Value Chain Manag. 2019, 10, 238–257. [Google Scholar]
- Plakias, Z.T.; Demko, I.; Katchova, A.L. Direct marketing channel choices among US farmers: Evidence from the Local Food Marketing Practices Survey. Renew. Agric. Food Syst. 2020, 35, 475–489. [Google Scholar] [CrossRef] [Green Version]
- Andriyanty, R.; Humaira, L. The analysis of mangosteen West Java farmer marketing channel. In Proceedings of the 6th International Symposium for Sustainable Humanosphere, Bogor, Indonesia, 15–16 November 2016. [Google Scholar]
- Donkor, E.; Onakuse, S.; Bogue, J.; de los Ríos Carmenado, I. Determinants of farmer participation in direct marketing channels: A case study for cassava in the Oyo State of Nigeria. Span. J. Agric. Res. 2018, 16, e0106. [Google Scholar] [CrossRef]
- Schipmann, C.; Qaim, M. Supply chain differentiation, contract agriculture, and farmers’ marketing preferences: The case of sweet pepper in Thailand. Food Policy 2011, 36, 667–677. [Google Scholar] [CrossRef]
- Liao, P.-A.; Chang, H.-H.; He, J.; Saeliw, K. Diversification of marketing strategies among small farms: Empirical evidence from family farms in Taiwan. Agric. Econ. 2017, 63, 493–501. [Google Scholar]
- Donkor, E.A.; Garnevska, E.; Siddique, M.I.; Donkor, E. Determinants of Rice Farmer Participation in the Direct Marketing Channel in Ghana. Sustainability 2021, 13, 5047. [Google Scholar] [CrossRef]
- Mgale, Y.J.; Yunxian, Y. Marketing efficiency and determinants of marketing channel choice by rice farmers in rural Tanzania: Evidence from Mbeya region, Tanzania. Aust. J. Agric. Econ. 2020, 64, 1239–1259. [Google Scholar] [CrossRef]
- Minot, N.; Roy, D. Impact of High-Value Agriculture and Modern Marketing Channels on Poverty: An Analytical Framework; International Food Policy Research Institute: Washington, DC, USA, 2007. [Google Scholar]
- Geng, X. Chinese aquatic farmers’ participation in modern marketing channels. Br. Food J. 2014, 116, 780–791. [Google Scholar] [CrossRef]
- Luh, Y.-H. Inclusiveness of contract farming along the modern food supply chain: Empirical evidence from Taiwan. Agriculture 2020, 10, 187. [Google Scholar] [CrossRef]
- Maertens, M.; Minten, B.; Swinnen, J. Modern food supply chains and development: Evidence from horticulture export sectors in sub-Saharan Africa. Dev. Policy Rev. 2012, 30, 473–497. [Google Scholar] [CrossRef]
- Slamet, A.S.; Nakayasu, A.; Ichikawa, M. Small-scale vegetable farmers’ participation in modern retail market channels in Indonesia: The determinants of and effects on their income. Agriculture 2017, 7, 11. [Google Scholar] [CrossRef] [Green Version]
- Jia, X.; Huang, J. Contractual arrangements between farmer cooperatives and buyers in China. Food Policy 2011, 36, 656–666. [Google Scholar] [CrossRef]
- Kumar, A.; Staal, S.J.; Singh, D.K. Smallholder dairy farmers’ access to modern milk marketing chains in India. Agric. Econ. Res. Rev. 2011, 24, 243–254. [Google Scholar]
- Naseer, M.-A.-u.-R.; Mehdi, M.; Ashfaq, M.; Hassan, S.; Abid, M. Effect of marketing channel choice on the profitability of citrus farmers: Evidence form Punjab-Pakistan. Pak. J. Agric. Sci. 2019, 56, 1003–1011. [Google Scholar]
- Mmbando, F.E.; Wale, E.Z.; Baiyegunhi, L.J. The welfare impacts of market channel choice by smallholder farmers in Tanzania. Dev. Pract. 2017, 27, 981–993. [Google Scholar] [CrossRef]
- Ogutu, S.O.; Ochieng, D.O.; Qaim, M. Supermarket contracts and smallholder farmers: Implications for income and multidimensional poverty. Food Policy 2020, 95, 101940. [Google Scholar] [CrossRef]
- Montalbano, P.; Pietrelli, R.; Salvatici, L. Participation in the market chain and food security: The case of the Ugandan maize farmers. Food Policy 2018, 76, 81–98. [Google Scholar] [CrossRef]
- Wooldridge, J.M. Econometric Analysis of Cross Section and Panel Data; MIT Press: Cambridge, MA, USA, 2010. [Google Scholar]
- Lerman, R.I.; Yitzhaki, S. Income inequality effects by income source: A new approach and applications to the United States. Rev. Econ. Stat. 1985, 67, 151–156. [Google Scholar] [CrossRef]
- Hailu, C.; Fana, C. Determinants of Market Outlet Choice for Major Vegetables Crop: Evidence from Smallholder Farmers’ of Ambo and Toke-Kutaye Districts, West Shewa, Ethiopia. Int. J. Agric. Mark. 2017, 4, 161–169. [Google Scholar]
- Zhang, B.; Fu, Z.; Wang, J.; Tang, X.; Zhao, Y.; Zhang, L. Effect of householder characteristics, production, sales and safety awareness on farmers’ choice of vegetable marketing channels in Beijing, China. Br. Food J. 2017, 119, 1216–1231. [Google Scholar] [CrossRef]
- Tura, E.G.; Hamo, T.K. Determinants of tomato smallholder farmers market outlet choices in West Shewa, Ethiopia. J. Agric. Ext. Rural Dev. 2018, 4, 454–460. [Google Scholar]
- Olwande, J.; Smale, M.; Mathenge, M.K.; Place, F.; Mithöfer, D. Agricultural marketing by smallholders in Kenya: A comparison of maize, kale and dairy. Food Policy 2015, 52, 22–32. [Google Scholar] [CrossRef]
- Teng, P.S.; Oliveros, J.A. The enabling environment for inclusive agribusiness in Southeast Asia. Asian J. Agric. Dev. 2016, 13, 1–20. [Google Scholar]
- Altenburg, T.; Kulke, E.; Reeg, C.; Peterskovsky, L.; Hampel-Milagrosa, A. Making Retail Modernisation in Developing Countries Inclusive: A Development Policy Perspective; Discussion Paper; German Development Institute: Bonn, Germany, 2016. [Google Scholar]
- Francesconi, G.N.; Heerink, N.; D’Haese, M. Evolution and challenges of dairy supply chains: Evidence from supermarkets, industries and consumers in Ethiopia. Food Policy 2010, 35, 60–68. [Google Scholar] [CrossRef]
- Byeong-il, A.; Lee, H. Vertical price transmission of perishable products: The case of fresh fruits in the Western United States. J. Agric. Resour. Econ. 2015, 40, 1–20. [Google Scholar]
- Kanani, R.; Buvik, A. The effects of the degree of produce perishability and the choice of procurement channel on supplier opportunism: Empirical evidence from the food processing industry. Int. J. Procure. Manag. 2018, 11, 113–133. [Google Scholar] [CrossRef]
- Behan, J.; Carroll, J.; Hennessy, T.; Keeney, M.; Newman, C.; O’Brien, M.; Thorne, F. An Examination of the Contribution of off-Farm Income to the Viability and Sustainability of Farm Households and the Productivity of Farm Businesses; Teagasc: Carlow, Ireland, 2007. [Google Scholar]
- Reganold, J.P.; Papendick, R.I.; Parr, J.F. Sustainable agriculture. Sci. Am. 1990, 262, 112–121. [Google Scholar] [CrossRef] [Green Version]
- Dlamini-Mazibuko, B.P. Economic Analysis of Supermarkets as a Marketing Channel Choice for Fresh Produce Smallholder Farmers in Eswatini; University of KwaZulu-Natal: Pietermaritzburg, South Africa, 2020. [Google Scholar]
- Birthal, P.S.; Chand, R.; Joshi, P.K.; Saxena, R.; Rajkhowa, P.; Khan, M.T.; Khan, M.A.; Chaudhary, K.R. Formal versus informal: Efficiency, inclusiveness and financing of dairy value chains in Indian Punjab. J. Rural Stud. 2017, 54, 288–303. [Google Scholar] [CrossRef]
- Ragasa, C.; Lambrecht, I.; Kufoalor, D.S. Limitations of contract farming as a pro-poor strategy: The case of maize outgrower schemes in Upper West Ghana. World Dev. 2018, 102, 30–56. [Google Scholar] [CrossRef]
- De Salvo, M.; Begalli, D.; Capitello, R.; Agnoli, L.; Tabouratzi, E. Determinants of winegrowers’ profitability: Evidence from an Eastern Europe wine region. EuroMed J. Bus. 2017. [Google Scholar] [CrossRef]
- Gołaś, Z. Determinants of milk production profitability of dairy farms in the EU member states. Probl. Agric. Econ. 2017, 3, 19–40. [Google Scholar] [CrossRef] [Green Version]
- Nehring, R.; Gillespie, J.; Katchova, A.L.; Hallahan, C.; Harris, J.M.; Erickson, K. What’s Driving US Broiler Farm Profitability? Int. Food Agribusiness Manag. Rev. 2015, 18, 59–78. [Google Scholar]
- Palash, M.S.; Bauer, S. Diversification of farmland use in Bangladesh: Land allocation impacts on farm profitability. Open Agric. 2017, 2, 175–188. [Google Scholar] [CrossRef] [Green Version]
- Kryszak, Ł.; Guth, M.; Czyżewski, B. Determinants of farm profitability in the EU regions. Does farm size matter? Agric. Econ. 2021, 67, 90–100. [Google Scholar]
Figure 1.
Lorenz curve.

Figure 2.
Original contribution of each source to income inequality.

Figure 3.
Detailed decomposition of each income source to inequality.


Table 1.
Variable definition and summary statistics.
| Variable | Definition | Full Sample | Traditional | Modern | |||
|---|---|---|---|---|---|---|---|
| (n = 7076) | (n = 5330) | (n = 1746) | |||||
| Mean | Std. Dev. | Mean | Std. Dev. | Mean | Std. Dev. | ||
| Farm income | Unprocessed income | 711.862 | 507.998 | 755.793 | 492.327 | 577.754 | 531.217 |
| Profit | Farm income minus costs | 407.085 | 288.018 | 441.33 | 282.57 | 302.544 | 279.248 |
| Modern | 1 if modern channel | 0.247 | 0.431 | 0 | 0 | 1 | 0 |
| Age | Farm operator’s age | 57.446 | 10.874 | 57.375 | 10.912 | 57.661 | 10.757 |
| Male | 1 if male farm operator | 0.889 | 0.314 | 0.885 | 0.319 | 0.904 | 0.295 |
| Elementary | 1 if elementary school | 0.385 | 0.487 | 0.38 | 0.485 | 0.4 | 0.49 |
| Junior | 1 if junior high school | 0.283 | 0.45 | 0.285 | 0.451 | 0.277 | 0.448 |
| Senior | 1 if senior high school | 0.277 | 0.448 | 0.283 | 0.45 | 0.261 | 0.439 |
| University | 1 if college degree | 0.055 | 0.227 | 0.053 | 0.223 | 0.061 | 0.24 |
| Experience | Years of farming experience | 29.342 | 14.657 | 28.951 | 14.651 | 30.536 | 14.616 |
| Unemployed | 1 if not employed before entry | 0.466 | 0.499 | 0.464 | 0.499 | 0.47 | 0.499 |
| Agriculture | 1 if agriculture worker before entry | 0.061 | 0.24 | 0.064 | 0.245 | 0.053 | 0.225 |
| Employee | 1 if employed before entry | 0.377 | 0.485 | 0.376 | 0.484 | 0.38 | 0.486 |
| Employer | 1 if self-employed before entry | 0.096 | 0.295 | 0.096 | 0.294 | 0.096 | 0.295 |
| Farmland | Farmland size (are) | 97.162 | 98.959 | 91.445 | 92.575 | 114.613 | 114.58 |
| Total labor | Family and hired labor | 2.559 | 1.148 | 2.548 | 1.123 | 2.592 | 1.22 |
| Livestock | 1 if livestock farm | 0.027 | 0.162 | 0.027 | 0.161 | 0.027 | 0.164 |
| Rice | 1 if rice income share is largest | 0.112 | 0.315 | 0.025 | 0.155 | 0.377 | 0.485 |
| Specialty | 1 if specialty income share is largest | 0.081 | 0.273 | 0.032 | 0.177 | 0.23 | 0.421 |
| Vegetable | 1 if vegetable income share is largest | 0.273 | 0.446 | 0.297 | 0.457 | 0.202 | 0.401 |
| Fruit | 1 if fruit income share is largest | 0.447 | 0.497 | 0.553 | 0.497 | 0.124 | 0.329 |
| Flower | 1 if flower income share is largest | 0.026 | 0.16 | 0.033 | 0.179 | 0.005 | 0.072 |
| Other crop | 1 if other crop income share is largest | 0.033 | 0.18 | 0.033 | 0.178 | 0.035 | 0.184 |
| Store | Supermarkets, hypermarkets, etc. | 23.496 | 10.771 | 22.858 | 9.848 | 25.445 | 13.007 |
Table 2.
Estimates of the probit model.
| Variable | Coefficients | Std. Err. | Marginal Effect | Std. Err. | ||
|---|---|---|---|---|---|---|
| Age | −0.009 | ** | 0.003 | −0.002 | ** | 0.001 |
| Male | −0.053 | 0.064 | −0.011 | 0.013 | ||
| Junior | 0.023 | 0.056 | 0.005 | 0.011 | ||
| Senior | 0.019 | 0.064 | 0.004 | 0.013 | ||
| University | 0.070 | 0.101 | 0.014 | 0.021 | ||
| Experience | 0.011 | ** | 0.003 | 0.002 | ** | 0.001 |
| Agriculture | 0.011 | 0.090 | 0.002 | 0.018 | ||
| Employee | 0.119 | * | 0.051 | 0.024 | * | 0.010 |
| Employer | 0.095 | 0.073 | 0.019 | 0.015 | ||
| Farmland | 0.001 | ** | 0.000 | 0.000 | ** | 0.000 |
| Total labor | 0.021 | 0.017 | 0.004 | 0.004 | ||
| Livestock | −0.016 | 0.134 | −0.003 | 0.027 | ||
| Rice | 1.656 | ** | 0.106 | 0.339 | ** | 0.021 |
| Specialty | 1.180 | ** | 0.104 | 0.241 | ** | 0.021 |
| Vegetable | −0.271 | ** | 0.095 | −0.055 | ** | 0.019 |
| Fruit | −0.830 | ** | 0.096 | −0.170 | ** | 0.020 |
| Flower | −1.036 | ** | 0.180 | −0.212 | ** | 0.037 |
| Store | 0.015 | ** | 0.002 | 0.003 | ** | 0.000 |
| _Cons | −1.000 | ** | 0.196 |
Note: * and ** denote significance at the 5% and 1% significance levels.
Table 3.
Two-step control function estimates.
| Variable | Model 1 (Profit) | Model 2 (Farm Income) | ||||
|---|---|---|---|---|---|---|
| Coefficients | Std. Err. | Coefficients | Std. Err. | |||
| Age | −3.524 | ** | 0.496 | −8.754 | ** | 0.891 |
| Male | 44.868 | ** | 9.375 | 76.545 | ** | 16.358 |
| Junior | 36.364 | ** | 8.996 | 58.421 | ** | 15.766 |
| Senior | 37.596 | ** | 10.321 | 42.192 | * | 17.901 |
| University | 4.299 | 16.627 | 1.922 | 30.235 | ||
| Experience | 1.727 | ** | 0.407 | 4.602 | ** | 0.724 |
| Agriculture | 12.243 | 13.309 | −22.920 | 21.917 | ||
| Employee | −27.101 | ** | 8.546 | −29.475 | 15.293 | |
| Employer | −21.215 | 12.565 | −49.319 | * | 21.832 | |
| Farmland | 0.672 | ** | 0.063 | 1.228 | ** | 0.109 |
| Total labor | 36.588 | ** | 4.126 | 67.609 | ** | 7.668 |
| Livestock | 57.326 | 32.247 | 375.326 | ** | 58.733 | |
| Rice | 81.693 | * | 38.892 | 369.684 | ** | 71.669 |
| Specialty | −108.040 | ** | 33.230 | −50.910 | 61.801 | |
| Vegetable | −51.024 | * | 21.688 | −103.684 | ** | 39.145 |
| Fruit | −84.782 | ** | 24.032 | −277.180 | ** | 43.302 |
| Flower | 59.750 | 31.925 | 47.987 | 58.164 | ||
| Modern | −411.251 | ** | 57.519 | −1035.472 | ** | 106.168 |
| Gen_Res | 188.603 | ** | 31.758 | 522.184 | ** | 57.937 |
| _Cons | 500.514 | ** | 36.250 | 1067.658 | ** | 64.258 |
Note: * and ** denote significance at the 5% and 1% significance levels.
Table 4.
Gini decomposition.
| Source | Gini Decomposition (Predicted Income) | Gini Decomposition (Observed Income) | ||||||||
|---|---|---|---|---|---|---|---|---|---|---|
| Sk | Gk | Rk | Share | % Change | Sk | Gk | Rk | Share | % Change | |
| Farm sale | 0.696 | 0.164 | 0.529 | 0.254 | −0.442 | 0.697 | 0.385 | 0.77 | 0.608 | −0.088 |
| Wholesale | 0.536 | 0.355 | 0.221 | 0.177 | −0.359 | 0.535 | 0.511 | 0.550 | 0.443 | −0.092 |
| Modern | 0.136 | 0.808 | 0.160 | 0.074 | −0.062 | 0.136 | 0.865 | 0.408 | 0.141 | 0.005 |
| Direct sales | 0.012 | 0.933 | 0.033 | 0.002 | −0.011 | 0.013 | 0.941 | 0.285 | 0.010 | −0.003 |
| FO and Govt | 0.012 | 0.950 | 0.028 | 0.001 | −0.011 | 0.014 | 0.959 | 0.380 | 0.015 | 0.001 |
| Process | 0.092 | 0.977 | 0.837 | 0.317 | 0.225 | 0.092 | 0.977 | 0.760 | 0.202 | 0.109 |
| Non-farm | 0.201 | 0.643 | 0.762 | 0.415 | 0.214 | 0.201 | 0.643 | 0.472 | 0.180 | −0.021 |
| Transfer | 0.011 | 0.909 | 0.344 | 0.014 | 0.003 | 0.011 | 0.909 | 0.380 | 0.011 | 0.000 |
| Total income | 0.238 | 0.339 | ||||||||
Note: Sk is “share in total income”; Gk is “Gini coefficient”; Rk represents “Gini correlation with total income”.
Table 5.
Share of each income source in total sales to food distributors.
| Sale Share | Full Sample (n = 7076) | Traditional (n = 5330) | Modern (n = 1746) | |||||||||
|---|---|---|---|---|---|---|---|---|---|---|---|---|
| Mean | Std. Dev. | Min | Max | Mean | Std. Dev. | Min | Max | Mean | Std. Dev. | Min | Max | |
| Wholesale | 0.725 | 0.42 | 0 | 1 | 0.96 | 0.097 | 0.51 | 1 | 0.008 | 0.049 | 0 | 0.43 |
| Modern | 0.24 | 0.411 | 0 | 1 | 0.008 | 0.041 | 0 | 0.46 | 0.949 | 0.114 | 0.51 | 1 |
| Consumer | 0.018 | 0.061 | 0 | 0.48 | 0.022 | 0.067 | 0 | 0.45 | 0.005 | 0.036 | 0 | 0.48 |
| FO and Govt | 0.018 | 0.071 | 0 | 0.49 | 0.011 | 0.055 | 0 | 0.48 | 0.038 | 0.101 | 0 | 0.49 |
Publisher’s Note: MDPI stays neutral with regard to jurisdictional claims in published maps and institutional affiliations. |
© 2021 by the authors. Licensee MDPI, Basel, Switzerland. This article is an open access article distributed under the terms and conditions of the Creative Commons Attribution (CC BY) license (https://creativecommons.org/licenses/by/4.0/).
Share and Cite
MDPI and ACS Style
Chang, Y.-C.; Wei, M.-F.; Luh, Y.-H. Choice of Modern Food Distribution Channels and Its Welfare Effects: Empirical Evidence from Taiwan. Agriculture 2021, 11, 499. https://0-doi-org.brum.beds.ac.uk/10.3390/agriculture11060499
AMA Style
Chang Y-C, Wei M-F, Luh Y-H. Choice of Modern Food Distribution Channels and Its Welfare Effects: Empirical Evidence from Taiwan. Agriculture. 2021; 11(6):499. https://0-doi-org.brum.beds.ac.uk/10.3390/agriculture11060499
Chicago/Turabian StyleChang, Yun-Cih, Min-Fang Wei, and Yir-Hueih Luh. 2021. "Choice of Modern Food Distribution Channels and Its Welfare Effects: Empirical Evidence from Taiwan" Agriculture 11, no. 6: 499. https://0-doi-org.brum.beds.ac.uk/10.3390/agriculture11060499
Note that from the first issue of 2016, this journal uses article numbers instead of page numbers. See further details here.