
Estimation of Frost Hazard for Tea Tree in Zhejiang Province Based on Machine Learning

Abstract
:1. Introduction
2. Materials and Methods
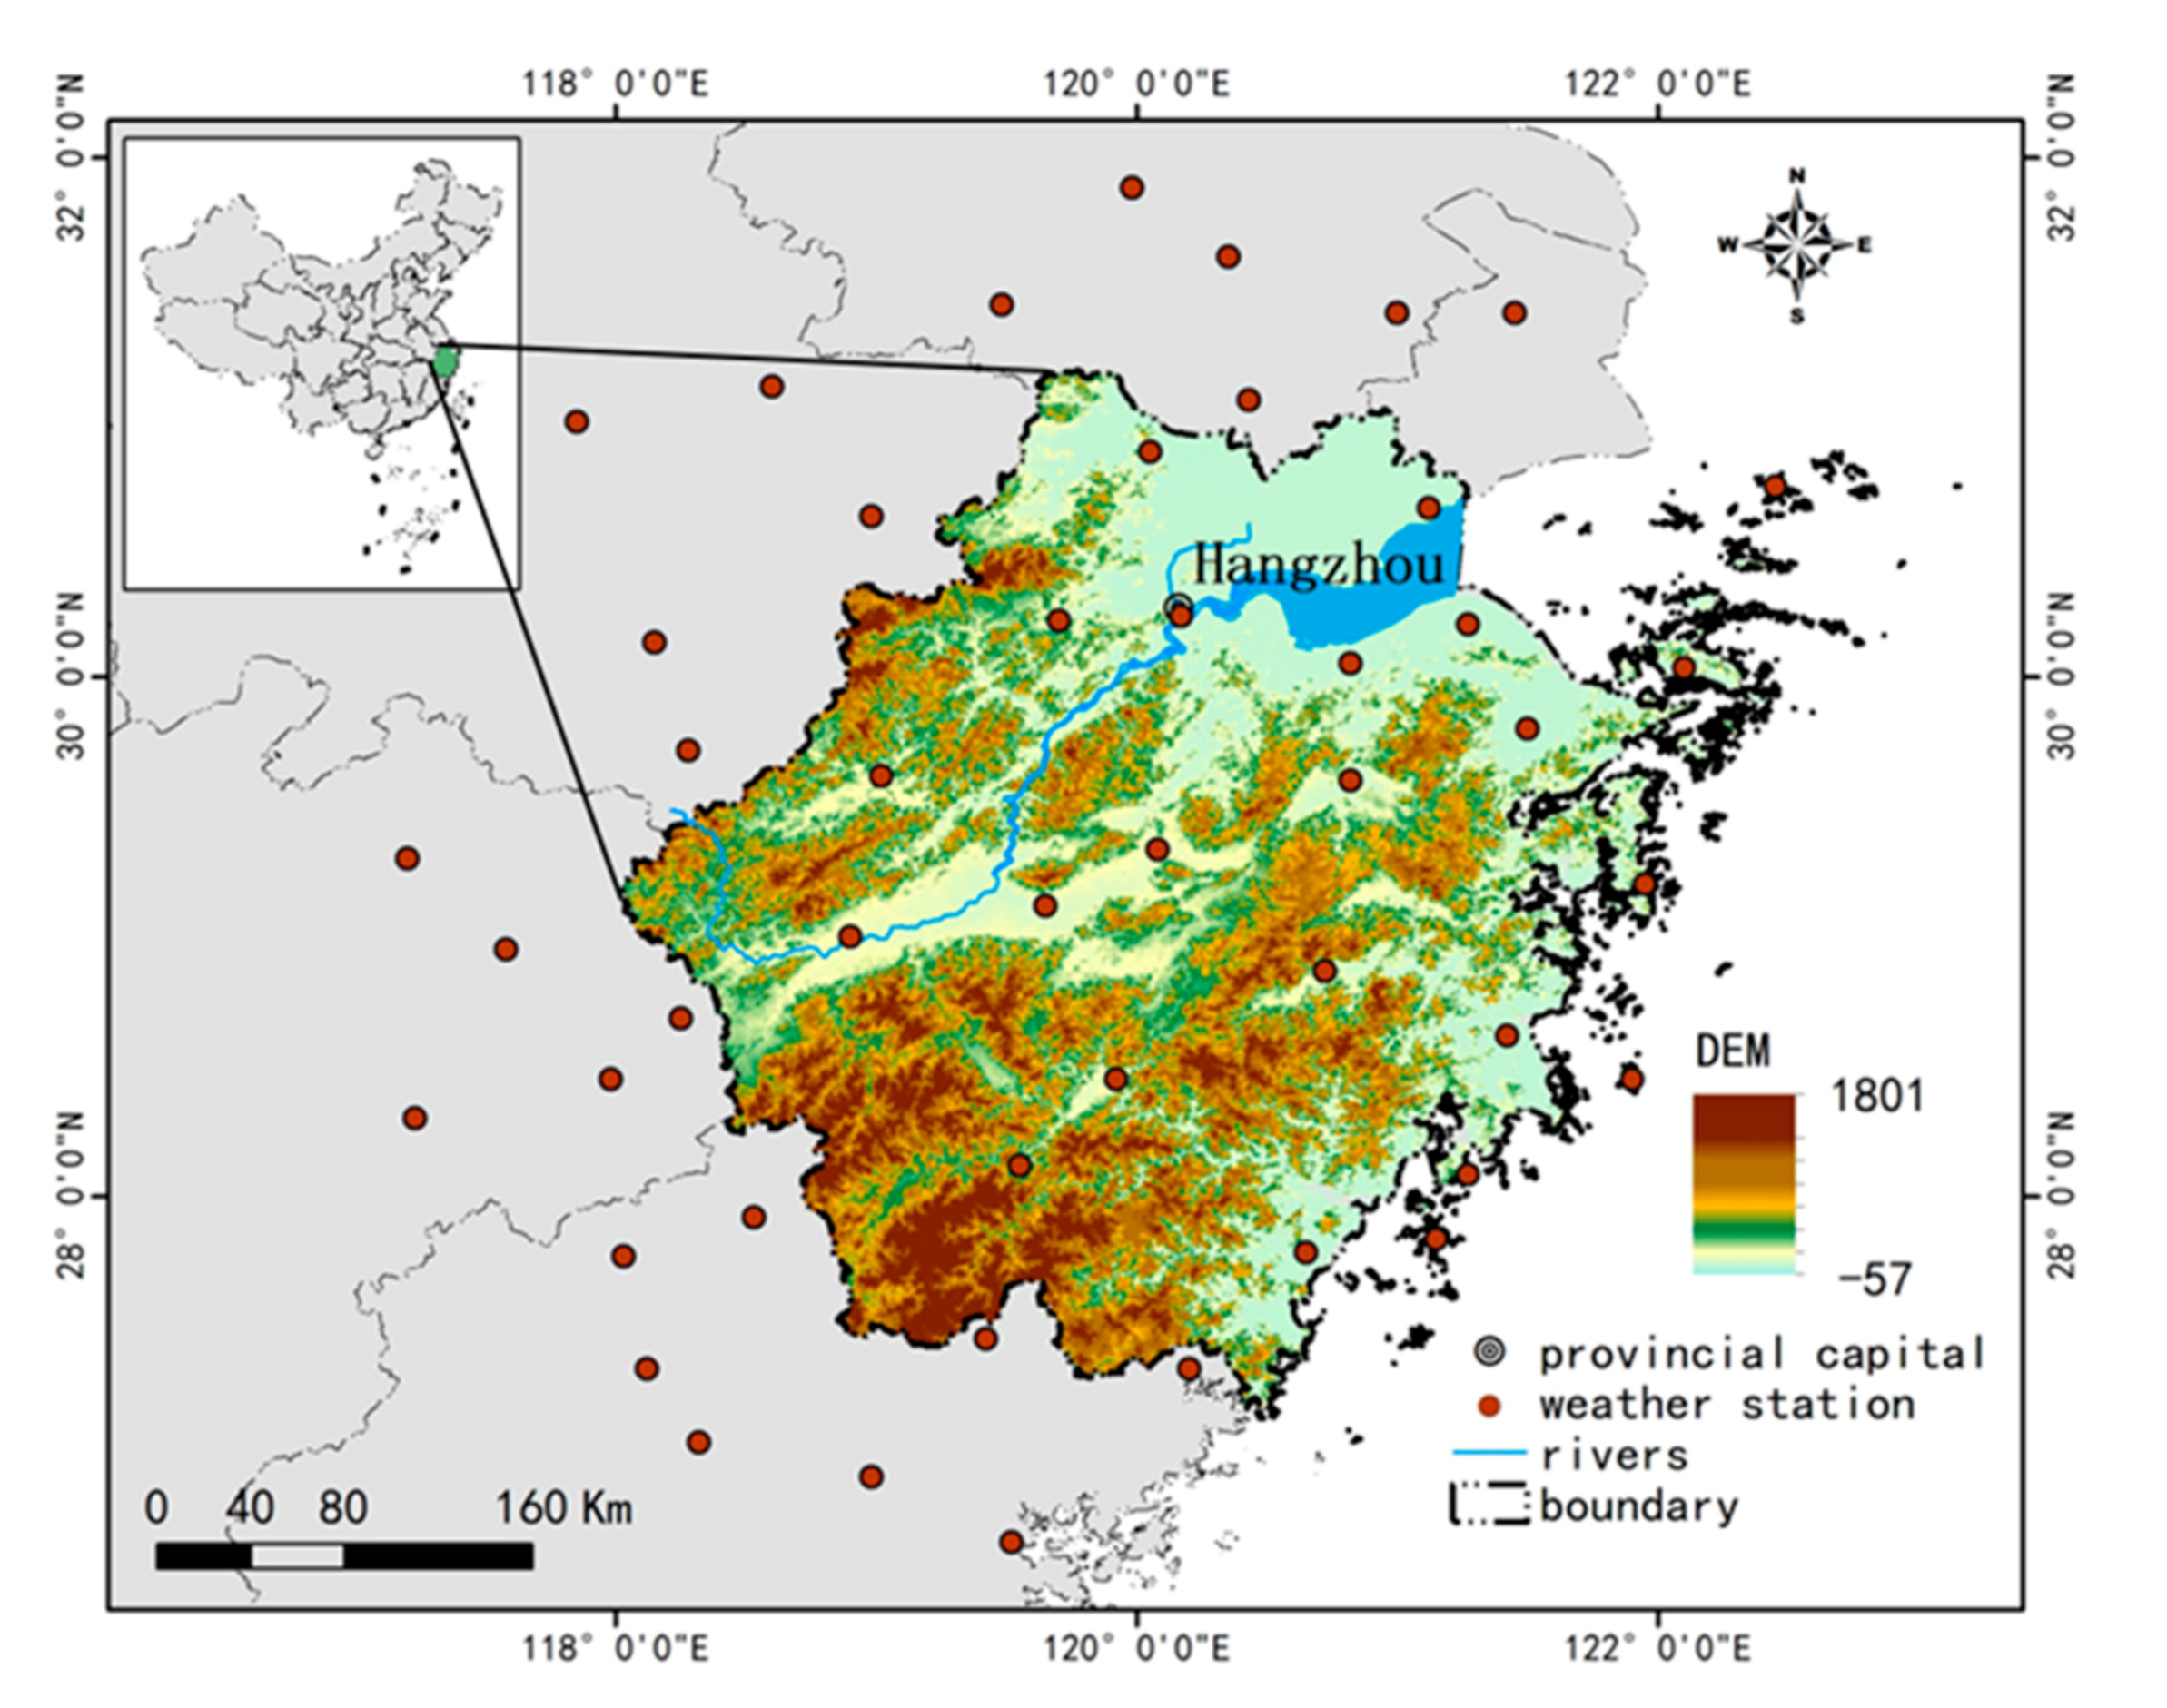
2.1. Study Area
2.2. Data
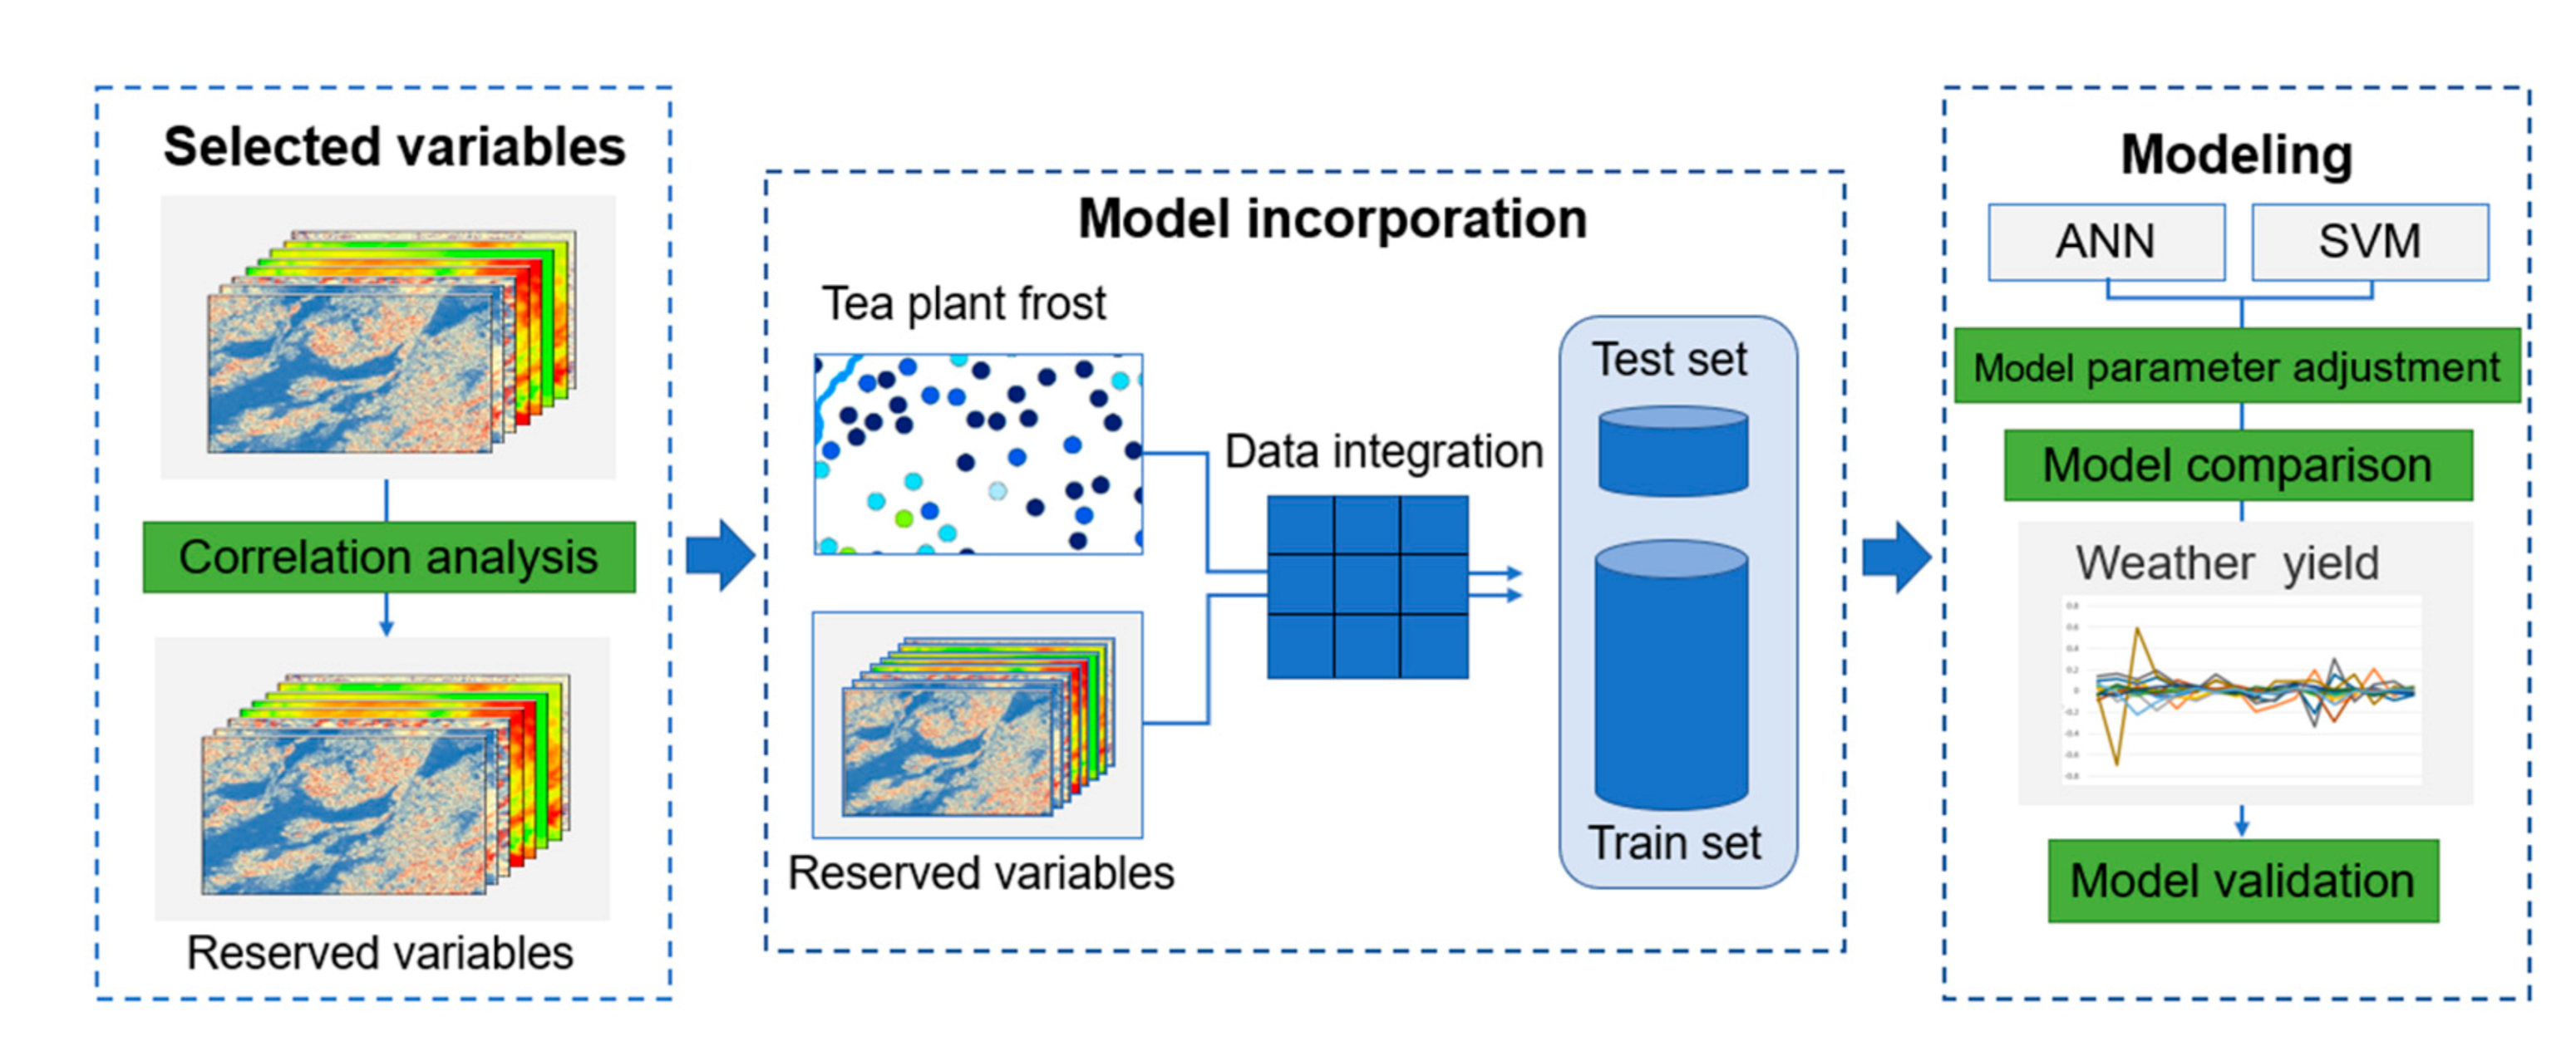
2.3. Methods
2.3.1. Artificial Neural Network
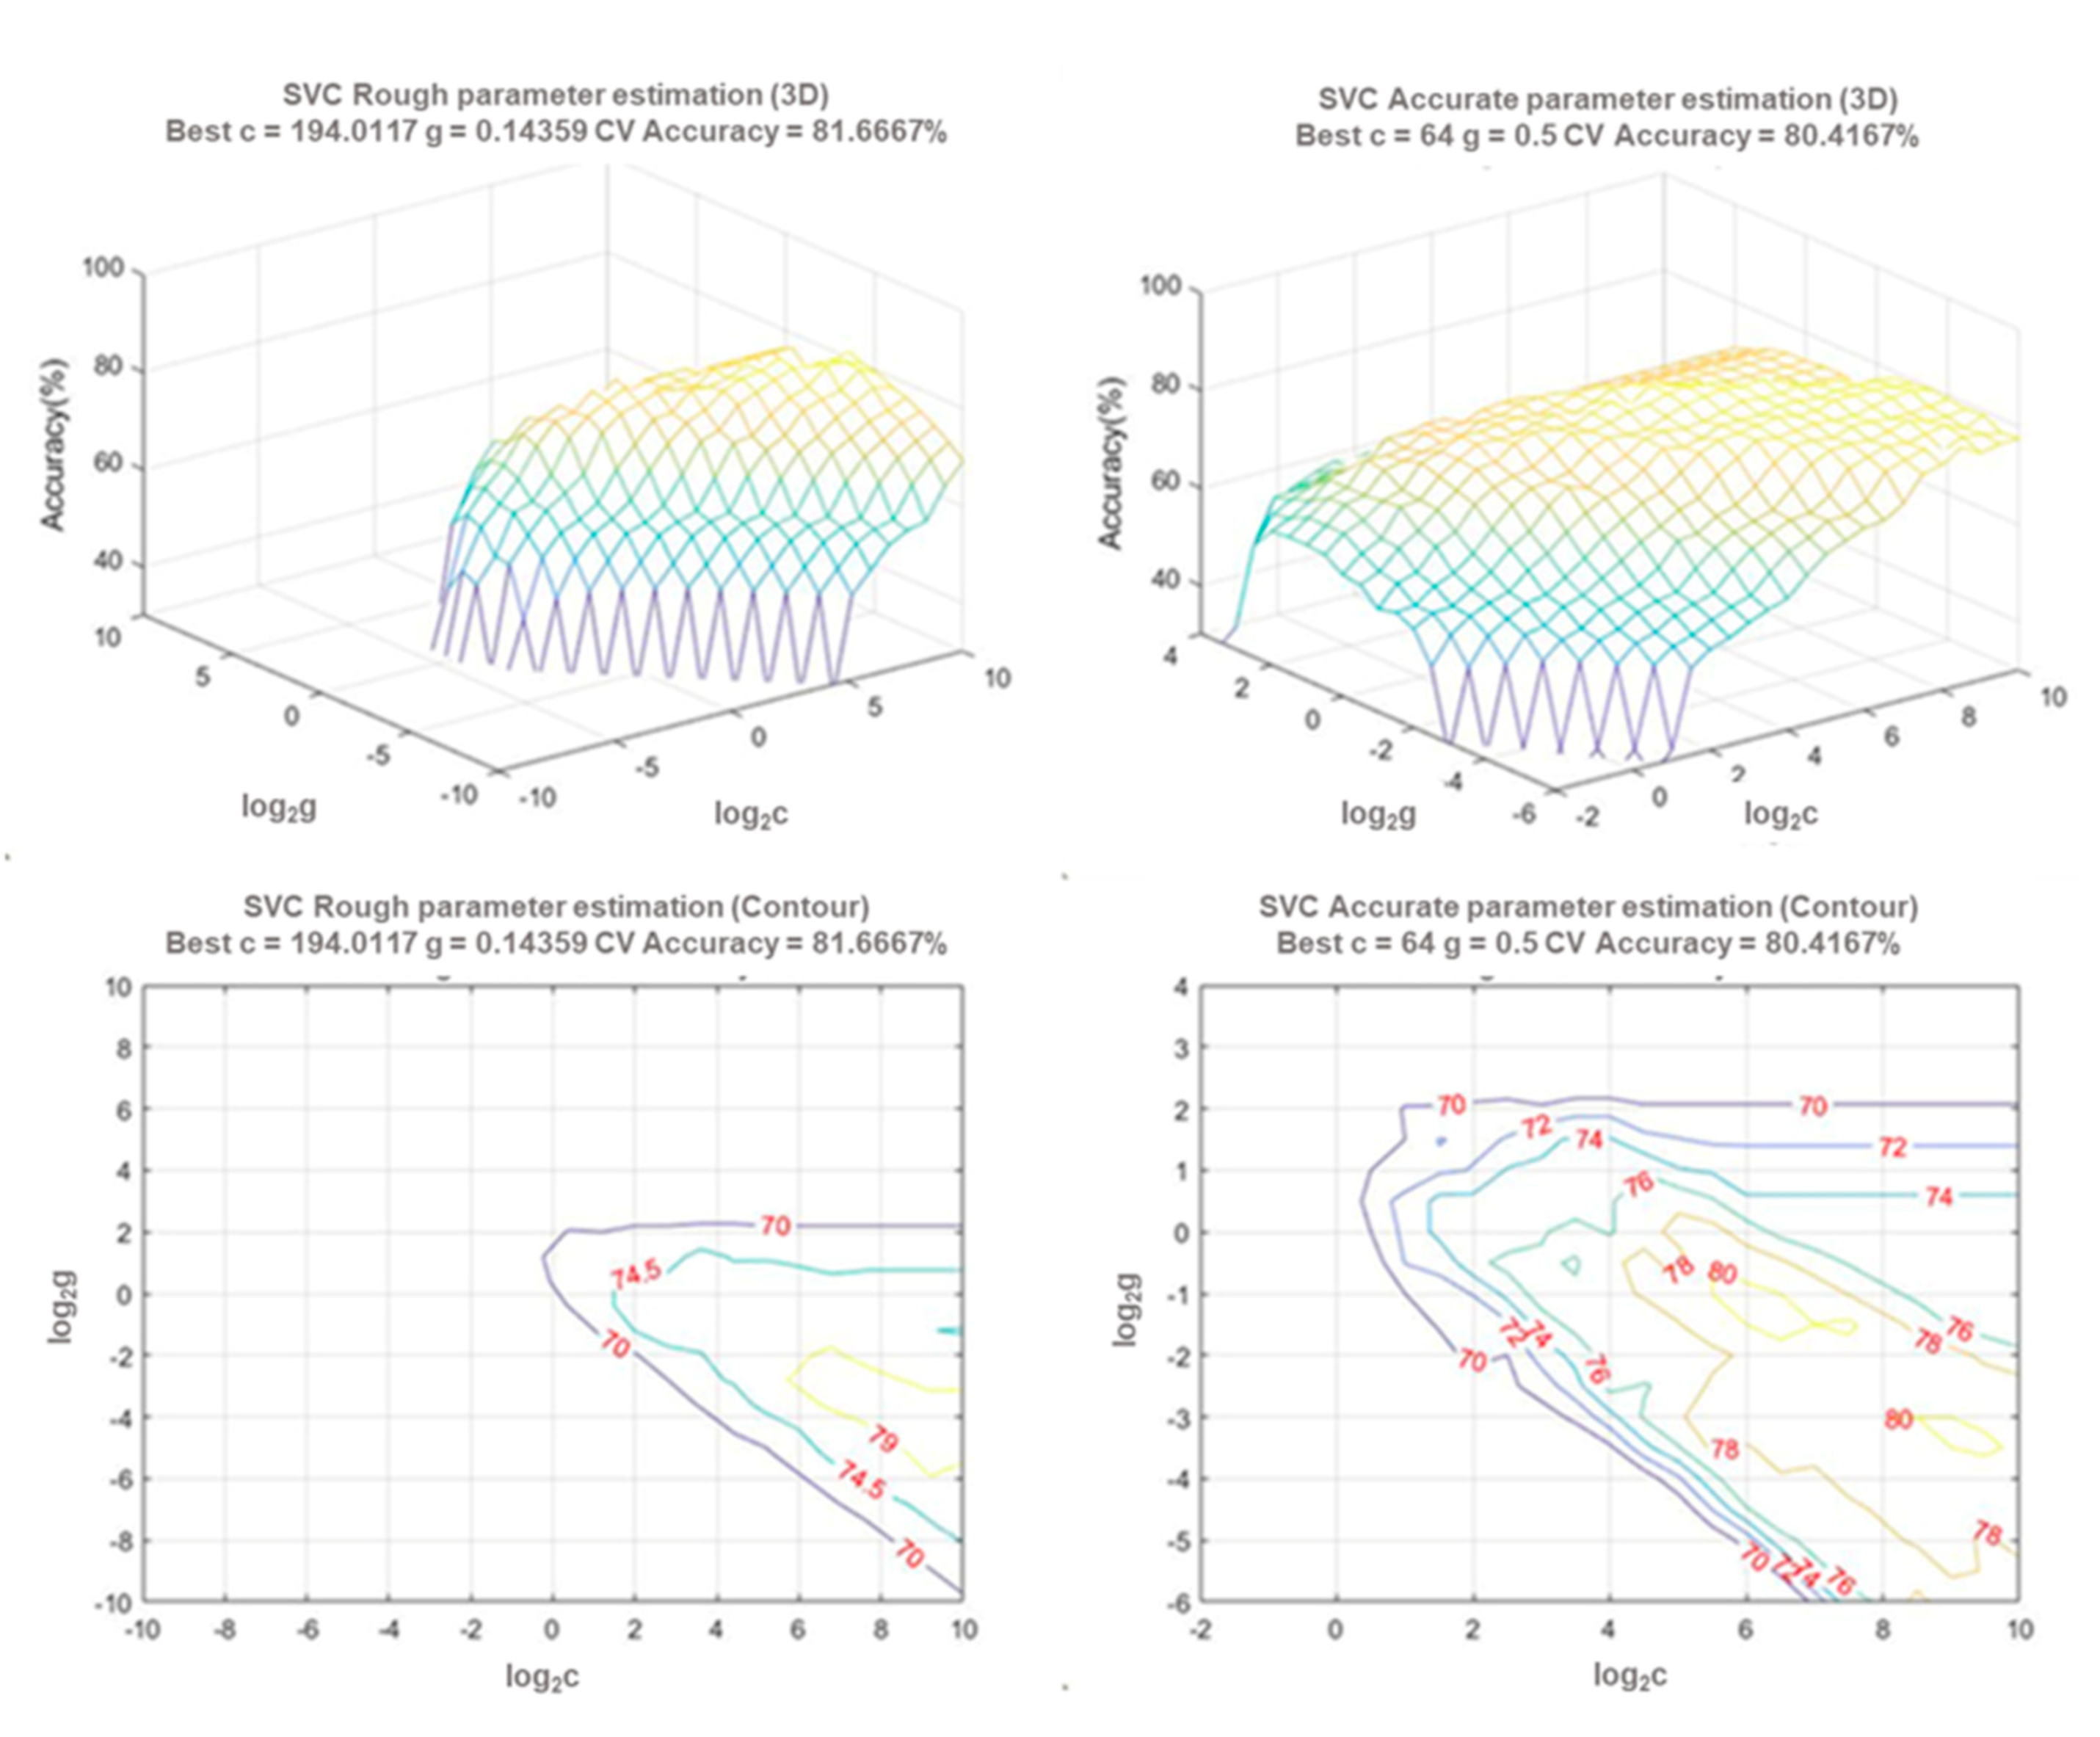
2.3.2. SVM
2.3.3. Methodologies for Model Evaluation
- The Kappa coefficient can measure the accuracy of the multi-class classification problem when it is used in the consistency test, and its calculation method is based on a confusion matrix.where represents the overall classification accuracy. Formula (3) is the calculation method of . Assume that the number of real samples of each class is a1, a2, a3…aC (C is the number of classification categories. In our research, C is equal to 5) respectively, and the predicted number of samples of each class is b1, b2, b3…bC respectively, and the total sample size of the input model is n, then there are:According to the previous experience, K usually falls between 0–1, which can be divided into five groups to represent the consistency of different levels, and generally when it falls between 0.61 and 0.80, it is considered to have a high degree of consistency [44].
- Accuracy. This is the ratio of the number of correct samples to the total number of samples.
- Average accuracy. This is the average accuracy of each sample. For imbalanced data, for n classes, the accuracy of each class is calculated respectively, and then the average value is calculated.
2.3.4. Meteorological Yield
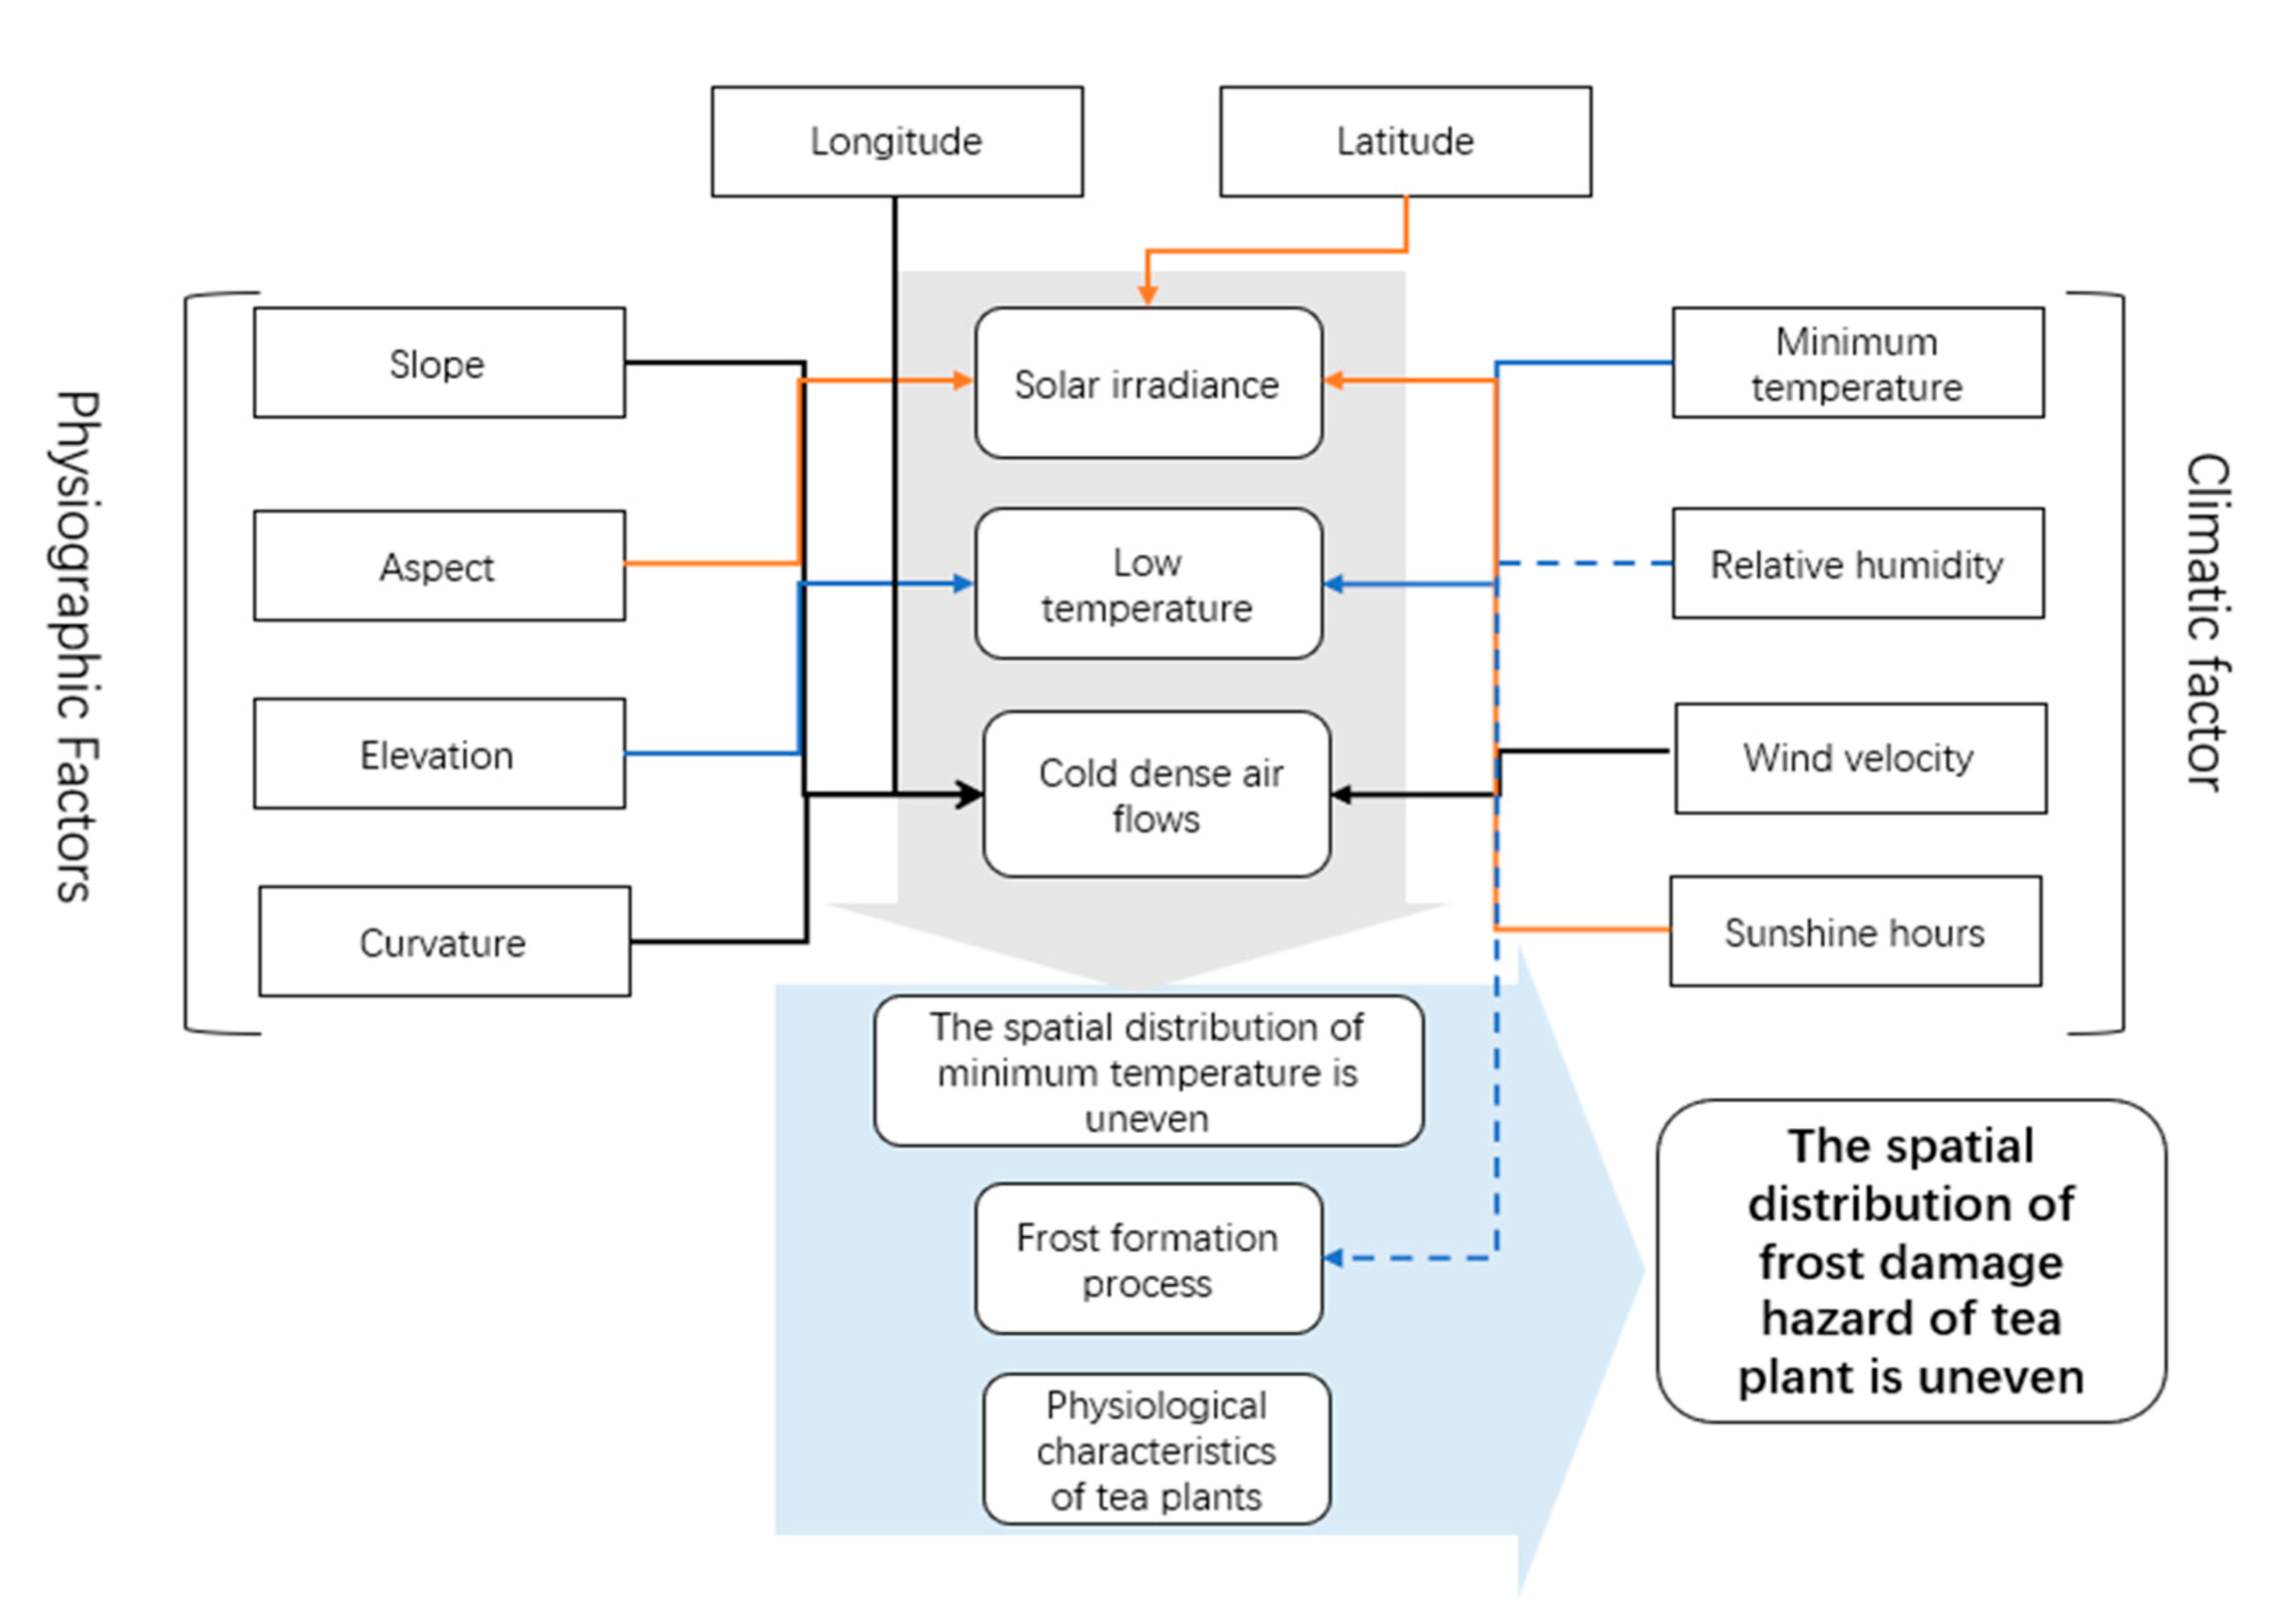
2.3.5. Selection of Variables
3. Results
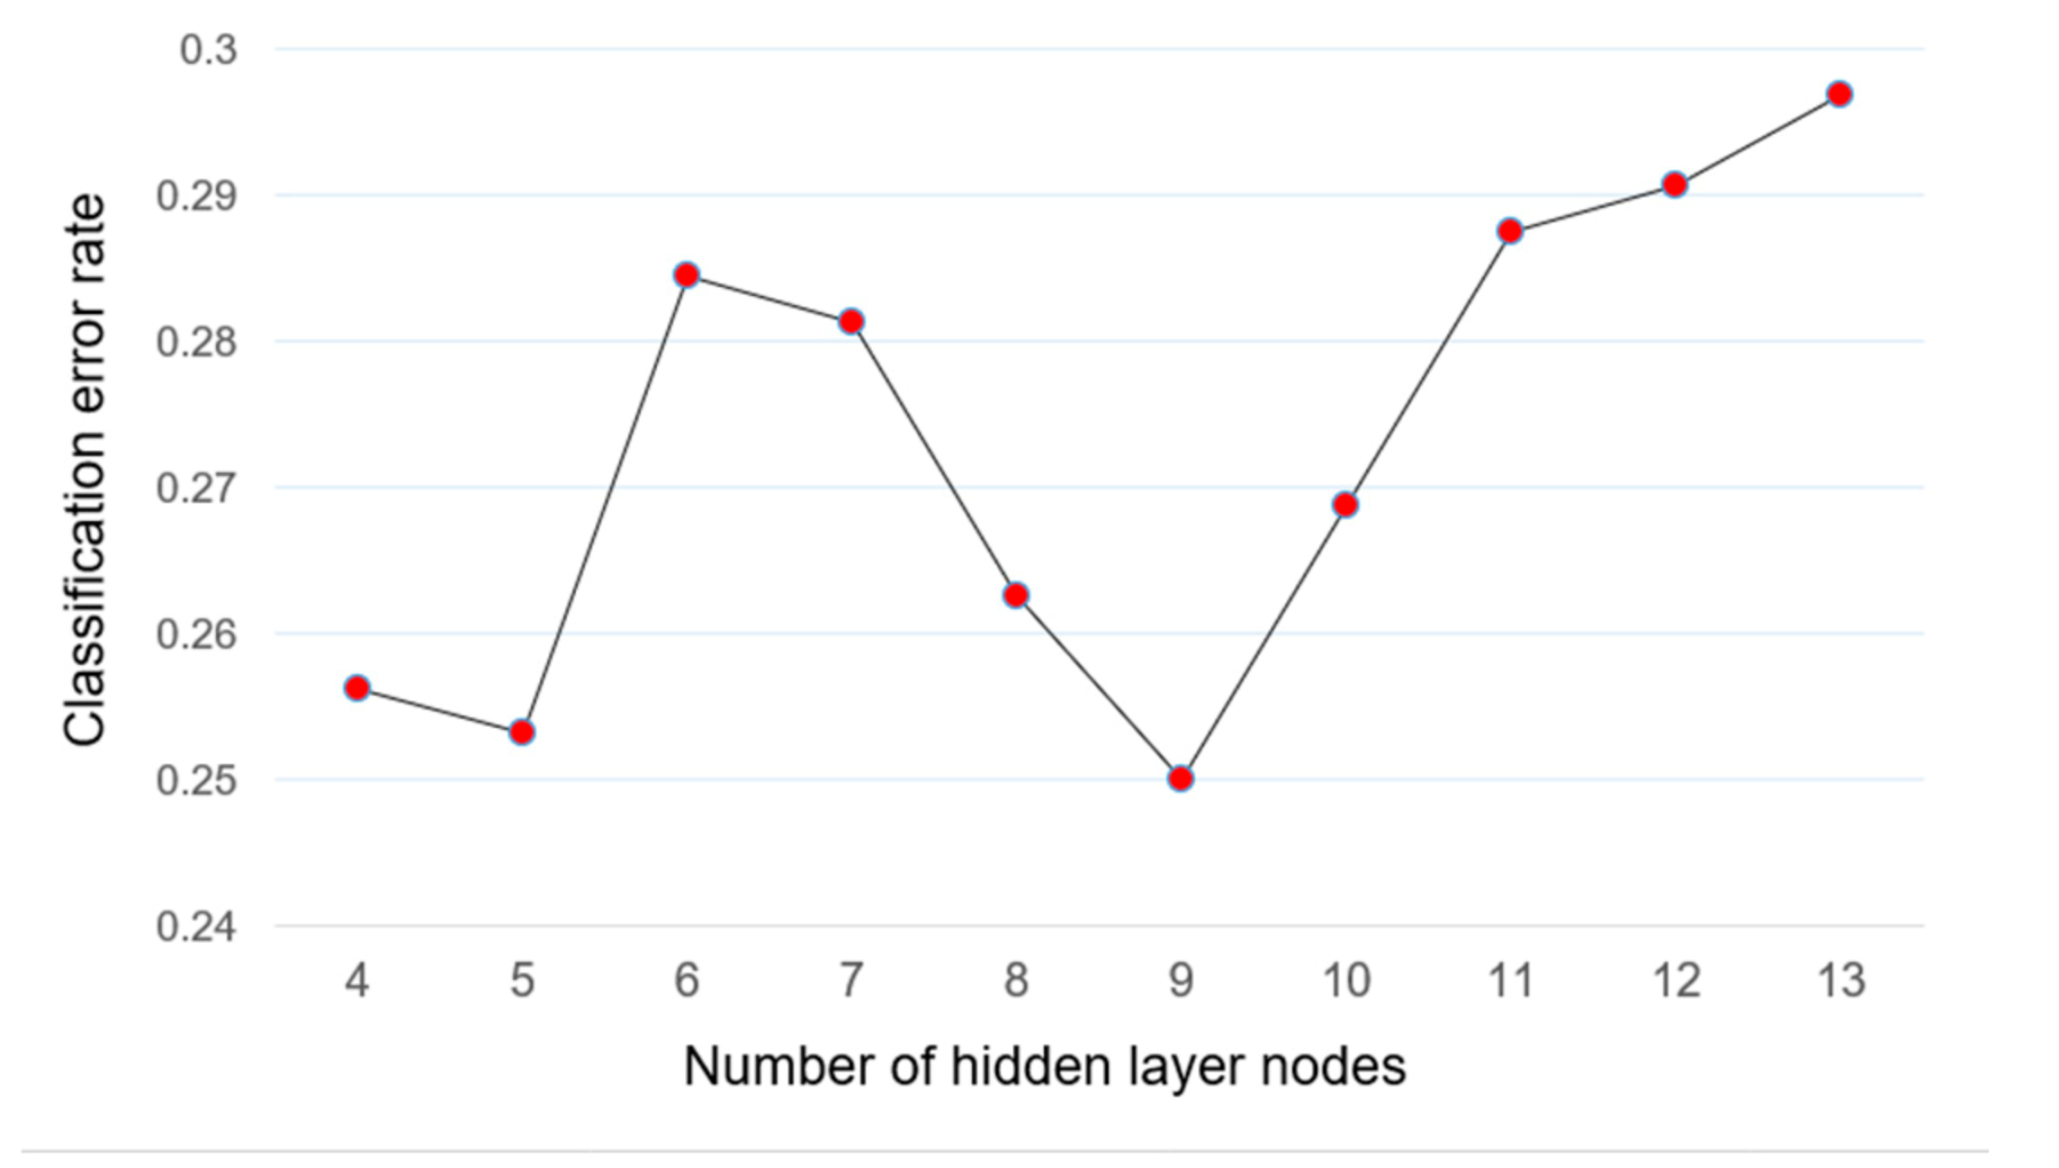
3.1. Model Parameter Adjustment
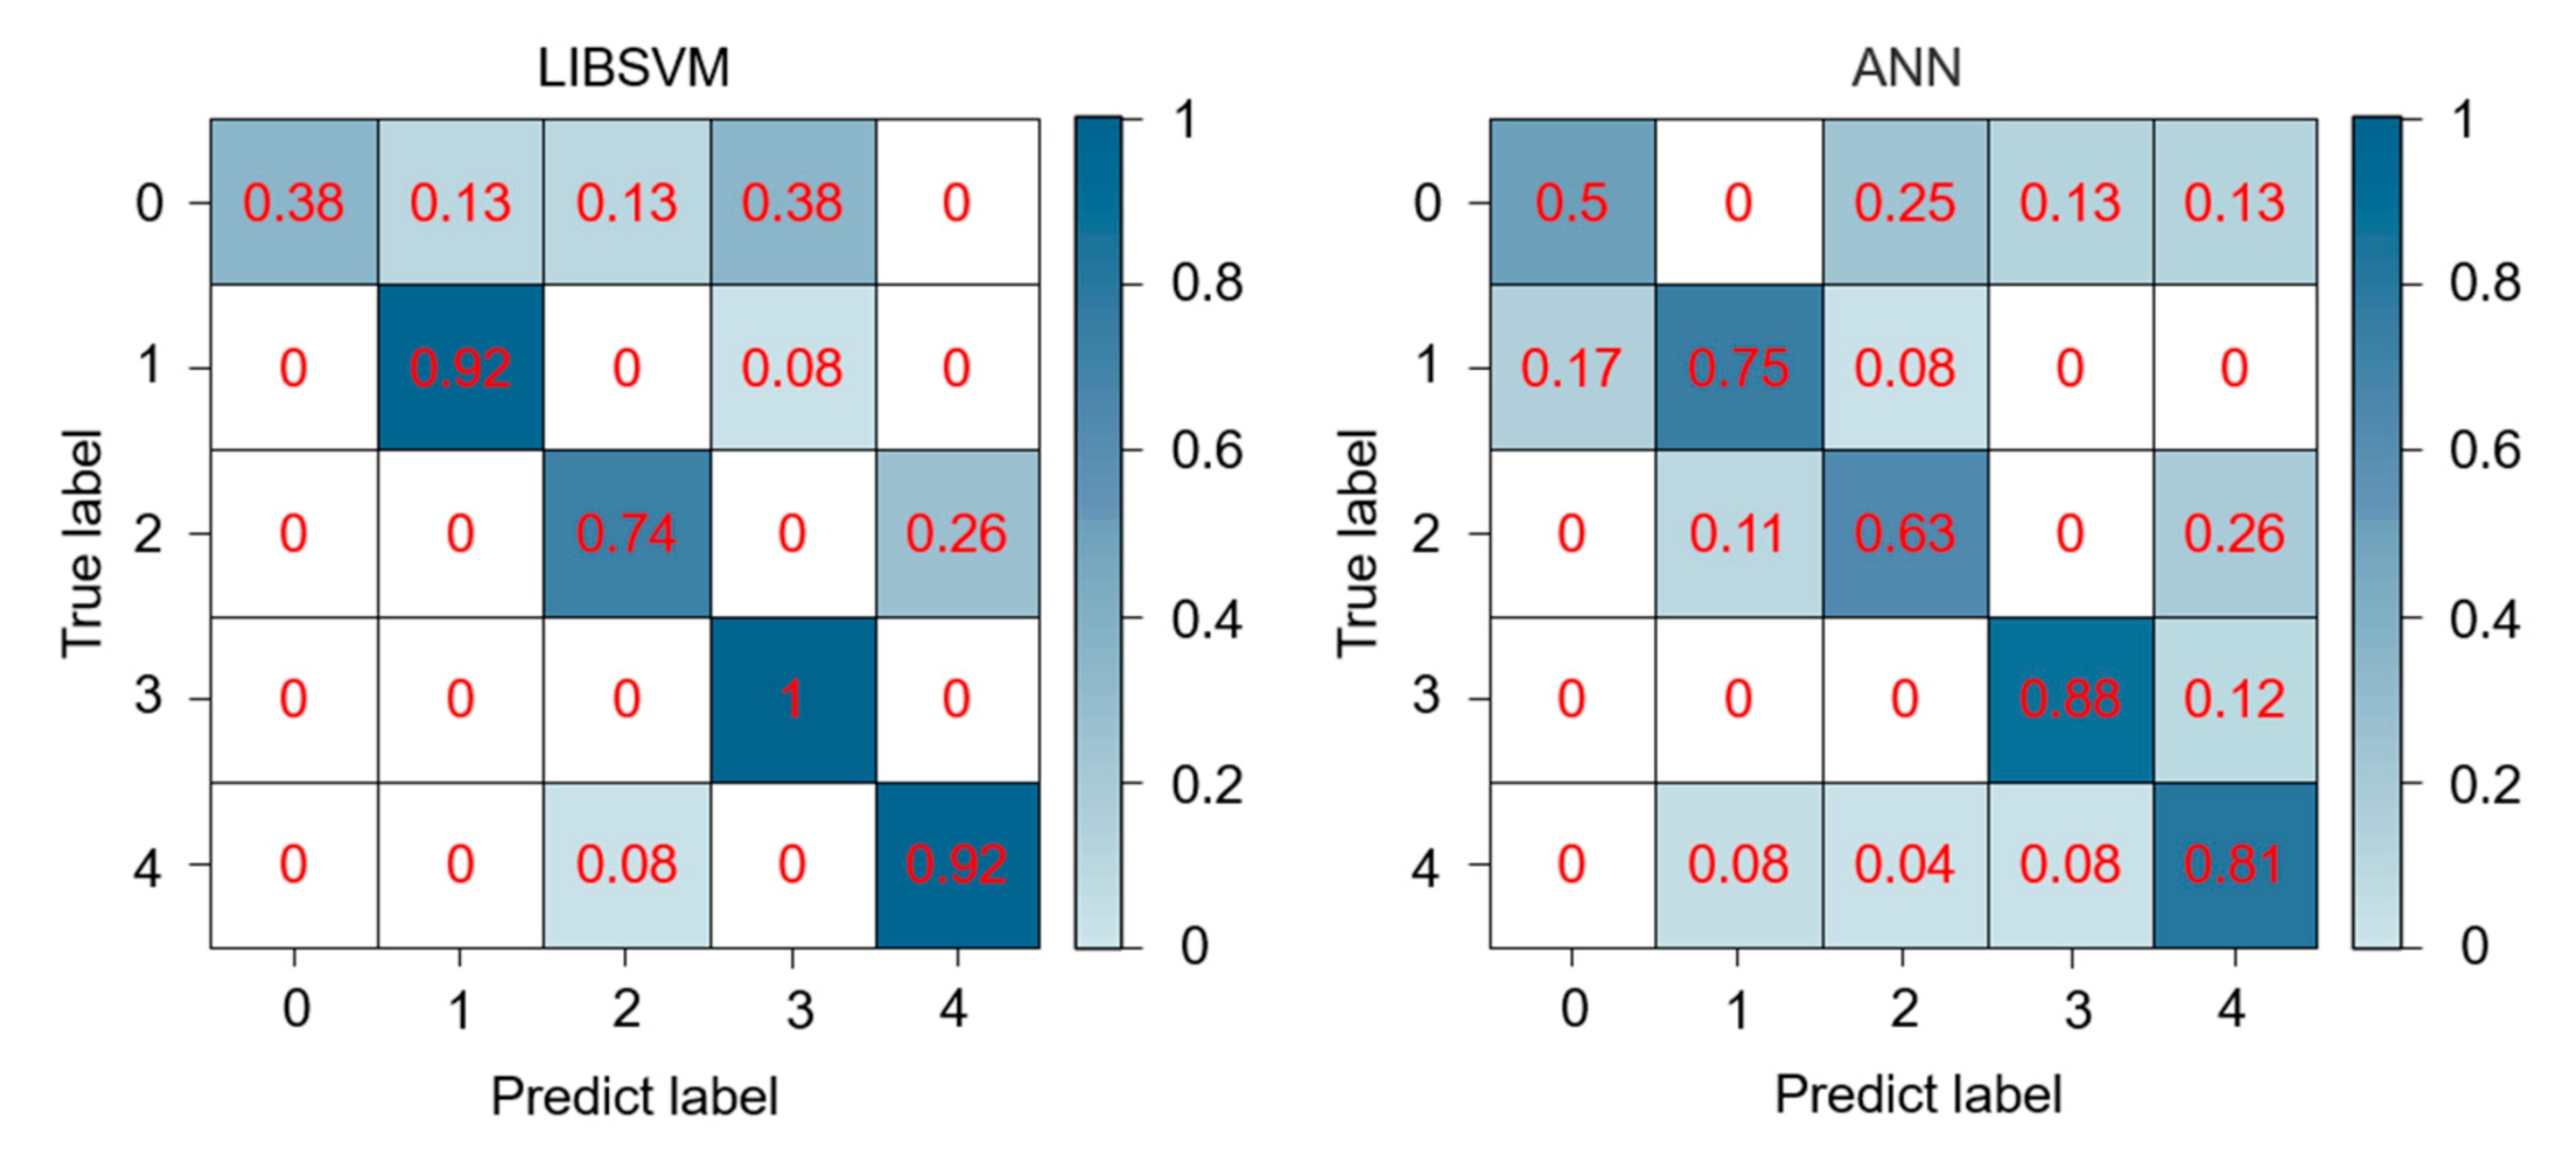
3.2. Classification Results
3.3. Actual Prediction of the Models
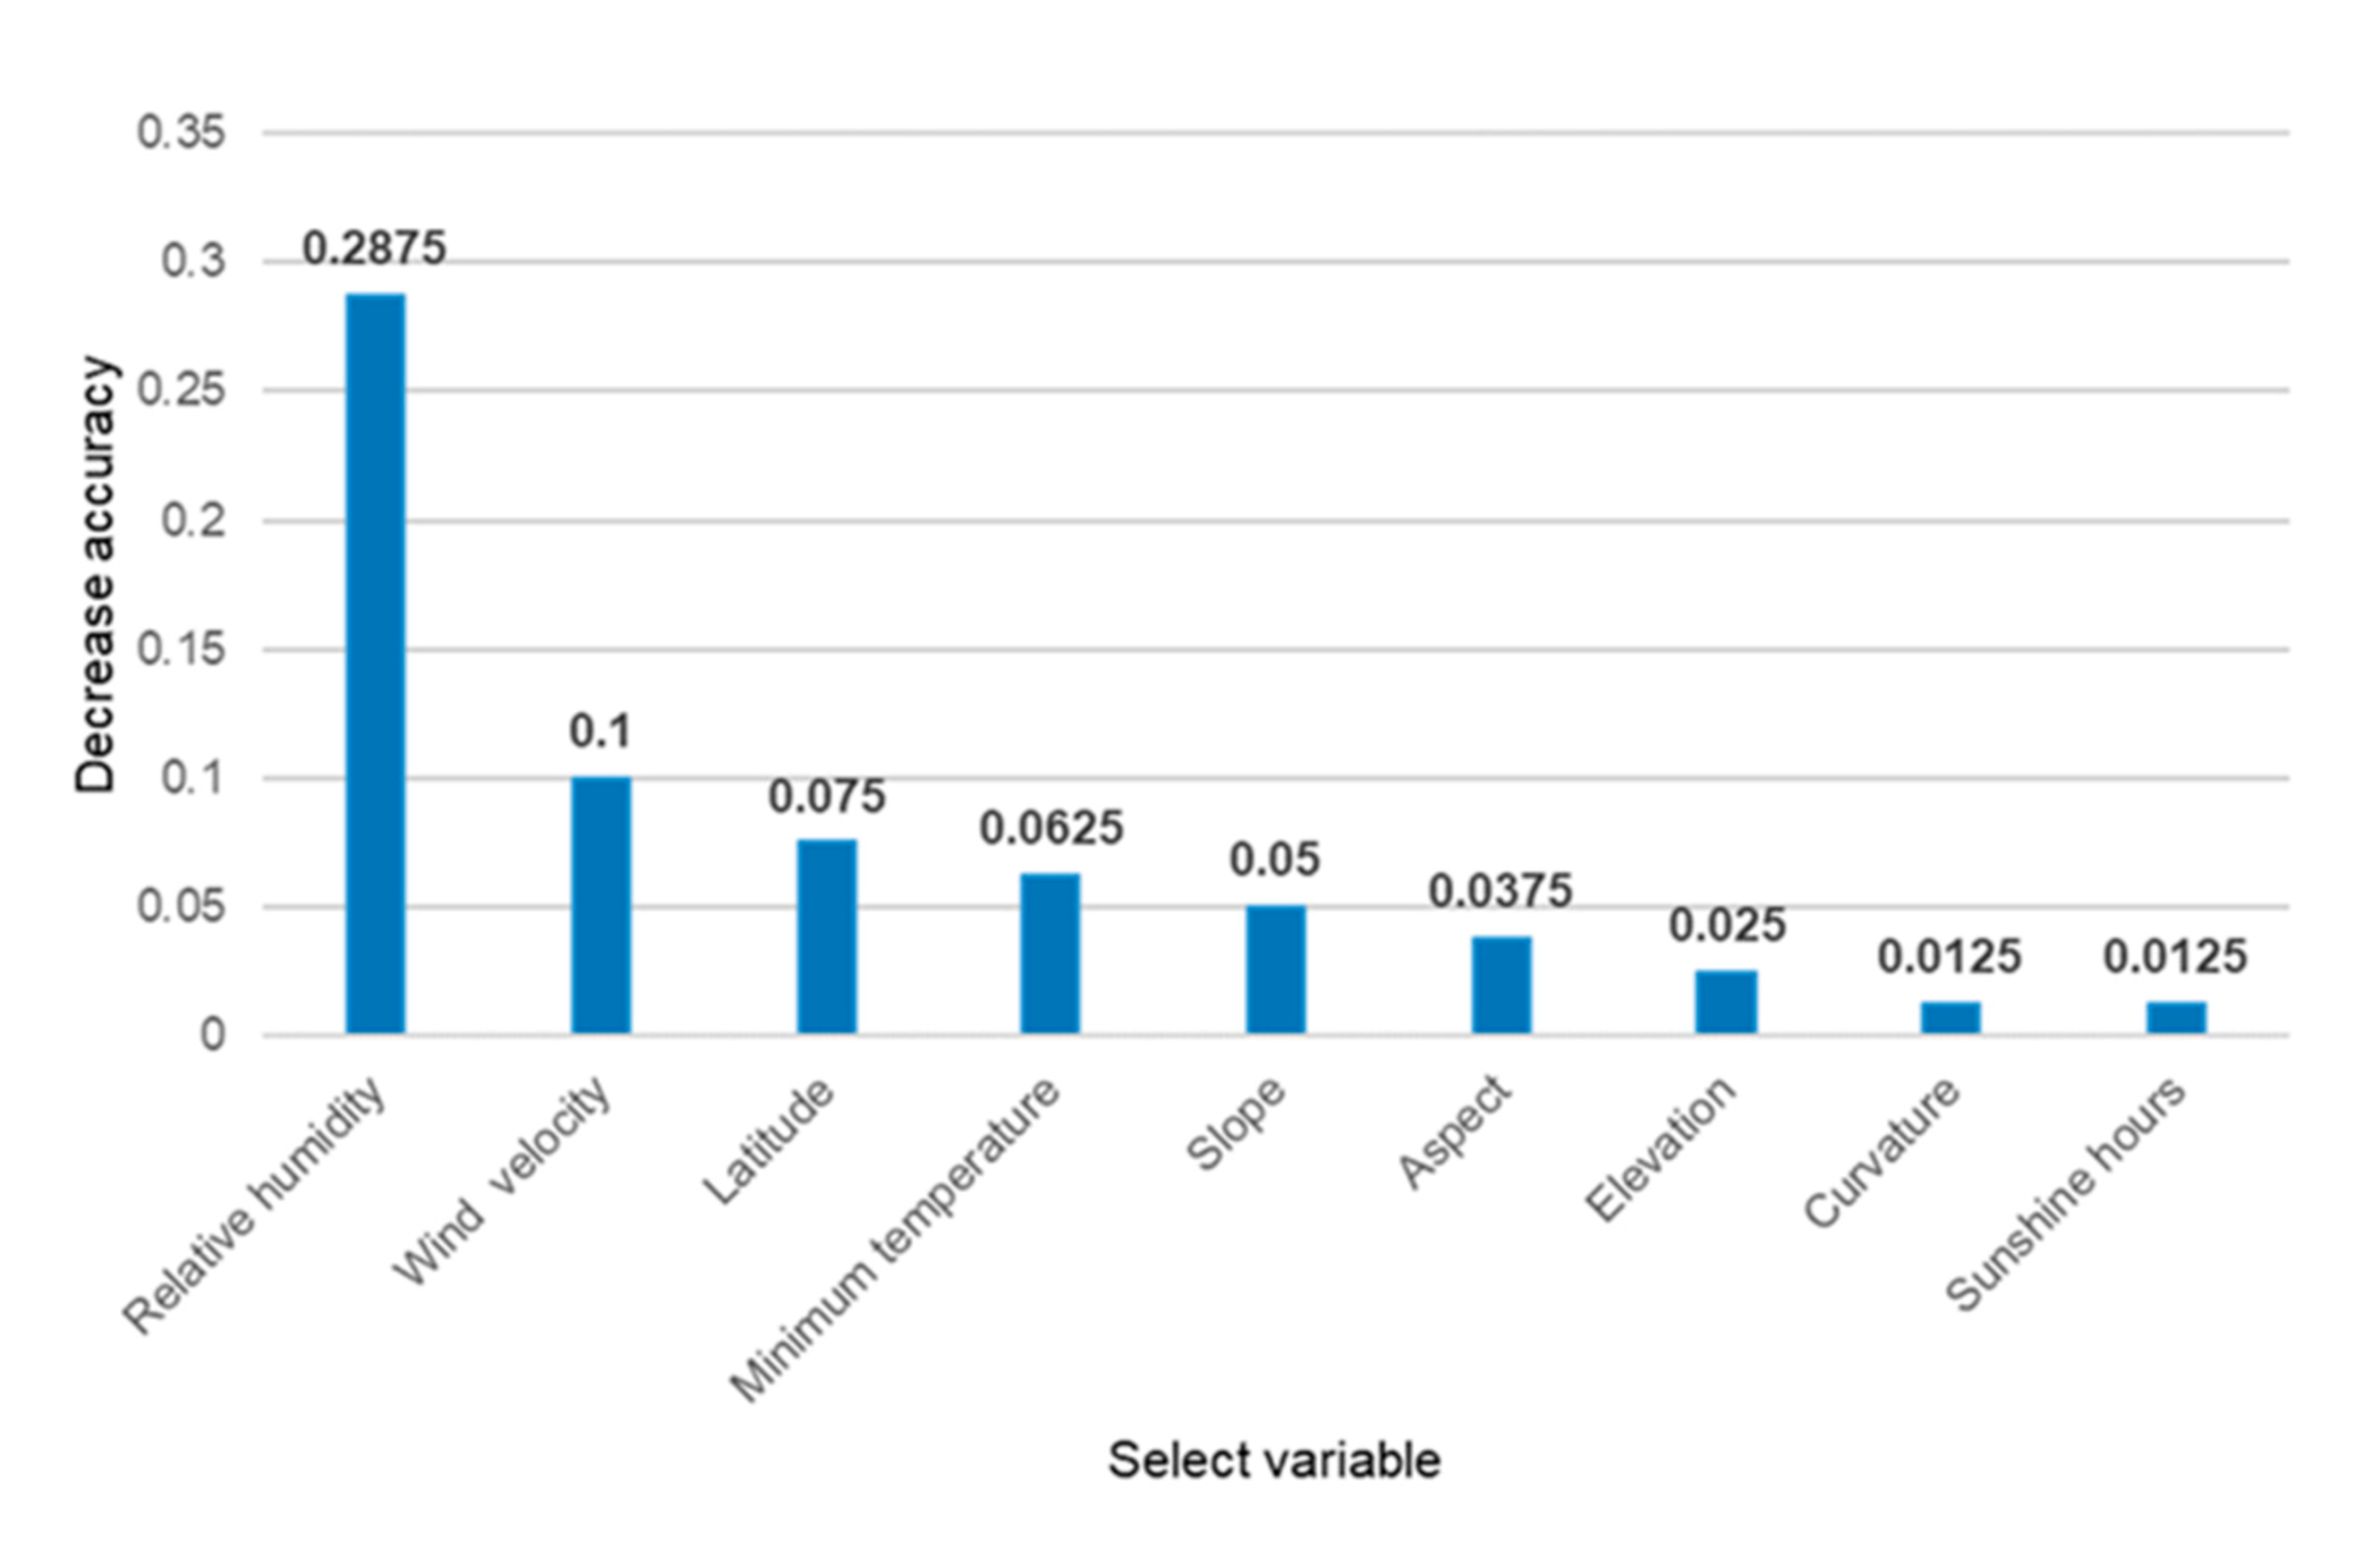
3.4. Factor Importance Analysis
4. Discussion
5. Conclusions
Author Contributions
Funding
Institutional Review Board Statement
Informed Consent Statement
Data Availability Statement
Acknowledgments
Conflicts of Interest
References
- FAO. International Tea Day. Tea: Resilient, Sustainanble and Healthy from Field to Cup. Available online: http://www.fao.org/international-tea-day/en/ (accessed on 11 June 2021).
- Carr, M.K.V. The Climatic Requirements of the Tea Plant: A Review. Exp. Agric. 1972, 8, 1–14. [Google Scholar] [CrossRef]
- Chen, H.; Liu, C.; Liu, C.; Hu, C.; Hsiao, M.; Chiou, M.; Su, Y.; Tsai, H. A Growth Model to Estimate Shoot Weights and Leaf Numbers in Tea. Biometry Modeling Stat. 2019, 111, 2255–2262. [Google Scholar] [CrossRef]
- Lu, Y.; Hu, Y.; Snyder, R.L.; Kent, E.R. Tea leaf’s microstructure and ultrastructure response to low temperature in indicating critical damage temperature. Inf. Process. Agric. 2019, 6, 247–254. [Google Scholar] [CrossRef]
- Wang, F.; Zhang, Y.Q. The influence of late spring coldness on famous tea production and its prevention. Agric. Equip. Technol. 2004, 26. [Google Scholar] [CrossRef]
- Lou, W.; Sun, K.; Sun, S.; Ma, F.; Wang, D. Changes in pick beginning date and frost damage risk of tea tree in Longjing tea-producing area. Theor. Appl. Clim. 2013, 114, 115–123. [Google Scholar] [CrossRef]
- Ma, S.Q.; Li, F.; Wang, Q. Cold Wave and Frost; Meteorological Press: Beijing, China, 2009; pp. 67–82. [Google Scholar]
- Lu, Y.Z. Response Characteristics of Radiation Frost in Tea Fields and Energy Quantitative for Frost Protection. Ph.D. Thesis, Jiangsu University, Zhenjiang, China, 2020; pp. 14–21. [Google Scholar]
- Lu, Y.; Hu, Y.; Li, P.; Paw U, K.T.; Snyder, R.L. Prediction of Radiation Frost Using Support Vector Machines Based on Micrometeorological Data. Appl. Sci. 2019, 10, 283. [Google Scholar] [CrossRef] [Green Version]
- Liu, J.; Chen, N. Investigation and prevention of frost damage in tea garden. Newsl. Seric. Tea 2003, 3, 12–13. [Google Scholar] [CrossRef]
- Snyder, R.L.; Paw, U.K.T.; Thonpson, J.F. Frost Protection: Fundamentals, Practice, and Economics; Food and Agriculture Organization of the United Nations: Rome, Italy, 2005; Volume 1, pp. 1–10. [Google Scholar]
- Sgubin, G.; Swingedouw, D.; Dayon, G.; de Cortázar-Atauri, I.G.; Ollat, N.; Pagé, C.; van Leeuwen, C. The risk of tardive frost damage in French vineyards in a changing climate. Agric. For. Meteorol. 2018, 250–251, 226–242. [Google Scholar] [CrossRef]
- Xiao, L.; Liu, L.; Asseng, S.; Xia, Y.M.; Tang, L.; Liu, B.; Cao, W.; Zhu, Y. Estimating spring frost and its impact on yield across winter wheat in China. Agric. For. Meteorol. 2018, 260, 154–164. [Google Scholar] [CrossRef]
- Wang, S.; Chen, J.; Rao, Y.H.; Liu, L.C.; Wang, W.Q.; Dong, Q. Response of winter wheat to spring frost from a remote sensing perspective: Damage estimation and influential factors. ISPRS J. Photogramm. Remote Sens. 2020, 168, 221–235. [Google Scholar] [CrossRef]
- Zhao, L.; Li, Q.; Zhang, Y.; Wang, H.; Du, X. Normalized NDVI valley area index (NNVAI)-based framework for quantitative and timely monitoring of winter wheat frost damage on the Huang-Huai-Hai Plain, China. Agric. Ecosyst. Environ. 2020, 292, 106793. [Google Scholar] [CrossRef]
- Chatrabgoun, O.; Karimi, R.; Daneshkhah, A.; Abolfathi, S.; Nouri, H.; Esmaeilbeigi, M. Copula-based probabilistic assessment of intensity and duration of cold episodes: A case study of Malayer vineyard region. Agric. For. Meteorol. 2020, 295, 108150. [Google Scholar] [CrossRef]
- Kotikot, S.M.; Flores, A.; Griffin, R.E.; Sedah, A.; Nyaga, J.; Mugo, R.; Limaye, A.; Irwin, D.E. Mapping threats to agriculture in East Africa: Performance of MODIS derived LST for frost identification in Kenya’s tea plantations. Int. J. Appl. Earth Obs. Geoinf. 2018, 72, 131–139. [Google Scholar] [CrossRef]
- Wang, P.; Ma, Y.; Tang, J.; Wu, D.; Chen, H.; Jin, Z.; Huo, Z. Spring Frost Damage to Tea Plants Can Be Identified with Daily Minimum Air Temperatures Estimated by MODIS Land Surface Temperature Products. Remote Sens. 2021, 13, 1177. [Google Scholar] [CrossRef]
- Alan, E.L. Effects of slope and aspect variations on satellite surface temperature retrievals and mesoscale analysis in moun-tainous terrain. J. Appl. Meteorol. Climatol. 1992, 31, 255–264. [Google Scholar] [CrossRef]
- Gerlitz, L. Using fuzzified regression trees for statistical downscaling and regionalization of near surface temperatures in complex terrain. Theor. Appl. Clim. 2014, 122, 337–352. [Google Scholar] [CrossRef]
- Kerdiles, H.; Grondona, M.; Rodriguez, R.; Seguin, B. Frost mapping using NOAA AVHRR data in the Pampean region, Argentina. Agric. For. Meteorol. 1996, 79, 157–182. [Google Scholar] [CrossRef]
- Lindkvist, L.; Gustavsson, T.; Bogren, J. A frost assessment method for mountainous areas. Agric. For. Meteorol. 2000, 102, 51–67. [Google Scholar] [CrossRef]
- Pouteau, R.; Rambal, S.; Ratte, J.-P.; Gogé, F.; Joffre, R.; Winkel, T. Downscaling MODIS-derived maps using GIS and boosted regression trees: The case of frost occurrence over the arid Andean highlands of Bolivia. Remote Sens. Environ. 2011, 115, 117–129. [Google Scholar] [CrossRef] [Green Version]
- Kotikot, S.M.; Onywere, S.M. Application of GIS and remote sensing techniques in frost risk mapping for mitigating agricultural losses in the Aberdare ecosystem, Kenya. Geocarto Int. 2014, 30, 104–121. [Google Scholar] [CrossRef] [Green Version]
- Kotikot, S.M.; Flores, A.; Griffin, R.E.; Nyaga, J.; Case, J.L.; Mugo, R.; Sedah, A.; Adams, E.; Limaye, A.; Irwin, D.E. Statistical characterization of frost zones: Case of tea freeze damage in the Kenyan highlands. Int. J. Appl. Earth Obs. Geoinf. 2020, 84, 101971. [Google Scholar] [CrossRef]
- Gobbett, D.L.; Nidumolu, U.; Crimp, S. Modelling frost generates insights for managing risk of minimum temperature extremes. Weather Clim. Extrem. 2020, 27, 100176. [Google Scholar] [CrossRef]
- Lee, H.; Chun, J.A.; Han, H.-H.; Kim, S. Prediction of Frost Occurrences Using Statistical Modeling Approaches. Adv. Meteorol. 2016, 2016, 1–9. [Google Scholar] [CrossRef]
- Yue, Y.; Zhou, Y.; Wang, J.; Ye, X. Assessing Wheat Frost Risk with the Support of GIS: An Approach Coupling a Growing Season Meteorological Index and a Hybrid Fuzzy Neural Network Model. Sustainability 2016, 8, 1308. [Google Scholar] [CrossRef] [Green Version]
- Meng, Z. Effect of low temperature and frost on April 1 on tea product in Zhejang. J. Zhejiang Agric. Sci. 2019, 60, 1397–1400. [Google Scholar] [CrossRef]
- China meteorological data network. Available online: http://data.cma.cn/ (accessed on 27 June 2021).
- Liu, Z.H.; Tim, R.M.; Tom, G.V.; Yang, K.Q.; Li, R.; Mu, X.M. Interpolation for time series of meteorological variables using ANUSPLIN. J. Northwest A&F Univ. 2008, 36, 227–234. [Google Scholar] [CrossRef]
- Hutchinson, M.F. ANUSPLIN Version 4.3 User Guide, The Australian National University, Centre for Resource and Environmental Studies. Canberra. Available online: https://fennerschool.anu.edu.au/research/products/anusplin (accessed on 22 May 2020).
- Geospatial Data Cloud. Available online: http://www.gscloud.cn/ (accessed on 27 June 2021).
- Year Book China. Available online: https://www.yearbookchina.com/ (accessed on 27 June 2021).
- Wu, C.Y. The Research and Application on Neural Network. Master’s Thesis, Northeast Agricultural University, Harbin, China, 2007. [Google Scholar]
- Robinson, C.; Mort, N. A neural network system for the protection of citrus crops from frost damage. Comput. Electron. Agric. 1997, 16, 177–187. [Google Scholar] [CrossRef]
- Shank, D.B.; Hoogenboom, G.; McClendon, R.W. Dewpoint Temperature Prediction Using Artificial Neural Networks. J. Appl. Meteorol. Clim. 2008, 47, 1757–1769. [Google Scholar] [CrossRef]
- Chevalier, R.F.; Hoogenboom, G.; McClendon, W.R.; Paz, J.O. A web-based fuzzy expert system for frost warnings in horticultural crops. Environ. Model. Softw. 2012, 35, 84–91. [Google Scholar] [CrossRef]
- Chevalier, R.F.; Hoogenboom, G.; McClendon, W.R.; Paz, J.A. Support vector regression with reduced training sets for air temperature prediction: A comparison with artificial neural networks. Neural Comput. Appl. 2011, 20, 151–159. [Google Scholar] [CrossRef]
- Cortes, C.; Vapnik, V. Support-Vector Networks. Mach. Learn. 1995, 20, 273–297. [Google Scholar] [CrossRef]
- Brereton, R.G.; Lloyd, G.R. Support Vector Machines for classification and regression. Analyst 2010, 135, 230–267. [Google Scholar] [CrossRef]
- Hsu, C.W.; Chang, C.C.; Lin, C.J. A Practical Guide to Support Vector Classification, Department of Computer Science National Taiwan University, 2003. Taipei 106, Taiwan. Available online: http://www.csie.ntu.edu.tw/~cjlin/libsvm; (accessed on 4 June 2020).
- Chang, C.C.; Lin, C.J. LIBSVM: A library for support vector machines. ACM Trans. Intell. Syst. Technol. 2011, 2, 27. Available online: http://www.csie.ntu.edu.tw/~cjlin/libsvm (accessed on 4 June 2020). [CrossRef]
- Tang, W.; Hu, J.; Zhang, H.; Wu, P.; He, H. Kappa coefficient: A popular measure of rater agreement. Shanghai Arch. Psychiatry 2015, 27, 62–67. [Google Scholar] [CrossRef]
- Li, X.Y.; Zhang, Y.; Zhao, Y.X.; Du, Z.Y.; Yang, S. Comparative study on main crop yield separation methods. J. Appl. Meteorol. Sci. 2020, 31, 74–82. [Google Scholar] [CrossRef]
- Huang, S.B. Meteorology of the tea plant in China: A review. Agric. For. Meteorol. 1989, 47, 19–30. [Google Scholar] [CrossRef]
- Layomi Jayasinghe, S.; Kumar, L.; Sandamali, J. Assessment of Potential Land Suitability for Tea (Camellia sinensis (L.) O. Kuntze) in Sri Lanka Using a GIS-Based Multi-Criteria Approach. Agriculture 2019, 9, 148. [Google Scholar] [CrossRef] [Green Version]
- Alvares, C.A.; Sentelhas, P.C.; Stape, J.L. Modeling monthly meteorological and agronomic frost days, based on minimum air temperature, in Center-Southern Brazil. Theor. Appl. Climatol. 2017, 134, 177–191. [Google Scholar] [CrossRef]
- Hengl, T.; Heuvelink, G.B.M.; Tadić, M.P.; Pebesma, E. Spatio-temporal prediction of daily temperatures using time-series of MODIS LST images. Theor. Appl. Climatol. 2011, 107, 265–277. [Google Scholar] [CrossRef] [Green Version]
- Fox, J.; Monette, G. Generalized Collinearity Diagnostics. J. Am. Stat. Assoc. 1992, 87, 178–183. [Google Scholar] [CrossRef]
- Hecht-Nielsen, R. Theory of the backpropagation neural network. Neural Netw. 1988, 1, 445. [Google Scholar] [CrossRef]
- Jiao, B.; Ye, M.X. Determination of hidden unit number in a BP neural network. J. Shanghai Dianji Univ. 2013, 16, 113–116. [Google Scholar] [CrossRef]
- Du, G.L.; Zhang, Y.-S.; Iqbal, J.; Yang, Z.-H.; Yao, X. Landslide susceptibility mapping using an integrated model of information value method and logistic regression in the Bailongjiang watershed, Gansu Province, China. J. Mt. Sci. 2017, 14, 249–268. [Google Scholar] [CrossRef]
- Sun, D.L.; Wen, H.J.; Wang, D.Z.; Xu, J.H. A random forest model of landslide susceptibility mapping based on hyperparameter optimization using Bayes algorithm. Geomorphology 2020, 362, 107201. [Google Scholar] [CrossRef]
- Wang, J.; Li, H.; Ma, G.; Duan, X.; Zhang, X. Effects of air humidity on super cooling point of Fuji apple flowers. Non Wood For. Res. 2020, 38, 225–230. [Google Scholar] [CrossRef]
- Écio Souza, D.; Lorenzon, S.A.; de Castro, N.L.M.; Marcatti, G.E.; dos Santos, O.P.; Júnior, J.C.D.D.; Cavalcante, R.B.L.; Fernandes-Filho, E.I.; Amaral, C.H. Forecasting frost risk in forest plantations by the combination of spatial data and machine learning algorithms. Agric. For. Meteorol. 2021, 306, 108450. [Google Scholar] [CrossRef]
- Ghielmi, L.; Eccel, E. Descriptive models and artificial neural networks for spring frost prediction in an agricultural mountain area. Comput. Electron. Agric. 2006, 54, 101–114. [Google Scholar] [CrossRef]
- Ding, L.; Noborio, K.; Shibuya, K. Frost Forecast using Machine Learning—From association to causality. Procedia Comput. Sci. 2019, 159, 1001–1010. [Google Scholar] [CrossRef]


| Variable | Min | Max | VIF |
|---|---|---|---|
| Latitude | 118.156 | 30.737 | 1.684 |
| Slope | 0 | 50.306 | 1.047 |
| Aspect | −1 | 359.963 | 2.134 |
| Elevation | −57 | 1801 | 1.038 |
| Curvature | −0.210 | 0.231 | 1.1 |
| Minimum temperature | −1.856 | 7.647 | 1.187 |
| Relative humidity | 31.323 | 69.710 | 1.881 |
| Sunshine hours | 4.420 | 9.692 | 2.082 |
| Wind velocity | 0.843 | 4.232 | 1.239 |
| Accuracy | Average Accuracy | Kappa Coefficient | |
|---|---|---|---|
| SVM | 0.8375 | 0.7929 | 0.791 |
| ANN | 0.75 | 0.7129 | 0.6737 |
| Area | Meteorological Yield | M | Area | Meteorological Yield | M |
|---|---|---|---|---|---|
| Hang zhou | −0.017 | 3.000 | Ji an | 0.005 | 3.071 |
| Sheng zhou | −0.055 | 3.560 | Xin chang | −0.086 | 3.241 |
| Hu zhou | 0.029 | 3.067 | Ning bo | 0.045 | 2.667 |
| Wu yi | −0.040 | 3.385 | Yu yao | 0.045 | 2.429 |
| Yu hang | 0.062 | 2.760 | Ning hai | −0.018 | 3.027 |
| Zhu ji | 0.149 | 2.696 | Long you | −0.049 | 3.360 |
| Fu yang | −0.124 | 3.529 | Jian de | −0.012 | 3.094 |
| Chun an | −0.012 | 2.777 |
Publisher’s Note: MDPI stays neutral with regard to jurisdictional claims in published maps and institutional affiliations. |
© 2021 by the authors. Licensee MDPI, Basel, Switzerland. This article is an open access article distributed under the terms and conditions of the Creative Commons Attribution (CC BY) license (https://creativecommons.org/licenses/by/4.0/).
Share and Cite
Xu, J.; Guga, S.; Rong, G.; Riao, D.; Liu, X.; Li, K.; Zhang, J. Estimation of Frost Hazard for Tea Tree in Zhejiang Province Based on Machine Learning. Agriculture 2021, 11, 607. https://0-doi-org.brum.beds.ac.uk/10.3390/agriculture11070607
Xu J, Guga S, Rong G, Riao D, Liu X, Li K, Zhang J. Estimation of Frost Hazard for Tea Tree in Zhejiang Province Based on Machine Learning. Agriculture. 2021; 11(7):607. https://0-doi-org.brum.beds.ac.uk/10.3390/agriculture11070607
Chicago/Turabian StyleXu, Jie, Suri Guga, Guangzhi Rong, Dao Riao, Xingpeng Liu, Kaiwei Li, and Jiquan Zhang. 2021. "Estimation of Frost Hazard for Tea Tree in Zhejiang Province Based on Machine Learning" Agriculture 11, no. 7: 607. https://0-doi-org.brum.beds.ac.uk/10.3390/agriculture11070607