Article

Functional Quality of Improved Tomato Genotypes Grown in Open Field and in Plastic Tunnel under Organic Farming

by
Otilia Cristina Murariu
1,
Creola Brezeanu
2,
Carmenica Doina Jităreanu
1,
Teodor Robu
1,
Liviu Mihai Irimia
3,
Alina Elena Trofin
4,
Lorena-Diana Popa
3,
Vasile Stoleru
3,
Florin Murariu
5,* and
Petre Marian Brezeanu
2,*
1
Department of Plant Science, “Ion Ionescu de la Brad” University of Life Sciences, 3 M. Sadoveanu Alley, 700490 Iaşi, Romania
2
Vegetable Research Development Station, 220 Barlad Street, 600388 Bacau, Romania
3
Department of Horticultural Technologies, “Ion Ionescu de la Brad” University of Life Sciences, 3 M. Sadoveanu Alley, 700490 Iaşi, Romania
4
Department of Exact Science, “Ion Ionescu de la Brad” University of Life Sciences, 3 M. Sadoveanu Alley, 700490 Iaşi, Romania
5
Department of Agroeconomy, “Ion Ionescu de la Brad” University of Life Sciences, 3 M. Sadoveanu Alley, 700490 Iaşi, Romania
*
Authors to whom correspondence should be addressed.
Submission received: 18 June 2021 / Accepted: 25 June 2021 / Published: 29 June 2021
(This article belongs to the Section Crop Production)

Abstract

:
In response to urgent demand to raise awareness of the nutritional and health benefits of tomato consumption and to advocate for healthy diets through increased sustainable production and consumption of fruits and vegetables, this study is intended to promote a healthy and balanced lifestyle, sharing the best practices of production and consumption. The aim of this research was to compare the effects of the growing system (field vs. plastic tunnel) and of genotype characteristics for organic improved tomato genotypes. The research was carried out in the 2019 and 2020 years on eight improved tomato genotypes. The results showed that the ascorbic acid content presented higher values for organic tomatoes cultivated in the field for all genotypes studied, with an upper limit of 18.57 mg·100 g−1 FW. In contrast, the content in β-carotene and lycopene showed higher values for genotypes grown under plastic tunnel conditions. Significant statistical differences were noticed concerning the mean values of all genotypes according to cultivation conditions (field vs. plastic tunnel) for most parameters excepting total soluble solids (TSS), titratable acidity (TA), maturity index (MI) and flavor index (FI). This highlights the major importance of the selection of some genotypes of tomatoes that respond positively to the organic cultivation system in terms of the presence of the antioxidants compounds (vitamin C, lycopene, and carotene) in representative quantities. Genotype 3 is highlighted by the highest content in carotene (7.4 mg·100 g1 F.W.) and lycopene (8.4 mg·100 g1 F.W.) and genotype 5 by the highest content in vitamin C (16.8 mg·100 g1 F.W.). The results of the study suggest that by applying appropriate techniques for growing organic tomatoes in the plastic tunnel system, the antioxidant substrate can be optimized compared to the results obtained for the field system.

1. Introduction

Tomato is one of the most important species worldwide due to its antioxidant properties and economic criteria [1], thus, sustainable production should be the main purpose, particularly in terms of fertilization and growth systems.
The tomato production present over 5 million hectares cultivated in 2019 [2], with a yield of 35.9 t/ha and a production of over 180 million tons [3].
Organic product consumers are people belonging to the middle class, with diverse purchase behavior, interested in health and environmental protection.
The consumption of vegetables and fruits is associated with the maintenance of health and diseases protection. Consumption of tomato contributes significantly to human health by reducing the risk of disease such as cancer [4], osteoporosis and cardiovascular disease. Tomato have a high level of carotenoids (especially β-carotene and lycopene), vitamin C [5], phenolic components and small amounts of vitamin E in daily diets [6]. Tomato is also an excellent source of secondary metabolites, which are important for human health such as phosphate, potassium, flavonoids, chlorophyll [7]. According to Fonseca et al. [8] organic tomatoes are considered to be functional products.
Among the carotenoid components, β-carotene and lycopene are known and studied due to their antioxidant value. β-carotene and lycopene are involved in photosynthetic reactions and are produced in plastids with the highest accumulation found in chloroplasts and especially chromoplasts [9]. These color–producing compounds are synthesized by plants and microorganisms. Lycopene and β-carotene determine the familiar red and yellow colors associated with tomato. Carotenoids function as photo protectants due to their ability to neutralize the harmful by products of photooxidation [10]. Lycopene and β-carotene act as powerful antioxidants in humans. Increasing the level of dietary lycopene by consuming fresh tomatoes and tomato products has been recommended by many health experts [11]. The antioxidant activity of tomato fruits depends not only on the genotype [12] but also on the maturation stage, cultivation practices and climate.
Consumers are becoming increasingly concerned about how, where and when food is produced [13]. This has led to growing consumer interest in organic vegetable crops, including those produced in greenhouses. Organic tomatoes produced in Northern European greenhouses are obtained by intensive monocultures on the soil. In this system, it is not realistic to apply crop rotation or the association of crop joining to increase production sustainability [14].
The main purpose of this research was to evaluate the genotypes obtained in the two systems (open field/plastic tunnel) in ecological conditions in order to validate the improved quality traits.

2. Materials and Methods

2.1. Experimental Site

The research was carried out on eight tomato genotypes (Solanum Lycopersicum L.) grown in the organic system in the field and plastic tunnel during 2019 and 2020, at Vegetable Research and Development Station, Bacau, Romania characterized by a typical temperate climate (46°580577″ N, 26°953322″ E, 158.96 m a.s.l.).
The certification of 4.75 ha including open and protected surfaces, is in accordance with art. 27 of Regulation (EC) no. 834/2007 [15] and the provisions of the Ministry of Agriculture and Rural Development Order no. 895/2016 [16]. The field is used to conduct breeding experiments, to develop practices, methods, and technics for organic growing systems.
The weather conditions during the experiment are presented in Table 1.
In both experimental variants (open field and plastic tunnel), the tomato crops were cultivated on soil with the same characteristics: clayey chambic chernozem soil with the following characteristics: pH 6.8; 2.6% organic matter; 0.150% N, 116 ppm P (mobile), 195 ppm K (mobile).

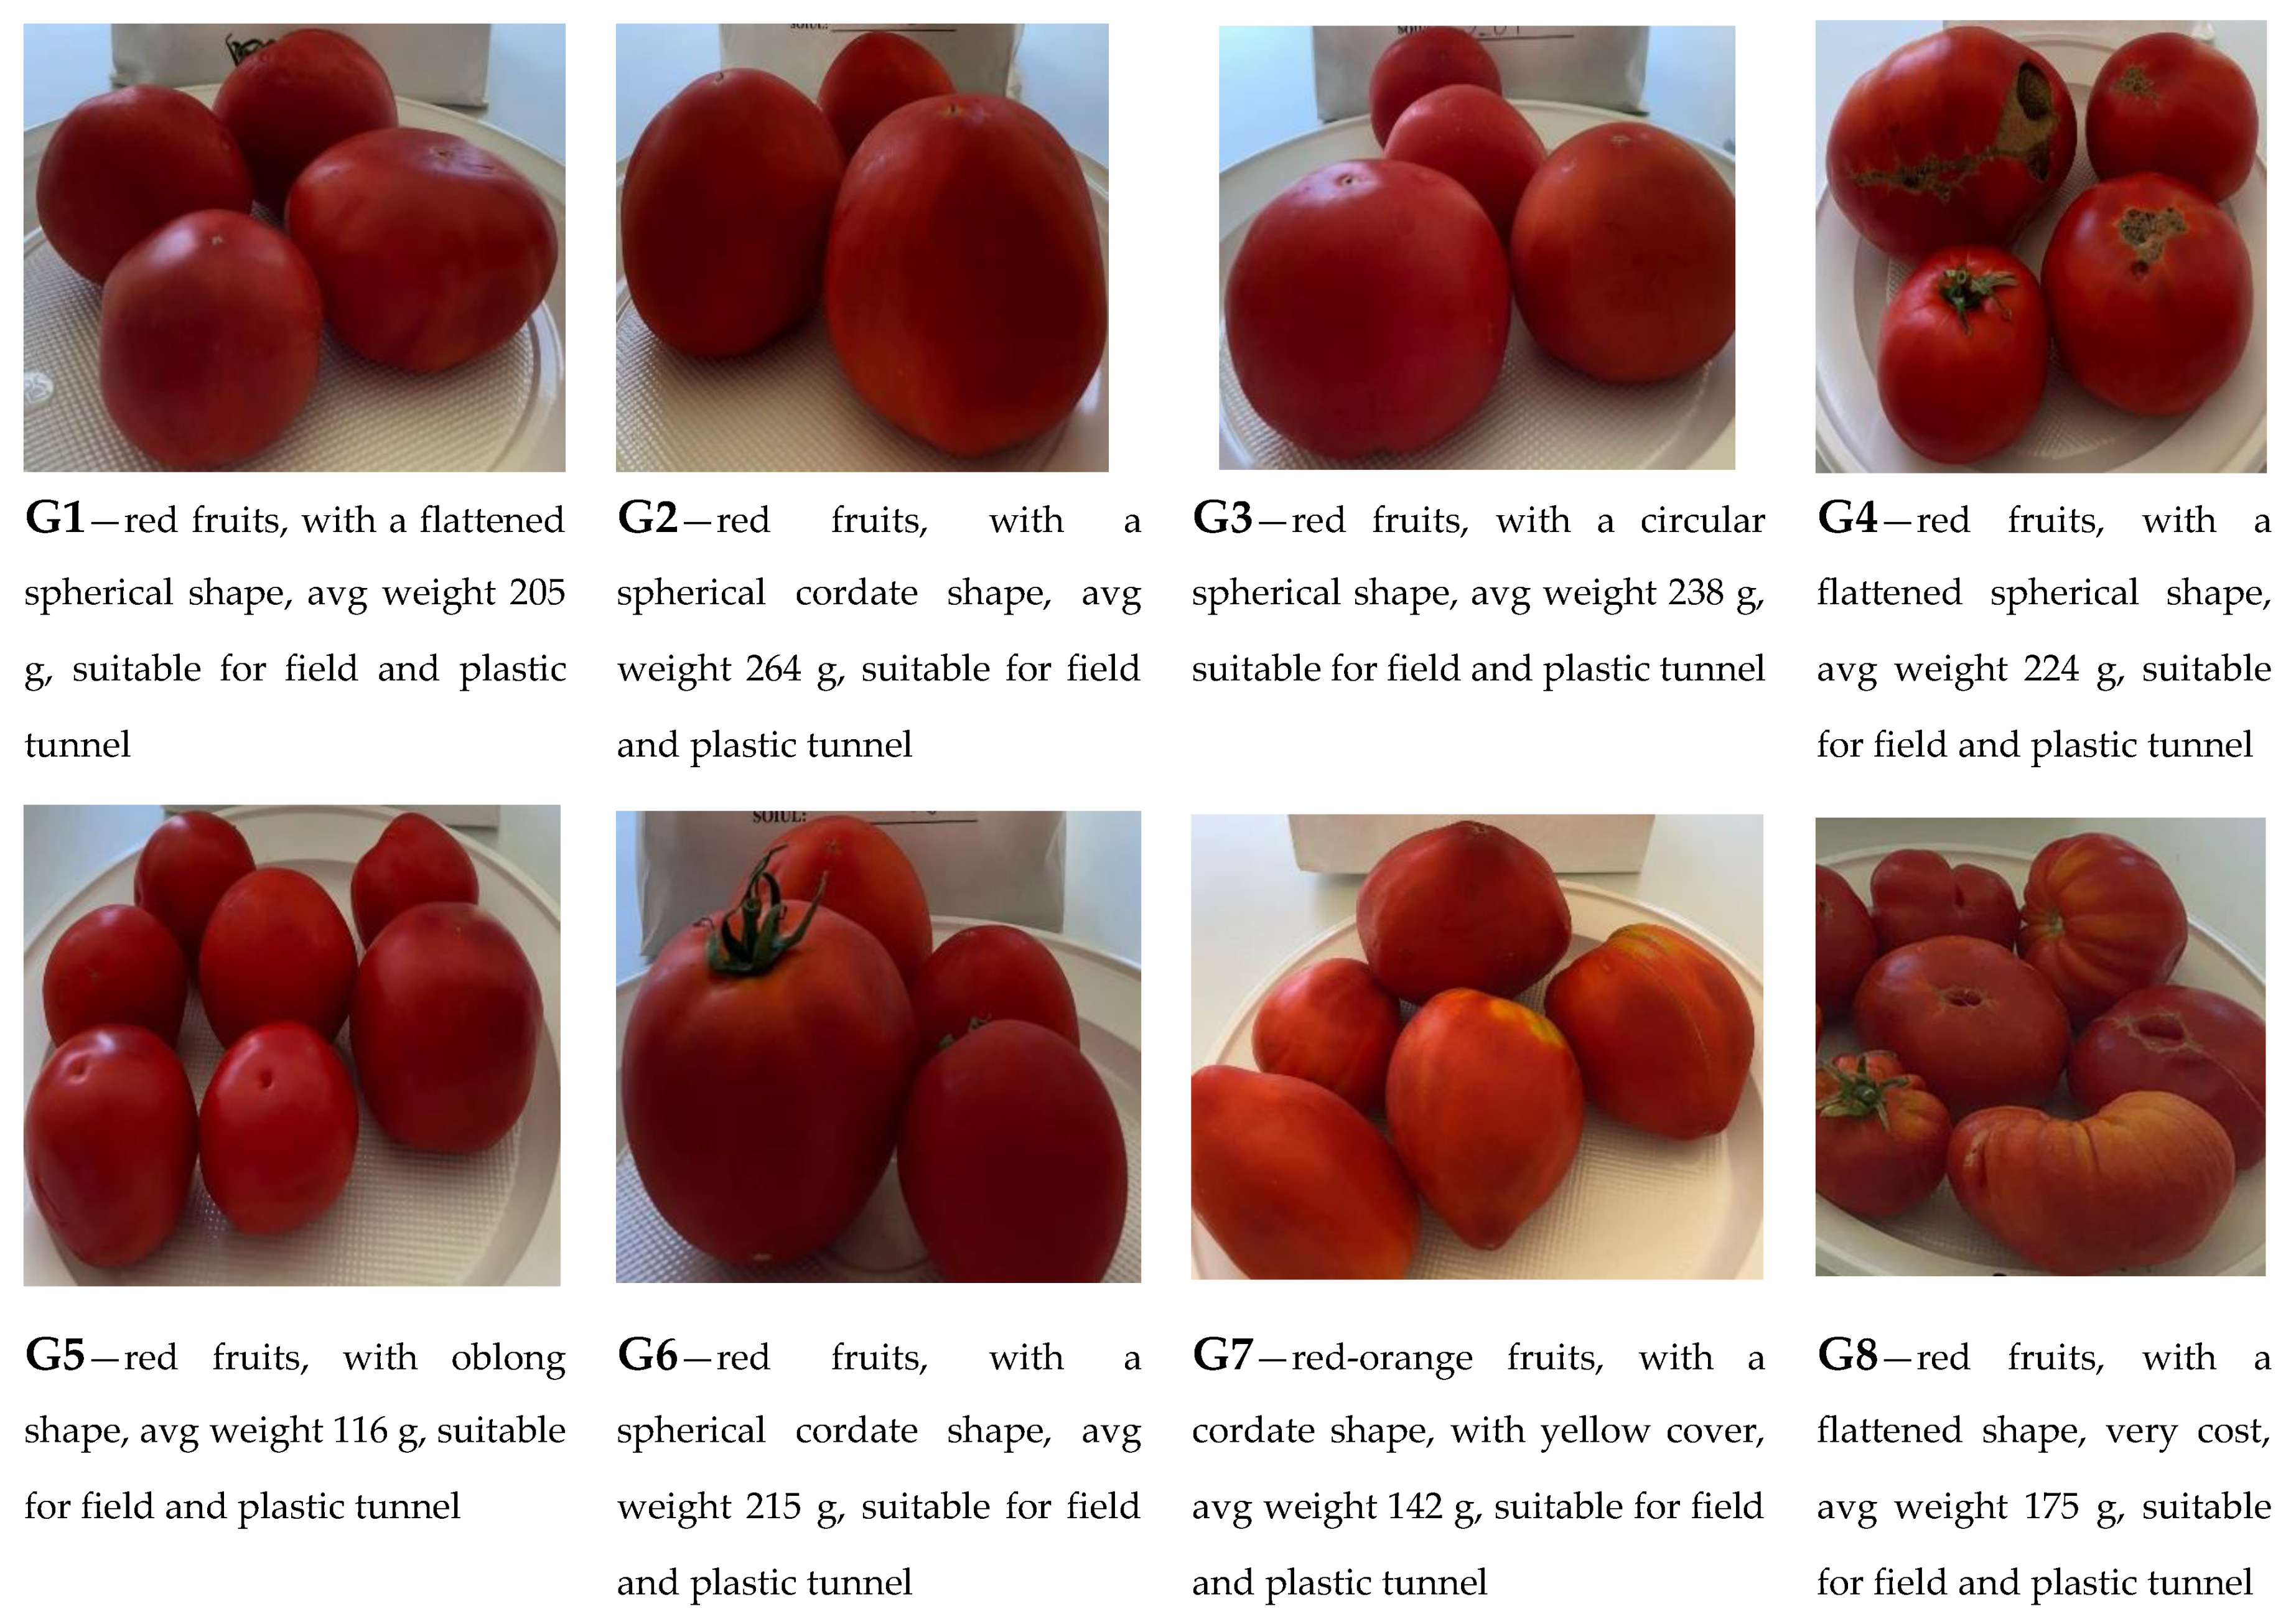
2.2. Genotype Resources

Genetic resources were identified and collected for ecological system cultivation resistant to pathogen attack from Bacau, Romania, representing breeding material, lines with free pollination. The plants were grown in plastic tunnel and field conditions.
These genotypes were coded with genotype 1, genotype 2, …, genotype 8. The genotypes are different, coming from different lines which the genetic factor was fixed. This experiment has been performed since 2016, and in this paper are presented only the data from period when genotypes were fixed. The samples were collected, packaged and transported in suitable conditions in a very short time in order to prevent fruit damage. The harvests began on 15 and 20 July and ended on 24 and 25 October in the 2019 and 2020 years, respectively.
The sowing was carried out on February 16th for plastic tunnel and March 16th for the experimental field. Plantlets were transplanted in the plastic tunnel on April 11 and in the field on May 11. The experimental facility covers an area of 576 m2 (288 m2 for open field and 288 m2 for plastic tunnel located at ≅ 20 m distance from each other) and it was laid out in a completely randomized design.
The randomized experimental field was displayed in four replicates, 9 m2 replicate /tomatoes variant, ensuring a density of 4.8 plants/m2 (in open field) and 2.4 plants/m2 (plastic tunnel area) with seedlings of 45 old days.
For both experimental fields, it was ensured mulched with black plastic film and drip irrigation. The irrigation of tomatoes was done by drip from May to August. It was used watering tape with a flow rate of 2 L/h with irrigation norm/vegetation period ≅ 89 m3 with the weight of irrigation pipes of 6.61 and length of 652 and the quantity per single distribution of 3.87 m3. No pollinators were used.
Cultural measures for fields and plastic tunnel were applied according to scientific literature [17]. For the control of green peach aphid attack and pests control in tomato experiments, it was applied the following treatments with products compatible with organic farming (Bactospeine against Helicoverpa armigera (with dose of 0.5 kg per hectare) two treatments with Bouille Bordelaise against tomatoes mildew attack (Phytophora infestans) (with dose treatment—0.75%), Konflic 0.3%, Bionid 0.5% and Neemex 0.3% were applied for attack of Aphids (green peach aphid—Myzus persicae Sulz). Konflic contains 50% potassium salt from vegetable oil extract and 50% bitter Quassia extract, organic botanical extracts with biostimulatory effect. Neemex is also an organic product obtained from oil extract from Azadiracta tree seeds that regulates growth.
The fertilization types consisted of the application of organic fertilizer (Organofert, Romania and Cropmax—100% Natural foliar fertilizer, Holland Farming BV, The Netherlands). The organic fertilizer represented by Organofert presents in its composition a natural mixture of protein enzymes that ensures the absorption of nitrogen from the atmosphere by stimulating the activity of certain bacteria in the soil with the following characteristics: pH: 7, N2: 2%, P2O5: 4.2%, K2O: 8.2%, Fe: 2%, Mg 2.1% and Ca: 5%. Cropmax is a concentrated foliar fertilizer with the following characteristics: pH: 7, N2: 0.2%, P2O5: 0.4%, K2O: 0.02%, Fe: 220 mg/L, Mg 550 mg/L and Ca: 10 mg/L.

2.3. Sample of Fruits

The quality of the tomato genotypes cultivated in organic conditions in the field or plastic tunnel systems is determined by total soluble solids (TSS), titratable acidity (TA) expressed in citric acid, maturity index (MI), flavor index (FI), dry matter (DM), ascorbic acid (Vitamin C), carotene, lycopene and pH value.
Organic tomatoes were evaluated from the quality point of view at the harvesting stage of maturity. The fruits were smooth, being harvested at red stage (6) of maturity, with average weight ≅ 175 g and °Brix = 5 on average. Fruits were harvested manually from each variant at each harvest, random from10 plants of each genotype for each system of growing. The fruits were harvested from 3 and 4 clusters each of them weighing 2000–2500 g, per each repetition for both crops so that they corresponded to uniformity of size and maturity (BBCH 803–804) for each population (Figure 1).

2.4. Sample Preparation for Analyses

Fruits samples was ground and homogenized using a Philips mixing robot HR 320/700 and then stored at 2 °C in refrigerated condition between analysis performing and stored at −18 °C for future analysis. From each variant, for each genotype, the sample, were analyzed in three replicates.
For vitamin C determinations for each samples it was taken 5 g of tomato and it was homogenized with 50 cm3 oxalic acid 2%.

2.5. pH Value Determination

The pH value was determined with potentiometer Hanna Instruments, from liquid samples, according to method 982.12 of the Association of Official Analytical Chemistry. The pH-meter was calibrated in the range 4.01, 7.01, 4.01 and the determination was performed at a temperature of 20 °C [18].

2.6. Total Soluble Solids Analysis

The total soluble solids content was quantified with a handheld portable refractometer with high precision, using homogenized pulps blended in a homogenizer. The results are expressed in °Brix, according to 932.12 methods [18]. Two measurements were performed for each homogenate sample and the results were expressed in °Brix.

2.7. Titratable Acidity Analysis

For the determination of titratable acidity (TA) the samples were homogenized with distilled water and titrated with 0.1 N NaOH until reaching 7.1 pH, according to method No. 942.15 of the [18]. The results were expressed in g acid citric per 100 g of pulp [19]. The results have been calculated using the following formula and expressed as percentages of citric acid content: %TA = (v × N × 100 × 0.0064)/m, where N is the normality of NaOH; 0.0064—conversion factor for citric acid; V—the volume of NaOH (mL) used at titration and m—the mass of tomato sample used (g) [20].

2.8. Maturity index (MI) and Flavor index (FI) calculation

The maturity index (MI) of the samples was calculated with the following formula:
°Brix of sample/Titratable acidity, MI = TSS/TA [21,22,23].
Flavor index (FI) was calculated with following formula: FI = TA + [(TSS/(20 × TA)]. Where: TA = titratable acidity, TSS = total soluble solids [21,22,23].

2.9. Dry Matter Analysis

The dry matter content of the tomatoes was determined by drying fresh homogenized samples without seeds in a forced air drying oven (Biobase, Jinan, China) at 103 ± 2 °C for 24 h until a constant mass was obtained [24].

2.10. Ascorbic Acid Analysis

The ascorbic acid is a hydrophilic constituent of fresh tomato [25], genotypes and it was measured using the AOAC method [26]. The samples were mixing with 40 ml of buffer (oxalic acid 2%) and was estimated by using 2,6-dichlorophenolindophenol dye titration method.

2.11. β-Carotene and Lycopene Analysis

Antioxidants as β-carotene and lycopene from organic tomato were extracted using petroleum ether and the quantitative dosing was performed spectrophotometric at different wavelengths respectively 452 nm for β-carotene and 472 nm for lycopene using the DLAB SfTP-UV 1100 spectrophotometer, China against them blank represented by petroleum ether [27].

2.12. Statistical Analysis

The results were reported as means ± standard errors. The ANOVA test was used to highlight the statistical significance among genotype characteristics and crop system differences. Where the differences were significant, Duncan’s test (p ˂ 0.05) multiple comparison tests was used. The software used was SPSS v21 (IBM Corp, Armonk, NY, USA).

3. Results

The effects of the genotype and crop system are presented in Table 2.
Mean values for the genotypes cultivated in the open field and plastic tunnel quality analyses, respectively TSS (°Brix), TA (citric acid %), maturity index and flavor index are summarized in Table 2.
The influence of the first experimental factor (crop system) on the pH value emphasis high value for all genotypes of tomato grown in the field, the average value being 4.41, with a statistically significant difference compared to the average value obtained for the plastic tunnel tomatoes. Regarding the influence of the second experimental factor (genotype) on pH value, it was noted that the highest values were obtained by genotypes 8, 7 and 1, the values being 4.47, 4.45 respectively 4.44. Those differences are significant compared to genotypes 6 (4.16), 4 (4.23) and 3 (4.27), the latter value showing the lowest pH values (Table 1).
The results obtained highlight that the highest sugar content, of 4.68 °Brix, was recorded for tomatoes from field culture, with not significant statistical differences. Regarding genotype factor, the soluble dry matter content varied within low limits, being between 4.05 °Brix and 5.30 °Brix, the values obtained showing, however significant statistical differences. The highest value, of 5.30 °Brix, was obtained by Genotype 7, while the lowest value, of 4.05 °Brix, was registered by Genotype 3.
The crop system factor (field or plastic tunnel) did not statistically influence the TA content (expressed in citric acid), differences were revealed to be not significant. However, a higher average value of TA (0.36 citric acid %) can be noticed in the case of genotypes harvested from the plastic tunnel culture.
After comparing the average values of each genotype, it observes that Genotype 6 is highlighted with a higher value of 0.54 citric acid %, the differences being significant compared to the rest of the genotypes analyzed. A minimum value of 0.26 citric acid % was identified in genotypes 7 and 8. The genotypes 1, 2, 3 and 4 recorded similar values (0.35 citric acid %; 0.29 citric acid %; 0.29 citric acid % and 0.34, 0.29 citric acid %), the differences being statistically not significant.
Regarding the influence of the crop location (field or plastic tunnel), the values of maturity and flavor indices did not show statistical differences. In the case of maturity index, the average value of the genotypes of 16.80, was higher for the tomatoes obtained in the field, while the flavor index recorded the highest average value in the case of tomato from the plastic tunnel, respectively 14.11 (Table 2).
Comparing the values of the MI following the influence of the genotype factor, it can notice the superiority of genotype 7, which registers a value of 22.55. at the same time, G6 is at the lower limit, with a value of 8.41. It can also be observed that genotypes 3 and 4 show close values of the maturity index. The genotype factor also influenced the variation of the flavor index, which showed values of 0.32 for G8 and 0.66 established for genotypes 6. The value that followed the minimum limit was 0.33, by genotype 7, while genotypes 1, 2, 3 and 4 determined close values of the flavor index, being significantly lower compared to those of genotype 6. According to Navez et al. [21] mention, the genotypes studied show values of flavor index lower than 0.7, so the tomato is considered as having little taste. Ilic et al. [28] obtained mean value of taste index in all tomatoes to all the cultivars higher than 0.85, which indicates that the tomato cultivars analyzed were tasty.
Regarding the pH values of organic tomato, the combined influence between the crop system and the chosen genotype determined a higher pH value in the case of the field x genotype 7 combinations (4.53), with statistically significant differences compared to the other variants. The minimum limit of pH value was 3.95 for the combination of plastic tunnel x genotype 6. Genotype 8 grown in the field showed a pH value (4.49) extremely close to that of genotype 1 established in the plastic tunnel (4.5). On the same note, genotypes 1 and 5 grown in the field showed the same pH values of 4.37, like that of genotype 7 established in the plastic tunnel (Table 3).
Analyzing the combined influence of the two factors, the highest soluble solids content was obtained for field variant x Genotype 7, highlighting statistically significant differences compared to the other variants experienced, except for the combination of plastic tunnel × Genotype 4. The lower limit was registered in the case of the plastic tunnel × Genotype 3 variant, with a 3.90 °Brix value. The soluble solid values its relatively homogeneous.
In the case of the maturity index, the interaction of the two factors studied (crop system and genotype) determined a maximum value of 29.43, at the level of the field × genotype 7 variant. At the opposite pole, the lowest value was recorded by the field × genotype 6 (8.22); plastic tunnel × genotype 5 (8.40) and plastic tunnel x genotype 6 (8.59) variants. At the same time, we can notice the close values obtained by the variants field × genotype 8; plastic tunnel × genotype 1; plastic tunnel x genotype 4; plastic tunnel x genotype 7; field × genotype 5; field × genotype 3, these being between 15.00 to 16.24 (Table 3). Araujo et al. [19] studied 14 cultivars grown in organic system which results are in agreement with current results referring to TSS, citric acid content and maturity index, respectively (TSS with values between 4–6%, citric acid content between 0.19 and 0.3% and MI between 16.78 and 27.84. Ilic Z. et al. [28] related that acidity tends to decrease with the maturity of the fruits while the sugar content increases. And in his study he obtained significantly greater maturity index in organic Amati fruit (11.7) and lower maturity index in conventional Elpida fruit (9.6) were found. The maturity index in this study (in majority genotypes studied) were higher, excepting G6 with 8.4 than those found by maturity index reported by [28] and therefore.
Comparing the experimental variants from the point of view of the flavor index, the field × genotype 6 variant with the upper limit of 0.70 is highlighted, this being followed by the variants plastic tunnel × genotype 5 and plastic tunnel × genotype 6 with the value of 0.62. The lower limit of 0.24 was established in the case of field × genotype 2 and plastic tunnel × genotype 8 variants (Table 3). It should be noted that the flavor index has an oscillating amplitude of the values.
Analyzing the influence of the interaction between the two experimental factors (crop system and genotype) on the titratable acidity, it can be seen that the field × genotype 6 variant showed a maximum value of 0.57 g citric acid·100 L−1, closely followed by the plastic tunnel × genotype 5 variants and plastic tunnel × genotype 6, each with a value of 0.51 g citric acid·100 L−1. The minimum value of 0.19 g citric acid·100 L−1 was recorded by each of the variants field × genotype 2, field × genotype 7 and plastic tunnel × genotype 8.
From Table 3 it can be easy to observe that most of the values obtained from the analysis of titratable acidity in tomato genotypes showed an oscillating amplitude.
Mean values for the analyses of organic tomato nutritional value, such as dry matter, β-carotene, lycopene and ascorbic acid are summarized in Table 4.
Following the statistical analysis of Table 4, it can be observed that the crop system influences the dry matter content, the higher value being recorded for the genotypes harvested from plastic tunnel culture, respectively 11.19 g·100 g−1 F.W. The dry matter content also varied with genotype factor, the highest value (11.64 g·100 g−1 F.W.) being founded for genotype 8, with statistically significant differences compared to genotypes 2 with 7.45 g·100 g−1 F.W., genotype 4 (7.65 g·100 g−1 F.W.) and genotype 6 (7.66 g·100 g−1 F.W.). In the literature there are data published by authors such as Caruso G. et al. [29] who found values for dry matter of tomatoes of 8.9–9%. Frusciante et al. [30] founded high concentration of DM for some tomato lines such as 12.34% for 1447 and 1513 lines, 13.4% for Heline lines, 13.97% for Mamor line, 14.19% for Poly27 line, 14.83% for Stevens line and 20.04% for Poly20 line. Also, Hallmann et al. [31] showed statistically significant differences in the content of dry matter in tomato fruits between 5.97% for Kmicic cultivar and 13.09% for Koralik cultivar.
Results regarding the vitamin C content highlighted that the crop system had a major influence, being recorded the highest value of 18.57 mg·100 g−1 F.W. in the case of organic tomatoes from the field, with statistically significant differences compared to the varieties cultivated in the plastic tunnel. These results are in accord with those presented by Hallman et al. [32].
Dumas et al. [33] consider that the high level of vitamin C found in tomatoes grown in the field is the result of exposure to direct light which involves the accumulation of this antioxidant in higher quantities. This phenomenon can be explained by the fact that the level of vitamin C increases if the plant is grown under low nitrogen availability conditions, as full sunlight and drought.
Analyzing the content of vitamin C in relation to the second factor studied, the genotype, it can notice a variation within very wide limits of ascorbic acid, the highest value (21.50 mg·100 g−1 F.W.) being founded on genotype 8. That values shows statistically significant differences compared to genotypes 3 (9.86 mg·100 g−1 F.W.), genotypes 6 (11.35 mg·100 g−1 F.W.), genotypes 1 (12.63 mg·100 g−1 F.W.) and genotypes 4 (13.10 mg·100 g−1 F.W.).
Following the analysis of the level of carotene and lycopene in organic tomato, regarding the crop system factor, it can be noticed higher values in plastic tunnel crops (8.72 mg·100 g−1 F.W. respectively 8.44 mg·100 g−1 F.W.) with statistically significant differences, following the comparison with field tomatoes.
The influence of genotype on carotene content emphasis the highest value (8.86 mg·100 g−1 F.W.) on genotype 8, indicating statistically significant differences compared to the value obtained by genotype 5 (6.26 mg·100 g−1 F.W.). The other genotypes tested showed a carotene content with not significant statistical differences.
It is highlighted that the increased stress of tomato genotypes grown in organic conditions has led to oxidative stress, which results in the synthesis of vitamin C, carotene, lycopene and phenolic compounds [34] in higher quantities [32] which respond to their defense mechanism.
The genotypes studied influenced the lycopene content which values varied within low limits, with values between 8.39 mg·100 g−1 F.W. for genotype 3 and 5.69 mg·100 g−1 F.W. in the case of genotype 6, the differences being significant in terms of statistical analysis.
Regarding the lycopene content, the combined influence of the two factors studied highlight statistically significant differences, except for the variants field × genotype 3 and plastic tunnel × genotype 8, which recorded values of 8.16 mg·100 g−1 F.W., respectively 8.12 mg·100 g−1 F.W. The lycopene content recorded the highest value, of 9.53 mg·100 g−1 F.W. in the plastic tunnel × genotype 2 variant, while the lowest value, of 3.60 mg·100 g−1 F.W. was identified in the case of the field × genotypes 6 combinations.
For vitamin C content, the combined influence of the two factors generated superiority values in the case of genotypes cultivate in the field compared to those cultivated in the plastic tunnel. The highest content of vitamin C was resulted in genotype 8 cultivate in the field (29.21 mg·100 g−1 F.W.), while the lowest value of this antioxidant was recorded in genotype 3 cultivate in the plastic tunnel (6.51 mg·100 g−1 F.W.). The combination of the crop system and the genotype of tomato determined statistically differences in vitamin C content, excepting the following variants: field × genotype 4 (14.41 mg·100 g−1 F.W.) and plastic tunnel × genotype 7 (14.34 mg·100 g−1 F.W.); plastic tunnel × genotype 1 (9.67 mg·100 g−1 F.W.) and plastic tunnel × genotype 2 (9.50 mg·100 g−1 F.W.); field × genotype 6 (11.61 mg·100 g−1 F.W.) and plastic tunnel × genotype 4 (11.87 mg·100 g−1 F.W.) (Table 5).
Following the combination of the two factors studied the plastic tunnel × genotype 8 variant was highlighted, which registered the highest value of the dry matter, of 16.21 g·100 g−1 F.W., while the field × genotype 2 variant presented the lowest value of the dry matter. In most cases, the differences were statistically significant, excepting the following variants: field × genotypes 4 (5.57 g·100 g−1 F.W.) and field × genotype 6 (5.32 g·100 g−1 F.W.) followed by field × genotype 3 (6.55 g·100 g−1 F.W.), field × genotype 5 (6.25 g·100 g−1 F.W.) and field × genotype 7 (6.39 g·100 g−1 F.W.). It is important to note that all eight genotypes grown in the plastic tunnel recorded higher values of the dry matter content than the genotypes cultivated in the field. It should be mentioned that dry matter shows homogenity depending on the crop system for most of the cultivated genotypes.
The combined influence of the two factors studied highlighted that the highest carotene content belongs to the plastic tunnel × genotype 8 variant (11.30 mg·100 g−1 F.W.), while the lowest value of this pigment was determined in the variant field × genotype 6 (4.40 mg·100 g−1 F.W.). For this parameter, in most cases, statistically significant differences were obtained (Table 5).

4. Discussion

According to Grierson and Kader, [35] ripe tomato shows changes in some synthesized chemical components, such as pigments (β-carotene and lycopene), aromatic compounds and some acids such as (citric and malic), components that are largely responsible for the color, flavor and taste production. Brezeanu et al. [36] report that the significant climate changes registered over the past few years have demonstrated the vital importance to preserve our natural resources (especially vegetal genetic resources, land, and water) to ensure a steady food supply to all people.
The pH values founded for organic tomato may be related to a higher concentration of organic acids (mainly citric and malic acids) in its pulp fraction. Tigist et al. [37] reported a significant effect of the storage period on pH value and its increasing with the storage period. Tigist et al. [37] related that the amount of organic acids usually decreases during maturity, because they are the substrate of respiration. The most important factors that influence the pH values of tomatoes are variety and stage of maturity.
An important way of maintaining vitamin C level is to reduce the pH value of tomato juice (acidification of the juice). By maintaining the pH values close to 2, it creates a stabilizing effect of tomato juice is created, and for fresh tomato, it must maintain the pH value at 4 [38] this level being considered favorable for the preservation and storage.
Total soluble solids is one of the most important quality factors for tomato representing a great part (75%) of the total solids content, being an indicator of sweetness since fructose and glucose are the main components of tomatoes [39]. The soluble solids include organic acids, minerals, pigments and lipid besides and a very small quantity of sucrose [40]. Our results for soluble solids content (from 3.4 to 4.8 °Brix) are comparable with those of other researchers from Romania and with those provided by Tudor, 2016 [40]. In the Lumpkin [41] study on organic products, soluble solids content varied from 3.4 to 4.9 °Brix. Reported to the current researches is highlighted that means values for the soluble solids of organic tomato are higher, respectively 4.55 to 4.68 °Brix. Toor et al. [42] related that different types of fertilizers highlighted no significant differences in the dry matter and solid content. Sugar levels in tomatoes rise when phosphorus levels from the plant are low concerning other elements [43].
Regarding the titratable acidity of tomatoes grown with grass-clover mulch, there were identified significantly higher values than those of tomatoes grown with other treatments. This was related to the low amount of S available to the plants under that treatment. The titratable acidity for organic tomato grown in Taiwan by Lumpkin [41] showed values between 0.34 to 0.5 citric acid%.
The physicochemical results of 14 experimental and commercial organic fresh tomatoes [19] presented for all cultivars reasonable quality, with TSS/TA ratio values higher than 16 and soluble solids higher than 4 °Brix [19].
Frusciante, [30] showed that dry matter is mainly determined by dietary fiber and organic acid content which have a role in antioxidant capacity determination with a mean value of 5.5%.
Several studies [44,45] referred to the dry matter content, present the average values between 5.09–9.49 g·100 g−1 F.W. The average value for present research varied between 7.45 and 11.64 g·100 g−1 F.W. Also, it is specified that it was no evidence of varietal interaction, by farm, excepting ascorbic acid where farm type effect differed by variety.
Regarding the vitamin C content obtained by Lumpkin in his researches [41], it is highlighted that those were framed in the interval 18.26–33.77 mg·100 g−1 F.W., results that are superior in terms of value compared with those obtained in current research. Other studies presented values of vitamin C for different tomato varieties with mean values between 2.20–21 mg·100 g−1 F.W. [38,45,46].
The values presented are similar in current research varying between 9.86 to 21.50 mg·100 g−1 F.W.
The content of vitamin C founded in organic tomatoes grown in the field and plastic tunnel harvested in the maturity stage are in accord with those related by Abushita et al. [46] and Giovanelli et al. [47].
Oliveira, [48] reported that organic tomatoes accumulate a higher quantity + 55%. Other studies refer to the fact that ascorbic acid increased by 29% by using chicken manure and glass clover mulch higher than in the tomatoes grown using the mineral nutrients solutions [42]. Given that ascorbic acid is sensitive at high temperature, Stone et al. [49] have obtained results for tomatoes which show that they decrease to 17.52 mg·100 g−1 F.W. for organic fruits. The amount of ascorbic acid in organic tomatoes increases with organic fertilizer [42].
Frusciante et al. [30] studied the antioxidant value of tomato and emphasis that vitamin C content showed a significant variation among lines with the highest value of 16.3 mg·100 g−1 F.W. and the lowest of 11.4 mg·100 g−1 F.W. Similar results have been obtained in current researches, highlighting many significant differences between genotypes for the content of vitamin C.
β-Carotene (vitamin A precursor) is associated with chloroplasts, first as an antioxidant and energy transporter, reducing when their proliferation is limiting (e.g., in conditions of nitrogen lack) [50].
The results obtained by Lumpkin, [41]; regarding the β-carotene content from organic tomatoes were framed between 0.35 mg·100 g−1 F.W. and 0.64 mg·100 g−1 F.W. values that varied by type of soil, geographical location of the farm system. It should be noted the lower β-carotene significantly reduces, compared with the values from the current research (5.67–8.72 mg·100 g−1 F.W.).
Frusciante et al. [30] analyzed the nutritional value of 18 tomato genotypes to obtain significant variation among all analyzed genotypes for lycopene and β-carotene content. Several studies presented values of β-carotene for different varieties of tomato with mean values between 0.11 and 1.07 mg·100 g−1 F.W. [44,45,46]
Referring to the growing system, Hallman et al. [32] and Carris-Veyrat et al. [51] related that organic tomato contained β-carotene (1.23 mg·100 g−1 F.W.) compared to conventional ones (0.87 mg·100 g−1 F.W.).
Ilahy et al. [52] conducted a study on tomato lycopene content and related that Rio Grande tomatoes variety contains about 9.7 mg·100 g−1 F.W. while for varieties with a high lycopene content the values can vary from 18.4 to 25.4 mg·100 g−1 F.W. Other studies provide information on kinetics degradation of lycopene in tomato during hot air drying. Thus, Demiray et al. [25] found a lycopene content for fresh tomato of 50 mg·100 g−1 F.W. The result of this study was according to those reported by Chawla et al. [53] in which fresh tomatoes showed an average lycopene value of 54 mg·100 g−1 F.W. The results of this study are in agreement with those presented by Chawla et al. [53] in which fresh tomato showed an average lycopene value of 54 mg·100 g−1 F.W.
The lycopene content of current research for genotypes cultivated in the plastic tunnel was higher than those cultivated in the field with an average value of 8.44 mg·100 g−1 F.W. The range of variation of the lycopene content for the genotypes grown in plastic tunnel varied between the minimum limit of 5.9 mg·100 g−1 F.W. and the maximum of 9.53 mg·100 g−1 F.W. and for the tomatoes obtained in the field the values varied between the minimum of 3.6 mg·100 g−1 F.W. and the maximum of 8.16 mg·100 g−1 F.W. This results are in accord to those obtained by Stoleru et al. [1], which reports that carotene values vary depending on cultivar with lowest lycopene (8.84 mg·100 g−1 F.W.) recorded in the tomato fruits of the chemically fertilized plants and irrigated with 200 m3·ha−1 and higher lycopene concentration detected in tomato fruits on the organic fertilizer plants.
Massantini et al. [54] founded that the increase in N fertilization and the soil tillage could improve the tomato quality, thanks to the greater synthesis of lycopene which is the most important carotenoid of tomato for its antioxidant activity, thus representing an important factor of quality.
Araujo et al. [19] affirm that lycopene is the major carotenoid found in tomatoes, accounting for over 85% of all carotenoids detected. The lycopene content of tomatoes depends on several factors, including the level of nitrogen in the soil, as Massantini says in [54]. Also, the literature specifies that lycopene decreases by peeling with 15% for organic tomatoes. Farneti et al. [50] related that lycopene decreases when tomato is stored at 12 °C for some varieties, also emphasizing that some varieties are more sensitive to temperature variations. The decrease of the lycopene content induced by low-temperature storage may be caused by lycopene fragmentation.
The results for lycopene content for organic tomato grown in 4 farms in 2005 by Lumpkin et al. [41] showed values defined by the range of 5.6 to 9.4 mg·100 g−1 F.W., results that are in accord with the average values obtained in current research.
Literature presents values of lycopene for different varieties of tomato from different regions of the world with mean values between 1.86 to 14.62 mg·100 g−1 F.W [33,44,55,56].
Due to the high antioxidant value of improved tomato genotypes results in the current study, it is possible to identify qualitative genotypes unused at this moment and environmentally friendly practices to produce tomato in an organic system sustainably under continental climate conditions.

5. Conclusions

The antioxidant value of tomato (rendered by the content of vitamin C, carotene and lycopene) was significantly influenced by the crop system and variety.
From the perspective of nutritional value under organic tomato grown in the plastic tunnel had a higher average content for lycopene and β-carotene. The results showed that the ascorbic acid content presented higher values for organic tomatoes cultivated in the field for all genotypes studied, with an upper limit of 18.57 mg·100 g1 FW. These results were influenced by the exposure of tomato plants during the growing season to high temperatures and the direct incidence of sunlight, these compounds in plants case having a protective role. In contrast, the content in β-carotene and lycopene showed higher values for genotypes grown under plastic tunnel conditions. Significant statistical differences were noticed concerning the mean values of all genotypes according to cultivation conditions (field vs. plastic tunnel) for most parameters excepting total soluble solids (TSS), treatable acidity (TA), maturity index (MI) and flavor index (FI). This highlights the major importance of the selection of some genotypes of tomatoes that respond positively to the organic cultivation system in terms of the presence of the antioxidants compounds (vitamin C, lycopene, and carotene) in representative quantities. Genotype 3 is highlighted by the highest content in carotene (7.4 mg·100 g−1 F.W.) and lycopene (8.4 mg·100 g−1 F.W.) and genotype 5 by the highest content in vitamin C (16.8 mg·100 g−1 F.W.). The results of the study suggest that by applying appropriate techniques for growing organic tomatoes in the plastic tunnel system, the antioxidant substrate can be optimized compared to the results obtained for the field system. The interaction of the two factors (crop system and genotype) on the content of vitamin C, β-carotene and lycopene showed significant differences in the most cases.
Among the chemical compounds present in organic tomatoes, the amount of β-carotene and lycopene appears as a parameter to improve the commercial value of tomato production based on the nutritional benefits obtained from their consumption.

6. Patents

The 8 tomato genotypes represented the biological material in current researches are represented by lines being in process of approval for patent purposes.

Author Contributions

Conceptualization, P.M.B., C.B. and O.C.M.; methodology, O.C.M., T.R., A.E.T., software, P.M.B., L.-D.P.; validation, L.M.I., V.S.; formal analysis, O.C.M., C.D.J., A.E.T.; investigation, C.B., P.M.B.; resources, P.M.B., O.C.M.; data curation, L.-D.P., F.M.; writing—original draft preparation, O.C.M., F.M.; writing—review and editing, O.C.M.; visualization C.B., T.R., V.S.; supervision, P.M.B., T.R.; project administration, O.C.M.; funding acquisition, P.M.B. All authors have read and agreed to the published version of the manuscript.

Funding

This work was supported by a grant of the Romanian Minister of Research and Innovation, UEFISCDI, project number PN-III-P1-1.2-PCCDI-2017-0850/contract 14 PCCDI/2018.

Institutional Review Board Statement

Not applicable.

Informed Consent Statement

Not applicable.

Data Availability Statement

Authors ensure that data shared are in accordance with participant’s consent.

Conflicts of Interest

The authors declare no conflict of interest.

References

  1. Stoleru, V.; Inculet, S.C.; Mihalache, G.; Cojocaru, A.; Teliban, G.C.; Caruso, G. Yield and Nutritional Response of Greenhouse Grown Tomato Cultivars to Sustainable Fertilization and Irrigation Management. Plants 2020, 9, 1053. [Google Scholar] [CrossRef]
  2. Argento, S.; Melilli, M.G.; Branca, F. Enchancing greenhouse tomato-crop productivity by using Brassica macrocarpa Guss. Leaves for Controlling Root-Knot nematodes. Agronomy 2019, 9, 820. [Google Scholar] [CrossRef] [Green Version]
  3. Faostat. 2020. Available online: http://www.fao.org/faostat/en/#data/QC (accessed on 20 January 2021).
  4. Melilli, M.G.; Tringali, S.; Riggi, E.; Raccuia, S.A. Screening of genetic variability for some phenolic constituents of globe artichoke head. ISHS Acta Hortic. 2007, 730. [Google Scholar] [CrossRef]
  5. Brezeanu, P.M.; Brezeanu, C.; Ambarus, S.; Voda, A.; Robu, T.; Cristea, T.O.; Calin, M. The influence of grafting on yield and quality of peppers, eggplants, tomatoes and melons. Acta Hortic. 2020, 1270, 347–354. [Google Scholar] [CrossRef]
  6. Vinson, J.A.; Hao, Y.; Su, X.; Zubik, L.; Hao, Y.; Su, X.H. Phenol antioxidant quantity and quality in foods: Vegetables. J. Agric. Food Chem. 1998, 46, 3630–3634. [Google Scholar] [CrossRef]
  7. Wilcox, J.K.; Catignani, G.L.; Lazarus, C. Tomatoes and cardiovascular health. Crit. Rev. Food Sci. Nutr. 2003, 43, 1–18. [Google Scholar] [CrossRef]
  8. Fonseca, M.F.A.C. A Institucio Nalização dos Mercados de Orgânicos no Mundo e no Brasil: Uma Interpretação. Ph.D. Thesis, Universida de Federal Rural do Rio de Janeiro, Rio de Janeiro, Brazil, 2005. [Google Scholar]
  9. Bartley, G.E.; Scolnik, P.A. Plant carotenoids: Pigments for photoprotection, visual attraction, and human health. Plant Cell 1995, 7, 1027–1038. [Google Scholar]
  10. Clinton, S.K. Lycopene: Chemistry, Biology, and Implications for Human Health and Disease. Nutr. Rev. 1998, 56, 35–51. [Google Scholar] [CrossRef]
  11. Tonucci, L.H.; Holden, J.M.; Beecher, G.R.; Khachik, F.; Davis, C.S.; Mulokozis, G. Carotenoid Content of Thermally Processed Tomato-Based Food Products. J. Agric. Food Chem. 1995, 43, 579–586. [Google Scholar] [CrossRef]
  12. De Sio, F.; Rapacciuolo, M.; De Giorgi, A.; Trifirò, A.; Giuliano, B.; Morano, G.; Cuciniello, A.; Caruso, G. Yield, quality, antioxidant, and sensorial properties of diced tomato as affected by genotype and industrial processing in southern Italy. Acta Alim. 2019, 48, 132–141. [Google Scholar] [CrossRef]
  13. Stoleru, V.; Munteanu, N.; Istrate, A. Perception Towards Organic vs. Conventional Products in Romania. Sustainability 2019, 11, 2394. [Google Scholar] [CrossRef] [Green Version]
  14. Thybo, A.K.; Edelenbos, M.; Christensen, L.P.; Sørensen, J.N.; Thorup-Kristensen, K. Effect of organic growing systems on sensory quality and chemical composition of tomatoes. LWT 2006, 39, 835–843. [Google Scholar] [CrossRef]
  15. Council Regulation (EC) 834/2007 on Organic Production and Labelling of Organic Products and Repealing Regulation (EEC) 2092/91. Available online: https://www.legislation.gov.uk/eur/2007/834 (accessed on 10 May 2019).
  16. MADR Order 895/2016—Approval of the Rules Regarding the Organization of the Inspection and Certification System, of the Approval of the Inspection and Certification of the Organism/ Organism of Control and of the Supervision of the Activity of the Control Organism in Ecological Agriculture. Available online: https://www.google.com.hk/url?sa=t&rct=j&q=&esrc=s&source=web&cd=&ved=2ahUKEwjPnJf73LvxAhURGaYKHfy8AR0QFjAAegQIAhAD&url=https%3A%2F%2Fro.abg-cert.com%2Fwp-content%2Fuploads%2F2020%2F10%2FRomanian-Order-895-2016_updated-version_04-September-2020-003.pdf&usg=AOvVaw3wWwMs6K0TqYhceWfpD2Vs (accessed on 10 May 2019).
  17. Munteanu, N. Tomatele, Ardeii și Pătlăgelele Vinete; Editura “Ion Ionescu de la Brad”: Iași, Romania, 2003; p. 83. [Google Scholar]
  18. AOAC. Official Methods of Analysis of AOAC International, 21st ed.; AOAC: Gaithersburg, MD, USA, 2005. [Google Scholar]
  19. Araujo, C.J.; Silva, P.; Telhado, S.; Sakai, R.; Spoto, M.; Melo, P. Physico-chemical and sensory parameters of tomato cultivars grown in organic systems. Hortic. Bras. 2014, 32, 205–209. [Google Scholar] [CrossRef] [Green Version]
  20. Saad, A.G.; Jaiswal, P.; Jha, S.N. Non-destructive quality evaluation to intact tomato using VIS-NIR spectroscopy. Int. J. Adv. Res. 2014, 2, 632–639. [Google Scholar]
  21. Navez, B.; Letard, M.; Grassely, D.; Jost, M. Les criteres de qualite de la tomate. Infos-Ctifl 1999, 155, 41–47. [Google Scholar]
  22. Nielsen, S. Food Analysis, 3rd ed.; Kluwer Academic: New York, NY, USA, 2003. [Google Scholar]
  23. Hernández-Suárez, M.; Rodrígues-Rodrígues, E.M.; Diaz Romero, C. Chemical composition of tomato (Lycopersicon esculentum) from Tenerife, the Canary Islands. Food Chem. 2008, 106, 1046–1056. [Google Scholar] [CrossRef]
  24. AOAC. Official Methods of Analysis of AOAC International, 17th ed.; AOAC: Gaithersburg, MD, USA, 2000. [Google Scholar]
  25. Demiray, E.; Tulek, Y.; Yilmaz, Y. Degradation kinetics of lycopene, b-carotene and ascorbic acid in tomatoes during hot air drying. LWT Food Sci. Technol. 2013, 50, 172–176. [Google Scholar] [CrossRef]
  26. AOAC. Association of Official Analytical Chemists, 15th ed.; AOAC: Washington, DC, USA, 1990; pp. 1058–1059. [Google Scholar]
  27. Dobrin, A.; Nedeluș, A.; Bujor, O.; Moț, A.; Zugravu, M.; Bădulescu, L. Nutritional quality parameters of the fresh red tomato varieties cultivated in organic system. Sci. Pap. Ser. B Hortic. 2019, 63, 439–443. [Google Scholar]
  28. Ilic, Z.; Nikolaos, K.; Ljubomir, S. Tomato fruit quality from organic and conventional production. In V. Pilipavicius, Organic Agriculture towards Sustainability; Tech Europe: Rijeka, Croatia, 2014; pp. 147–169. [Google Scholar]
  29. Caruso, G.; Stefania, P.; Cozzolino, E.; Cucinello, A.; Cenvinzo, V.; Bonini, P.; Colla, G.; Rouphael, Y. Yield and nutritional quality of vesuvian pienollo tomato PDO as affected by farming system and biostimulant application. Agronomy 2019, 9, 505. [Google Scholar] [CrossRef] [Green Version]
  30. Frusciante, L.; Carli, P.; Ercolano, M.R.; Pernice, R.; Di Matteo, A.; Fogliano, V.; Pellegrini, N. Antioxidant nutritional quality of tomato. Mol. Nutr. Food Res. 2007, 51, 609–617. [Google Scholar] [CrossRef]
  31. Hallmann, E.; Rembialkowska, E. Comparison of the Nutritive Quality of Tomato Fruits from Organic and Conventional Production in Poland. Available online: http://orgprints.org/9944/ (accessed on 16 June 2021).
  32. Hallmann, E.; Lipowski, J.; Marszałek, K.; Rembiałkowska, E. The Seasonal Variation in Bioactive Compounds Content in Juice from Organic and Non-organic Tomatoes. Plant Foods Hum. Nut. 2013, 68, 171–176. [Google Scholar] [CrossRef] [Green Version]
  33. Dumas, Y.; Dadomo, M.; Di Lucca, G.; Grolier, P. Effects of environmental factors and agricultural techniques on antioxidant content of tomatoes. J. Sci. Food Agric. 2003, 83, 369–382. [Google Scholar] [CrossRef]
  34. Vallverdú-Queralt, A.; Jáuregui, O.; Medina-Remn, A.; Lamuela-Ravents, R.M. Evaluation of a method to characterize the phenolic profile of organic and conventional tomatoes. J. Agric. Food Chem. 2012, 60, 3373–3380. [Google Scholar] [CrossRef] [PubMed]
  35. Grierson, D.; Kader, D.D. Fruit Ripening and Quality. In The Tomato Crop, The Tomato Crop (A Scientific Basis for Improvement); Atherton, J.G., Rudich, J., Eds.; Springer: Dordrecht, The Netherlands, 1986; pp. 1389–1393. [Google Scholar]
  36. Brezeanu, C.; Robu, T.; Trofin, A.; Brezeanu, P.; Murariu, F.; Murariu, O.C. Research on the Physico-Chemical Characterization of Improved Genotypes for Lycopersicon Esculentum Mill. Obtained in the Ecological System. Lucr. Ştiinţifice Ser. Agron. 2020, 63. [Google Scholar]
  37. Tigist, M.; Workneh, T.S.; Woldetsadik, K. Effects of variety on the quality of tomato stored under ambient conditions. J. Food Sci. Technol. 2013, 50, 477–486. [Google Scholar] [CrossRef] [PubMed] [Green Version]
  38. Sulieman, A.M.E.; Awn, K.M.A.; Yousif, M.T. Suitability of some tomato (Lycopersicon esculentum Mill.) genotypes for paste production. J. Sci. Technol. 2011, 12, 45–51. [Google Scholar]
  39. Malundo, M.M.; Shewfelt, R.L.; Scott, J.W. Flavor quality of fresh tomato (Lycopersicon esculentum Mill.) as affected by sugar and acid levels. Postharvest Biol. Technol. 1995, 6, 103–110. [Google Scholar] [CrossRef]
  40. Tudor-Radu, M.; Vîjan, L.E.; Tudor-Radu, C.M.; Tiţa, I.; Sima, R.; Mitrea, R. Fruits Assessment of Ascorbic Acid, Polyphenols, Flavonoids, Anthocyanins and Carotenoids Content in Tomato. Not. Bot. Horti Agrobot. Cluj Napoca 2016, 44, 477–483. [Google Scholar] [CrossRef] [Green Version]
  41. Lumpkin, H.M. A Comparison of Lycopene and Other Phytochemicals in Tomatoes Grown under Conventional and Organic Management Systems; Technical Bulletin No. 34; AVRDC: Shanhua, Taiwan, 2005; p. 48. [Google Scholar]
  42. Toor, R.K. Factors Affecting the Antioxidant Composition of Tomatoes (Lycopersicon esculentum). Ph.D. Thesis, Lincoln University, Lincoln, New Zealand, 2004. Unpublished. [Google Scholar]
  43. Heldt, H.W.; Chon, C.J.; Maronde, D.; Herold, A.; Stankovic, Z.S.; Walker, D.A.; Kraminer, A.; Kirk, M.R.; Heber, U. Role of Orthophosphate and Other Factors in the Regulation of Starch Formation in Leaves and Isolated Chloroplasts. Plant Physiol. 1977, 59, 1146–1155. [Google Scholar] [CrossRef] [Green Version]
  44. Raffo, A.; Leonardi, C.; Fogliano, V.; Ambrosino, P.; Salucci, M.; Gennaro, L.; Bugianesi, R.; Giuffrida, F.; Quaglia, G. Nutritional value of cherry tomatoes (Lycopersicon esculentum cv. Naomi F1) harvested at different ripening stages. J. Agric. Food Chem. 2002, 50, 6550–6556. [Google Scholar] [CrossRef] [PubMed]
  45. Scalzo, J.; Politi, A.; Pellegrini, N.; Mezzetti, B.; Battino, M. Plant genotype affects total antioxidant capacity and phenolic contents in fruit. Nutrition 2005, 21, 207–213. [Google Scholar] [CrossRef]
  46. Abushita, A.A.; Daood, H.G.; Biacs, P.A. Change in carotenoids and antioxidant vitamins in tomato as a function of varietal and technological factors. J. Agric. Food Chem. 2000, 48, 2075–2081. [Google Scholar] [CrossRef] [PubMed]
  47. Giovanelli, G.; Lavelli, V.; Nobili, C.P.S. Variation in antioxidant components of tomato during vine and post-harvest ripening. J. Sci. Food Agric. 1999, 79, 1583–1588. [Google Scholar] [CrossRef]
  48. Oliveira, A.B.; Moura, C.F.H.; Gomes-Filho, E.; Marco, C.A.; Urban, L.; Miranda, M.R.A. The Impact of Organic Farming on Quality of Tomatoes Is Associated to Increased Oxidative Stress during Fruit Development. PLoS ONE 2013, 8, e56354. [Google Scholar] [CrossRef] [PubMed] [Green Version]
  49. Stone, M.B.; Soliah, L.; Craig, J. Ascorbic acid content, pH, and acceptability of home-canned tomatoes. Plants Foods Hum. Nutr. 1982, 31, 327–332. [Google Scholar] [CrossRef]
  50. Farneti, B.; Schouten, R.E.; Woltering, E.J. Low temperature-induced lycopene degradation in red ripe tomato evaluated by remittance spectroscopy. Postharvest Biol. Technol. 2012, 73, 22–27. [Google Scholar] [CrossRef]
  51. Caris-Veyrat, C.; Amiot, M.J.; Tyssandier, V.; Grasselly, D.; Buret, M.; Mikolajczak, M.; Guilland, J.C. Bouteloup-Demange, C.; Borel, P. Influence of organic versus conventional agricultural practice on the antioxidant microconstituent content of tomatoes and derived purees; consequences on antioxidant plasma status in humans. J. Agric. Food Chem. 2004, 52, 6503–6509. [Google Scholar] [CrossRef]
  52. Ilahy, R.; Hdider, C.; Lenucci, M.S.; Tlili, I.; Dalessandro, G. Antioxidant activity and bioactive compound changes during fruit ripening of high-lycopene tomato cultivars. J. Food Compos. Anal. 2011, 24, 588–595. [Google Scholar] [CrossRef]
  53. Chawla, C.; Kaur, D.; Oberoi, D.P.S.; Sogi, D.S. Drying characteristics, sorption isotherms, and lycopene retention of tomato pulp. Dry. Technol. 2008, 26, 1257–1264. [Google Scholar] [CrossRef]
  54. Massantini, R.; Radicetti, E.; Frangipane, M.T.; Campiglia, E. Quality of Tomato (Solanum lycopersicum L.) Changes under Different Cover Crops, Soil Tillage and Nitrogen Fertilization Management. Agriculture 2021, 11, 106. [Google Scholar] [CrossRef]
  55. Markovic, K.; HruÐkar, M.; Vahcic, N. Lycopene content of tomato products and their contribution to the lycopene intake of Croatians. Nutr. Res. 2006, 26, 556–560. [Google Scholar] [CrossRef]
  56. Lacatus, V.; Botez, C.; Chelu, M.; Popescu, N.; Voican, V. Chemical composition of tomato and sweet pepper fruits cultivated on active substrates. Acta Hortic. 1995, 412, 168–175. [Google Scholar] [CrossRef]
Figure 1. Sample analyzed represented by improved tomato genotypes: G1—Genotype 1; G2—Genotype 2; G3—Genotype 3; G4—Genotype 4; G5—Genotype 5; G6—Genotype 6; G7—Genotype 7; G8—Genotype 8.
Agriculture 11 00609 g001
Table 1. Meteorological conditions 2019–2020.
PeriodAir Temperature (°C)Solar Radiation (W/m2)VPD (kPa)Relative Humidity (%)Precipitation (mm)Wind Speed (m/s)EAG Soil Moisture (%)Soil Temperature (°C)
avgavgavgavgsumavgavgavg
2019202020192020201920202019202020192020201920202019202020192020
Sep25261671690.70.870.373.675.378.60.90.834.836.518.919.2
Aug30302302331.11.169.067.921.219.00.90.936.437.123.923.7
July28282342360.70.876.476.664.264.80.80.837.537.623.423.0
June29272312280.750.778.577.058.752.40.650.741.240.1322.421.2
May22201891850.550.676.472.6114.6110.81.21.3041.840.6914.914.60
VPD—Vapor Pressure Deficit (kPa); EAG Soil moisture—soil moisture at different deepness (%); avg—average; Sep—September; Aug—August.
Table 2. The influence of the crop system and genotypes on physicochemical parameters.
VariantpHTSS
(°Brix)
TA
Citric Acid %
MI
 
FI
 
Crop systems
OF 4.41 ± 0.01 4.68 ± 0.560.32 ± 0.0316.80 ± 1.370.39 ± 0.03
PT 4.29 ± 0.04 4.55 ± 0.110.36 ± 0.0214.11 ± 1.040.44 ± 0.03
*nsnsnsns
Genotypes
G 14.44 ± 0.03 a4.50 ± 0.23 bc0.35 ± 0.04 bc13.39 ± 1.00 cd0.43 ± 0.06 bc
G 24.38 ± 0.01 ab4.55 ± 0.03 bc0.29 ± 0.04 bc17.95 ± 2.80 abc0.35 ± 0.05 bc
G 34.27 ± 0.07 bc4.05 ± 0.28 c0.29 ± 0.02 bc14.23 ± 1.44 bcd0.35 ± 0.02 bc
G 44.23 ± 0.04 c5.00 ± 0.23 ab0.34 ± 0.01 bc14.86 ± 0.39 bc0.42 ± 0.01 bc
G 54.38 ± 0.00 ab4.20 ± 0.09 c0.38 ± 0.06 b12.23 ± 1.73 cd0.47 ± 0.07 b
G 64.16 ± 0.09 c4.55 ± 0.07 bc0.54 ± 0.01 a8.41 ± 0.12 d0.66 ± 0.02 a
G 74.45 ± 0.04 a5.30 ± 0.13 a0.26 ± 0.03 c22.55 ± 3.11 a0.33 ± 0.04 c
G 84.47 ± 0.01 a4.80 ± 0.05 b0.26 ± 0.03 c20.00 ± 2.24 ab0.32 ± 0.04 c
TSS—total soluble solids; TA—titratable acidity; MI—maturity index; FI—flavor index; OF—open field; PT—plastic tunnel; G1—Genotype 1; G2—Genotype 2; G3—Genotype 3; G4—Genotype 4; G5—Genotype 5; G6—Genotype 6; G7—Genotype 7; G8—Genotype 8; *—significant differences; ns—not significant differences; a—the highest value for the test performed. Within each column and within each experimental factor, different letters mean crop system and genotype differ significantly according to Duncan’s test at p ≤ 0.05.
Table 3. The influence of crop system × genotype on the physicochemical parameters.
VariantpHTSS
(°Brix)
TA
Citric Acid%
MI
FI
OF × G14.37 ± 0.01 fg5.00 ± 0.00 bc0.45 ± 0.00 c11.16 ± 0.03 e0.56 ± 0.00 c
OF × G24.40 ± 0.00 e4.60 ± 0.00 cdef0.19 ± 0.01 h24.17 ± 0.75 b0.24 ± 0.01 g
OF × G34.42 ± 0.00 d4.20 ± 0.61 efgh0.26 ± 0.00 g16.24 ± 2.49 c0.31 ± 0.00 f
OF × G44.32 ± 0.00 h4.50 ± 0.06 cdefg0.32 ± 0.01 f14.09 ± 0.33 cd0.39 ± 0.01 e
OF × G54.37 ± 0.01 fg4.10 ± 0.06 fgh0.26 ± 0.00 g16.07 ± 0.41 c0.31 ± 0.00 f
OF × G64.36 ± 0.01 g4.70 ± 0.06 cde0.57 ± 0.01 a8.22 ± 0.19 f0.70 ± 0.01 a
OF × G74.53 ± 0.00 a5.60 ± 0.00 a0.19 ± 0.01 h29.43 ± 0.91 a0.25 ± 0.01 g
OF × G84.49 ± 0.01 b4.80 ± 0.12 cd0.32 ± 0.01 f15.00 ± 0.09 c0.40 ± 0.01 e
PT × G14.50 ± 0.00 b4.00 ± 0.06 gh0.26 ± 0.00 g15.63 ± 0.08 c0.31 ± 0.00 f
PT × G24.36 ± 0.00 g4.50 ± 0.06 cdefg0.38 ± 0.00 d11.72 ± 0.08 e0.47 ± 0.01 d
PT × G34.13 ± 0.01 j3.90 ± 0.06 h0.32 ± 0.01 f12.21 ± 0.26 de0.38 ± 0.01 e
PT × G44.15 ± 0.00 i5.50 ± 0.06 ab0.35 ± 0.00 e15.63 ± 0.22 c0.45 ± 0.00 d
PT × G54.38 ± 0.00 ef4.30 ± 0.17 defgh0.51 ± 0.00 b8.40 ± 0.36 f0.62 ± 0.00 b
PT × G63.95 ± 0.00 k4.40 ± 0.00 defgh0.51 ± 0.00 b8.59 ± 0.02 f0.62 ± 0.00 b
PT × G74.37 ± 0.01 fg5.00 ± 0.00 bc0.32 ± 0.01 f15.67 ± 0.57 c0.40 ± 0.01 e
PT × G84.44 ± 0.00 c4.80 ± 0.00 cd0.19 ± 0.00 h25.00 ± 0.15 b0.24 ± 0.00 g
TSS—total soluble solids; TA—titratable acidity; MI—maturity index; FI—flavor index; OF—open field; PT—plastic tunnel; G 1—Genotype 1; G2—Genotype 2; G3—Genotype 3; G4—Genotype 4; G5—Genotype 5; G6—Genotype 6; G7—Genotype 7; G8—Genotype 8; a—the highest value for the test performed. Within each column, different letters mean significant differences between the crop system and genotype, according to Duncan’s test.
Table 4. The influence of the crop system and genotypes on the antioxidant compounds.
VariantDM
g·100 g−1 F.W.
Vitamin C
mg·100 g−1 F.W.
β-Carotene
mg·100 g1 F.W.
Lycopene
mg·100 g−1 F.W.
Crop systems
OF 6.16 ± 0.1618.57 ± 1.195.67 ± 0.196.03 ± 0.29
PT 11.19 ± 0.4911.12 ± 0.508.72 ± 0.268.44 ± 0.23
****
Genotypes
G110.65 ± 1.54 ab12.63 ± 1.33 bcd6.96 ± 0.52 ab7.81 ± 0.63 ab
G27.45 ± 1.15 b16.80 ± 3.27 abc6.60 ± 0.89 ab7.09 ± 1.09 ab
G38.04 ± 0.67 ab9.86 ± 1.50 d7.36 ± 0.09 ab8.39 ± 0.10 a
G47.65 ± 0.93 b13.10 ± 0.59 bcd6.61 ± 0.48 ab7.32 ± 0.79 ab
G58.26 ± 0.90 ab15.39 ± 1.37 abcd6.26 ± 0.60 b7.36 ± 0.85 ab
G67.66 ± 1.05 b11.35 ± 0.13 cd7.20 ± 1.25 ab5.69 ± 0.93 b
G78.06 ± 0.75 ab18.17 ± 1.72 ab7.72 ± 0.52 ab6.63 ± 0.33 ab
G811.64 ± 2.04 a21.50 ± 3.45 a8.86 ± 1.09 a7.61 ± 0.23 ab
DM—dry matter; OF—open field; PT—plastic tunnel; G1—Genotype 1; G2—Genotype 2; G3—Genotype 3; G4—Genotype 4; G5—Genotype 5; G6—Genotype 6; G7—Genotype 7; G8—Genotype 8; *—significant differences; a—the highest value for the test performed. Within each column and within each experimental factor, different letters mean crop system and genotype differ significantly according to Duncan’s test at p ≤ 0.05.
Table 5. The influence of the crop system and genotype on the antioxidant compounds.
VariantDM
g·100 g−1 F.W.
Vitamin C
mg·100 g−1 F.W.
β-Carotene
mg·100 g−1 F.W.
Lycopene
mg·100 g−1 F.W.
OF × G17.20 ± 0.12 f15.59 ± 0.12 e5.79 ± 0.02 k6.40 ± 0.01 i
OF × G24.90 ± 0.06 i24.10 ± 0.29 b4.62 ± 0.05 n4.65 ± 0.03 m
OF × G36.55 ± 0.16 g13.20 ± 0.06 h7.15 ± 0.03 h8.16 ± 0.02 e
OF × G45.57 ± 0.10 h14.41 ± 0.12 f5.53 ± 0.04 l5.55 ± 0.03 k
OF × G56.25 ± 0.03 g18.46 ± 0.09 d4.91 ± 0.02 m5.45 ± 0.03 l
OF × G65.32 ± 0.19 h11.61 ± 0.12 j4.40 ± 0.03 o3.60 ± 0.02 n
OF × G76.39 ± 0.12 g22.00 ± 0.35 c6.56 ± 0.03 i7.35 ± 0.03 g
OF × G87.07 ± 0.06 f29.21 ± 0.12 a6.41 ± 0.01 j7.10 ± 0.00 h
PT × G114.09 ± 0.05 b9.67 ± 0.04 l8.12 ± 0.01 e9.22 ± 0.00 b
PT × G210.00 ± 0.29 cd9.50 ± 0.00 l8.58 ± 0.05 d9.53 ± 0.02 a
PT × G39.53 ± 0.02 e6.51 ± 0.00 m7.56 ± 0.03 g8.62 ± 0.00 d
PT × G49.72 ± 0.01 de11.78 ± 0.01 j7.68 ± 0.05 f9.08 ± 0.01 c
PT × G510.27 ± 0.02 c12.32 ± 0.01 i7.60 ± 0.03 fg9.27 ± 0.02 b
PT × G610.00 ± 0.12 cd11.09 ± 0.00 k10.00 ± 0.03 b7.78 ± 0.01 f
PT × G79.73 ± 0.01 de14.34 ± 0.00 f8.88 ± 0.01 c5.90 ± 0.06 j
PT × G816.21 ± 0.01 a13.78 ± 0.00 g11.30 ± 0.01 a8.12 ± 0.05 e
DM—dry matter; OF—open field; PT—plastic tunnel; G1—Genotype 1; G2—Genotype 2; G3—Genotype 3; G4—Genotype 4; G5—Genotype 5; G6—Genotype 6; G7—Genotype 7; G8—Genotype 8; a—the highest value for the test performed. Within each column, different letters mean significant differences between the crop system and genotype, according to Duncan’s test.
Publisher’s Note: MDPI stays neutral with regard to jurisdictional claims in published maps and institutional affiliations.

