Article

InDel Markers Based on 3K Whole-Genome Re-Sequencing Data Characterise the Subspecies of Rice (Oryza sativa L.)

State Key Laboratory of Hybrid Rice, Key Laboratory for Research and Utilization of Heterosis in Indica Rice of Ministry of Agriculture, Engineering Research Center for Plant Biotechnology and Germplasm Utilization of Ministry of Education, College of Life Science, Wuhan University, Wuhan 430072, China
*
Author to whom correspondence should be addressed.
These authors contributed equally to this work.
Submission received: 15 June 2021 / Revised: 8 July 2021 / Accepted: 9 July 2021 / Published: 11 July 2021
(This article belongs to the Special Issue Molecular Quantitative Genetics Applied to Plant Breeding)

Abstract

:
A molecular marker is a valuable tool in genetic research. Insertions–deletions (InDels) are commonly used polymorphisms in gene mapping, analysing genetic diversity, marker-assisted breeding, and phylogenetics. The 3000 Rice Genome Project, a re-sequencing project, discovered millions of genome-wide InDels. We found that the proportion of >50-bp long InDels (699,475) of the total (1,248,503) is 56.02%. The number of InDels on each chromosome was consistent with the corresponding chromosome length. The maximum InDels were on chromosome 1 (78,935), and the minimum InDels were on chromosome 9 (41,752), with an average density of 1.87 InDels/kb (range: 1.50–2.36 InDels/kb). Furthermore, 96 InDels of about 3.98 Mb/InDel were selected to detect the polymorphism. The results exhibited ideal performance in 2% agarose gel electrophoresis. Phylogenetic analysis exhibited that InDel markers had excellent polymorphisms between rice varieties of japonica and indica, and varieties could be classified based on the statistical results of their polymorphisms. The InDel markers could be applied to identify the recombinant inbred lines in a population. These results reveal that the high-density long InDel markers could help us examine the functional diversity, species variation, and map-based cloning.

1. Introduction

Rice (Oryza sativa) feeds more than a half of the global population. Globally, approximately two billion people chronically suffer from hunger or food shortage [1]. With the increasing population and environmental destruction, food security problems are becoming quite severe. Therefore, increasing the yield is important in cereal crop research and breeding. As an effective tool, various molecular markers including restriction fragment length polymorphisms (RFLP), random amplified polymorphic DNA (RAPD), microsatellite or simple sequence repeat (SSR), single nucleotide polymorphisms (SNPs), and insertions–deletions (InDels) have been successfully developed and applied widely since the 1980s [2,3,4,5,6,7].
As the first generation of molecular marker technology, RFLP plays an important role in inchoate molecular breeding and genetic research. However, it is based on southern blotting, with drawbacks of a tedious operating process, long detection period, and high cost in large-scale molecular breeding [8]. RAPD is a molecular marker technology that requires a random primer (8–10 bases) to amplify DNA fragments by using polymerase chain reaction (PCR). However, it has limitations associated with gene mapping and linkage mapping because it only applies to dominant inheritance and cannot recognise heterozygous loci [9]. SSR markers mainly comprise 2–4 repeat sequences, which are widely distributed in different locations of the genome. Owing to the high stability and repeatability, this method is widely used in rice research [2,10]. SNP refers to the insertion, deletion, or substitution of a base between different alleles at the same locus [11]. SNP has higher polymorphism and frequency than SSR molecular marker in the biological genome, which is widely applied in genotyping arrays, molecular marker-assisted breeding, and identification of germplasm resources [12].
With the continuous completion of plant genome DNA sequencing and the rapid development of comparative genomics research, extensive biological information has become available for plant research and genetic breeding [13]. InDels are widely present in plant genomes and are mainly caused by transposable element movement, replication, and slip and unequal exchange within the genome [14,15]. Using the basic local alignment search tool (BLAST) to thoroughly compare the total genomic DNA sequences of the same species in different individuals or related species of the same species, many InDels, ranging from 1 bp to 1000 bp, were identified. More than 99% of the InDels were <50 bp in length, with an average length of 36 bp [15,16,17]. According to the analysis of InDel site sequence, InDels are grouped into five clades: (1) InDels of single-base pairs, (2) monomeric base-pair expansions, (3) multibase-pair expansions of 2–15 bp repeat units, (4) transposon insertions, and (5) InDels containing random DNA sequences [17]. InDels are widely distributed in the genome. The distribution and density of InDels are next to those of SNPs and much higher than those of SSR [18]. In the human genome, the average InDel density within genes is the presence of an InDel per 6.3 kb, which is similar to the average InDel density of the whole genome (an InDel per 7.2 kb) [17]. The average density in the rice genome is approximately an InDel per 953 bp [13]. InDel markers have been widely used for genetic studies in wheat, Arabidopsis, citrus, and rice [19,20,21,22]. As a membrane protein, ALMT1 facilitates an aluminium-stimulated malate efflux. Researchers have developed repetitive InDel markers (ALMT1-SSR3a and ALMT1-SSR3b) to screen 20 diverse wheat genotypes and identified six allele variants at the ALMT1SSR3 locus [19]. InDels have been used to successfully distinguish the seven common Arabidopsis accessions, and more than 35 mutations in the Col-03×Ws-4 combination were characterised [20]. In rice, InDel markers have been applied in the classification of nine blast resistance genes at the Piz, Piz-t, Pit, Pik, Pik-m, Pik-p, Pita, Pita-2, and Pib loci [22]. Based on the genome sequence of Nipponbare (Oryza sativa, Japonica) and 93-11 (Oryza sativa, Indica), 479,406 InDels were identified, and the correlation between InDels and SSR markers was analysed, which indicated that InDels would be very useful for rice gene cloning [13].
With advances in next-generation sequencing technologies (NGS), studies on rice have significantly improved our knowledge of the genome-wide genetic variation [23]. The Chinese Academy of Agricultural Sciences, BGI-Shenzhen, and the International Rice Research Institute conducted the 3000 Rice Genome Project (3K-RG), which is a re-sequencing project. Many SNPs and InDels that would help in rice genomics research and breeding have been identified [24,25,26]. Pid3, as a rice blast resistance gene, 71 polymorphic loci, and 40 haplotypes were identified using the 3K-RG sequencing. A new allele was found, which provided a new idea for rice breeding: the use of new disease resistance genes [27]. Soil salinity is the major factor affecting the growth and yield of rice. To identify new salt tolerance genes, researchers used 664 cultivated rice varieties from the 3K-RG sequencing for salt tolerance treatment combined with whole-genome association analysis and haplotype analysis, which laid a foundation for the molecular breeding and functional analysis [28]. Kaur et al. (2020) identified the relationship between 12-bp InDel and plant salt tolerance by using the SNP-Seeking database and found that the 12-bp InDel can be used for differentiating between indica and japonica varieties [29,30]. In the past several decades, the origin of rice domestication has been controversial. Research on genetic diversity of rice originated from two hypotheses of domestication: (1) indica and japonica rice arose from two independent domestication events and (2) indica rice was developed from crosses between japonica rice and wild rice [31,32,33]. Based on the 3000 rice varieties, 32 retrotransposon families were successfully identified using the newly developed TRACKPOSON software, and the plant origin was detected through the insertion of retrotransposons. The authors concluded that rice may have originated from three independent events [34].
The 3K-RG re-sequencing project has identified 29 million SNPs and 2.4 million small InDels [24]. The data are mainly focused on genome variation, allele variation, and haplotype analysis [25,26,28]. However, the distribution and polymorphism of many InDels in indica and japonica rice and the polymorphism of these markers in different rice varieties are unclear. In this study, we identified 699,475 InDels of >50 bp in length and randomly selected 96 InDels from 12 chromosomes for verification. The results revealed a high polymorphism in different tested varieties of indica and japonica rice, and a set of near-isogenic lines could be well distinguished by InDel markers. These markers displayed better ability in distinguishing various rice resources with different backgrounds compared with other markers and contributed to revealing the genetic basis of biodiversity.

2. Materials and Methods

2.1. Plant Materials and Cultivation

A panel of 98 rice cultivars, including 36 japonica-type rice cultivar, 36 indica-type rice cultivar, and 26 recombinant inbred line progenies and their corresponding parents, were used in this study (Tables S1 and S2). Among these cultivars, 36 japonica-type rice cultivars were used to analyse InDel identification of varieties, 36 indica-type rice cultivars were used to analyse the divergence of varieties, and 26 recombinant inbred line progenies were used to identify the genetic background. Some of these rice accessions were provided by IRRI and were planted in Wuhan under proper management.

2.2. Data Sources of 3024 Rice Genomic Sequences

The genomic sequence data of 3024 rice cultivars and the InDel information (Deletions called vs. Nipponbare MSU7/IRGSP1.0 genome and Insertions, called vs. Nipponbare MSU7/IRGSP1.0 genome) were downloaded from the website of Rice SNP-Seek Database (http://iric.irri.org, accessed on 22 August 2020). Using private Python scripts, we extracted data of >50-bp-long InDel fragments for further analyses. The Nipponbare genome (IRGSP-1.0) was also downloaded from Ensembl Plants. Information regarding 72 cultivars of 3000 Rice Genome Project was downloaded from the Rice Functional and Genomic Breeding website (RFGB, http://www.rmbreeding.cn, accessed on 25 August 2020). The cultivar information is listed in Supplementary Table S1.

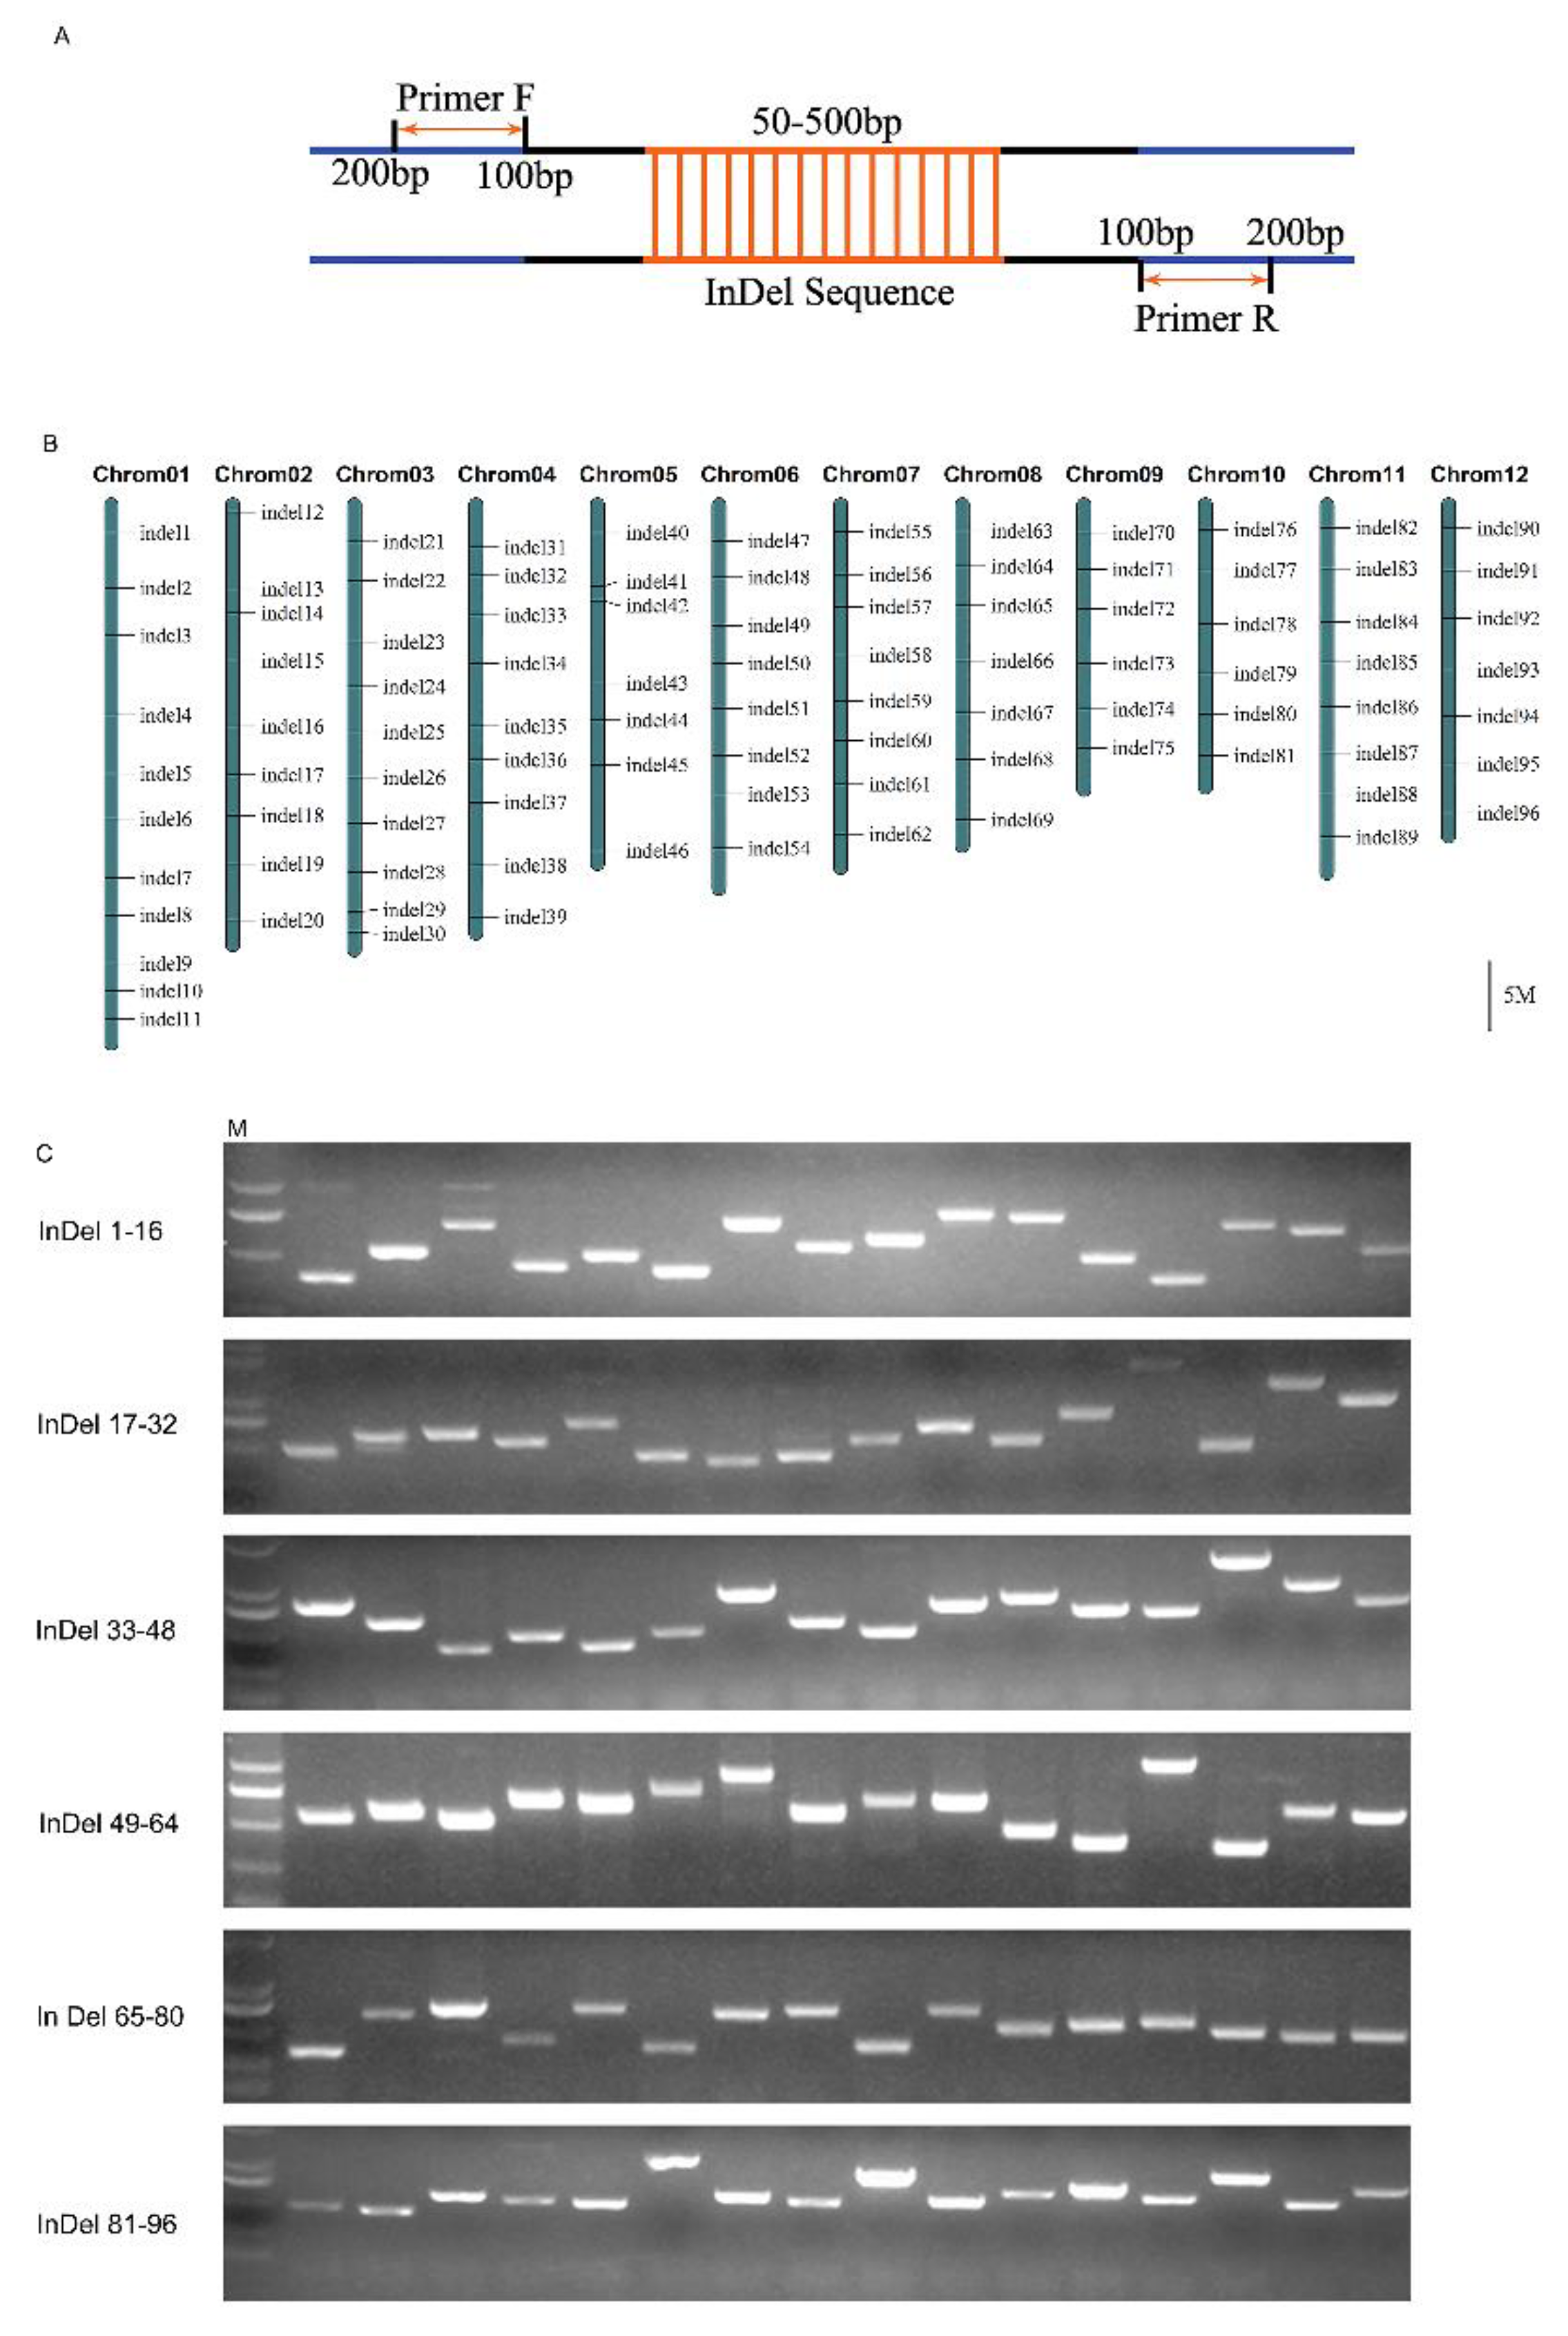
2.3. PCR Primer Design

To design primers for PCR validation, we extracted 250–900-bp long sequences, including a 50–500-bp InDel region and flanking sequences of 100–200 bp on both sides of the InDel region. Primers were designed using Primer 5 software, with a primer length of 18–22 nt and an optimal length of 20 nt. Their GC content, melting temperature (Tm), and the optimum temperature were 45–60%, 55 °C–65 °C, and 58 °C, respectively. The difference between the refolding temperature of the paired primers was no more than 5 °C. The expected PCR amplification product length was 250–1000 bp. Primer dimer, hairpin structure, and mismatch were avoided in the designing process. All operations were performed using custom Perl scripts. The primers are listed in Supplementary Table S3.

2.4. DNA Extraction and PCR Amplification

According to the CTAB method, genome DNA was extracted from young leaves of all rice cultivars [35]. PCR was performed in a reaction volume of 25 μL, which included approximately 50 ng of template DNA, 12.5 μL of 2× PCR mixture buffer, 2 μL of 10 nM primer, and ddH2O. The DNA amplification scheme included initial denaturation at 95 °C for 5 min, followed by 35 cycles of denaturation at 95 °C for 30 s, annealing at 55 °C–65 °C for 30 s, extension at 72 °C for 60 s, and a final extension at 72 °C for 2 min. The reaction was performed in LifeECO thermal cycler. The PCR products were separated using 2.0% agarose gel electrophoresis.

2.5. Phylogenetic Analysis

Each band produced by the InDel primers was treated as a unit character and scored as a binary code (1/0). The phylogenetic trees were analysed using DPS 7.5 based on the 1/0 matrix [36], and the genetic relation was assayed using MEGA7 [37], which is based on the unweighted pair group method and arithmetic mean (UPGMA) cluster analysis.

3. Results

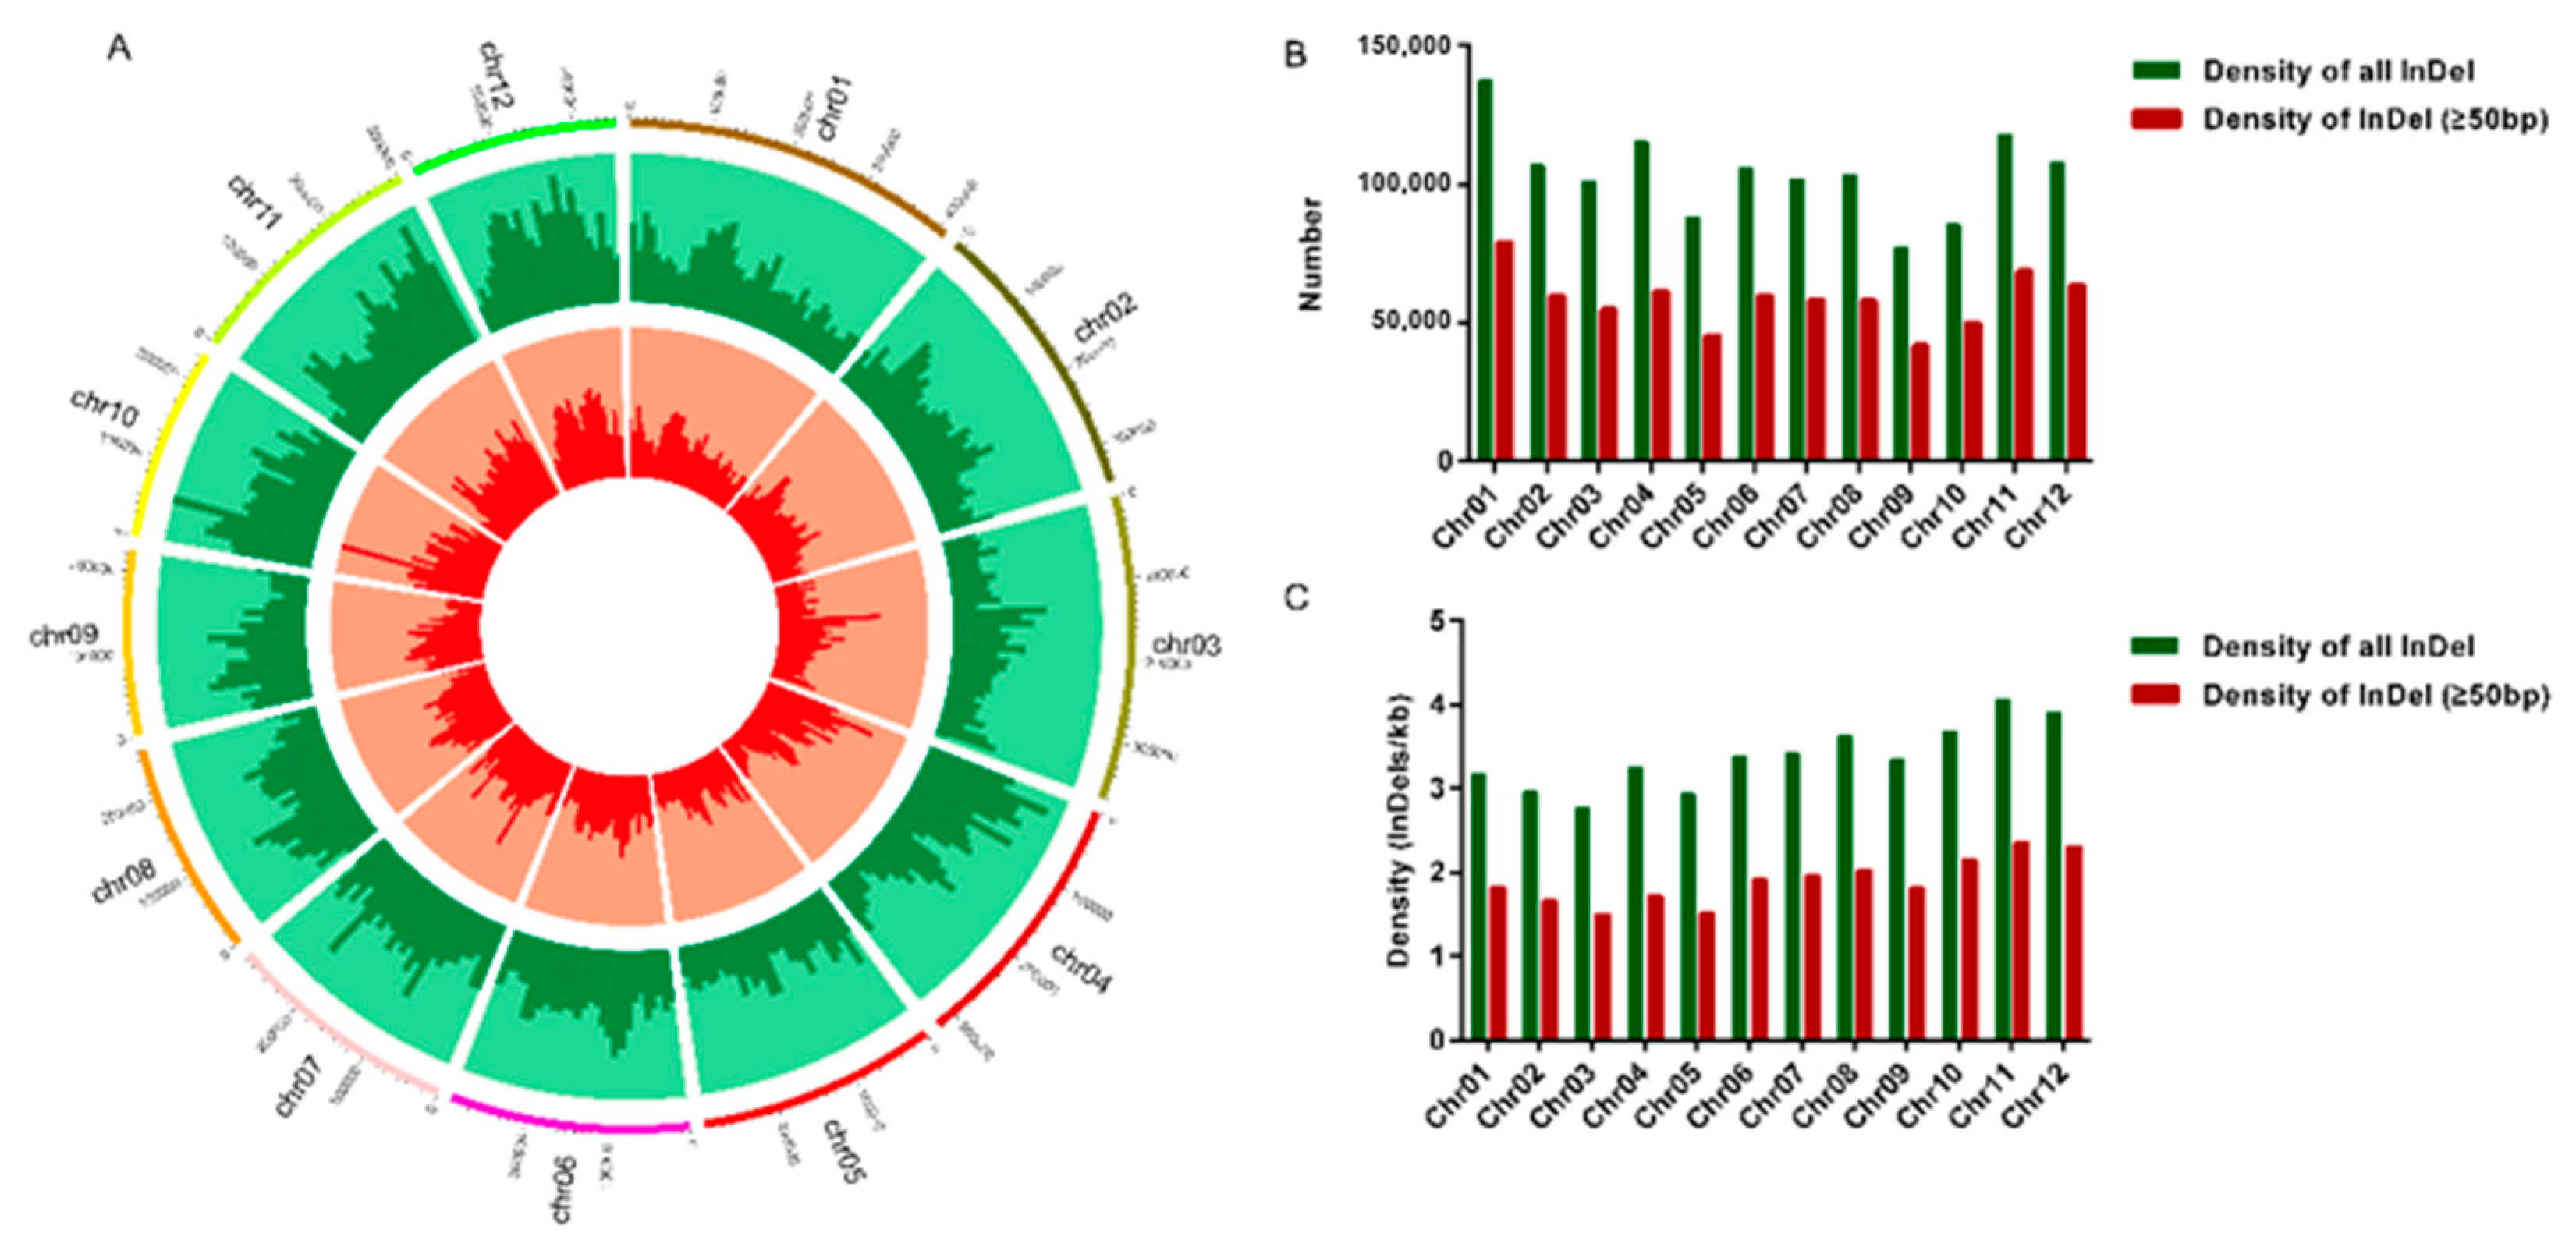
3.1. Identification and Distribution of InDels in the 3000 Rice Genome Dataset

Based on the next-generation sequencing data from 3024 rice varieties, the InDel information was downloaded from the Rice SNP-Seek Database website. A total of 1,248,503 InDels were evenly distributed across all 12 chromosomes (Figure 1A). The results revealed that the number of InDels on each chromosome was generally consistent with the corresponding chromosomal length; the largest amount (137,443) was noted on chromosome 1, and the least amount (77,000) was on chromosome 9 (Figure 1B, Table 1). The average density was 3.34 InDels/kb, with a range of 2.78–4.07 InDels/kb on 12 chromosomes. The lowest and highest density was on chromosomes 3 and 11, respectively. (Figure 1C, Table 1). We used the Python script to retrieve sequences (699,475) of >50-bp long InDels, which was also consistent with the previous analysis. The maximum number (78,935) of >50-bp long InDels was located on chromosome 1, whereas the minimum number (41,752) was located on chromosome 9; the density of InDels was not the same as before, with the highest density on chromosome 11 (2.36 InDels/kb) and the lowest density on chromosome 3 (1.50 InDels/kb) (Figure 1B,C, Table 1). The results suggested that many InDels were widely and evenly distributed on each chromosome, which implied that InDels can be developed as a high-density molecular marker.

3.2. Application of New InDel Markers in Nipponbare

To facilitate detection by agarose gel electrophoresis, we selected 50–900-bp long InDels and designed the primers at the position 100–200 bp upstream and downstream (Figure 2A). According to the average distribution on chromosomes, we randomly designed 96 primers of approximately 3.98 Mb/InDel (Figure 2B, Table S3).
We used Nipponbare (Oryza sativa Japonica) as a control to detect the amplification efficiency of 96 pairs of primers. The products could be amplified by all primers between 250 bp and 1000 bp and easily detected by 2% agarose gel electrophoresis (Figure 2C). These results indicated that InDels exists widely in the genome and exhibits a great application potential in plant research.

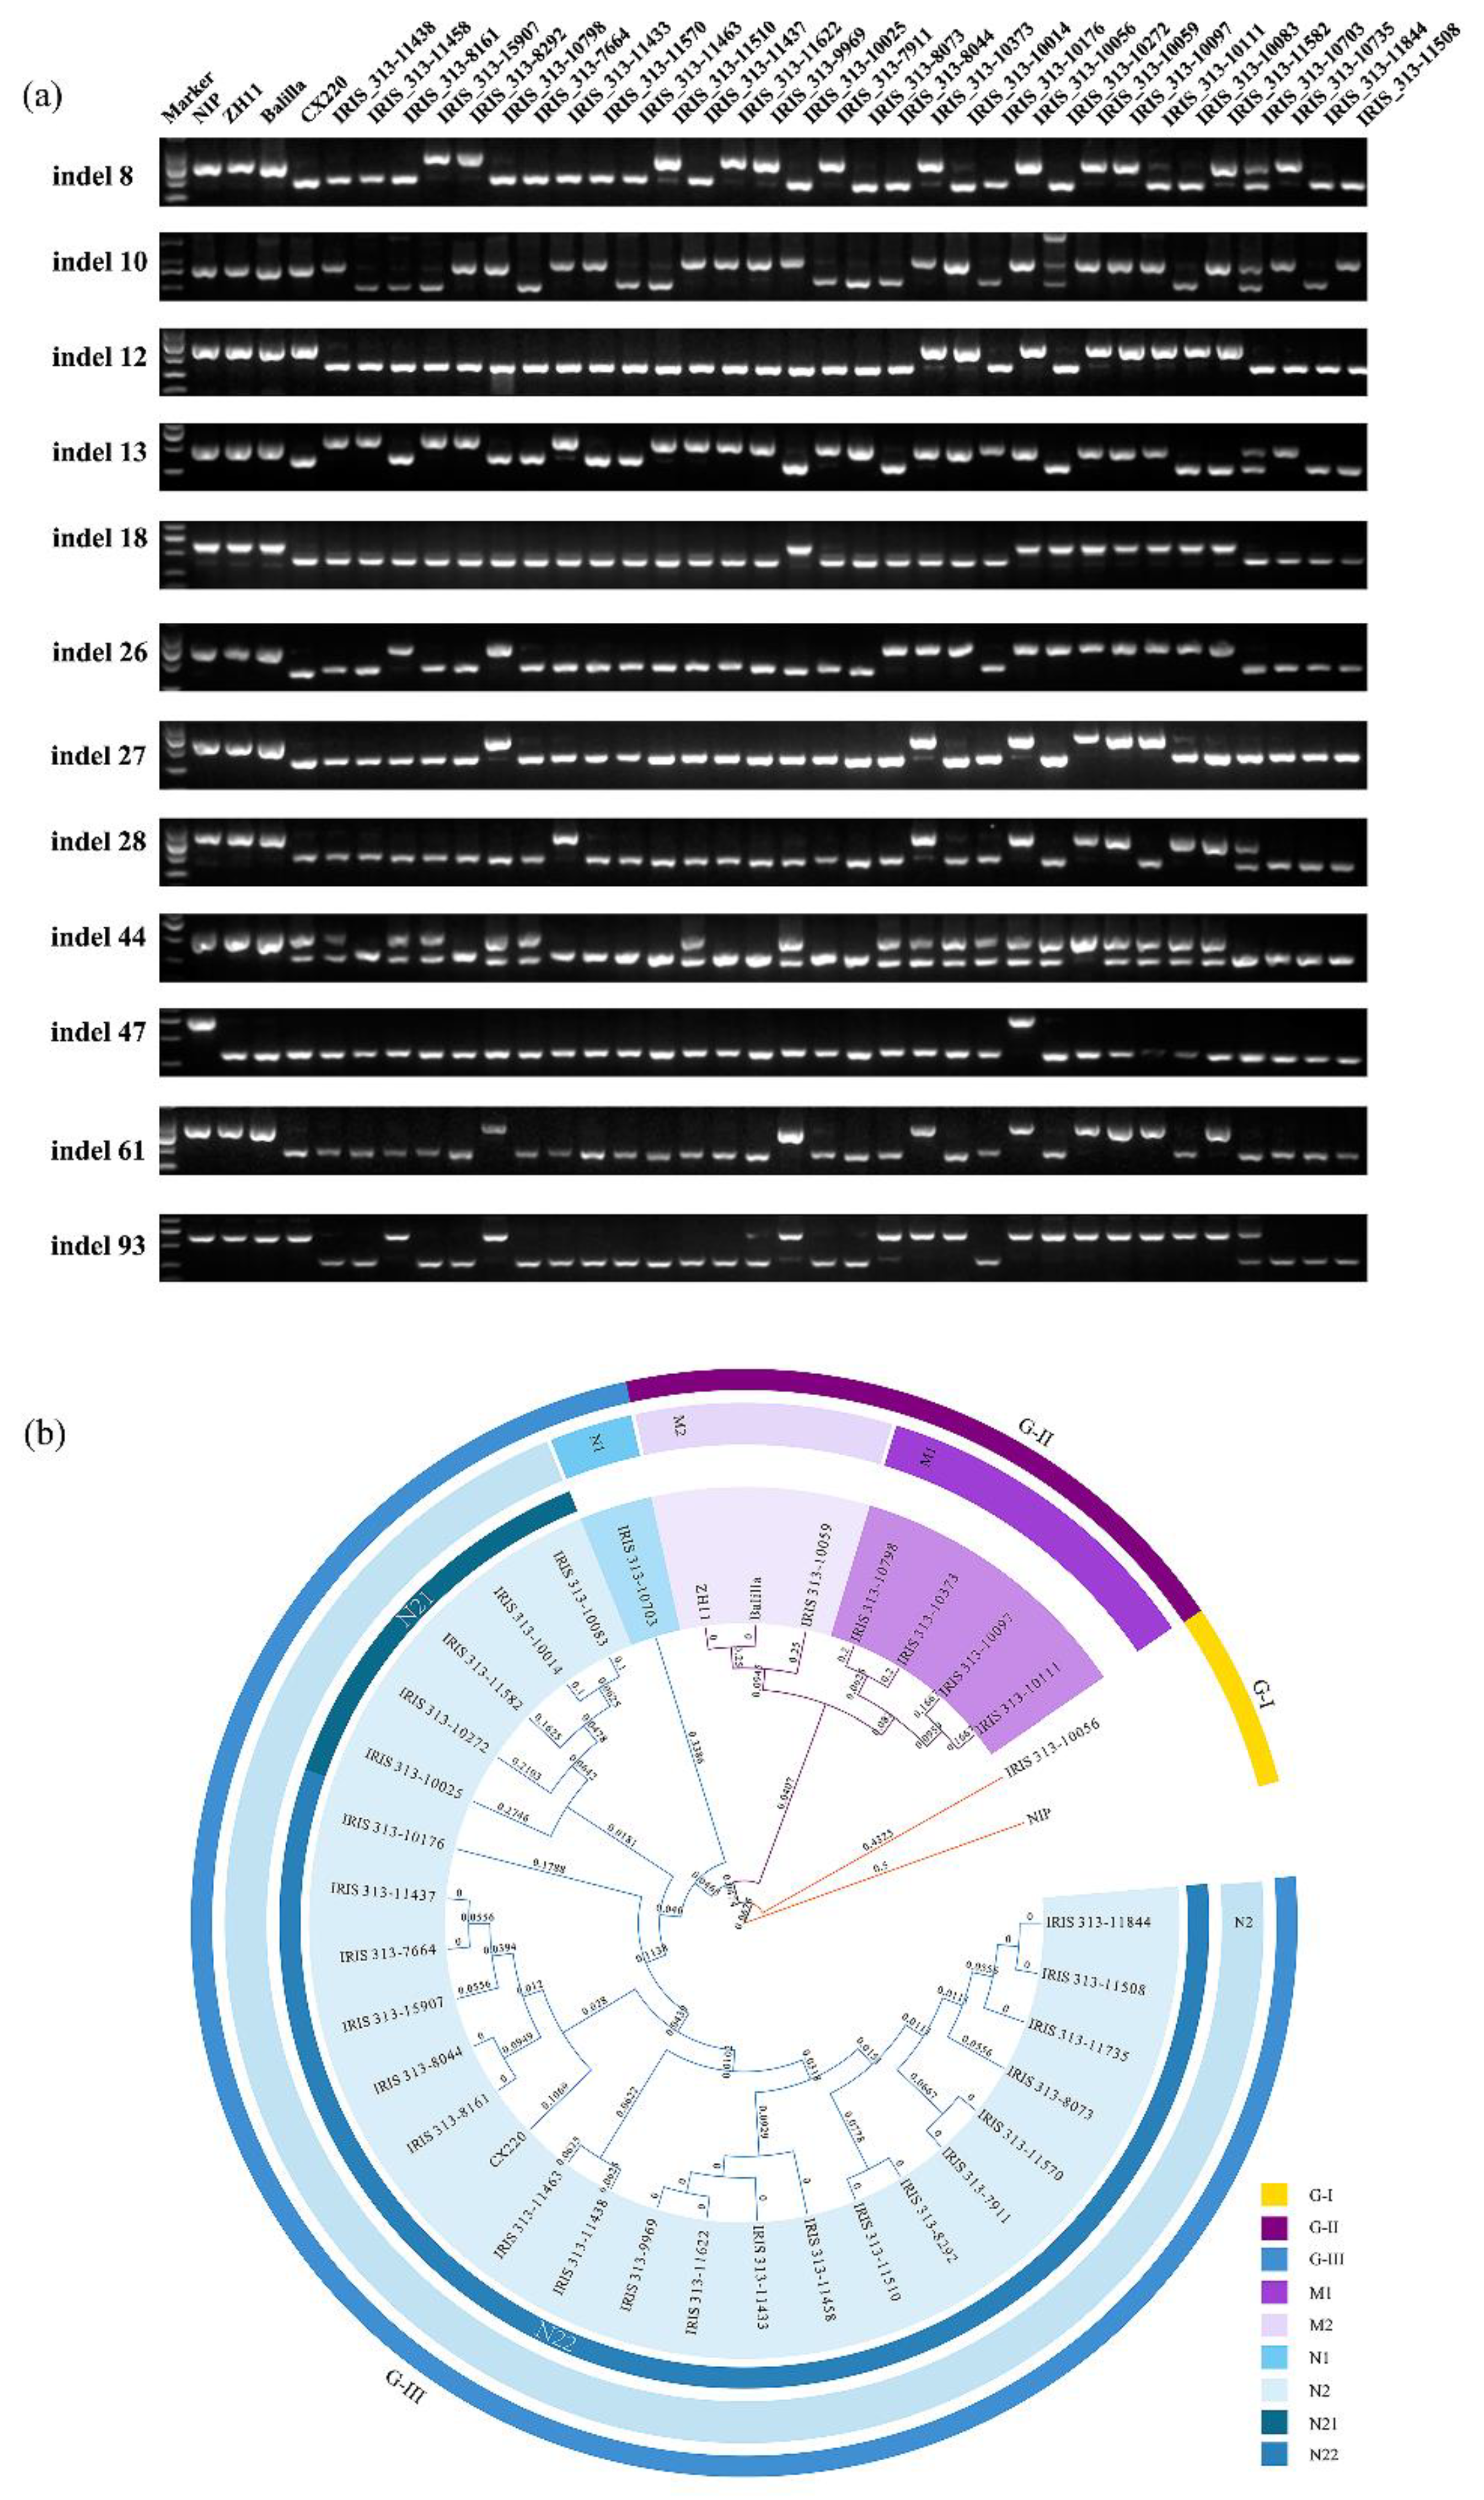
3.3. InDel Marker Could Be Applied for Accurate Identification of Varieties in Japonica Rice

To assess the value of InDel markers for genetic analysis of varieties in japonica rice, we screened 36 japonica rice varieties, which originated from 15 countries, for polymorphism analysis using InDel markers (Table S1). The PCR products ranged from 500 bp to 1000 bp in 2% agarose gel (Figure 3a and Figure S1). The results also indicated that the selected 36 japonica rice varieties had polymorphic profiles (Figure 3a and Figure S1).
Using the UPGMA approach, a dendrogram was constructed based on the product length of 26 InDel markers in 36 different rice varieties (Figure 3b). We could divide the materials into three monophyletic groups when the similarity value was only 0.0474, and the groups were designated as GJ-I, GJ-II, and GJ-III (Figure 3b). GJ-II comprised two subgroups: M1 and M2. M1 comprised IRIS_313-10111, IRIS_313-10097, IRIS_313-10373, and IRIS_313-10798 (Figure 3b). IRIS_313-10373 and IRIS_313-10798 originated from Southeast Asia and were geographically related. They were well clustered into the same species sub-type by using those markers (Figure 3b, Table S1). Similarly, M2 contained ZH11, Balila, and IRIS_313-10059. IRIS_313-10059 and ZH11 were from East Asia, and their genetic relationship was also extremely close (Figure 3b, Table S1). GJ-III mainly included two subtypes: N1 and N2. According to the polymorphism among species, the N2 sub-type could be divided into two types, namely N21 and N22, and N22 could be divided into three different groups, namely N221, N222, and N223. IRIS_313-10083 and IRIS_313-10272 in M21 were from Europe, which were geographically close (Figure 3b, Table S1). N222 could be divided into many small branches according to the polymorphism of InDels, such as IRIS_313-11463, IRIS_313-11438, IRIS_313-9969, IRIS_313-11622, IRIS_313-11433, IRIS_313-11458, IRIS_313-11510, IRIS_313-11570, IRIS_313-8073, IRIS_313-11735, IRIS_313-11508, and IRIS_313-11844, which could be grouped into three small branches. Among them, IRIS_313-11433, IRIS_313-11458, IRIS_313-11570, and IRIS_313-11735 were all from the same area in different small branches (Figure 3b, Table S1). Based on these results, our InDel markers could distinguish japonica rice into different varieties. InDels showed rich polymorphisms in different japonica rice varieties, which could help us reveal the origin of distinct species to a certain extent and facilitate differentiation between species.

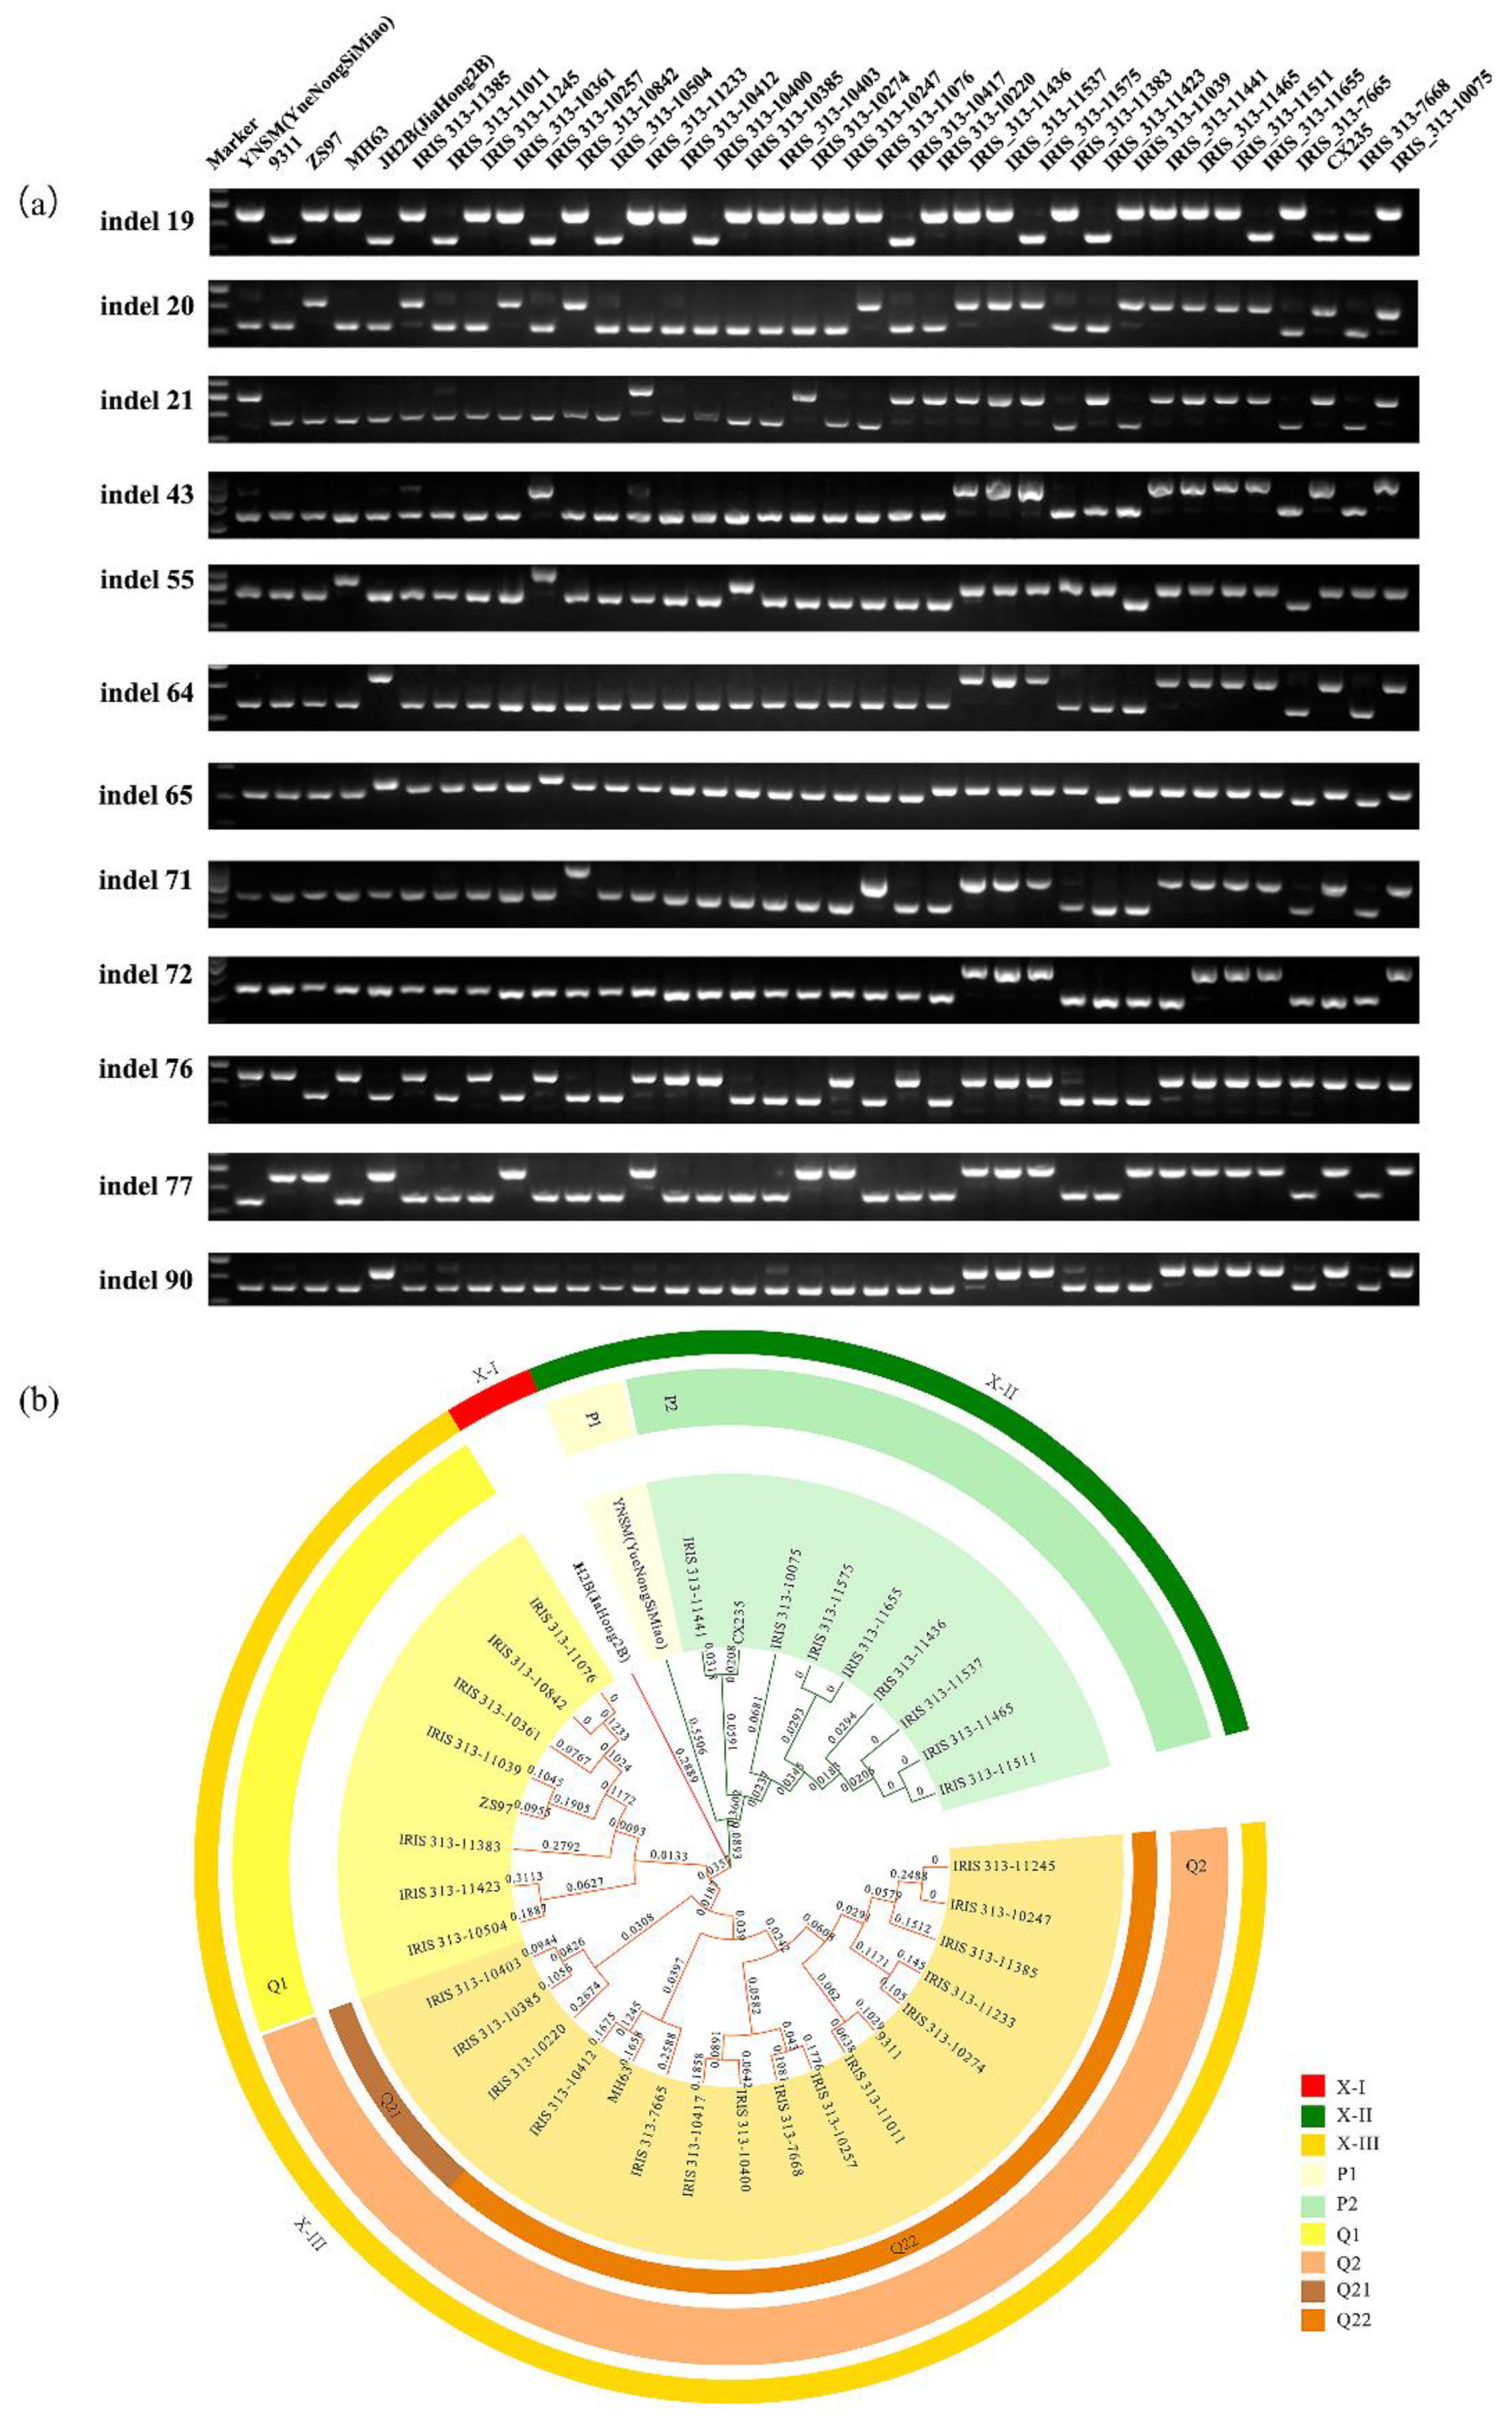
3.4. InDel Markers Might Contribute to the Divergence of Varieties in Indica

We tested the polymorphism of these InDel markers to assess whether it can be used to distinguish indica rice. We selected 36 indica rice varieties from 14 countries and used 25 markers for further analysis (Table S1). The PCR product length ranged from 500 bp to 1000 bp, which was detected using 2% agarose gel (Figure 4a, Figure S2 and Table S3). The results revealed that the 36 selected indica rice varieties exhibited rich diversity (Figure 4a, Figure S2 and Table S3).
Phylogenetic analysis showed that these 36 rice accessions were clearly classified into three groups, designated as XI-I, XI-II, and XI-III (Figure 4b). According to the polymorphism of InDel markers, XI-II was divided into two subtypes: P1 and P2. The P2 sub-type included nine varieties: IRIS_313-11441, CX235, IRIS_313-10075, IRIS_313-11575, IRIS_313-11655, IRIS_313-11436, IRIS_313-11537, IRIS_313-11465, and IRIS_313-11511 (Figure 4b). IRIS_313-11441, CX235, IRIS_313-11537, IRIS_313-1145, and IRIS_313-11511 were from the Philippines (Figure 4b, Table S1). Therefore, our InDel markers maintained rich polymorphisms in indica rice and could group different cultivars based on their geographical relationship. When the similarity value was only 0.0357, XI-III could be separated into two categories: Q1 and Q2 (Figure 4b). In the Q1 sub-type, IRIS_313-11039, IRIS_313-10504, and ZS97 could be grouped together owing to their close geographical relatedness (Table S1). Q2 could be further divided into two types: Q21 and Q22 (Figure 4b). In Q22, the remaining 13 varieties had polymorphism changes and could continue to differentiate into two major types: Q221 and Q222 (Figure 4a,b). In Q222, IRIS313-10417, IRIS313-7668, IRIS313-11011, IRIS313-11233, and IRIS313-10385 were from Southeast Asia, which showed that these InDel markers can identify and screen diverse varieties with certain geographical affinities.

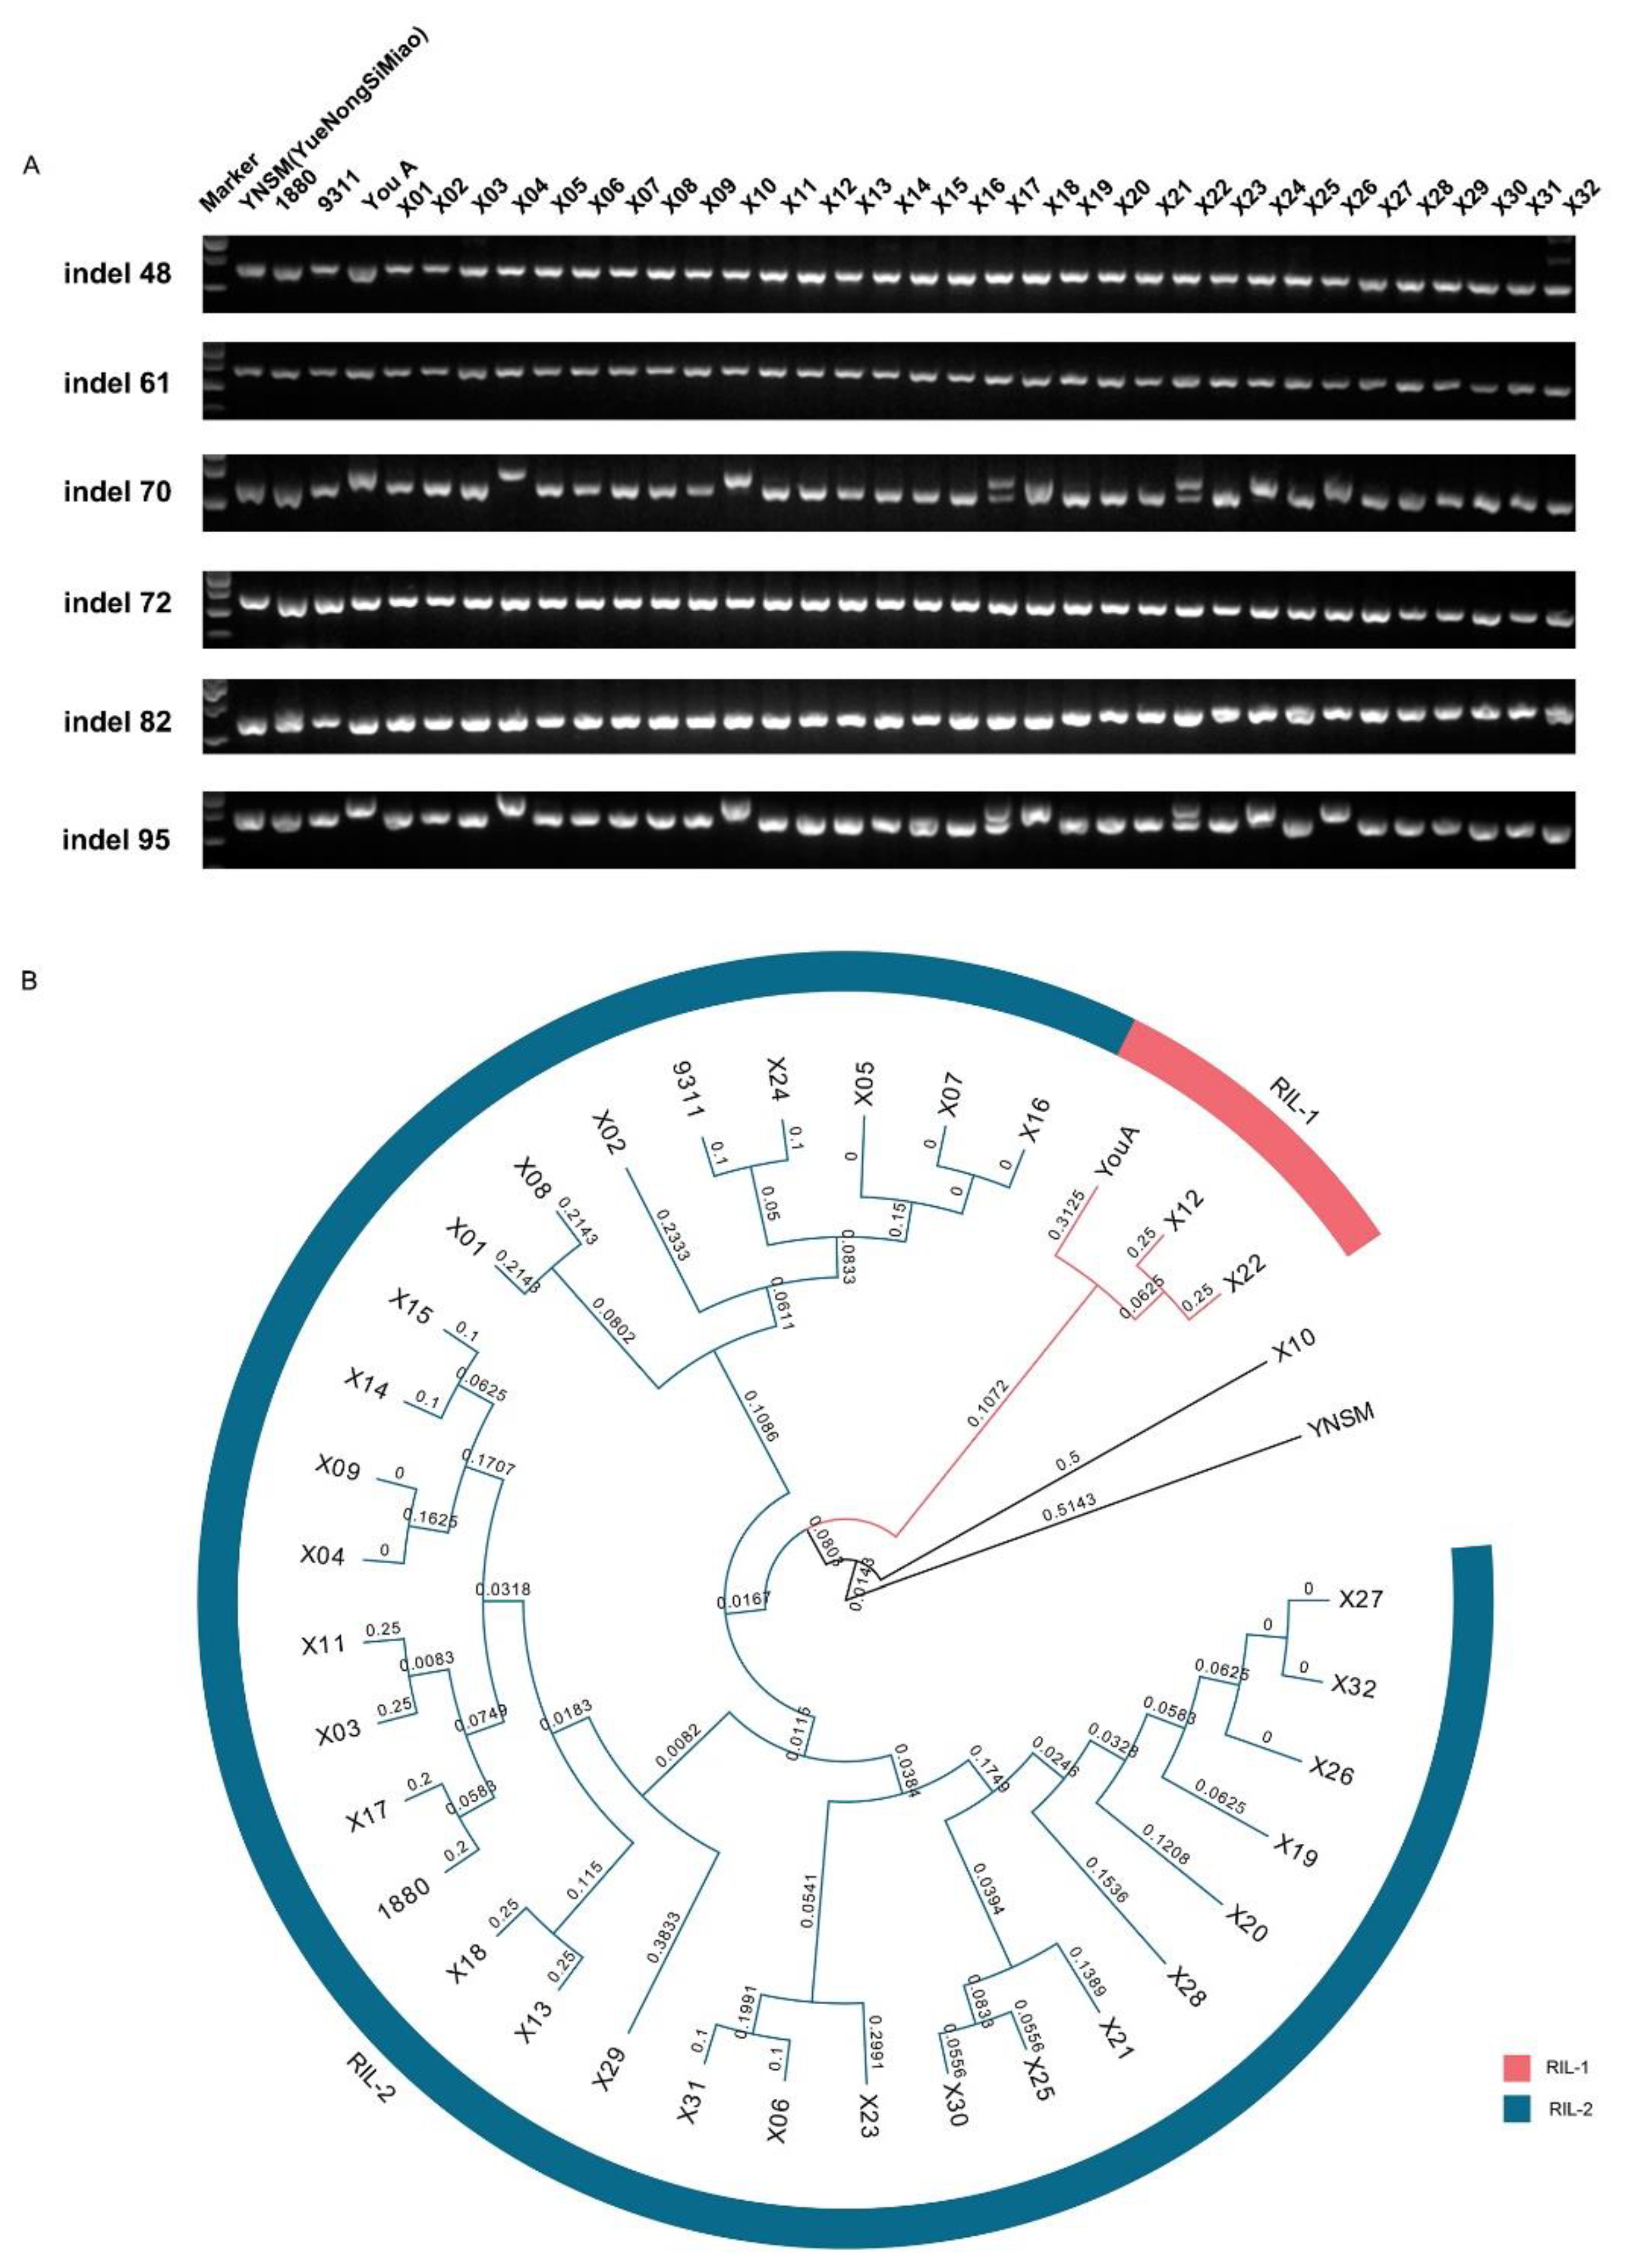
3.5. InDel Markers Could Be Applied to Identify the Recombinant Inbred Lines in a Population

We found that InDel markers could effectively identify the polymorphisms of indica and japonica rice. To study whether these markers can distinguish the recombinant inbred line (RIL) population, we selected an RIL derived from the cross between 9311 and YouA and used 32 progenies of recombinant group inbred line. PCR amplified polymorphisms indicated the abundant diversity among the progenies (Figure 5A, Figure S3 and Table S3).
The UPGMA method was used to construct a phylogenetic tree for further analysis. Result showed that the selected 32 progenies of recombinant inbred line could be grouped into two types according to their parents 9311 and YouA: RIL-1 and RIL-2. RIL-1 includes X12 and X22 as well as parent YouA (Figure 5B). Other progeny, except X-10, and parent 9311 were classified as RIL-2. Among them, 1880, which has a similar background as that of 9311, is also classified as RIL-2 (Figure 5B). These results indicated that the RIL could be distinguished by the InDel markers and the InDel markers exhibited great potential in identifying the genetic background of rice varieties.

4. Discussion

As an effective tool for studying genetics, molecular markers have been well improved and widely applied in the analysis of genetic diversity, determination of variety identity, marker-assisted breeding, and phylogenetics [38]. Compared with traditional markers, such as AFLP, RFLP, and SSR, InDels have the advantages of wide distribution, high density, large number, and easy detection [21]. Owing to the rapid development of next-generation sequencing technologies, many InDels have been identified [20]. In rice, the implementation of the 3K-RG re-sequencing project can help in identifying InDels and analysing species variation [24,26]. Among the 3024 sequenced rice varieties, we identified 1,248,503 InDels and screened out >50-bp long 699,475 InDels, which were widely distributed on 12 chromosomes with an average density of 1.87 InDel/kb (Figure 1B, Table 1). The number of InDels on each chromosome was consistent with the corresponding chromosome length; the largest amount was on chromosome 1 and the least amount was on chromosome 9. The frequency of >50-bp long InDels was 1.5–2.36 InDels/kb on chromosome 12. (Figure 1B, Table 1). The higher frequency and amplification efficiency of InDels in rice help in utilising InDels for genetic diversity and marker screening [39]. We designed 96 InDels evenly distributed across all 12 chromosomes with a physical distance of approximately 3.98 Mb/InDel. The results suggest that the primers amplified well in Nipponbare and widely existed in the genome (Figure 2A,B, Table S3).
Owing to long-term cultivation and evolution under diverse agroecological conditions, Asian cultivated rice is differentiated into varieties of indica and japonica and has, consequently, developed reproductive isolation [40,41]. To determine the features of indica and japonica rice, the Cheng’s index containing six selected morphological and physiological characteristics is most commonly used [42]. However, this method has many limitations associated with elimination of environmental factors and identification of RILs with complex genetic backgrounds. The genetic background differences between the varieties of indica and japonica are small; therefore, identification is difficult. With the development of the molecular marker technology, these limitations have been largely resolved. Analysis of a set of rice germplasm (including 166 Asian rice varieties, 2 African rice varieties, 30 accessions of wild rice species, and 42 weedy rice accessions) implied that the differentiation of indica and japonica rice by using the SSIF comprised 40 InDel markers [43]). In a previous study, by analysing the entire genomic sequences of indica (9311) and japonica rice (Nipponbare), 45 typical InDel markers were obtained and 34 markers were found to be closely related to the differentiation of indica and japonica rice [44]. The 3K-RG re-sequencing project provides massive data from rich sources, which makes it possible to solve this dilemma by identifying many InDels [24,26]. Here, we selected 36 different japonica rice varieties from 15 countries for further analysis (Table S1). The results revealed that these varieties were well divided into three monophyletic groups, GJ-I, GJ-II, and GJ-III, by 26 InDel markers (Figure 3). Among these groups, GJ-II and GJ-III could be further divided into different subtypes continually, especially GJ-III could continue to be divided into N1 and N2, N21 and N22, and N221 and N222 according to the polymorphism of InDel markers (Figure 3). These results exhibited that InDel markers harboured good polymorphisms in the varieties of japonica rice, and japonica rice could be preliminarily classified based on the statistical results of its polymorphism. IRIS_313-10083 and IRIS_313-10272, IRIS_313-11433 and IRIS_313-11458, and IRIS_313-11570 and IRIS_313-11735 were from the same area but were grouped into different branches (Figure 3). Therefore, high-density InDel markers are of great significance in identifying the diversity and consistency of japonica rice varieties. We selected eight varieties from unknown countries for the polymorphism analysis and found that these varieties could be grouped in different branches (Figure 3). Therefore, by studying the relatedness with the nearby varieties, the possible location of origin of these varieties can be judged, which provides a powerful tool for the protection and utilisation of our variety diversity. Moreover, these polymorphisms also existed in the varieties of indica rice. Using 25 specific InDel markers, through the analysis of 36 indica rice from 14 countries, it was found that indica rice could also be divided into three groups, XI-I, XI-II, and XI-III. XI-II and X-III subtypes could be divided into many small branches (Figure 4, Table S2). It shows that the above markers were also widely present in the differentiation of indica rice. InDel markers have provided great opportunities to examine functional diversity, and with the advancement of more InDel markers in major crop species, significant genetic diversity studies can be conducted.
The InDel molecular markers can be used to determine the characteristics of indica and japonica, and this is convenient for breeders to avoid similarities in selecting varieties [44]. We selected a series of RILs derived from the cross between 9311 and YouA for polymorphism analysis. The results indicated that the progeny of RILs can be divided into two types according to the parents 9311 and YouA, and this result can be used to understand which parent it comes from (Figure 5). Interestingly, as we found that the X-10 is in the outer group, we speculate that the previous generation of parents may not be critically self-pollinated, but pollinated with other varieties. It also confirmed that our indel markers can help us to identify the homozygosity of offspring and provide a reliable way to construct novel materials (Figure 5B). When using markers to analyse the polymorphism of the selected varieties, we found heterozygous bands in multiple varieties (Figure 3a, Figure 4a and Figure 5A). These results mean that the varieties were not homozygous, which were still needed to self-cross and selection by molecular markers. Through the development of the above InDel markers, the homozygosity of a variety can be identified, which will be beneficial in experiments.
Traditionally, the length of most of the identified InDels is 2–50 bp, and the average length is 36 bp [17,39]. PCR amplification can be used to only identify InDels through polyacrylamide gel electrophoresis, although this method is time-consuming and labour-intensive. Acrylamide and bis-acrylamide are harmful to the human body. Here, we identified 699,475 InDels of >50 bp in length, accounting for 56.02% of all InDels (Table 1). Long fragments of InDels are more convenient for detection. All our InDel products could be easily checked using 2% agarose gel electrophoresis, which greatly reduced the detection cost. DNA polymorphism is the foundation of molecular marker development, which is widely used in gene mapping [13]. InDel-based PCR markers are the most commonly used methods [20]. In Arabidopsis thaliana, in the whole-genome sequence analysis of 1135 accessions from a worldwide hierarchical collection, many InDels were identified based on the genomic sequence variation, which promoted the wide application of this marker technology in map-based cloning [20,45]. In rice, the high-density long InDel fragments identified through the 3K-RG re-sequencing project promoted the map-based cloning of essential functional genes in rice [24,26,34]. While validating InDel polymorphisms in the database, we further designed 182 pairs of long fragments of InDel markers, covering 15–18 markers on each chromosome (Table S4). These genome-wide markers will contribute to rice research, including map-based cloning and germplasm identification.

5. Conclusions

Owing to the advantages of wide distribution, high density, large number, and easy detection, InDel makers have attracted considerable attention. In this study, we identified 1,248,503 InDels and screened out >50-bp length 699,475 InDels based on 3K whole-genome re-sequencing data. We found that the number of InDels on each chromosome was consistent with the corresponding chromosome length, and 96 InDels of approximately 3.98 Mb/InDel exhibited ideal performance in 2% agarose gel electrophoresis. Phylogenetic analysis revealed that InDel markers had excellent polymorphisms between rice varieties of japonica and indica, and these varieties could be classified based on the statistical results of their polymorphisms. Furthermore, the InDel markers could be applied to identify the RILs in a population. We have further designed 108 pairs of long fragments of InDel markers with the view that these genome-wide markers will contribute to further studies on functional diversity, species variation, and map-based cloning in rice varieties.

Supplementary Materials

The following are available online at https://0-www-mdpi-com.brum.beds.ac.uk/article/10.3390/agriculture11070655/s1, Figure S1: PCR amplification patterns of the InDel markers that could discriminate varieties in japonica rice. Figure S2: PCR amplification of 36 indica rice varieties using the 26 InDel markers. Figure S3: PCR amplification of the recombinant inbred lines (RILs) population. Table S1. The indica and japonica rice varieties used in this study. Table S2. The recombination inbred line progenies used in this study. Table S3. Primer sequences for 96 InDel markers used in this study. Table S4. Primer sequences for an additional 108 new InDel markers.

Author Contributions

Conceptualisation, H.Y. and J.H.; methodology, J.H.; software, W.Y.; validation, J.Z., M.C. and F.F.; formal analysis, W.Y.; investigation, H.Y. and R.Q.; resources, J.H. and S.L.; data curation, T.L.; writing—original draft preparation, H.Y. and W.Y.; writing—review and editing, J.H.; visualisation, Y.Y.; supervision, J.H.; project administration, J.H.; funding acquisition, J.H. All authors have read and agreed to the published version of the manuscript.

Funding

This work was supported by funds from the National Natural Science Foundation of China (31670310, and 31871592), and the Creative Research Groups of the Natural Science Foundation of Hubei Province (2020CFA009).

Institutional Review Board Statement

Not applicable.

Informed Consent Statement

Not applicable.

Data Availability Statement

Data generated and analyzed during this stud is contained in this manuscript.

Acknowledgments

We thank IRRI for kindly providing the rice cultivars. This work was supported by funds from the National Natural Science Foundation of China (31670310, and 31871592) and the Creative Research Groups of the Natural Science Foundation of Hubei Province (2020CFA009).

Conflicts of Interest

The authors declare no conflict of interest.

References

  1. McClung, C.R. Making hunger yield. Science 2014, 344, 699–700. [Google Scholar] [CrossRef] [PubMed]
  2. McCouch, S.R.; Chen, X.; Panaud, O.; Temnykh, S.; Xu, Y.; Cho, Y.G.; Huang, N.; Ishii, T.; Blair, M. Microsatellite marker development, mapping and applications in rice genetics and breeding. In Oryza: From Molecule to Plant; Springer: Berlin/Heidelberg, Germany, 1997; pp. 89–99. [Google Scholar]
  3. Botstein, D.; White, R.L.; Skolnick, M.; Davis, R.W. Construction of a genetic linkage map in man using restriction fragment length polymorphisms. Am. J. Hum. Genet. 1980, 32, 314. [Google Scholar]
  4. Kuiper, M.; Zabeau, M. AFLP: A new concept for DNA fingerprinting. Nucleic Acids 1995, 23, 4407–4414. [Google Scholar]
  5. Akagi, H.; Yokozeki, Y.; Inagaki, A.; Fujimura, T. Microsatellite DNA markers for rice chromosomes. Theor. Appl. Genet. 1996, 93, 1071–1077. [Google Scholar] [CrossRef] [PubMed]
  6. Liu, B.; Wang, Y.; Zhai, W.; Deng, J.; Wang, H.; Cui, Y.; Cheng, F.; Wang, X.; Wu, J. Development of InDel markers for Brassica rapa based on whole-genome re-sequencing. Theor. Appl. Genet. 2012, 126, 231–239. [Google Scholar] [CrossRef] [PubMed]
  7. Williams, J.G.; Kubelik, A.R.; Livak, K.J.; Rafalski, J.A.; Tingey, S.V. DNA polymorphisms amplified by arbitrary primers are useful as genetic markers. Nucleic Acids Res. 1990, 18, 6531–6535. [Google Scholar] [CrossRef] [Green Version]
  8. Lu, B.R.; Zheng, K.L.; Qian, H.R.; Zhuang, J.Y. Genetic differentiation of wild relatives of rice as assessed by RFLP analysis. Theor. Appl. Genet. 2002, 106, 101–106. [Google Scholar] [CrossRef]
  9. Powell, W.; Machray, G.C.; Provan, J. Polymorphism revealed by simple sequence repeats. Trends Plant Sci. 1996, 1, 215–222. [Google Scholar] [CrossRef]
  10. Lian, C.; Oishi, R.; Miyashita, N.; Hogetsu, T. High somatic instability of a microsatellite locus in a clonal tree, Robinia pseudoacacia. Theor. Appl. Genet. 2004, 108, 836–841. [Google Scholar] [CrossRef] [PubMed]
  11. Lander, E.S. The new genomics: Global views of biology. Science 1996, 274, 536–539. [Google Scholar] [CrossRef] [PubMed] [Green Version]
  12. Bernardo, R. Molecular Markers and Selection for Complex Traits in Plants: Learning from the Last 20 Years. Crop Sci. 2008, 48, 1649–1664. [Google Scholar] [CrossRef] [Green Version]
  13. Shen, Y.J.; Jiang, H.; Jin, J.P.; Zhang, Z.B.; Xi, B.; He, Y.Y.; Wang, G.; Wang, C.; Qian, L.; Li, X.; et al. Development of genome-wide DNA polymorphism database for map-based cloning of rice genes. Plant Physiol. 2004, 135, 1198–1205. [Google Scholar] [CrossRef] [Green Version]
  14. Moghaddam, S.M.; Song, Q.; Mamidi, S.; Schmutz, J.; Lee, R.; Cregan, P.; Osorno, J.M.; McClean, P.E. Developing market class specific InDel markers from next generation sequence data in Phaseolus vulgaris L. Front Plant Sci. 2014, 5, 185. [Google Scholar] [CrossRef] [PubMed] [Green Version]
  15. Das, S.; Upadhyaya, H.D.; Srivastava, R.; Bajaj, D.; Gowda, C.L.; Sharma, S.; Singh, S.; Tyagi, A.K.; Parida, S.K. Genome-wide insertion-deletion (InDel) marker discovery and genotyping for genomics-assisted breeding applications in chickpea. DNA Res. Int. J. Rapid Publ. Rep. Genes Genomes 2015, 22, 377–386. [Google Scholar] [CrossRef] [PubMed]
  16. Britten, R.J.; Rowen, L.; Williams, J.; Cameron, R.A. Majority of divergence between closely related DNA samples is due to indels. Proc. Natl. Acad. Sci. USA 2003, 100, 4661–4665. [Google Scholar] [CrossRef] [Green Version]
  17. Mills, R.E.; Luttig, C.T.; Larkins, C.E.; Beauchamp, A.; Tsui, C.; Pittard, W.S.; Devine, S.E. An initial map of insertion and deletion (INDEL) variation in the human genome. Genome Res. 2006, 16, 1182–1190. [Google Scholar] [CrossRef] [PubMed] [Green Version]
  18. Pan, C.-H.; Li, A.-H.; Dai, Z.-Y.; Zhang, H.-X.; Liu, G.-Q.; Wang, Z.-B.; Yin, Y.-J.; Zhang, Y.-F.; Zuo, S.-M.; Chen, Z.-X. InDel and SNP markers and their applications in map-based cloning of rice genes. Rice Sci. 2008, 15, 251–258. [Google Scholar] [CrossRef]
  19. Raman, H.; Raman, R.; Wood, R.; Martin, P. Repetitive Indel Markers within the ALMT1 Gene Conditioning Aluminium Tolerance in Wheat (Triticum aestivum L.). Mol. Breed. 2006, 18, 171–183. [Google Scholar] [CrossRef]
  20. Pacurar, D.I.; Pacurar, M.L.; Street, N.; Bussell, J.D.; Pop, T.I.; Gutierrez, L.; Bellini, C. A collection of INDEL markers for map-based cloning in seven Arabidopsis accessions. J. Exp. Bot. 2012, 63, 2491–2501. [Google Scholar] [CrossRef] [PubMed] [Green Version]
  21. García-Lor, A.; Luro, F.; Navarro, L.; Ollitrault, P. Comparative use of InDel and SSR markers in deciphering the interspecific structure of cultivated citrus genetic diversity: A perspective for genetic association studies. Mol. Genet. Genom. 2011, 287, 77–94. [Google Scholar] [CrossRef] [PubMed]
  22. Hayashi, K.; Yoshida, H.; Ashikawa, I. Development of PCR-based allele-specific and InDel marker sets for nine rice blast resistance genes. Theor. Appl. Genet. 2006, 113, 251–260. [Google Scholar] [CrossRef]
  23. Subbaiyan, G.K.; Waters, D.L.; Katiyar, S.K.; Sadananda, A.R.; Vaddadi, S.; Henry, R.J. Genome-wide DNA polymorphisms in elite indica rice inbreds discovered by whole-genome sequencing. Plant Biotechnol. J. 2012, 10, 623–634. [Google Scholar] [CrossRef]
  24. Wang, W.; Mauleon, R.; Hu, Z.; Chebotarov, D.; Tai, S.; Wu, Z.; Li, M.; Zheng, T.; Fuentes, R.R.; Zhang, F.; et al. Genomic variation in 3010 diverse accessions of Asian cultivated rice. Nature 2018, 557, 43–49. [Google Scholar] [CrossRef] [PubMed]
  25. Abbai, R.; Singh, V.K.; Nachimuthu, V.V.; Sinha, P.; Selvaraj, R.; Vipparla, A.K.; Singh, A.K.; Singh, U.M.; Varshney, R.K.; Kumar, A. Haplotype analysis of key genes governing grain yield and quality traits across 3K RG panel reveals scope for the development of tailor-made rice with enhanced genetic gains. Plant Biotechnol. J. 2019, 17, 1612–1622. [Google Scholar] [CrossRef] [Green Version]
  26. Li, J.-Y.; Wang, J.; Zeigler, R.S. The 3000 rice genomes project: New opportunities and challenges for future rice research. Gigascience 2014, 3, 2047-217X-3-8. [Google Scholar] [CrossRef] [Green Version]
  27. Lv, Q.; Huang, Z.; Xu, X.; Tang, L.; Liu, H.; Wang, C.; Zhou, Z.; Xin, Y.; Xing, J.; Peng, Z.; et al. Allelic variation of the rice blast resistance gene Pid3 in cultivated rice worldwide. Sci. Rep. 2017, 7, 10362. [Google Scholar] [CrossRef] [PubMed] [Green Version]
  28. Yuan, J.; Wang, X.; Zhao, Y.; Khan, N.U.; Zhao, Z.; Zhang, Y.; Wen, X.; Tang, F.; Wang, F.; Li, Z. Genetic basis and identification of candidate genes for salt tolerance in rice by GWAS. Sci. Rep. 2020, 10, 9958. [Google Scholar] [CrossRef] [PubMed]
  29. Mansueto, L.; Fuentes, R.R.; Borja, F.N.; Detras, J.; Abriol-Santos, J.M.; Chebotarov, D.; Sanciangco, M.; Palis, K.; Copetti, D.; Poliakov, A.; et al. Rice SNP-seek database update: New SNPs, indels, and queries. Nucleic Acids Res. 2017, 45, D1075–D1081. [Google Scholar] [CrossRef]
  30. Kaur, V.; Yadav, S.K.; Wankhede, D.P.; Pulivendula, P.; Kumar, A.; Chinnusamy, V. Cloning and characterization of a gene encoding MIZ1, a domain of unknown function protein and its role in salt and drought stress in rice. Protoplasma 2020, 257, 475–487. [Google Scholar] [CrossRef]
  31. Vitte, C.; Ishii, T.; Lamy, F.; Brar, D.; Panaud, O. Genomic paleontology provides evidence for two distinct origins of Asian rice (Oryza sativa L.). Mol. Genet. Genom. MGG 2004, 272, 504–511. [Google Scholar] [CrossRef]
  32. Londo, J.P.; Chiang, Y.C.; Hung, K.H.; Chiang, T.Y.; Schaal, B.A. Phylogeography of Asian wild rice, Oryza rufipogon, reveals multiple independent domestications of cultivated rice, Oryza sativa. Proc. Natl. Acad. Sci. USA 2006, 103, 9578–9583. [Google Scholar] [CrossRef] [Green Version]
  33. Huang, X.; Kurata, N.; Wei, X.; Wang, Z.X.; Wang, A.; Zhao, Q.; Zhao, Y.; Liu, K.; Lu, H.; Li, W.; et al. A map of rice genome variation reveals the origin of cultivated rice. Nature 2012, 490, 497–501. [Google Scholar] [CrossRef] [Green Version]
  34. Carpentier, M.C.; Manfroi, E.; Wei, F.J.; Wu, H.P.; Lasserre, E.; Llauro, C.; Debladis, E.; Akakpo, R.; Hsing, Y.I.; Panaud, O. Retrotranspositional landscape of Asian rice revealed by 3000 genomes. Nat. Commun. 2019, 10, 24. [Google Scholar] [CrossRef]
  35. Fan, F.; Li, N.; Wang, J.; Liu, X.; Liu, J.; Zhu, Y.; Li, S. Molecular marker-directed development of a novel cytoplasmic male sterile line in rice. Mol. Breed. 2015, 35. [Google Scholar] [CrossRef]
  36. Rohlf, F.J. NTSYS-pc: Numerical Taxonomy and Multivariate Analysis System; Version 1.8; Exeter Software: Setauket, NY, USA, 1992. [Google Scholar]
  37. Kumar, S.; Stecher, G.; Tamura, K. MEGA7: Molecular Evolutionary Genetics Analysis Version 7.0 for Bigger Datasets. Mol. Biol. Evol. 2016, 33, 1870–1874. [Google Scholar] [CrossRef] [Green Version]
  38. Nagaraju, J.; Kathirvel, M.; Kumar, R.R.; Siddiq, E.A.; Hasnain, S.E. Genetic analysis of traditional and evolved Basmati and non-Basmati rice varieties by using fluorescence-based ISSR-PCR and SSR markers. Proc. Natl. Acad. Sci. USA 2002, 99, 5836–5841. [Google Scholar] [CrossRef] [PubMed] [Green Version]
  39. Liu, J.; Li, J.; Qu, J.; Yan, S. Development of Genome-Wide Insertion and Deletion Polymorphism Markers from Next-Generation Sequencing Data in Rice. Rice 2015, 8, 1–10. [Google Scholar] [CrossRef] [PubMed] [Green Version]
  40. Vaughan, D.A.; Lu, B.-R.; Tomooka, N. The evolving story of rice evolution. Plant Sci. 2008, 174, 394–408. [Google Scholar] [CrossRef]
  41. Vaughan, D.A.; Lu, B.-R.; Tomooka, N. Was Asian Rice (Oryza sativa) Domesticated More Than Once? Rice 2008, 1, 16–24. [Google Scholar] [CrossRef] [Green Version]
  42. Cheng, K.; Wang, X.; Lu, Y. The synthetical research and utilization of Yunnan rice resource: The reorganization of the Asian cultivated rice classification. Acta Agron. Sin. 1984, 10, 271–279. [Google Scholar]
  43. Liu, P.; Cai, X.-X.; Lu, B.-R. Single-seeded InDel fingerprints in rice: An effective tool for indica-japonica rice classification and evolutionary studies. J. Syst. Evol. 2012, 50, 1–11. [Google Scholar] [CrossRef]
  44. Lu, B.-R.; Cai, X.; Xin, J. Efficient indica and japonica rice identification based on the InDel molecular method: Its implication in rice breeding and evolutionary research. Prog. Nat. Sci. 2009, 19, 1241–1252. [Google Scholar] [CrossRef]
  45. Alonso-Blanco, C.; Andrade, J.; Becker, C.; Bemm, F.; Bergelson, J.; Borgwardt, K.M.; Cao, J.; Chae, E.; Dezwaan, T.M.; Zhou, X.; et al. 1135 Genomes Reveal the Global Pattern of Polymorphism in Arabidopsis thaliana. Cell 2016, 166, 481–491. [Google Scholar] [CrossRef] [PubMed] [Green Version]
Figure 1. Identification and distribution of InDels in the 3000 Rice Genome Dataset. (A) The frequency and relative distribution of InDels physically mapped on 12 chromosomes of Nipponbare genome are illustrated by a circos circular ideogram. The outermost circles signify the different physical size (Mb) of 12 chromosomes, the middle circles represent the number of all InDels per 1 Mb and the distribution on the chromosome, and the inner circles represent the number of 50–1000-bp long InDel per 1 Mb and its distribution on the chromosome. (B) The number of all InDels and >50-bp long InDels in various genomic chromosomes. Green represents the number of all InDels and red represents the number of >50-bp long InDels. (C) The density of all InDels and >50-bp long InDels in 12 chromosomes. Green represents the density of all InDels and red represents the density of >50-bp long InDels.
Agriculture 11 00655 g001
Figure 2. Detection of the amplification efficiency of 96 pairs of primers. (A) Schematic diagrams of PCR amplification of the InDel sequence. The primers designed at the position 100–200 bp upstream and downstream. Orange arrows indicate the primer design position. (B) The relative distribution of 96 InDel markers on 12 chromosomes of Nipponbare genome. (C) PCR amplification with 96 InDel markers. M: DL2000, DNA marker.
Agriculture 11 00655 g002
Figure 3. PCR amplification and phylogenetic tree of 36 different japonica rice varieties with the insertion/deletion (InDel). (A) PCR amplification and electrophoresis of 36 japonica rice varieties by using the 26 InDel primer pairs. M: DL2000, DNA marker. Nipponbare was used as a control. (B) Phylogenetic tree of 36 japonica rice candidate materials by the UPGMA dendrogram using 26 InDel markers. The names of different groups and subgroups are represented by different colours, and numbers in the phylogenetic tree represent evolutionary distances of the tree structure below this node.
Agriculture 11 00655 g003
Figure 4. PCR amplification and phylogenetic tree of 36 indica rice varieties screened using InDel markers. (A) PCR profiles of 36 indica rice varieties with 25 InDel markers. M: DL2000, DNA marker. YueNongSiMiao (YNSM) was used as a control. (B) Phylogenetic tree of 36 indica rice varieties based on the 25 InDel markers using the UPGMA dendrogram. The different colours represent the name of groups and subgroups. The numbers in the phylogenetic tree represent evolutionary distances of the tree structure below this node.
Agriculture 11 00655 g004
Figure 5. PCR amplification and phylogenetic tree of the recombinant inbred line (RIL) population. (A) PCR amplification of the RILs. M: DL2000, DNA marker. YueNongSiMiao (YNSM) was used as a control. (B) Phylogenetic tree of the RILs and 18 indica varieties by the UPGMA dendrogram using InDel markers. Dark blue and orange represent indica varieties and RILs, respectively. The numbers in the phylogenetic tree represent evolutionary distances of the tree structure below this node.
Agriculture 11 00655 g005
Table 1. The number of InDels compared with the reference genome (Nipponbare MSU7/IRGSP1.0).
ChromosomeNumber of all InDelDensity a of all InDelNumber of InDel (≥50 bp)Density a of InDel (≥50 bp)
Chr01137,4433.18 78,9351.82
Chr02106,8372.97 59,4971.66
Chr03101,2142.78 54,7921.50
Chr04115,3553.25 61,1691.72
Chr0588,1642.94 45,2781.51
Chr06105,9223.39 59,8531.92
Chr07101,6813.42 58,2651.96
Chr08103,3753.63 57,8432.03
Chr0977,0003.35 41,7521.81
Chr1085,4813.68 49,9952.15
Chr11118,0864.07 68,5372.36
Chr12107,9453.92 63,5592.31
Total1,248,5033.34 699,4751.87
a Density was defined as the number of InDels per 1000 bp.
Publisher’s Note: MDPI stays neutral with regard to jurisdictional claims in published maps and institutional affiliations.

