1. Introduction
The world’s population is expected to reach 9.15 billion people by 2050, and demand for livestock products, excluding pork and poultry products, is expected to increase by between 1.4 and 1.8 times 2010 consumption levels [
1]. Meeting this increased demand without adverse environmental effects will require more efficient utilisation of natural resources [
2]. Livestock production systems will require greater access to high quality forage resources, particularly in developing countries where low quality crop residues represent a significant proportion of the available forage resource. Integration of crop and livestock production to allow grazing of grain crops and the growing of higher quality improved forages are options [
3,
4], though neither will completely overcome the seasonality of production caused by temporal variability in rainfall and temperature. A complementary option is the conservation of high-quality pastures and forage crops as hay or silage to create a forage resource, which can be used to offset feed quality and availability deficits. The provision of additional forage either by growing alternative species and cultivars or using conserved forages can also deliver environmental benefits: reduced risk of soil degradation caused by overgrazing and reduced methane emissions per unit of livestock production.
When grown under dryland conditions, cereal and cereal/vetch crops produce relatively high yields of forage compared to most temperate pasture species and are suitable for conservation as hay or silage [
5]. They are well suited to a range of growing environments and their potential feed value has been reported by several authors [
6,
7,
8]. In mixed farming systems they can provide an additional farming system benefit as a break crop between the cropping and pasture phases for weed control, or on livestock properties as part of a pasture renovation program. Therefore, these crops can be used to increase whole farm livestock production.
However, while forage crops undoubtedly have a crucial part to play in integrated crop livestock systems, it is important to fully understand their role in these systems and how their full economic potential can be realized. Varietal choice, stage of crop maturity, crop yield, and the relationship between crop yield and quality, interaction with environmental conditions, and livestock type conceivably all impact the potential of these systems. Some studies have evaluated the general economic impact of conserving forages within grazing systems [
9,
10]. However, the authors are unaware of other reports that have evaluated in detail the impact of crop characteristics on economic returns that can be generated from conserving cereal and cereal/vetch crops. This paper uses data for a range of cereal and cereal/vetch crops representing different varieties, stage of crop maturity, yield, and quality generated collected over four years [
5]. It reports on a detailed analysis of the impact of crop yield and quality and discusses the broader implications of these factors for key livestock production systems and, specifically, their potential value to lamb or beef finishing enterprises in major livestock production regions of south eastern Australia.
In the next section, the materials and methods used to undertake the analysis are described. The results of the analysis are first presented by reporting the predicted economic performance. Results are then presented for each livestock species with a further disaggregation of the results according to whether the cereal or cereal vetch forage is crude protein (CP) limiting or not. A discussion of the implications of these results follows, with key points drawn out in the conclusion.
2. Materials and Methods
Yield and feed quality data (digestibility and CP content) of cereal and cereal/vetch crops (n = 193) obtained from a series of four plot experiments [
5] were used to predict feed metabolisable energy (ME) content, livestock production parameters (intake, liveweight gain and production per hectare), revenue, and GM. The experiments were sown at four sites across southern New South Wales, Australia in consecutive years: at Wagga Wagga (35°12′ S, 147°37′ E) in 2008, Culcairn (35°59′ S, 147°03′ E) in 2009, Temora (34°41′ S, 147°52′ E) in 2010 and Coolamon (34°89′ S, 147°23′ E) in 2011 (
http://www.bom.gov.au/climate/data/, accessed on 3 March 2021). All sites were within an 85 km radius of Wagga Wagga.
Full details of crops grown, their management, measurements taken, and statistical analysis for years 2008, 2009, and 2010 have been previously reported [
5]. Briefly, the crops comprised seven cereal varieties, including two wheat (
Triticum aestivum L. cv EGA Wedgetail (dual purpose winter wheat) and
T. aestivum L. cv Strzelecki (grain only spring wheat)), two barley (
Hordeum vulgare L. cv. Urambie (dual purpose barley) and
H. vulgare L. cv. Gairdner (malting barley)), two oat (
Avena sativa L. cv Mannus (grain oat) and
A. sativa L. cv. Echidna (dual purpose oat)), and one triticale (
x Triticosecale cv. Tobruk (dual purpose triticale)) variety, grown either as monocultures or in combination with purple vetch (
V. benghalensis L. cv. Popany), hereafter referred to as cereal or cereal/vetch crops. Cereal varieties were selected to ensure a range of species and varieties adapted to and grown in the region [
11]. Treatments were the same for all sites, with three replicates per treatment.
Sowing rate for all the cereal varieties was 70 kg/ha for the monocultures and 15 kg/ha when sown with vetch at 60 kg/ha. Experimental methodology, rainfall, yield, and feed quality data from the Wagga Wagga, Culcairn, and Temora experiments have previously been reported [
5]. The Coolamon site was sown on 3 June 2011 in a randomised block design with Starter 15 fertiliser (14.2% N; 12.9% P; 10.7% S) at 105 kg/ha. Plots were 1.55 m wide by 9.05 m long by 9 rows with 17 cm row spacing. There was no buffer area between adjoining plots but there was a cereal crop buffer on all four sides to mitigate any edge effect. Crops were re-sown twice on 1 July and 4 August because of a mouse plague resulting in severe mouse damage, and baited with a rodenticide (MouseOff
®; a.i. 25 g/kg Zinc Phosphide; Animal Control Technologies (Australia) Pty Ltd, Somerton, VIC, Australia) each time. Consequently, the 2011 crops were sown much later than the target time of late May or early June. It was intended to harvest a portion of each plot (treatment) on four occasions, when the cereal component reached the boot, flowering (anthesis), milk, and soft/mid dough stage of development, equivalent to approximate growth stage (GS) 45, 65, 75, and 85, respectively [
12], hereafter referred to as H1, H2, H3, and H4. However due to seasonal conditions, the actual number of harvests varied with treatment and site.
Crop samples for 2008, 2009, and 2010 were dried at 80 °C for 24 and ground through a Perten
® 3100 laboratory mill (PerkinElmer Inc., Waltham, MA, USA) fitted with a 1 mm screen prior to chemical analysis. Digestibility (digestible organic matter (DM basis): DOMD) was determined by modified Tilley and Terry in vitro technique [
13], with additional N to compensate for the low N status of some feeds [
14]. Nitrogen (N) was determined using the Dumas combustion method with a Leco CNS 2000
® analyser (Leco, St. Joseph, MI, USA) and CP content was calculated as N × 6.25 [
15]. Yield and forage quality parameters for years 2008, 2009 and 2010 were analyzed using the REML function in Genstat 20th Edition [
16]. Yield data for each year were analyzed separately due to the large differences between years with fixed effects being cereal variety, vetch, harvest and all interactions, and random effects were replicate and plot. Fixed effects for forage quality parameters were year, cereal variety, vetch, harvest and all interactions, and random effects were replicate within year and plot within year. Vetch content was fitted as a covariate within each cereal variety × vetch × harvest combination for all forage quality parameters analyzed, using the method of Urquhart [
17]. Species composition was restricted to the cereal/vetch mixtures as the cereal only treatments were monocultures, with fixed effects being year, variety, harvest and their interaction; and random effects were replicate within year and plot within year. Though not previously reported, experimental design, sample processing, and statistical analyses for 2011 were as previously reported unless stated otherwise. Crop harvesting in 2011 was as for 2008. Predicted means for the statistically analyzed crop data are provided in the
Supplemental Tables.
Digestibility (digestible organic matter (DM basis): DOMD) and nitrogen (N) content of the 2011 crops was determined as previously reported for the 2008, 2009, and 2010 crops using a modified Tilly and Terrey method [
5]. Metabolisable energy (ME: MJ/kg DM) content was calculated from DOMD values for each crop using the equation: ME = DOMD% × 0.203–3.001 [
15] and CP content was calculated as N × 6.25 [
15]. Average dry matter intake (DMI: kg DM/day) and liveweight change (LWC) for lambs (g/day) and steers (kg/day) were predicted from ME and CP values using Grazfeed (ver. 5.0.3) [
18], assuming a roughage only diet for the following classes of livestock:
Sheep: Crossbred (Border Leicester × Merino or Dorset × Merino) castrated male (wether) lambs, initially 6 months old, 30 kg liveweight, and with a 3 cm fleece gaining 20 kg to achieve a final liveweight of 50 kg.
Cattle: British breed (Hereford, Angus or Beef Shorthorn) castrated male (steer) cattle, initially 12 months old, 300 kg liveweight and with a 1 cm coat, gaining 140 kg to achieve a final liveweight of 440 kg.
These livestock classes and target finishing liveweights are common in the region where the forage options are being explored. Thus, the analysis enabled a comparison of the returns for two major livestock activities in the region as well as for a comparison of the returns that could be generated by feeding the forages to either the sheep or the cattle to achieve the stated outcomes.
To compare profitability of the different forage crop options, GM analysis was used given the similarity in fixed costs across the options [
19]. All estimates are in Australian dollars (AUD
$). GM per hectare was calculated as follows:
where GM is estimated GM in
$/ha; LRest is estimated livestock revenue in
$/ha; and CPC are crop production and feed out costs in
$/ha
where LGpred is predicted liveweight gain in kg liveweight/ha; and LP is liveweight price per kg liveweight, and
where CY is crop yield in kg DM/ha; DMI is dry matter intake in kg DM/head.day; and LWC is liveweight change for the given DMI consumed.
Liveweight production, LRest and GM were calculated assuming 70% utilization of the total feed grown and a liveweight gain value of
$4.79/kg and
$1.46/kg for sheep and cattle, respectively. The value of livestock gain was calculated from the difference between five year average prices per kg for lambs at 30 and 50 kg, and cattle at 300 and 440 kg, as reported by Meat and Livestock Australia, the organization which regulates standards for meat and livestock management in Australian and international markets and compiles sheep and cattle market information [
20].
The estimate of 70% utilization is derived from limited published results and the authors’ personal observations for a well-managed conservation system [
21]. It incorporates estimated production losses from dry matter and quality losses that occur during conservation, storage, and feedout. As such, it may discount well-made silage, which has lower wilting and harvesting losses. However, the authors’ experience is that actual silage storage losses can often be much greater than for a well-managed forage conservation system.
Crop production costs per hectare included
$20 for weed control using herbicides,
$35 for cultivation,
$55 for sowing (seeding),
$80 for fertilizer,
$45 for cereal seed or
$65 for cereal/vetch seed,
$50 for mowing, and
$60 for tedding and raking. Variable costs, based on utilized crop DM yield, were
$75 per tonne of DM for harvesting and
$20 per tonne DM for feed out. Mowing, tedding, raking, and harvest are based on estimated contract rates. Other rates are for an owner operator and do not include overheads as the analysis is a relative comparison across fodder crops with similar overheads. Crop utilization rate, livestock value and costs are based on published information and personal observation and have allowed for normal cost increases over time but will vary between systems and also efficiencies within systems [
22,
23]. Utilization of crops grown and variable costs were assumed to be the same whether conserved as hay or silage.
Genstat (ver 20.1, Hemel Hempstead, UK) statistical package was used to estimate correlations between crop characteristics (CY, ME and CP) and predicted animal parameters (DMI and LWC), performed regression analysis on the relationships between crop characteristics, livestock parameters, and economic performance [
16]. Data was combined over sites, but sheep and cattle data were analyzed independently. The data was further partitioned based on whether or not CP content was potentially limiting growth rates for the level of forage ME, as indicated by Grazfeed, hereafter referred to as CP+ and CP−. Crops that were predicted to only maintain liveweight or cause liveweight loss because of low feed quality were removed from the estimation of LRest and GM and not included in the development of relationships.
3. Results
Annual rainfall and rainfall during the growing season from April to November inclusive was below average in 2008 and 2009, and above average in 2010 as was previously reported [
5]. In 2011, annual rainfall was higher than the long-term average; however, growing season rainfall from was less than the long-term average (
http://www.bom.gov.au/climate/data/, accessed on 3 March 2021) (
Table 1).
The cereal and cereal/vetch crops varied in yield, ME, and CP content between and within experiments, with values consistent with reports by other authors [
24,
25,
26,
27,
28,
29]. Yield and feed quality data for the 2008 to 2010 experiments have previously been published and are presented as
Supplementary Tables [
5]. Statistically analysed yield and feed quality data for 2011 are also presented as
Supplementary Tables. Yield ranged from 1047 to 37,718 kg DM/ha, and there was a continuum in both ME and CP content which ranged from 6.9 to 13.1 MJ/kg DM and 49.8 to 215.4 g/kg DM respectively (
Table 2). Analysis and interpretation of the yield and feed quality data indicated that:
Favourable growing conditions i.e., adequate soil moisture, increased forage yield;
Yield increased with successive harvests provided sufficient moisture was available for growth;
Addition of vetch had a variable effect on yield;
Vetch increased CP content of all crops and at all harvests;
The effect of vetch on ME was variable.
Predicted daily DMI and LWC ranged from 0.69 to 1.78 kg DM/day and −37 to 382 g/day for sheep, and 4.42 to 11.14 kg DM/day and −0.50 to 2.48 kg/day for cattle, respectively. Predicted ME and CP maintenance requirements for the target animals at their initial liveweight were an ME of 7.9 and 7.0 MJ/kg DM, and CP content of 8.3 and 9.9 g/kg DM, for cattle and sheep, respectively.
3.1. Predicted Economic Performance
Sheep were predicted to lose weight on three of the crops and these were excluded from all further economic comparisons and analysis: Echidna at H4 (9.6 ME, 49.8 g CP/kg DM) at Culcairn in 2009 and Mannus (6.9 ME, 75.2 g CP/kg DM) and Echidna (7.3 ME, 71.7 g CP/kg DM) both at H4 at Temora in 2010.
In 2008 all crops had positive GMs when fed to sheep, with LRests ranging from $700 to $1341/ha and GMs of $213 to $834/ha. However, in 2009, while sheep LRest for all fodder crops were positive, two crops (Mannus and Tobruk, both at H4) had a negative GM. The variation in LRest and GMs across crops was much greater in 2009 than in 2008, with LRest ranging from $773 to $4014/ha and GMs from −$108 to $3140/ha.
Revenues in 2010 showed the greatest variation, from $516 to $7504/ha, while GMs ranged from −$1489 to $5788/ha. Five crops had a negative GM: Tobruk (H2, H3 and H4); Echidna (H3); Gairdner (H4); and Echidna/vetch (H4). In 2011 LRest ranged from $184 to $2909/ha and GMs from −$567 to $2167/ha; crops with negative GMs were all cereals at H4, namely Mannus, Urambie, and Strzelecki.
Revenue and GMs were estimated to be lower for cattle than sheep in all years, with a greater number of crops returning a negative GM. In 2008, LRest ranged from $225 to $440/ha. However, GMs were negative for all crops and ranged from −$281 to −$49/ha. In 2009, the range in LRest was $87 to $1359/ha and GMs from −$794 to $485/ha. Twenty-two of the 28 cereal crops, and five of the cereal/vetch crops, had negative GMs, with the majority (19) of these from H3 and H4.
Compared to sheep, cattle lost liveweight on an additional five crops in 2010 (Tobruk, H2 (7.5 ME, 88.1 g CP/kg DM), H3 (8.5 ME, 70.4 g CP/kg DM), and H4 (7.7 ME, 83.5 g CP/kg DM); Gairdner (7.7 ME, 83.5 g CP/kg DM); and Echidna/vetch (7.6 ME, 113.8 g CP/kg DM)) and Strzelecki H4 in 2011 (9.1 ME, 58.5 g CP/kg DM), and maintained liveweight on one crop (Tobruk, 9.0 ME, 64.2 g CP/kg DM, H4 2010). These were all excluded from the economic analysis. In 2010, LRest ranged from
$423 to
$2363/ha and GMs from -
$1764 to
$647/ha, with 22 of the cereal crops and 16 of the cereal/vetch crops having a negative GM. A negative GM was observed for all cereal crops harvested at H3 and H4, and for 57% and 44% of the cereal/vetch crops harvested at H3 and H4, respectively. In 2011 60% (n = 15) of the cereal and 95% (n = 18) of the cereal/vetch crops had negative GMs. Revenues ranged from
$45 to
$918/ha and GMs from −
$646 to
$215/ha. The average and range in LRest and GM of all crops is shown in
Table 3.
3.2. Predicted Relationships by Livestock Species
Revenue (synonymous with the value of liveweight production per hectare) explained 87.8% of the variation in sheep GMs, while CY explained 36.7% of the variation in LRest. The latter was improved marginally by fitting CY + ME + CP (55.2%). However, CY only explained 8.1% of the variation in GM, with CY + ME + CP explaining 34.7%.
In contrast to sheep, LRest only explained 14.7% of the variation in GMs for cattle. Liveweight change (33.6%) was the single parameter that explained the most variation in GM, while fitting CY + ME + CP explained 46.6%. However, as with sheep, yield was the single parameter that explained most variation in LRest per hectare for cattle (43.5%) with the addition of ME plus CP to the model, increasing the variation explained to 63.7%.
Metabolisable energy accounted for only 2.2% and 1.1% of the variation in DMI for sheep and cattle, respectively. In contrast CP accounted for 79.1% and 71.5% for sheep and cattle, respectively, which was not improved by fitting both ME and CP for either sheep (81.5%) or cattle (75.0%). However, ME accounted for 48.0% and 42.3% of the variation in LWC, whereas CP accounted for 37.4% and 34.1% of the variation in LWC for sheep and cattle, respectively, and the variation accounted for was improved by fitting both ME and CP for sheep (85.2%) and cattle (82.9%). There was also a negative correlation between yield and LWC for both sheep (
r = −0.614) and cattle (
r = −0.579). Predicted relationships between GM and LRest for sheep and cattle are shown in
Table 3.
3.3. Predicted Relationships by Species and CP Limitation
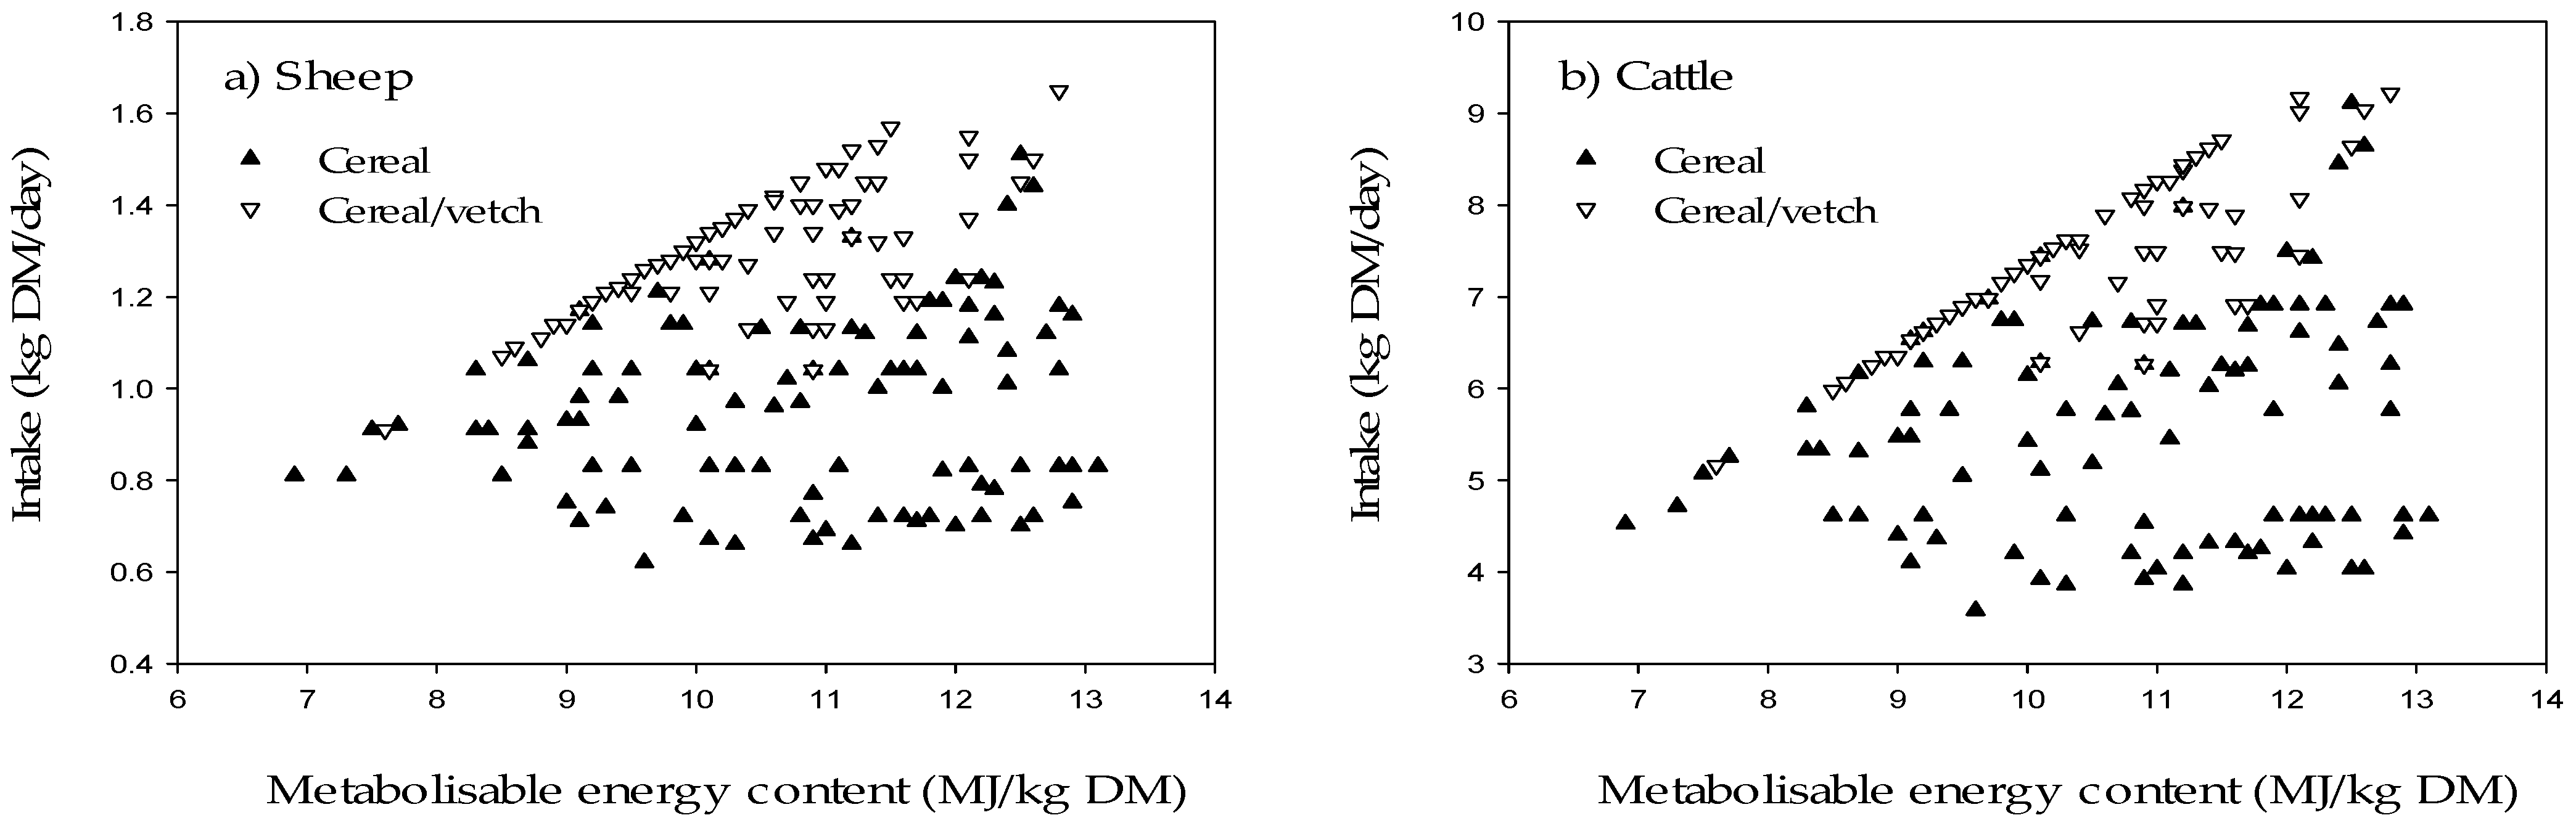
Within the crops tested there was a continuum in both ME and CP content, which ranged from 6.9 to 13.1 MJ/kg DM and 49.8 to 215.4 g/kg DM, respectively. The crops were divided into two groups based on whether Grazfeed predicted that CP content was adequate for the available ME, based on apparent differences between the two groups. An apparent linear relationship between ME and DMI existed for some crops, mainly cereal/vetch (
Figure 1). Crops which did not fit the relationship were those where CP was determined to be inadequate to fully utilise the available ME. The data was subsequently partitioned into two groups based on whether Grazfeed predicted that CP was non-limiting (CP+) or may limit (CP−) production for each individual crop’s ME content at the start of the feeding period. Of the 193 crops, the proportion with adequate CP content was 23.3% for sheep and 38.9% for cattle, and of the crops with adequate CP for sheep (n = 45) and cattle (n = 69), 95.6% and 82.7%, respectively, were cereal/vetch. In contrast, 67.6% (sheep) and 75.4% (cattle) of crops with inadequate CP were cereal crops.
The variation in GM subsequently accounted for by LRest in the CP+ crops was similar to that observed for the whole data set for both sheep (87.6%) and cattle (11.3%). The model which accounted for the most variation in sheep GM was CY + DMI + LWC (91.5%) which was similar to the variation in GM explained by LRest, and more than by CY+ ME + CP (59.6%). However, for cattle GM, CY + DMI (51.1%) explained as much of the variation as CY + DMI + LWC (51.3%), and only explained marginally more of the variation than yield plus the feed quality parameters: CY + ME + CP (46.4%).
Within the CP− group, LRest explained 83.9% and 14.9% of the variation in GM for sheep and cattle, respectively, which was similar to the whole data set. However, for the sheep CP− cohort, the model CY + DMI + LWC accounted for only 6.6% of the variation in GM, while CY + ME + CP explained less of the variation in GM (17.9%) and LRest (39.1%) than for the sheep CP+ cohort. The CY + DMI + LWC model explained 41.7% of the variation in GM, while CY + ME + CP accounted for 49.1% and 42.8% of the variation in GM and LRest, respectively, for CP- cattle.
Dividing the data into CP+ and CP- categories changed the variation in predicted livestock responses accounted for by feed quality parameters. Within the CP+ cohort, ME explained 99.9% and 98.3% of the variation in DMI and LWC for sheep and 81.1% and 96.3% for cattle. There was also a strong negative correlation between yield and LWC for both sheep (r = −0.769) and cattle (r = −0.709). Within these crops, CY + DMI + LWC accounted for 94.1% of the variation in LRest for sheep: which was higher than CY + ME + CP (71.7%). CY + DMI + LWC accounted for 77.3% of the variation in LRest for cattle, which was higher than CY + ME + CP (74.8%).
However, within the CP- crops, ME only explained 5.0% and 4.3% of the variation in DMI, and 46.5% and 40.0% of the variation in LWC for sheep and cattle, respectively. Conversely, CP explained 98.0% and 97.6% of the variation in DMI, and 79.8% and 85.9% of the variation in LWC for sheep and cattle, respectively. Including both CP and ME increased the variation in LWC explained to 98.4% for sheep and 98.9% for cattle. The correlation between yield and LWC was moderately negative for the CP− crops, being −0.602 for sheep and −0.567 for cattle. Within the CP− crops, CY + DMI + LWC accounted for 30.8% and CY + ME + CP for 39.1% of the variation in sheep LRest, and CY + DMI + LWC accounted for 34.7% and CY + ME + CP for 42.8% in cattle LRest. Predicted relationships between GM and LRest for sheep and cattle for CP+ and CP− crops are shown in
Table 3.
4. Discussion
Growth rates of young ruminant livestock respond positively to increasing levels of dietary energy (ME) provided other nutritional requirements are met, principally dietary CP content and the amount of protein reaching the small intestine [
30,
31]. Therefore, when a diet is in balance, CP content is sufficient to match the available ME to achieve potential liveweight gain. Theoretically, either ME or CP could be the limiting component for any feed [
30]. However, the default prediction from models such as Grazfeed is whether CP is adequate to utilise the available ME. Similarly, Grazfeed does not account for any other potential deficiencies such as minerals. Of the 193 crops, weight loss was predicted on three crops for sheep and on nine crops for cattle, with cattle only maintaining weight on another crop.
Where CP was adequate, then ME clearly determined DMI and LWC, with both increasing as ME content increased. However, when CP was inadequate, then ME had a lesser effect. Furthermore, the level of inadequacy was variable between crops with the same ME content, which affected the relationship between ME and both DMI and LWC. It should however be noted that the proportion of crops with adequate CP would have been higher if fed to animals with lower CP requirements, e.g., mature cows and ewes, growing animals closer to mature liveweight. The CP content of cereal/vetch crops was higher than the corresponding cereal crop as was expected and previously reported by other authors [
5,
24,
32]. Therefore, the growing of cereal/vetch compared to cereal monocultures increased the likelihood that CP was adequate for the available energy, and, perhaps more importantly, reduced the risk that low CP would limit production. Adequate CP content did not, however, ensure a positive GM (
Table 4), even after excluding those crops where animals were predicted to lose or maintain liveweight; although, the proportion of crops with a positive GM was slightly higher when CP was not limiting: 97.8% vs. 93.1% for sheep and 39.7% vs. 21.9% for cattle. This occurred when crops with low ME were incapable of supporting growth rates and estimated revenue that exceeded fixed and variable crops. Furthermore, some crops, such as all cereals at the first harvest in 2008, had high ME contents that would have sustained high growth rates, even though the level of CP was less than optimum for the available ME level.
Fixed and variable costs were the same for both species, but the value of the liveweight gain for sheep was much higher than for cattle ($4.79 vs. $1.46/kg). Consequently, for the same crop, the ratio of LRest to costs was higher for sheep than cattle and explains the greater proportion of crops returning positive GM for sheep compared to cattle. The average LRest:cost ratios were 2.53:1 for sheep and 0.82:1 for cattle. There was also a greater range in LRest:costs for sheep (0.25 to 4.83) compared to cattle (0.07 to 1.60), showing that as product value increases there is a disproportionately larger increase in the LRest:cost ratio and therefore GM. In addition, the LRest:costs ratio for cereal/vetch (1.64:1) was slightly higher than for cereal (1.50:1) crops. Sheep and cattle values vary with different market price scenarios and are traditionally more variable than forage conservation costs and therefore, the relative returns from feeding conserved forages will be more dependent on livestock prices.
Since the fixed and variable costs are set, only the crop characteristics (CY, ME, and CP) and livestock parameters (DMI and LWC) can be viewed as varying in the context of this comparison, although total variable costs increase linearly with CY. Various studies have reported crop DM yield increasing with maturity provided growing conditions are favourable [
24,
33]. However, under less favourable conditions such as moisture stress, the increases are small or even non-existent, as was the case in these experiments in 2008 and 2011.
The rate and significance of the decline in ME and CP content with maturity between individual harvests differed with crop and year [
5]. Furthermore, there was a consequent reduction in predicted DMI and LWG for both sheep and cattle consistent with this trend. This is consistent with other reports that ME and CP decline with maturity although some recovery in ME can occur at later harvests of cereal crops due to grain development [
6,
7,
8,
24]. Of importance is whether the loss in quality and potential livestock production can be offset by increased crop DM yield and if the subsequent livestock production positively affects GM. When considered in conjunction with temporal changes in yield, comparative analysis showed harvesting crops at later stages of maturity will reduce feed quality while per hectare livestock production and LRest is unlikely to be offset by yield increases in most scenarios. This was irrespective of initial crop yield or quality, or the rate of change in either. Additionally, when analyzing quality data from the 2008, 2009 and 2010 experiments, the authors showed a negative correlation with yield per se that was unrelated to maturity, which appeared related to fibre content [
5]. The implication being that high yielding crops do not necessarily return the highest GM.
These findings have implications for livestock production and the economic returns from these crops if conserved as hay or silage. They are also consistent with comparisons reported by Davies that producing high quality silage increased GM per hectare compared to low quality silage [
34]. Whilst growing conditions are outside the purview of producers this result demonstrates the value of forage quality testing, especially for those crops which have a high herbage yield and have been grown under favourable seasonal conditions. For crops with very low ME and/or CP then alternative uses to fodder conservation for on-farm livestock production may be more profitable. Alternatively, grazing crops which are advanced and relatively high yielding early in the growing season, e.g., before the boot stage, might be an option. However, this is only speculative and further research is needed to assess the impact.
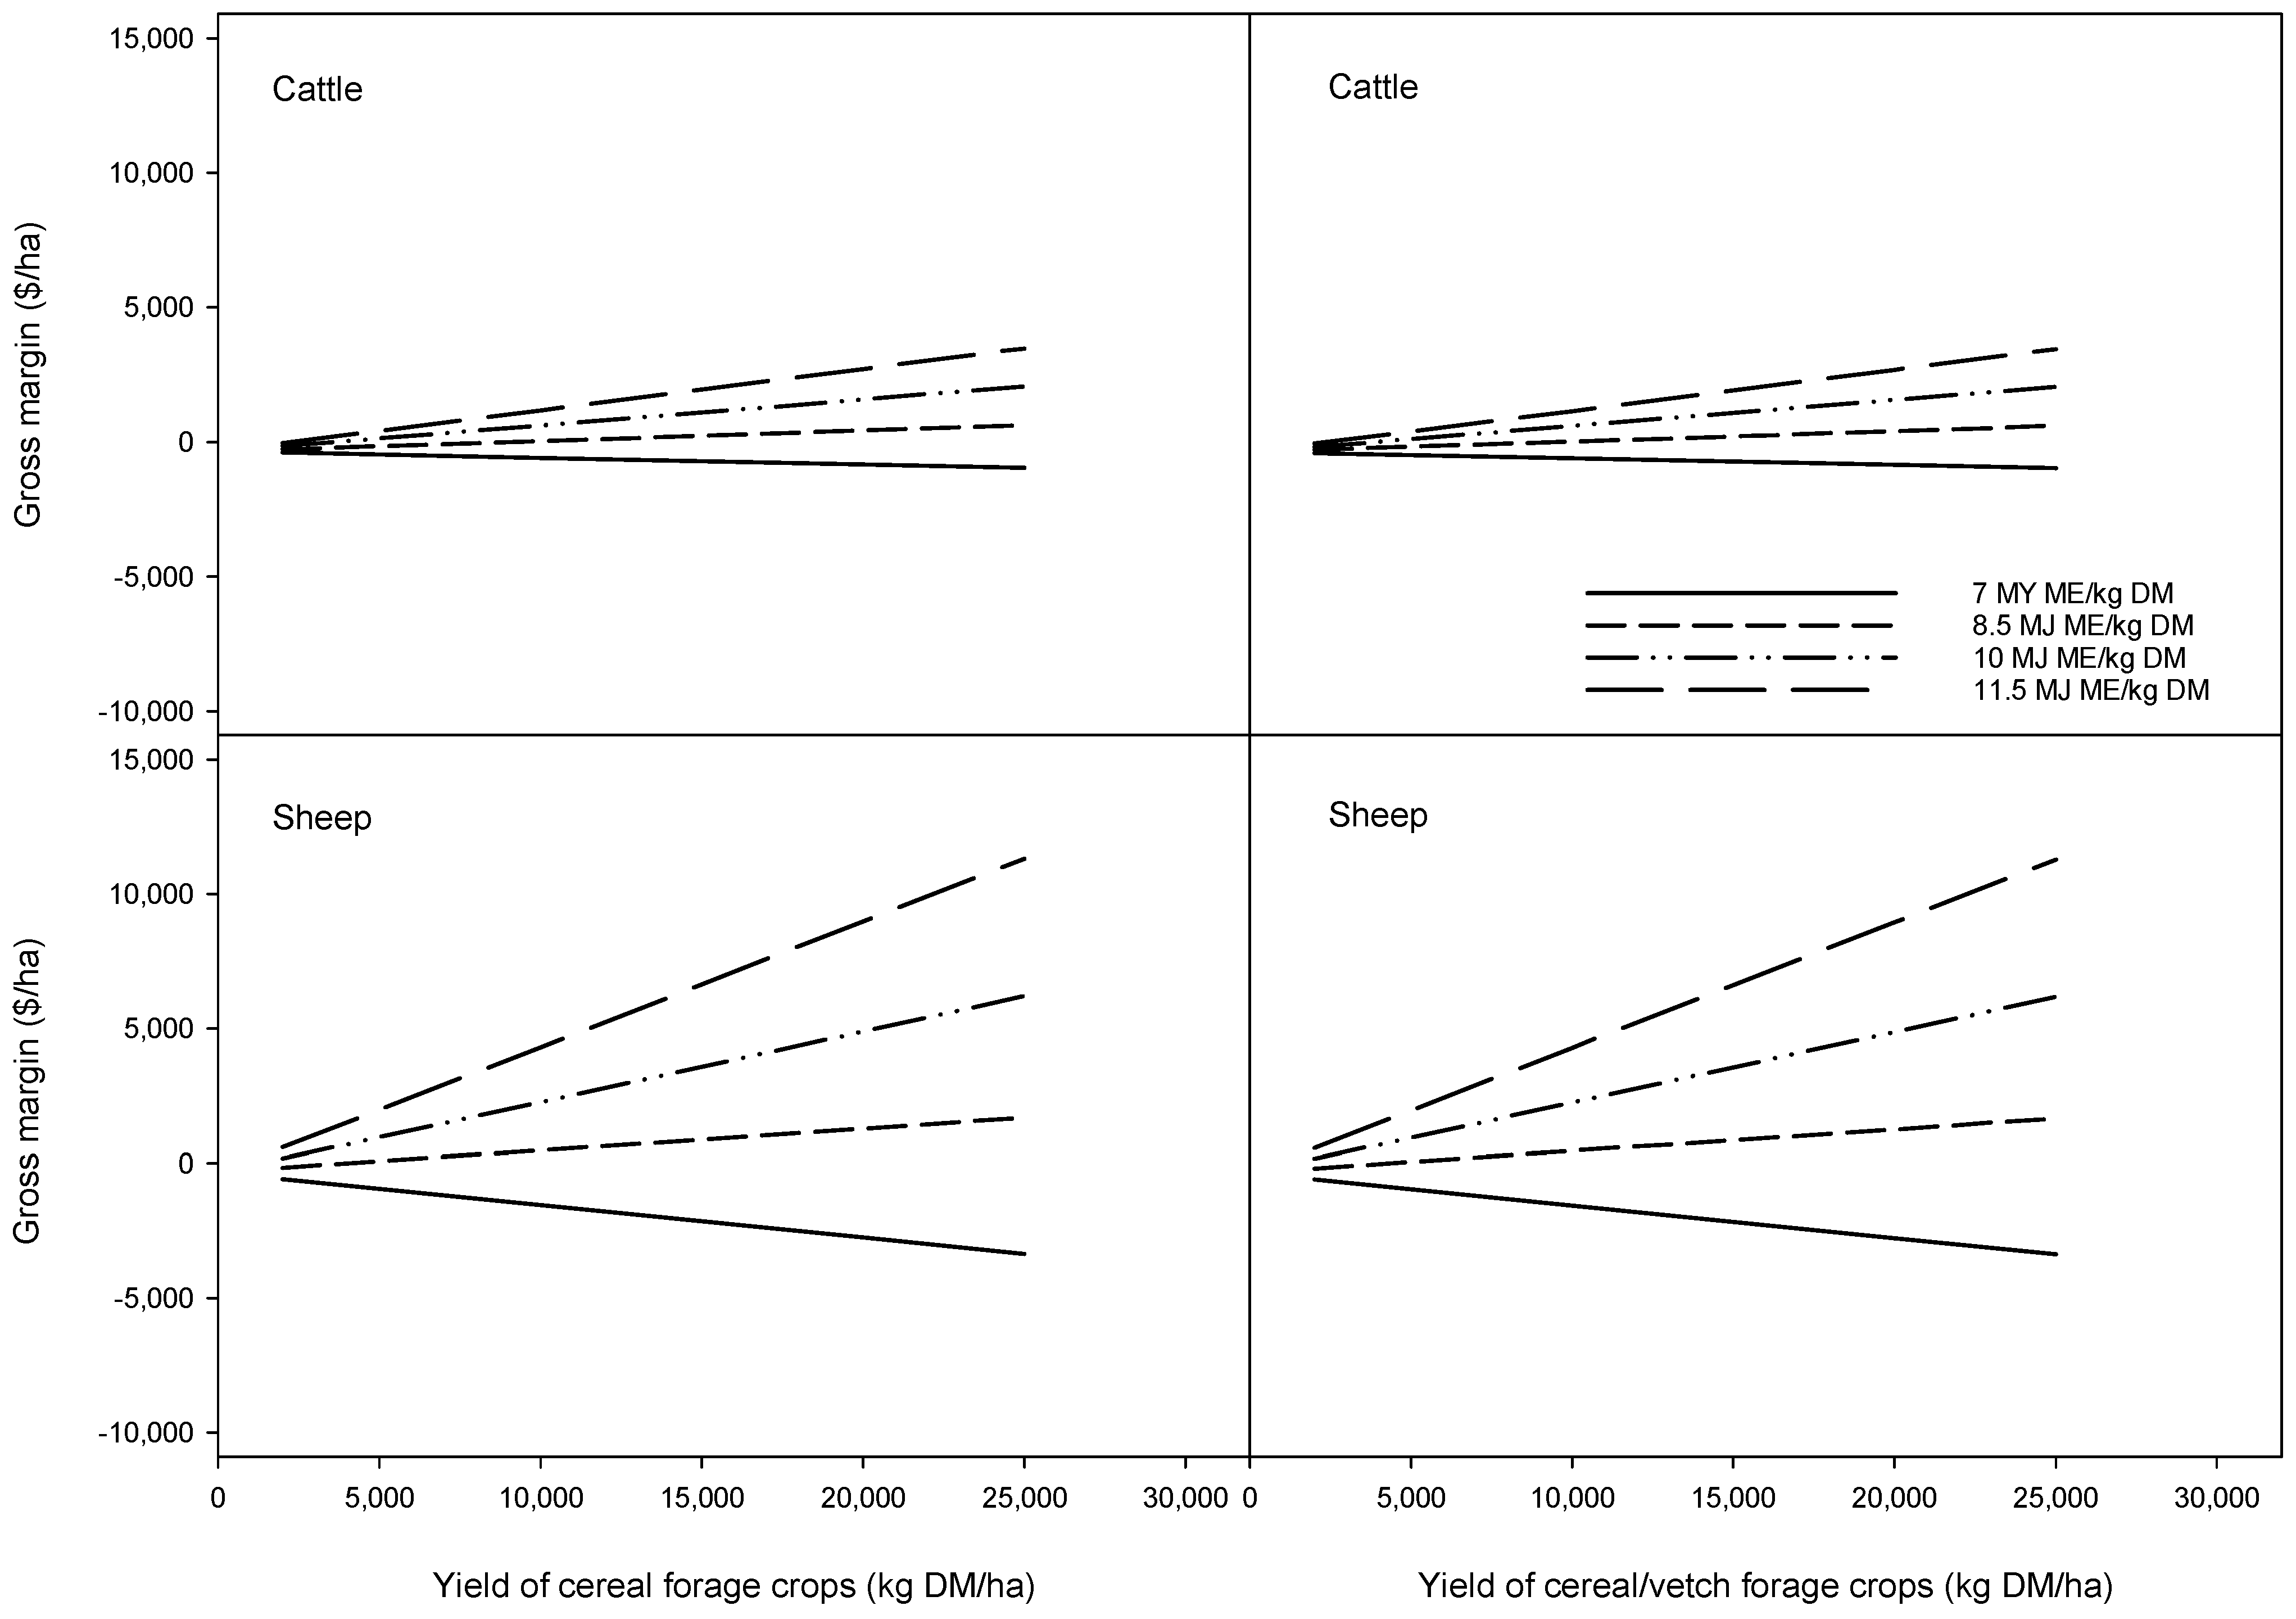
The relationship between GM and yield for a range in crop ME contents is shown in
Figure 2. Where low ME content is predicted to result in liveweight loss, then both LRest and GM are necessarily negative. Under that scenario, increasing yield results in increasingly higher GM losses. Similarly, when variable costs of conserving and feeding exceed the value of liveweight gain per tonne of forage conserved and fed, then increasing yield also results in higher GM losses, even without accounting for fixed costs. Alternatively, when the value of the liveweight gain exceeds the variable costs, then higher yields result in a positive GM after fixed costs are accounted for. While crops with low ME and CP and are not capable of supporting liveweight gain or positive GMs can still be, and often are, conserved. However, incorporating these conserved forages into a feeding system would need to account for either the cost incurred by providing additional high quality feed supplements or any liveweight loss on productivity.


 ,
, 

