Article

Phenotypic Characterisation for Growth and Nut Characteristics Revealed the Extent of Genetic Diversity in Wild Macadamia Germplasm

1
Queensland Alliance for Agriculture and Food Innovation, The University of Queensland, Brisbane, QLD 4072, Australia
2
Institute of Forest Tree Improvement and Biotechnology, Vietnamese Academy of Forest Sciences, Hanoi 100000, Vietnam
*
Author to whom correspondence should be addressed.
Submission received: 31 May 2021 / Revised: 16 July 2021 / Accepted: 16 July 2021 / Published: 19 July 2021
(This article belongs to the Special Issue Development and Cultivar Improvement of Nut Crops)

Abstract

:
Macadamia is a recently domesticated Australian native nut crop, and a large proportion of its wild germplasm is unexploited. Aiming to explore the existing diversity, 247 wild accessions from four species and inter-specific hybrids were phenotyped. A wide range of variation was found in growth and nut traits. Broad-sense heritability of traits were moderate (0.43–0.64), which suggested that both genetic and environmental factors are equally important for the variability of the traits. Correlations among the growth traits were significantly positive (0.49–0.76). There were significant positive correlations among the nut traits except for kernel recovery. The association between kernel recovery and shell thickness was highly significant and negative. Principal component analysis of the traits separated representative species groups. Accessions from Macadamia integrifolia Maiden and Betche, M. tetraphylla L.A.S. Johnson, and admixtures were clustered into one group and those of M. ternifolia F. Muell were separated into another group. In both M. integrifolia and M. tetraphylla groups, variation within site was greater than across sites, which suggested that the conservation strategies should concentrate on increased sampling within sites to capture wide genetic diversity. This study provides a background on the utilisation of wild germplasm as a genetic resource to be used in breeding programs and the direction for gene pool conservation.

1. Introduction

Macadamia is an Australian native evergreen tree that has been domesticated and grown commercially worldwide for its premium kernel [1]. The genus Macadamia F. Muell comprises of four species: M. integrifolia Maiden and Betche, M. jansenii C.L. Gross and P.H. Weston, M. ternifolia F. Muell, and M. tetraphylla L.A.S. Johnson. Morphologically, M. integrifolia and M. tetraphylla are medium to large trees up to 18 m tall, while M. ternifolia and M. jansenii are smaller trees with height up to 8–9 m [2]. Macadamia integrifolia, M. jansenii and M. ternifolia mostly have three leaves per whorl whereas M. tetraphylla bears four leaves in a whorl. Macadamia jansenii has entire (non-serrated) leaf margins and creamy brown flowers while M. ternifolia has serrated leaf margin and pink flowers [3]. Macadamia integrifolia, M. tetraphylla, and their hybrids produce edible nuts and have distinct variation in nut characteristics: M. integrifolia produces a smooth-shelled nut and M. tetraphylla produces a distinctively wrinkled or rough-shelled nut [2,4]. The other two species, M. jansenii and M. ternifolia, produce small, bitter inedible nuts [3,5], and thus have not been used in previously documented breeding programs.
Wild populations of Macadamia are distributed along the east coast of Australia between 25–29° S latitude [1] from southern Queensland (QLD) to northern New South Wales (NSW). Macadamia integrifolia has the largest latitudinal range extending north from the border of QLD and NSW where its distribution overlaps with M. tetraphylla, the southernmost species, in which most populations are located in NSW. The range of M. ternifolia extends north from the Samford Valley (north of Brisbane) and overlaps with M. integrifolia. Macadamia jansenii is the northernmost species and is known to exist in only one location in Bulburin, which is about 150 km from the closest populations of M. integrifolia [1]. The wild genetic resources constitute the primary gene pool [6]. A major portion of these genetic resources is unexploited since most of the Hawaiian varieties, the main contributors to global cultivation, were derived from a single wild site and possibly from a single plant [7]. Therefore, there is an opportunity to increase genetic gain through the exploitation of the existing genetic diversity of these valuable resources.
Understanding genetic diversity of the available gene pool is important in plant breeding. Genetic diversity in crops can be determined by evaluating morphological characteristics, biochemical analysis, or by the application of molecular markers [8,9,10,11,12,13]. In macadamia, previous studies were undertaken to identify the genetic diversity and were based on molecular markers such as dominant RAMiFi markers [6], chloroplast genome sequence [7], and DArTseq-based markers [14,15,16]. Molecular technologies are an efficient tool for exploring genetic diversity, but measurement of phenotypic variability is required to identify accessions and populations with economically useful traits. A simple phenotypic characterisation can be used to explore the extent of variability in target traits. Phenotypic variation in cultivated gene pool was reported on nut and kernel traits [17,18], or leaf and fruit characteristics [19]. However, the wild germplasm was characterised only for leaf characteristics of young trees [6]. To date, no investigation in wild accessions was undertaken on the phenotypic diversity of economically important traits. The lack of information regarding morphological diversity in the wild germplasm, particularly in terms of priority traits in macadamia breeding such as tree size or nut characteristics, impedes its utilisation in breeding.
The genetic variation in a population is caused by multiple factors such as gene-flow, genetic drift, mutation, reproductive biology, phylogenetic relatedness, and natural selection [20,21,22]. However, contemporary processes like environmental changes due to demographic factors may also play roles in genetic variation [23]. Several studies have found relationships between morphological variation and geographic locations [24,25]. Townsend [26] indicated that the fruit characteristics (e.g., Samara length and width, fruit weight) of red maple (Acer rubrum L.) varied significantly among geographic locations and among accessions within a location. The phenotypic diversity is frequently the result of environmental factors, in some cases geographical locations, i.e., altitude, longitude, and latitude. A study on seed variations of 42 species of Rhododendron L. showed that seed mass decreased significantly with the increasing altitude while seed length, width, surface area, and wing length were significantly negatively correlated with altitude [27]. Documenting the variation in phenotypes along the distribution of macadamia species will allow us to understand more about the ecology and evolutionary history of species and provides the necessary information to improve sampling of wild germplasm.
This study aimed to: (1) evaluate the structure of variation in growth and nut traits among the accessions of four wild species, (2) determine the genetic correlations among the examined traits, and (3) investigate the influence of geographical distribution on trait variability in two selected species, M. integrifolia and M. tetraphylla, that occur over a wider distribution. The results from this study will provide information on the potential of wild germplasm for future breeding programs as the genetic resources and the direction for species conservation.

2. Materials and Methods

2.1. Experimental Site and Materials

This study used the ex situ conservation planting located in Tiaro, a small town in the Fraser Coast Region, QLD (latitude 25.73° S; longitude 152.58° E). Tiaro is a highly variable, summer dominant rainfall area. Mean annual rainfall of 1051.8 mm, and mean minimum–maximum temperatures of 26.9–34.2 °C in January and 19.6–24.3 °C in July (Climate data online, www.bom.gov.au, accessed on 10 August 2020). Details of the experimental design for this trial were described by Hardner [28]. Briefly, the experimental accessions, which were collected from wild and planted macadamia populations, were grown from cuttings, and planted in 2001 at a spacing of 6.0 × 3.5 m following a randomized near-complete block design with two blocks. Each block contained eight sub-blocks of 28 accessions each. The number of accessions sampled per site ranged from one to eight (mean = 4.8). Non-experimental replicates of the accessions in the germplasm collection and grafted cultivars were planted around the trial and considered as guard trees. Cuttings of three M. jansenii accessions were later planted in 2011 to replace some dead trees in the experimental design. Trees were irrigated and managed using commercial recommendations [28].
A total of 247 accessions of four species and hybrid were used (Supplementary Table S1). The species status of each accession was confirmed by DNA analysis [6,14]: 119 M. integrifolia, 107 M. tetraphylla, 3 M. jansenii, 5 M. ternifolia, and 13 admixture accessions (inter-specific hybrids). The accessions were named with numerical characters based on their original collected site and accession number, in which the first digit means germplasm, the 2nd to 4th digits refers to site number, and the 5th to 7th digits refers to accessions code. Those accessions were collected from about 70 original sites across 50 regions from 14 localities.

2.2. Data Collection

Growth traits, tree height (HGT), trunk circumference (TC), canopy length (CL), and canopy width (CW) were measured in 2017 and 2018 on mature trees of 244 accessions. Trees of three M. jansenii accessions planted 10 years later were excluded. HGT was measured with a Telefix measuring pole (Metrica S.p.A, Milano, Italy). TC was measured at 20 cm above the ground with a soft tape, whilst CL (along the row) and CW (across the row) were measured with a metal tape.
Nut characteristics were measured on the fruited trees only. Mature nuts were picked by hand from each tree in May 2017 and March 2018. Nuts were de-husked (the green outer husk was mechanically removed), and then nuts-in-shell were dried to 1.5% moisture content using a drying oven at 35 °C for 2 days, 45 °C for 2 days, and 55 °C for 2 days as per Prichavudhi and Yamamoto [29]. Apparent disease- and insect-damaged nuts were excluded from the samples. Mean nut weight (NWt), length (NL), and width (NW) were calculated from measurement of 10 individual nuts per tree that were randomly chosen from harvested nuts. Nuts were then cut in half using a drop saw to measure the shell thickness at the hilum (STH) and the equator (STE) using a digital caliper. The average mass of kernels (KWt) and shells (SWt) were determined from a 20-nut sample that was machine cracked. Kernel recovery (KR) was expressed as a percentage and calculated as the ratio of weight of the kernel to whole NIS obtained from a 20-nut sample.

2.3. Data Analysis

To determine the predicted mean value for each trait for each species, the following model (Model 1) was run using ASReml-R v4.0 [30].
Y = µ + Rep + Block + Year + Species + Species (Accession) + error (Model 1)
where µ is the general mean. The replication (Rep) and block (Block) of experimental design, the assessment year (Year), and Species are set as the fixed effects. The accession nested within each species is the random effect.
The variances and the prediction of the genetic effects of each accession within species were also calculated using Model 1. The differences between each pair of mean of species was tested, for effects that were identified as significant by a Wald test, using the two-sample z test. The genetic variance (VG) and residual variance (VE) were then used to calculate the individual broad-sense heritability (H) of each trait using the equation:
H = V G V G + V E
In order to determine the phenotypic relationships among traits, two statistical approaches, correlation and principal component analysis (PCA), were applied to the table of predicted values of each accession for each trait obtained from Model 1. The Pearson’s correlation coefficients were calculated with the package Hmisc in R v4.0 [31], whilst PCA was undertaken with the package ggbiplot in R v4.0 [32]. The level of significance for the correlation co-efficient for each pair of traits was determined by t-test as follow:
t = r n 2 1 r 2
in which: r is Pearson’s correlation, n is the number of observation.
To identify the effect of geographic origin (Site) on trait variation, we used only data from the two species, M. integrifolia and M. tetraphylla, that occur over a wide geographic range and have large numbers of accessions. The variance components were estimated separately for each species by using a mixed-model equation (Model 2) in ASReml-R v4.0:
Y = µ + Rep + Year + Rep:Year + Site + Site (Accession) + Site:Year + Rep (Block) + Rep (Block):Year + error (Model 2)
in which µ is the general mean; Rep, Year, and the interaction between those factors are treated as fixed effects. The original collection site (Site), Accession within Site, the interaction between Site and Year (Site:Year) are random effects. Block within Rep and interaction between Block within Rep and Year were also treated as random effects. To test the association between phenotypic variation and latitude of sample origin for both M. integrifolia and M. tetraphylla, scatterplots were constructed and the correlation between traits and latitude were estimated using the package ggpubr in R v4.0 [33].

3. Results

3.1. Variation in Growth and Nut Traits

Accessions in this study showed a wide range of variations in growth characteristics, from 287.1 cm (M. ternifolia) to 629.3 cm (M. integrifolia) for plant height, 23.1 cm (M. ternifolia) to 78.4 cm (Admixture) for trunk circumference, 189.7 cm (M. ternifolia) to 622.6 cm (Admixture) for canopy length, 173.3 cm (M. ternifolia) to 522.5 cm (M. integrifolia) for canopy width (Table 1). For growth parameters, there was no significant difference between admixture and M. integrifolia accessions, except for CL (Table 1) while M. tetraphylla and M. ternifolia differed significantly from those two groups. The predicted mean values of HGT, TC, CL, and CW of the studied accessions were highest in the admixtures, followed by wild M. integrifolia and M. tetraphylla (Table 1). Macadamia ternifolia accessions were at least 25% smaller than that of other species (Table 1). The smallest accessions with the predicted height ~3 m were 1088001 (M. ternifolia), 1021004 (M. ternifolia), and 1076005 (M. integrifolia).
Variation in nut traits were measured on 188 accessions, which produced nut during the study period. Nut weight ranged from 1.17 g (M. ternifolia) to 9.96 g (Admixture). Accessions of M. ternifolia also showed shortest nut length and width, thinnest shell, and smallest kernel, but highest kernel recovery (37.76%). Among species, M. integrifolia, M. tetraphylla and admixture accessions showed no significant difference for most of the nut characteristics (Table 1). Similarly, the variations between M. jansenii and M. ternifolia accessions were insignificant for most of the nut traits, except for NL. Macadamia jansenii and M. ternifolia accessions produced significantly small nuts as measured by NWt, NL and NW; SWt, STH and STE; and KWt. On average, NWt of M. integrifolia, M. tetraphylla and admixture accessions was fivefold greater than that of M. jansenii and M. ternifolia accessions. However, KR of M. ternifolia and M. jansenii were ~20% greater than that of M. integrifolia and M. tetraphylla. Within species with edible nuts, accessions with highest KR were 1042004 (M. tetraphylla, 33.1%) and 1060004 (M. integrifolia, 32.4%). Among the species, M. ternifolia produced the thinnest shells while M. tetraphylla had the thickest (Table 1).
For most of the traits, genetic variances were higher than residual variances (Table 2). Estimated individual broad-sense heritabilities (H) were moderate to high. In this study, heritabilities < 0.4% were considered as low, 0.4–0.6 moderate, and >0.6 high. Heritabilities for growth traits were moderate and ranged from 0.51 for CW to 0.60 for HGT (Table 2). Heritability estimates of nut traits were moderate to high, ranging from 0.43 for NW to 0.64 for STE (Table 2).

3.2. Correlation among Growth and Nut Traits

There were significant positive correlations among the growth traits (Table 3). Amongst the growth trait pairs, the correlation between HGT and TC was greatest (0.76), while the least correlation was observed between HGT and CL (0.49). Correlations among the nut traits were also significant, except for correlations between NL and CW, and CL and KR (Table 3). Among the nut trait pairs, the correlation between NWt and SWt was the greatest (0.95). Similarly, the rest of the nut size parameters were positively correlated with NWt, except for KR. Negative correlations were detected between KR and all traits, except for KWt (0.32). Among the nut traits, shell thickness (−0.57 with STH, −0.70 with STE) had the greatest correlation with KR (Table 3).

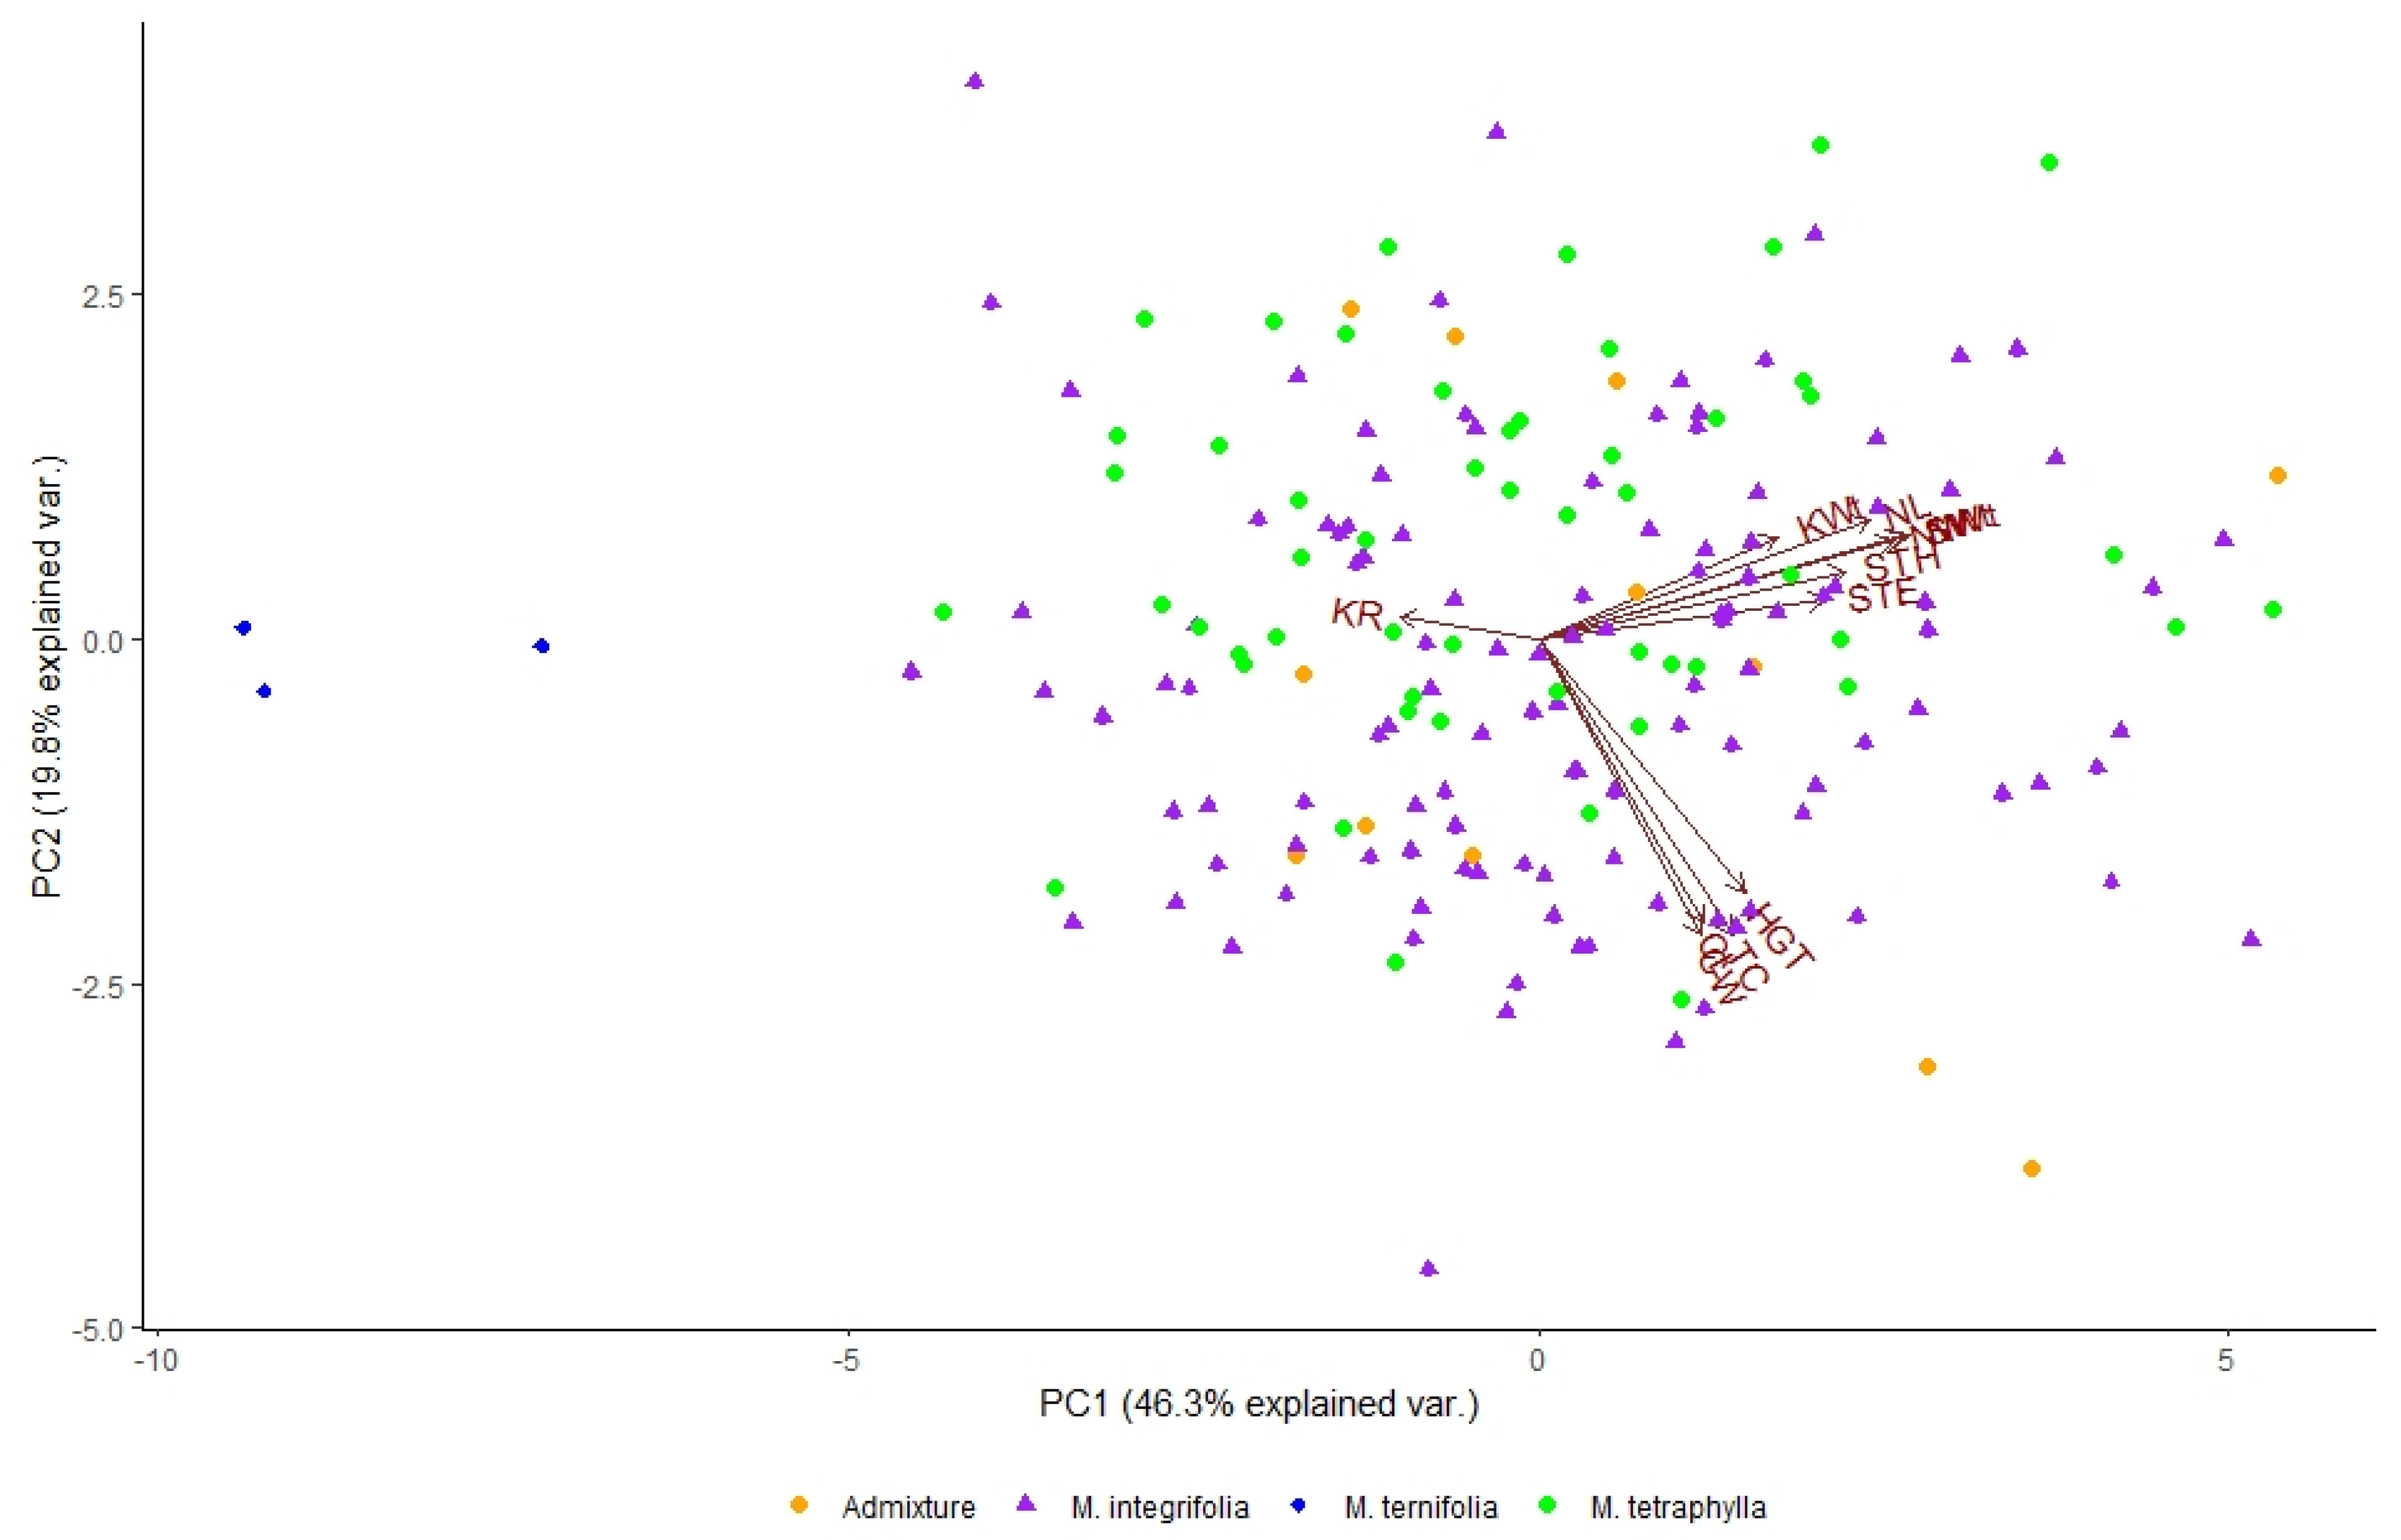
3.3. Principal Component Analysis

Principal component analysis (PCA) of growth and nut traits of four groups of populations generated 12 components, and the first two components explained more than two-thirds of the total variation (Figure 1). PC1 contributed 46.3% of the total variation, which was mainly represented by the variation in nut traits. PC2 accounted for 19.8% of the variation, and represents mostly the variation in growth traits. Phenotypic variation explained by PC3 (15.8%) was mostly due to KR, KWt, and STE (Supplementary Table S2).
The biplot (Figure 1) illustrated the correlations among traits of this study. The vectors for all growth traits (HGT, TC, CL, and CW) were all closely aligned and showed positive loading for PC1 and negative loading for PC2. Similarly, most of the nut traits except KR aligned closely and showed positive loading for both PC1 and PC2. KR did not align with any other traits. Loading values for KR was negative for PC1 and positive for PC3 (Supplementary Table S2). PC3 loading values of KR (0.640) and STE (−0.398) indicated that there is a negative correlation between these two traits. The biplot also visualised the position of the accessions of different species. Accessions of M. integrifolia, M. tetraphylla and the interspecific hybrid were overlapped and scattered randomly in the plot, while the three accessions of M. ternifolia were separated from the main M. integrifolia/M. tetraphylla cluster (Figure 1).

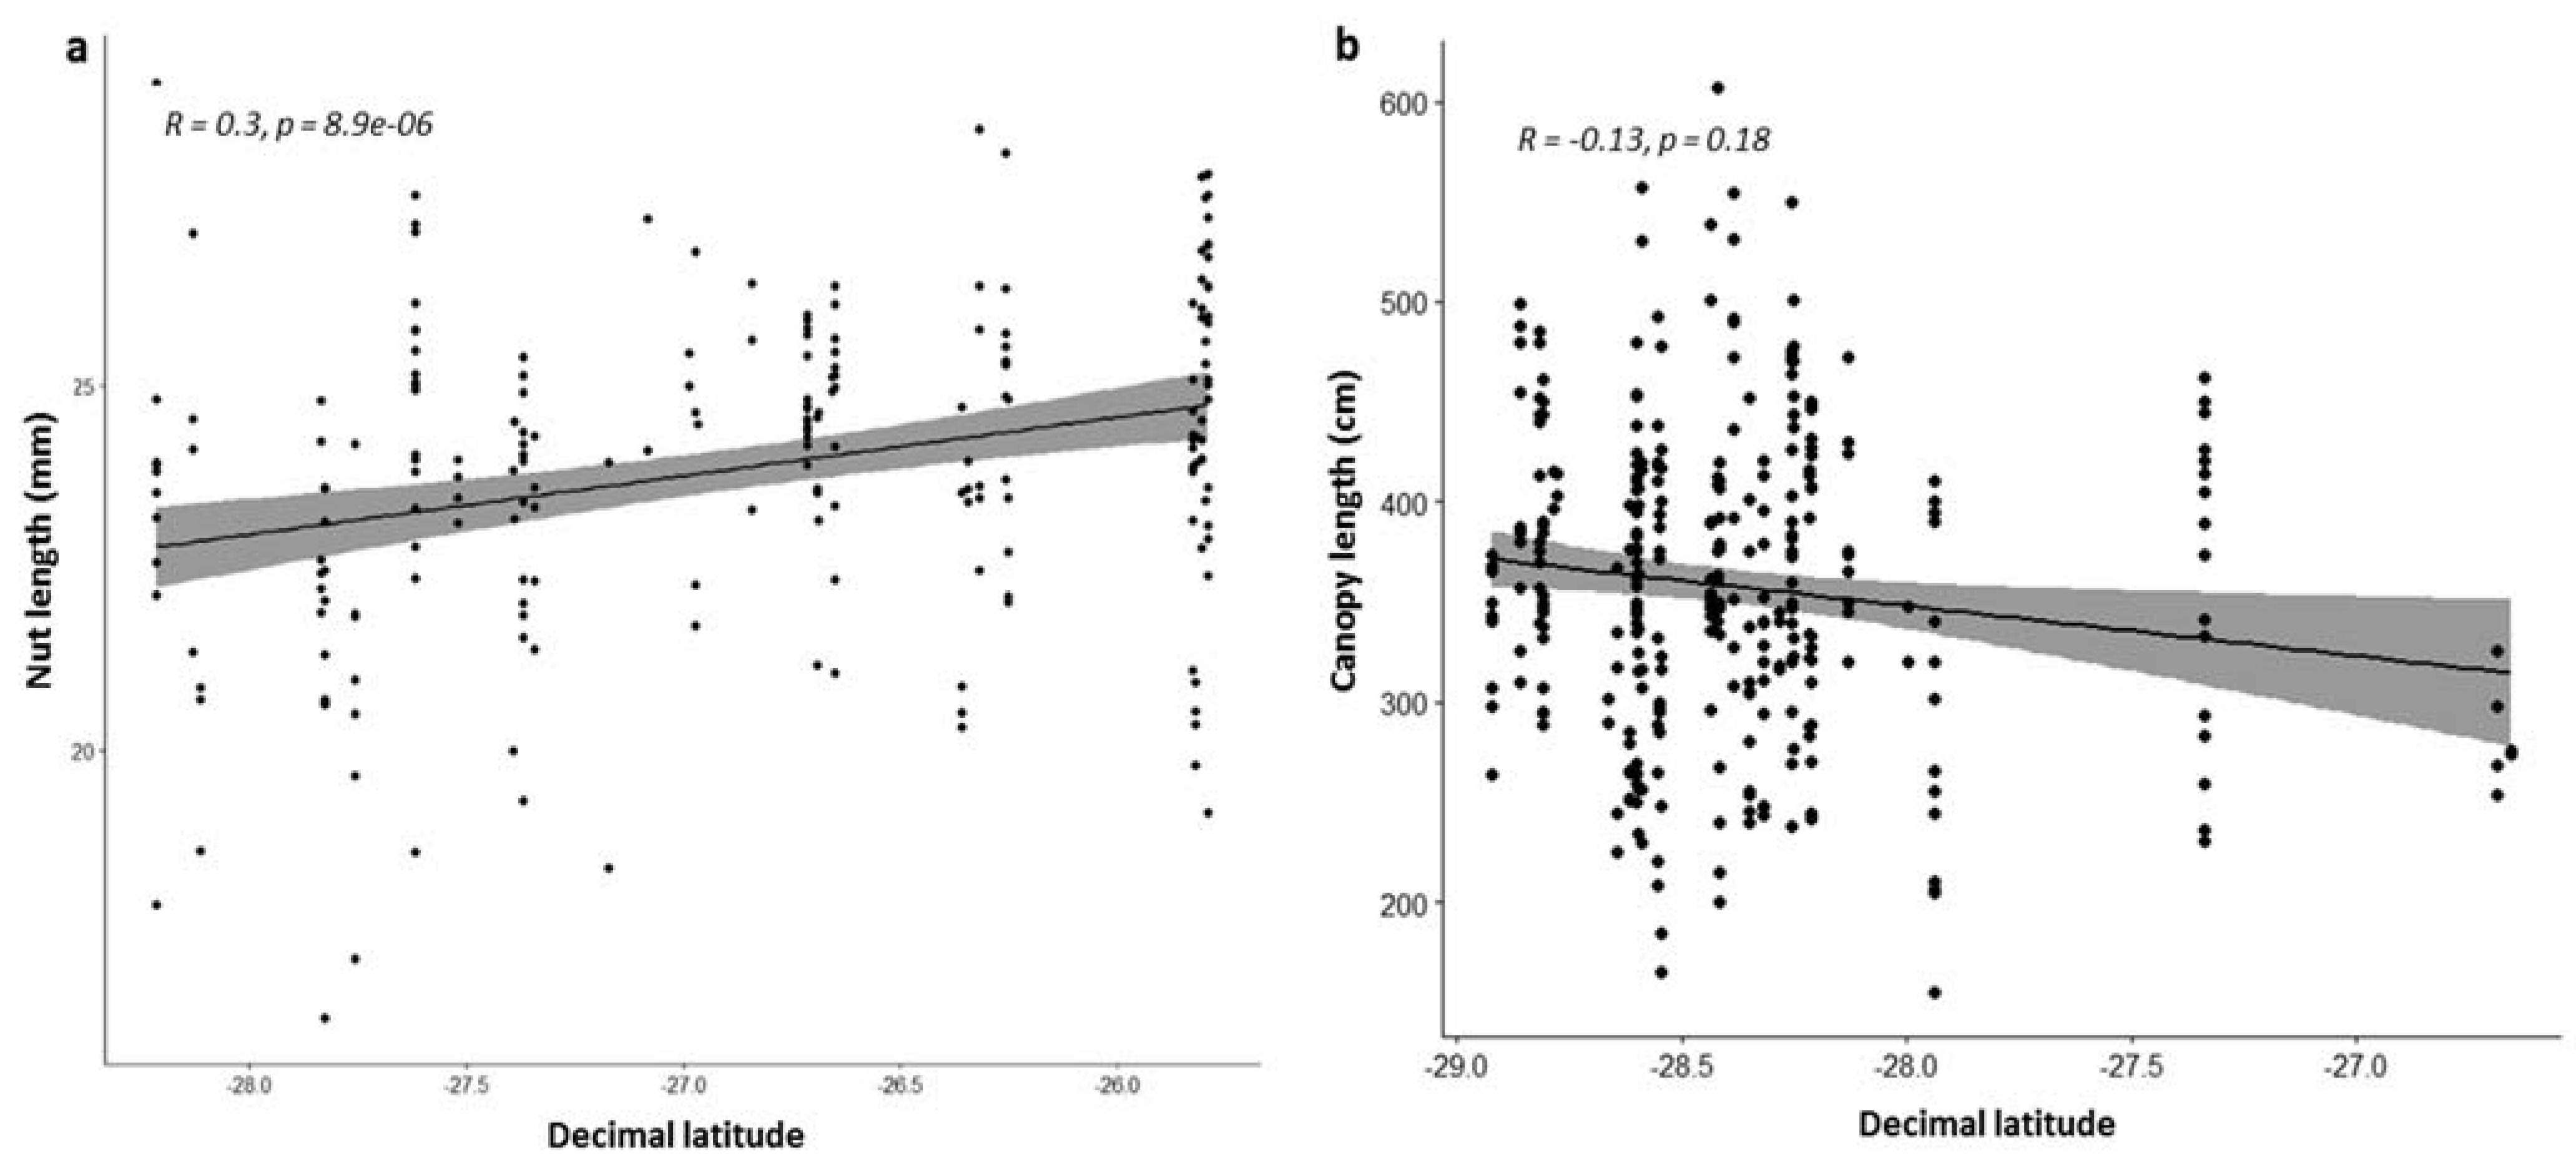
3.4. Effect of Geographic Distribution on Morphological Traits

Analysis of variance for site, accession within site, and interaction between site and year (Site:Year), showed that accession within site effect accounted for most of the variation of the traits in both species, except for KR in M. tetraphylla (Table 4). Though site accounted for a small percentage of total variation in M. integrifolia, this source contributed over 20% of the variability in NWt, SWt, and KWt. The interaction between site and year did not contribute to the variation in any growth traits in both species, but contributed to the variation of some nut traits in M. integrifolia (0.5–12.6%) and KWt and KR in M. tetraphylla (5.9 and 28.0%, respectively).
The correlation of predicted values of the traits with latitude shows the effect of latitude on the variation of the traits. For M. integrifolia, which ranges from 28.21° S (Numinbah, QLD, Australia) to 25.79° S (Mount Bauple, QLD, Australia), the correlations were positive and significant at p < 0.05, except for kernel recovery, which was not significantly correlated (R = −0.12, p = 0.09) (Supplementary Figure S1). The highest correlation with latitude was 0.3 for nut length (Figure 2a). Nevertheless, there was considerable variation in predicted value for a small range in latitude. For M. tetraphylla, which ranged in latitude from 28.92° S (South Ballina, NSW) to 27.99° S (Clagiraba, QLD, Australia), only canopy length was significantly correlated with latitude (R = −0.13, p = 0.018, Figure 2b). The other traits were not significantly correlated with latitude (Supplementary Figure S2).

4. Discussion

Knowledge of genetic influence on patterns in phenotypic variation in the wild provide a primary platform for the utilisation of wild germplasm in breeding. Until now, no information was available on the variability in morphological diversity in mature trees of macadamia wild germplasm. Ex situ germplasm collection of wild macadamias, which was planted in a single location, created an opportunity to explore the existing variability in the economically important traits. The current study is the first report on the phenotypic variations on growth and nut traits of mature trees among the existing resources of wild germplasm, and presents the effect of geographic distribution on trait variation.

4.1. Variation in Growth and Nut Traits

This study examined the phenotypic variations in growth and nut traits of a random sample of mature macadamia trees (~18 years old). Among the species, accessions from M. ternifolia were ~25% smaller than those of M. integrifolia, M. tetraphylla, and hybrids, which is accorded with previous descriptions of the four species [2]. Although the species means provide information on the relative order of the species for a trait, the variation within each species (max and min values) is also important to find out the individuals carrying economically important traits. One of the priorities in breeding is to reduce tree size to support efficient management and improve productivity per unit area. In the commercial orchards, macadamia trees are currently planted at low-density between 100 and 450 trees per hectare [34] due to their large tree size at maturity, which is not suitable for high density planting [35]. The existing variabilities in vigour traits can be used to plan future breeding program for the development of yield efficient low vigour cultivars. In this study, sources of small plant size (~3 m) were identified in M. ternifolia (accessions 1088001 and 1021004) and M. integrifolia (accession 1076005). These accessions may be used as parents in breeding for reduced tree size.
Yield is the key trait of profitability. But the heritability of this trait is low (H < 0.22) [36] in comparison with other component traits. In addition, there is no robust protocol that can accurately assess the yield performance of macadamia breeding population. Therefore, improvements in yield component traits can help in indirect selection of high yielding cultivars. For example, yield of total nut-in-shell per tree can be considered as the product of the average nut weight by the number of nuts per tree [37]. However, in young macadamia cultivars, the broad-sense heritability of the number of nuts per tree is very low (H = 0.07) [37]. Hince, Toft et al. [37] suggested to consider nut size (instead of nut number) as the direct target for yield improvement. In our study, nut weight varied among species. Macadamia integrifolia, M. tetraphylla, and their hybrids produced five times larger nuts than M. ternifolia and M. jansenii. The average nut mass of M. integrifolia (6.7 g) and M. tetraphylla (6.3 g) was similar with the data reported by Hardner et al. [17] and for macadamia varieties selections. However, the mean kernel weights of M. integrifolia (1.55 g) and M. tetraphylla (1.62 g) were less than that of common commercial varieties [17,38]. Since the desirable kernel size for processing and marketing is 2–3 g [39], some accessions with large kernels (>2 g) can be used as resources for future breeding.
The shell of nuts from most of the wild accessions of M. integrifolia and M. tetraphylla in this study were thicker than those of commercial varieties reported by Leverington [18], which indicates directional selection for thinner shells during domestication.
The standard kernel recovery for commercial cultivars is 33–34% [34]. In this study, M. ternifolia and M. jansenii produced nuts with the highest kernel recovery (34.7% and 30.9%, respectively), but they are inedible and too small. The utilisation of these two species to improve nut traits through breeding may be difficult. It may be easier to use M. integrifolia or M. tetraphylla accessions as parents for improving nut traits. We found the highest kernel recovery for M. integrifolia (32.4%, accession 1060004) and M. tetraphylla (33.1%, accession 1042004) which indicates that progress that has been achieved through generations of selection for this highly heritable trait.
Based on Model 1, the variance component analysis revealed that genetic factors played a key role in the variation of traits of this study. The broad-sense heritability for tree height (0.60), trunk circumference (0.54), and canopy width (0.51) were higher than reported in previous studies of cultivars and breeding progeny [36,37,40]. This may partly be due to the inflation of genetic variance due to the evaluation of accessions from multiple species which differ in average performance. Nevertheless, we examined the distribution of predicted values and did not find evidence for Simpson’s paradox, a statistical phenomenon in which a trend appears in several different groups of data but disappears in combined data [41]. The heritability estimates of nut weight (0.69), kernel weight (0.67), and kernel recovery (0.67) were similar to the results found by Hardner et al. [17]. The heritability for nut and kernel traits presented here is higher than those in pecan nuts [42] or young macadamia cultivars [37]. In general, heritability values of 0.3 or higher are sufficient to produce significant breeding improvement [42]. Since the examined traits seem to be under genetic control, there is an opportunity to improve these traits by using wild genetic resources.

4.2. Correlations among Phenotypic Traits

In this study, we found a significant correlation among most of the trait pairs (Table 3). Positive correlations between two desirable traits assist selection progress, while a negative correlation may hinder the breeding process for a specific trait [43]. A strong positive correlation (0.74) was found between nut weight and kernel weight, which is similar to the correlation reported from macadamia cultivar trials (rg = 0.79, rp = 0.68) [17] or other nut crops such as the wild almond Prunus scoparia [44], almond P. dulcis [45], and pecan [42]. These results suggested that the genetic improvement for nut size could contribute to the profitability of the growers and processors by increasing kernel yield. In another study on mature age breeding progeny, O’Connor [40] identified a strong genetic correlation between individual nut weight and nut-in-shell yield (r = 0.40) and indicated that larger nuts can be a major genetic determinant of increased yield. Nut weight also correlated positively with shell weight (0.95) and correlated negatively with kernel recovery (−0.28). Kernel recovery decreased significantly with the increase of shell thickness (r = −0.77 at equator and −0.57 at hilum), which was consistent with the previous report [18]. Tuba and Turan [46] also reported the negative correlation between kernel recovery and shell thickness in hazelnut (r = −0.34). Therefore, to increase kernel recovery, breeders can aim to select trees that have a thinner shell. However, thin-shelled nuts were brittle and the kernels were easily damaged during processing or susceptible to insect damage [18]. Therefore, the identification of a threshold for shell-thickness is critical to use this trait in the breeding program.
PCA using phenotypic traits also indicated the close relationship among growth traits and among nut traits. PCA of the genetic predictions of accessions for phenotypic traits also confirmed the genetic similarity among accessions of M. integrifolia and M. tetraphylla which concurs with the previous taxonomic study of Mast et al. [47]. The accessions of M. ternifolia formed a separate cluster from the accessions of other species, which clearly supports the previous study on the genetic structure of wild germplasm [14].

4.3. Relationship between Phenotypic Traits and Geographic Distribution

The phenotypic traits were used to examine the relationship between trait variation and geographic location for M. integrifolia and M. tetraphylla; the two most widespread species. The variance component analysis demonstrated that most of the variation of the traits was among accessions within site (Table 4). Significant differences in the phenotypic traits (growth and wood traits) among trees within a site were also found in pine as reported by Pan et al. [48]. The large phenotypic variation among the accessions within sites suggested that there is an opportunity to improve genetic diversity by collecting more samples within a site. Further investigation on each site can be useful to select a site for more diversity.
Macadamia integrifolia accessions showed a significant correlation between phenotypic variation and latitude, but the correlation was not significant among the accessions of M. tetraphylla, except for canopy length (Figure 2b). Using genetic markers, a previous study identified that there was a significant relationship between latitudinal geographic distance and genetic distance in M. integrifolia populations, while the correlation was positive but not significant for M. tetraphylla populations [14]. The strong latitudinal population structure in M. integrifolia was also reported previously by Nock et al. [7] using chloroplast genome sequencing and Peace [6] using RAF markers. Hardner et al. [17] stated that the geographic distance has a strong influence on nut and kernel traits in macadamia. In addition, Hardner et al. [36] reported that tree size declined from north to south based on a study on 40 cultivars planted in four locations. We also noticed that the mean tree size of M. tetraphylla accessions (the most southern species) was ~10% smaller than the mean of M. integrifolia (Table 1). Tree size in orchards depends on the effect of different management practices. This study provided a unique opportunity to compare the phenotypic variability of wild germplasm from multiple origins when planted in a single environment (Tiaro).

5. Conclusions

This is the first report on the comparative study of the phenotypic diversity of multiple macadamia species. We investigated the variability in growth and nut traits among the accessions of wild genetic resources, which were collected from natural forest and planted together in a single site. As the variability in plant growth parameters depends on the growing environments, this single site investigation of genetic resources from diverse origin provided a unique opportunity to compare the phenotypes of the four species. Additionally, we examined the effect of latitudinal trend of the phenotypic diversity in growth and nut traits. The wide ranges of variability among accessions for tree height, kernel weight, and kernel recovery suggest that there is an opportunity to use wild accessions in breeding to introduce novel genetic diversity. Result from this study indicate that most of the variation in traits is among accessions within sites suggesting that detailed sampling at each site is required when selecting individuals for phenotypic diversity. We identified wild accessions with useful tree size and kernel recovery traits that may be exploited in future breeding. Crossing this wild germplasm with commercial cultivars will be a primary step towards increasing the genetic diversity of the existing breeding germplasm to produce novel cultivars.

Supplementary Materials

The following are available online at https://0-www-mdpi-com.brum.beds.ac.uk/article/10.3390/agriculture11070680/s1. Table S1: List of accessions for phenotyping. Table S2: Principal component (PC) coefficients of all traits. Figure S1: Correlation between predicted values of the traits and latitude in M. integrifolia. Figure S2: Correlation between predicted values of the traits and latitude in M. tetraphylla.

Author Contributions

Conceptualization, B.L.T., C.M.H. and T.T.P.M.; Methodology, T.T.P.M., C.M.H. and M.M.A.; Software, T.T.P.M. and C.M.H.; Validation, T.T.P.M. and C.M.H.; Formal Analysis, T.T.P.M.; Resources, T.T.P.M.; Writing—Original Draft Preparation, T.T.P.M.; Writing—Review and Editing, M.M.A., C.M.H., R.J.H., B.L.T. and T.T.P.M.; Visualization, T.T.P.M. and C.M.H.; Supervision, B.L.T., M.M.A., R.J.H. and C.M.H.; Project Administration, B.L.T. and M.M.A.; Funding Acquisition, B.L.T. All authors have read and agreed to the published version of the manuscript.

Funding

This research was funded by Hort Innovation, using the Macadamia research and development levy and contributions from the Australian Government. Hort Innovation is the grower owned, not-for-profit research and development corporation for Australian horticulture. Vietnam International Education Development (The Key Biotechnology Program—Ministry of Agriculture and Rural Development) and The University of Queensland provided PhD scholarship for T.T.P.M.

Institutional Review Board Statement

Not applicable.

Informed Consent Statement

Not applicable.

Data Availability Statement

The data presented in this study are available on request from the corresponding author.

Acknowledgments

The authors would like to thank staff in Macadamia team and DAF for their field support. The authors also thank to reviewers for valuable comments.

Conflicts of Interest

The authors declare no conflict of interest.

References

  1. Hardner, C.M.; Peace, C.; Lowe, A.J.; Neal, J.; Pisanu, P.; Powell, M.; Schmidt, A.; Spain, C.; Williams, K. Genetic resources and domestication of macadamia. In Horticultural Reviews; Janick, J., Ed.; Wiley-Blackwell: Hoboken, NJ, USA, 2009; Volume 35, pp. 1–125. [Google Scholar]
  2. Gross, C.L. Elaeagnaceae, Proteaceae 1. In Flora of Australia; Australian Biological Resources Study: Canberra, Australia, 1995; Volume 16, pp. 419–425. [Google Scholar]
  3. Gross, C.L.; Weston, P.H. Macadamia jansenii (Proteaceae), a new species from central Queensland. Aust. Syst. Bot. 1992, 5, 725–728. [Google Scholar] [CrossRef]
  4. Topp, B.L.; Nock, C.J.; Hardner, C.M.; Alam, M.; O’Connor, K.M. Macadamia (Macadamia spp.) Breeding. In Advances in Plant Breeding Strategies: Nut and Beverage Crops; Al-Khayri, J., Jain, S.D.J., Eds.; Springer: Cham, Switzerland, 2019; pp. 221–251. [Google Scholar]
  5. Dahler, J.; McConchie, C.; Turnbull, C. Quantification of Cyanogenic Glycosides in Seedlings of Three Macadamia (Proteaceae) Species. Aust. J. Bot. 1995, 43, 619–628. [Google Scholar] [CrossRef]
  6. Peace, C.P. Genetic Characterisation of Macadamia with DNA Markers. Ph.D. Thesis, University of Queensland, Brisbane, Australia, 2004. [Google Scholar]
  7. Nock, C.J.; Hardner, C.M.; Montenegro, J.D.; Termizi, A.A.A.; Hayashi, S.; Playford, J.; Edwards, D.; Batley, J. Wild Origins of Macadamia Domestication Identified through Intraspecific Chloroplast Genome Sequencing. Front. Plant Sci. 2019, 10, 1–15. [Google Scholar] [CrossRef]
  8. Vahdati, K.; Karimi, R.; Ershadi, A. Genetic Structure of Some Wild Walnut Populations in Iran. Acta Hortic. 2015, 125–128. [Google Scholar] [CrossRef]
  9. Karimi, R.; Ershadi, A.; Vahdati, K.; Woeste, K. Molecular Characterization of Persian Walnut Populations in Iran with Microsatellite Markers. HortScience 2010, 45, 1403–1406. [Google Scholar] [CrossRef] [Green Version]
  10. Vahdati, K.; Pourtaklu, S.M.; Karimi, R.; Barzehkar, R.; Amiri, R.; Mozaffari, M.; Woeste, K. Genetic diversity and gene flow of some Persian walnut populations in southeast of Iran revealed by SSR markers. Plant Syst. Evol. 2015, 301, 691–699. [Google Scholar] [CrossRef]
  11. Nematollahi, A.; Golein, B.; Vahdati, K. Analysis of the Genetic Diversity in Citrus (Citrus spp.) Species Using SSR Markers. J. Plant Physiol. Breed. 2013, 3, 41–49. [Google Scholar]
  12. Bhandari, H.R.; Bhanu, A.N.; Srivastava, K.; Singh, M.N.; Shreya, A.H. Assessment of Genetic Diversity in Crop Plants—An Overview. Adv. Plants Agric. Res. 2017, 7, 1–8. [Google Scholar] [CrossRef]
  13. Karimi, R.; Ershadi, A.; Ehtesham Nia, A.; Sharifani, M.; Rasouli, M.; Ebrahimi, A.; Vahdati, K. Morphological and Molecular Evaluation of Persian Walnut Populations in Northern and Western Regions of Iran. Int. J. Nuts Relat. Sci. 2015, 5, 21–31. [Google Scholar]
  14. Mai, T.; Alam, M.; Hardner, C.; Henry, R.; Topp, B. Genetic Structure of Wild Germplasm of Macadamia: Species Assignment, Diversity and Phylogeographic Relationships. Plants 2020, 9, 714. [Google Scholar] [CrossRef]
  15. Alam, M.; Neal, J.; O’Connor, K.; Kilian, A.; Topp, B. Ultra-high-throughput DArTseq-based silicoDArT and SNP markers for genomic studies in macadamia. PLoS ONE 2018, 13, e0203465. [Google Scholar] [CrossRef] [Green Version]
  16. O’Connor, K.; Kilian, A.; Hayes, B.; Hardner, C.; Nock, C.; Baten, A.; Alam, M.; Topp, B. Population structure, genetic diversity and linkage disequilibrium in a macadamia breeding population using SNP and silicoDArT markers. Tree Genet. Genomes 2019, 15, 1–16. [Google Scholar] [CrossRef]
  17. Hardner, C.; Winks, C.; Stephenson, R.; Gallagher, E. Genetic parameters for nut and kernel traits in macadamia. Euphytica 2001, 117, 151–161. [Google Scholar] [CrossRef]
  18. Leverington, R.E. Evaluation of macadamia nut varieties for processing. Qld. J. Agric. Sci. 1961, 19, 33–46. [Google Scholar]
  19. Gitonga, L.; Kahangi, E.; Muigai, A.; Ngamau, K.; Gichuki, S.; Cheluget, W.; Wepukhulu, S. Assessment of phenotypic diversity of macadamia (Macadamia spp) germplasm in Kenya using leaf and fruit morphology. Afr. J. Plant Sci. 2008, 2, 86–93. [Google Scholar]
  20. Wright, S. Evolution in mendelian populations. Bull. Math. Biol. 1990, 52, 241–295. [Google Scholar] [CrossRef] [Green Version]
  21. Gram, W.K.; Sork, V.L. Association between Environmental and Genetic Heterogeneity in Forest Tree Populations. Ecology 2001, 82, 2001. [Google Scholar] [CrossRef]
  22. De Woody, J.; Trewin, H.; Taylor, G. Genetic and morphological differentiation in Populus nigra L.: Isolation by colonization or isolation by adaptation? Mol. Ecol. 2015, 24, 2641–2655. [Google Scholar] [CrossRef] [Green Version]
  23. Arteaga, M.C.; Bello-Bedoy, R.; La Luz, J.L.L.-D.; Delgadillo, J.; Dominguez, R. Phenotypic variation of flowering and vegetative morphological traits along the distribution for the endemic species Yucca capensis (Agavaceae). Bot. Sci. 2015, 93, 765. [Google Scholar] [CrossRef]
  24. Król, K.; Gantner, M. Morphological Traits and Chemical Composition of Hazelnut from Different Geographical origins: A Review. Agriculture 2020, 10, 375. [Google Scholar] [CrossRef]
  25. Zhang, L.; Lu, X.; Zhou, Q.; Deng, J. Morphological Variability between Geographical Provenances of Walnut Fruit (Juglans mandshurica) in the Eastern Liaoning Province, PR China. Pol. J. Environ. Stud. 2021. [Google Scholar] [CrossRef]
  26. Townsend, A.M. Geographic Variation in Fruit Characteristics of Acer rubrum. Bull. Torrey Bot. Club 1972, 99, 122. [Google Scholar] [CrossRef]
  27. Wang, Y.; Wang, J.; Lai, L.; Jiang, L.; Zhuang, P.; Zhang, L.; Zheng, Y.; Baskin, J.M.; Baskin, C.C. Geographic variation in seed traits within and among forty-two species of Rhododendron (Ericaceae) on the Tibetan plateau: Relationships with altitude, habitat, plant height, and phylogeny. Ecol. Evol. 2014, 4, 1913–1923. [Google Scholar] [CrossRef] [PubMed]
  28. Hardner, C.M.; Pisanu, P.C.; Boyton, S.J. National Macadamia Germplasm Conservation Program; Australian Macadamia Society: Lismore, Australia, 2004; pp. 8–62. [Google Scholar]
  29. Prichavudhi, K.; Yamamoto, A.H.Y. Effect of drying temperature on chemical composition and quality of macadamia nuts. Food Technol. 1965, 19, 1153–1156. [Google Scholar]
  30. Butler, D.G. Asreml: Fits the Linear Mixed Model R Package Version 4.1.0.110; VSN International Ltd.: Hemel Hempstead, UK, 2019. [Google Scholar]
  31. Brian, G.P.; Carl, A.P. PerformanceAnalytics: Econometric Tools for Performance and Risk Analysis. R Package Version 2.0.4. 2020. Available online: https://rdrr.io/cran/PerformanceAnalytics/ (accessed on 30 May 2021).
  32. Vu, V.Q. ggbiplot: A ggplot2 Based Biplot. R Package Version 0.55. 2011. Available online: https://rdrr.io/github/vqv/ggbiplot/ (accessed on 30 May 2021).
  33. Kassambara, A. ggpubr: “ggplot” Based Publication Ready Plots. R Package Version 0.2.5. 2020. Available online: https://rdrr.io/cran/ggpubr/ (accessed on 30 May 2021).
  34. Department of Agriculture and Fisheries. Macadamia Industry Benchmark Report 2009 to 2016 Seasons; Department of Agriculture and Fisheries: Wilsonton, Australia, 2017. [Google Scholar]
  35. Huett, D.O. Macadamia physiology review: A canopy light response study and literature review. Aust. J. Agric. Res. 2004, 55, 609–624. [Google Scholar] [CrossRef] [Green Version]
  36. Hardner, C.M.; Winks, C.W.; Stephenson, R.A.; Gallagher, E.G.; McConchie, C.A. Genetic parameters for yield in macadamia. Euphytica 2002, 125, 255–264. [Google Scholar] [CrossRef]
  37. Toft, B.D.; Alam, M.; Topp, B. Estimating genetic parameters of architectural and reproductive traits in young macadamia cultivars. Tree Genet. Genomes 2018, 14, 50. [Google Scholar] [CrossRef]
  38. Zeng, H.; Zou, M.; Zhang, H.; Luo, L. Characters analysis of the Macadamia cv. Ikaika (333) germplasm resource. Afr. J. Biotechnol. 2011, 10, 17443–17450. [Google Scholar] [CrossRef]
  39. Storey, W.B. Macadamia Selection on the Basis of Nut Quality. Calif. Macad. Soc. 1960, 9, 69–74. [Google Scholar]
  40. O’Connor, K. Selection Strategies to Improve Yield in Macadamia Using Component Traits and Genomics. Ph.D. Thesis, The University of Queensland, Brisbane, Australia, 2019. [Google Scholar]
  41. Simpson, E.H. The Interpretation of Interaction in Contingency Tables. J. R. Stat. Soc. Ser. B Methodol. 1951, 13, 238–241. [Google Scholar] [CrossRef]
  42. Thompson, T.; Baker, J. Heritability and Phenotypic Correlations of Six Pecan Nut Characteristics. J. Am. Soc. Hortic. Sci. 1993, 118, 415–418. [Google Scholar] [CrossRef]
  43. Sorkheh, K.; Shiran, B.; Khodambashi, M.; Moradi, H.; Gradziel, T.; Martinez-Gomez, P. Correlations between quantitative tree and fruit almond traits and their implications for breeding. Sci. Hortic. 2010, 125, 323–331. [Google Scholar] [CrossRef]
  44. Khadivi-Khub, A.; Sarooghi, F.; Abbasi, F. Phenotypic variation of Prunus scoparia germplasm: Implications for breeding. Sci. Hortic. 2016, 207, 193–202. [Google Scholar] [CrossRef]
  45. Sorkheh, K.; Shiran, B.; Rouhi, V.; Asadi, E.; Jahanbazi, H.; Moradi, H.; Gradziel, T.; Martinezgomez, P. Phenotypic diversity within native Iranian almond (Prunus spp.) species and their breeding potential. Genet. Resour. Crop. Evol. 2009, 56, 947–961. [Google Scholar] [CrossRef]
  46. Bak, T.; Karadeniz, T. Effects of Branch Number on Quality Traits and Yield Properties of European Hazelnut (Corylus avellana L.). Agriculture 2021, 11, 437. [Google Scholar] [CrossRef]
  47. Mast, A.R.; Willis, C.L.; Jones, E.H.; Downs, K.M.; Weston, P.H. A smaller Macadamia from a more vagile tribe: Inference of phylogenetic relationships, divergence times, and diaspore evolution in Macadamia and relatives (tribe Macadamieae; Proteaceae). Am. J. Bot. 2008, 95, 843–870. [Google Scholar] [CrossRef]
  48. Pan, Y.; Li, S.; Wang, C.; Ma, W.; Xu, G.; Shao, L.; Li, K.; Zhao, X.; Jiang, T. Early evaluation of growth traits of Larix kaempferi clones. J. For. Res. 2018, 29, 1031–1039. [Google Scholar] [CrossRef]
Figure 1. Biplot of trait loadings and accession scores for PC1 and PC2 of the growth and nut traits in wild accessions of different species. HGT = Tree height, TC = Trunk circumference, CL = Canopy length, CW = Canopy width, NWt = Nut weight, NL = Nut length, NW = Nut width, STH = Shell thickness at hilum, STE = Shell thickness at equator, SWt = Shell weight, KWt = Kernel weight, KR = Kernel recovery. The red arrows represent different traits. Dots indicate accessions. Vectors of NWt, NW, and SWt were overlapped due to high correlation among these traits.
Agriculture 11 00680 g001
Figure 2. Plots of predicted accession values for (a) nut length in M. integrifolia and (b) canopy length in M. tetraphylla by latitude of collection origin. Each point denotes one accession. The solid black line indicates the linear regression, and the grey shaded area represents the 95% confidence interval.
Agriculture 11 00680 g002
Table 1. Predicted species mean, standard error (SE), minimum, and maximum for tree height (HGT), trunk circumference (TC), canopy length (CL), canopy width (CW), nut weight (NWt), nut length (NL), nut width (NW), shell thickness at hilum (STH), shell thickness at equator (STE), shell weight (SWt), kernel weight (KWt), and kernel recovery (KR). Means within rows followed by the same letter are not significantly different based on z score between two means at p = 0.05. N: number of accessions. NA: not applicable.
CharactersAdmixtureM. integrifoliaM. tetraphyllaM. ternifoliaM. jansenii
Growth traits:N131191075N/A
HGT (cm)Mean481.5 a476.7 a446.4 b329.2 cN/A
SE19.67.17.632.1N/A
Min353.2302.5349.6287.1N/A
Max613.5629.3597.3366.2N/A
TC (cm)Mean54.0 a52.8 a46.3 b27.5 cN/A
SE2.81.01.14.6N/A
Min35.431.926.923.1N/A
Max78.471.866.330.0N/A
CL (cm)Mean456.2 a383.1 b355.5 c245.3 dN/A
SE20.57.58.033.7N/A
Min332.9221.7256.1189.7N/A
Max622.6503.3527.9295.8N/A
CW (cm)Mean407.1 a387 a352.6 b244.5 cN/A
SE18.16.67.129.8N/A
Min317.1252.6253.7173.3N/A
Max515.4522.5471.8306.8N/A
Nut traits:N121175333
NWt (g)Mean7.08 a6.68 a6.33 a1.32 b1.99 b
SE0.500.190.250.970.89
Min5.894.34.581.171.81
Max9.969.159.221.492.22
NL (mm)Mean25.7 a23.78 b25.7 a14.67 d18.61 c
SE0.660.261.161.290.34
Min23.7520.9122.7313.5617.35
Max29.4425.9829.9415.2319.58
NW (mm)Mean24.65 a23.3 b23.59 ab13.69 c15.46 c
SE0.640.260.321.241.09
Min23.4220.5921.6312.7015.21
Max26.8325.2626.4814.2615.71
STH (mm)Mean5.49 a5.89 a6.04 a2.31 b3.72 b
SE0.280.110.140.540.49
Min4.854.594.712.163.18
Max6.788.028.122.414.12
STE (mm)Mean2.54 b2.96 a2.68 b1.51 c1.68 c
SE0.170.070.090.330.31
Min1.762.102.141.241.52
Max3.104.493.751.781.87
SWt (g)Mean4.81 a4.75 a4.56 a0.82 b1.22 b
SE0.400.160.200.780.72
Min3.703.102.940.671.10
Max6.457.137.200.961.43
KWt (g)Mean2.02 a1.55 b1.62 b0.52 c0.58 c
SE0.130.050.060.250.23
Min1.600.921.030.480.53
Max2.852.362.530.570.66
KR (%)Mean29.0 a24.3 b25.2 b34.7 a30.9 a
SE1.40.50.72.72.5
Min24.018.516.632.529.8
Max32.732.433.137.833.0
Table 2. Genetic (VG) and residual (VE) variances, and broad-sense heritability (H) for tree height (HGT), trunk circumference (TC), canopy length (CL), canopy width (CW), nut weight (NWt), nut length (NL), nut width (NW), shell thickness at hilum (STH), shell thickness at equator (STE), shell weight (SWt), kernel weight (KWt), and kernel recovery (KR).
VariableVG ± SE *VE ± SEH
HGT3811.9 ± 444.02528.3 ± 156.30.60
TC72.6 ± 9.060.9 ± 3.80.54
CL3973.1 ± 492.13187.6 ± 198.40.55
CW2929.5 ± 380.12851.7 ± 177.00.51
NWt1.7 ± 0.31.2 ± 0.20.59
NL2.7 ± 0.52.7 ± 0.30.50
NW2.2 ± 0.52.8 ± 0.30.43
STH0.5 ± 0.10.4 ± 0.00.58
STE0.2 ± 0.00.1 ± 0.00.64
SWt1.2 ± 0.20.7 ± 0.10.62
KWt0.1 ± 0.00.1 ± 0.00.61
KR13.6 ± 2.39.4 ± 1.20.59
* Estimate of variance component ± standard error.
Table 3. Correlation coefficients among traits. HGT = height, TC = Trunk circumference, CL = Canopy length, CW = Canopy width, NWt = Nut weight, NL = Nut length, NW = Nut width, STH = Shell thickness at hilum, STE = Shell thickness at equator, SWt = Shell weight, KWt = Kernel weight, KR = Kernel recovery. ns: not significant at the 0.05 probability level.
HGTTCCLCWNWtNLNWSTHSTESWtKWtKR
TC0.76
CL0.490.65
CW0.570.650.71
NWt0.380.360.300.29
NL0.230.190.180.14 ns0.73
NW0.350.360.310.270.880.87
STH0.320.270.150.220.680.730.68
STE0.350.320.160.260.670.370.490.68
SWt0.350.320.240.280.950.690.810.720.75
KWt0.220.200.240.150.740.650.760.290.11 ns0.60
KR−0.21−0.21−0.07 ns−0.21−0.28−0.19−0.22−0.57−0.7−0.430.32
Table 4. Estimated variance components for Site, Accession within Site, and Site and Year interaction. The components of other random effects are not shown. HGT = Tree height, TC = Trunk circumference, CL = Canopy length, CW = Canopy width, NWt = Nut weight, NL = Nut length, NW = Nut width, STH = Shell thickness at hilum, STE = Shell thickness at equator, SWt = Shell weight, KWt = Kernel weight, KR = Kernel recovery. SE: standard error. NA: not applicable.
TraitsVariance Component
SiteSite (Accession)Site: Year
Estimate ± SE% VariationEstimate ± SE% VariationEstimate ± SE% Variation
M. integrifolia
HGT437.2 ± 404.75.92887.2 ± 620.438.90.0 ± NA0.0
TC14.0 ± 9.69.847.2 ± 11.632.90.0 ± NA0.0
CL58.1 ± 339.30.83059.0 ± 672.642.00.0 ± NA0.0
CW61.2 ± 324.90.92900.2 ± 633.743.40.9 ± NA0.0
NWt 0.85 ± 0.4527.10.98 ± 0.2731.50.36 ± 0.2711.5
NL 0.57 ± 0.5712.11.48 ± 0.4531.60.53 ± 0.4811.3
NW 0.83 ± 0.6616.41.11 ± 0.4521.90.64 ± 0.5412.6
STH 0.18 ± 0.0919.40.33 ± 0.135.60.00 ± NA0.0
STE 0.07 ± 0.0417.30.19 ± 0.0449.20.00 ± 0.020.5
SWt 0.55 ± 0.2926.20.76 ± 0.1936.50.21 ± 0.179.9
KWt 0.04 ± 0.0223.80.06 ± 0.0239.30.01 ± 0.013.2
KR 0.20 ± 1.831.013.54 ± 2.6868.51.48 ± 1.407.5
M. tetraphylla
HGT929.7 ± 567.514.52979.5 ± 630.046.50 ± NA0.0
TC6.7 ± 9.05.764.7 ± 13.654.50 ± NA0.0
CL137.2 ± 489.82.04111.7 ± 842.658.50 ± NA0.0
CW193.2 ± 330.03.72481.4 ± 554.447.00 ± NA0.0
NWt 0.33 ± 0.4510.10.77 ± 0.6123.70 ± NA0.0
NL 0.96 ± 1.112.81.82 ± 1.4524.30 ± NA0.0
NW 0 ± NA0.00.76 ± 1.0912.90 ± NA0.0
STH 0.13 ± 0.1913.00.48 ± 0.2247.00 ± NA0.0
STE 0 ± NA0.00.14 ± 0.0545.40 ± NA0.0
SWt 0 ± NA0.00.89 ± 0.3845.10 ± NA0.0
KWt 0.04 ± 0.0512.30.08 ± 0.0628.00.02 ± 0.055.9
KR 4.11 ± 8.8712.02.21 ± 4.296.59.58 ± 9.728.0
Publisher’s Note: MDPI stays neutral with regard to jurisdictional claims in published maps and institutional affiliations.

