
Improved Rice Technology Adoption: The Role of Spatially-Dependent Risk Preference


1
Department of Applied Economics and Marketing, School of Agriculture, Policy and Development, University of Reading, Reading RG6 6AR, UK
2
Centre for Rural Economy, School of Natural and Environmental Sciences, Newcastle University, Newcastle upon Tyne NE1 7RU, UK
3
School of Wine and Spirits Business, Burgundy School of Business, 21000 Dijon, France
4
Laboratorio de Economia Experimental, Jaume I University, 12076 Castellón de la Plana, Spain
*
Authors to whom correspondence should be addressed.
Agriculture 2021, 11(8), 691; https://0-doi-org.brum.beds.ac.uk/10.3390/agriculture11080691
Submission received: 28 June 2021
/
Revised: 16 July 2021
/
Accepted: 19 July 2021
/
Published: 22 July 2021
(This article belongs to the Special Issue Optimization of Resource Use for Productivity, Efficiency, and Sustainability in Agriculture)
Abstract
:This study analyses farmers’ adoption of improved rice technology, taking into account farmers’ risk preferences; the unobserved spatial heterogeneity associated with farmers’ risk preferences; farmers’ household and farm characteristics; farm locations, farmers’ access to information, and their perceptions on the rice improved varieties (i.e., high yield varieties, HYV). The study used data obtained from field experiments and a survey conducted in 2016 in Nigeria. An instrumental-variable probit model was estimated to account for potential endogenous farmers’ risk preference in the adoption decision model. Results show that risk averse (risk avoidant) farmers are less likely to adopt HYV, with the spatial lags of farmers’ risk attitudes found to be a good instrument for spatially unobserved variables (e.g., environmental and climatic factors). We conclude that studies supporting policy action aiming at the diffusion of improved rice varieties need to collect information, if possible, on farmers’ risk attitudes, local environmental and climatic conditions (e.g., climatic, topographic, soil quality, pest incidence) in order to ease the design and evaluation of policy actions on the adoption of improved agricultural technology.
1. Introduction
Agricultural productivity growth may be an important condition to achieve economic growth and development in developing countries, although the relationship between agricultural productivity and economic growth can be complex [1]. Agricultural productivity growth may be achieved through farmer’s adoption of improved agricultural technological innovation (e.g., high yield variety crops, genetically modified crops), along with a provision of good extension services, facilitating access to credit and insurance markets and irrigation facilities. All these may lead not only to yield, income, labour-saving, efficiency, and productivity improvements but also to environmental (e.g., mitigating effects on climate change) and health benefits [2,3,4]. However, despite the potential benefits associated with adopting agricultural technological innovations, relatively low levels of adoption remain a bane to the development in most developing countries, especially sub-Saharan Africa (SSA hereafter), where agriculture is a main-stay of the economy. Empirical evidence suggests that improved agricultural technology has a positive impact on farm income and poverty reduction in developing countries [5,6,7,8,9,10]. Agricultural growth has also been identified as a solution to food insecurity problems in developing countries [11]. Specifically in Nigeria, [12] reported the positive impact of HYV on poverty and welfare while [13] showed improved cassava varieties positively correlated with asset ownership but negatively related to asset poverty. Notwithstanding, productivity growth in the rice production in Nigeria is constrained by extreme weather conditions such as drought and floods. These shocks may be mitigated through the adoption of agricultural innovation.
Over the last two decades, many improved rice varieties have been introduced to boast domestic production in Nigeria. The notable ones in Ogun State include the new rice for Africa (NERICA), FARO 44, FARO 50, FARO 52, ITA 150, WAB 189, and WITA 4 [14,15]. Although significant yield differences were reported between the adopters and non-adopters of these improved varieties, the diffusion rates are hanging in balance.
Many attempts have been made to understand the drivers of farmers’ technology adoption. A major strand of this research has particularly focused on the role that socio-economic characteristics and institutional factors such as roads, locations, access to credit, market, and extension services play on farmers adoption of new technologies [16,17], with limited attention to the psychological and social dynamics such as farmers’ attitudes toward risk taking [18,19,20,21], social networks, and spatial dependences. Recent empirical finding in Tanzania suggests risk aversion reduced the willingness to pay for improved hybrid maize seed and fertilizer [22]. Additionally, evidence is abundant on the effects of social network on the adoption of improved agricultural technological innovation, e.g. adoption of sickle in rice farming [23], organic farming [24], and conservation tillage [25]. However, previous studies either examined the relationship between risk aversion and adoption decisions [19,20,26,27] or spatial dependence and adoption decisions [24,25]. We fill this gap by considering both individual and group attributes as determinants of HYV adoption decisions.
Farmers often make adoption decisions based on both individual and social attitudes and views on the subject matter. Such decisions have attracted different modeling approaches [28,29]. While risk preference or attitude is included as an explanatory variable by some studies, the potential endogenous nature of risk preference in the adoption model has never been given the attention it deserves. Therefore, the contribution of this article to adoption literature is two-fold. First, it tests the hypothesis that risk preferences are endogenous in farmers’ decisions to adopt HYV. Second, it accounts for unobserved heterogeneity within farmers’ risk attitudes, thereby minimizing estimation caveats related to latent variables. This is done in line with [30] principle on the role of geographical proximity in a social network. Thus, social norms, cultural values and neighborhood effects may be associated with a shared level of climatic variability, which may then create a collective view on risk taking. Notably, farmers learn improved agricultural innovation from one another through interpersonal communication and social interaction [31,32]. Such social learning effects, along with unobserved spatial factors (local climatic and topographic conditions) often manifest in farmers’ decision making processes.
While spatial dependence is inherent in most observational data, it is often ignored in analysis, thereby producing biased results and misleading inference [33,34]. We argue that the farmers’ decisions may be influenced by spatially-dependent risk preferences or unobserved heterogeneity. Furthermore, accounting for spatial dependency can help dealing with problems associated with the omission of important variables (e.g., environmental, climatic, topographic, and socio-economic conditions). In particular, receiving adequate information on the potential benefits of HYV may be an important determinant of farmers’ acceptance of such technological innovation. Such information may be transmitted through spatial relationships, especially when farmers living closely rely on their friends and neighbours for information on improved farm practices [25]. Of particular attention is that farmers living closely may behave in more similar ways than farmers at distant locations, which may suggest similar adoption patterns within groups of neighboring farmers. In addition, farmers may emulate one another due to the influence of common experiences and space-specific characteristics such as local climate and socio-economic conditions [35]. Thus, the risk-taking behaviour of farmers and the spatial dependence associated with it may be a useful tool to understanding the adoption and diffusion of agricultural innovation in developing countries.
In order to fill a gap in the adoption literature this study examines the role of spatially-dependent risk preference in farmers’ decisions to adopt high yielding rice varieties (HYV) in Nigeria along with the farm and farmers’ specific factors, farmers’ locations, and perceptions of technology attributes.
2. Materials & Methods
2.1. Source of Data
The study collected experimental and survey data. Risk attitudes were elicited using an incentivized risk-elicitation task, the panel lotteries originally proposed by [36], S-GG hereafter. We built on the original S-GG by introducing an additional three treatments. Thus, our panel lotteries have four treatments, each with the nomenclature small gain one (SG1), small gain two (SG2), large gain one (LG1), and large gain two (LG2). Each treatment has four panels each. Readers are referred to the working paper on the implementation note on S-GG panel lotteries for the advantages and limitations of this risk elicitation method [37] et. Applications of the previous version of S-GG panel lotteries can be found in [38,39,40] Rice farmers were sampled across 46 different rice growing locations within the 4 agricultural zones in Ogun State Agricultural Development Programme (OGADEP), Nigeria between March and May, 2016. Two smart android phones, aided by open data kit (ODK collect) software were used for data collection. Thus, the geographical information system (GPS) coordinates were recorded. Notwithstanding the poor or the absence of mobile networks in most visited villages, the locations of each sampled farmer were manually recorded, and the record was later used to obtain the coordinates. Three post-graduate students were employed as research assistants for the data collection. They were trained shortly before the commencement of the survey on how to use the ODK collect. Moreover, useful information on the main rice growing locations was collected from the OGADEP office prior to the survey. On many occasions the extension agents accompanied the researchers and provided guidance on rice growing locations. Farmers were individually interviewed at home and farms (homes are generally close to the farms due to the labour intensive nature of rice production). A total of 329 rice farmers were interviewed but 328 fully completed the questionnaire.
Detailed about the risk panel lotteries’ payoffs, the experimental procedure as well as the record sheet used to illustrate the experiment to rice farmers are documented in [41] The lotteries were presented to farmers using blue and red balls, which respectively explain the winning probabilities and losing probabilities . Record sheets were shown to farmers to complement the mobile technology used and guide the subjects in making their choices. The risk experiment was conducted first, followed by questions on the socio-economic factors. Subjects were presented with task SG1 of the lottery-panel test by starting from panel 1 to panel 4. Each subject was shown a bag containing 10 blue and red balls, representing the winning and losing odds for each lottery chosen and implemented in the experiment.
2.2. Conceptual Framework
2.3. Empirical Models
Modeling approaches in binary and multivariate dependent variables is usually motivated by the nature of data and the objective of study. In this regard, adoption and participation studies have applied two stage models such as Tobit [42,43,44], Heckman selection model [45,46], and double hurdle model [28,29]. Other modeling methods included survival/duration model [26,47], multivariate probit [48], bivariate probit [49], and three-stage estimation method [50]. Whereas a binary model is an appropriate approach when a decision maker faces two technology options, a two-stage procedure is the appropriate method to control for selection bias.
We tested the hypothesis of endogenous risk preference in adoption decisions. Hence, an instrumental variable probit (IV probit hereafter) model is applied. Rice farmers with greater social networks may be well informed yet show positive or negative attitudes towards adopting HYV. Since such spatially determined conditions are typically unobserved, we incorporated spatial dependency in the analysis to account for unobserved heterogeneity in our data. This heterogeneity is defined in a spatial weights matrix.
2.3.1. Spatial Weights Matrix
The distance between rice farms was estimated from the GPS coordinates. This distance in kilometres is used in the power weights matrix in line with [35]. This is specified in Equation (1). Distance power weights matrix has many advantages. First, unlike the binary contiguity method, neighbours may have different weights. Second, more weights are attached to the shorter distance, implying the closer the neighbours the more the influence. Most studies standardized the row of the weights matrix, for easy interpretation by first converting the diagonal elements of the weights matrix to zero, then the matrix with zero diagonal elements is divided by the vector matrix, the sum of each row [23,24]. In this study, only the diagonal elements of the weights matrix are set to zero to prevent self-neighbour confounds.
where is the distance between farmers in locations and , and is the cut-off distance that tests the dependency limit between farmers. The cut-off distances tested include 10 km, 20 km, 30 km, 40 km, and 60 km, after which the spatial effect decreases at a slower pace.
2.3.2. Instrumental Probit Model
We estimated the instrumental variable model using structural equation modelling. Farmers’ risk preferences may be associated with unobserved heterogeneity such as environmental, climatic, topographic, and socio-economic conditions. To address this endogenous problem, the spatial lag of the risk preference is incorporated as the instrument for latent variables in the adoption model (Equations (2) and (3)). Put differently, the predicted value of Equation (2) is incorporated into Equation (3), suggesting that the effect of risk preference is explained in the adoption model by controlling for other important socio-economic variables. Our model specification is in line with [51].
where is a index of farmers risk taking (risk avoidance, an endogenous variable vector). Risk avoidance is introduced and used in this study in place of risk aversion, because the parameter of the utility function is not estimated, given the nature of our panel risk lotteries. Willingness to risk taking or risk taking is equally used interchangeably with risk avoidance as faces of the same coin, because risk preference may be viewed as the extent to which individuals are willing to take risks. This index is calculated as the average probability values corresponding to farmers’ choices in each treatment of the lottery panel task. The probability ranges between 0.1 and 1 with an index of 1 indicating highly risk avoidance while 0.1 means extreme risk taking. is a vector of exogenous explanatory variables in the adoption models including farmer’s characteristics (age, education, religion); household/farm characteristics (household size, farm size, production system); agricultural zone where the farm is located; farmer’s access to information via extension services and friends; farmer’s perception of technological attributes of the rice improved varieties. The definition and description of variables are depicted in Table 1. These variables are selected with recourse to the existing literature. is the vector of the instrumental variable (spatial lag of farmer’s risk preference). This represents the weighted average of the farmer’s risk attitudes in the neighbourhood locations. The is a scalar parameter that determines the correlation between risk taking by a rice farmer and the adjusted-by-distance mean risk willingness of his neighbours. is the weights matrix defined in Equation (1). Lastly, suggests that the potential utility rice farmers derived from the risk experiment is related to that derived by his neighbours’. Finally, is a latent variable, which represents farmer’s adoption decisions, takes the value of 1 if rice farmers adopt HYV, and 0 otherwise.
The error terms are assumed to be jointly and normally distributed, with the first element of the error matrix normalized to one to identify the model. is a vector of parameter corresponding to the predicted value of the first stage model. is a vector of structural parameters in the second stage adoption decisions’ model while is the vector of the parameters of the first stage risk preference model. A significant correlation between the disturbance errors of the two models suggests a relationship exists between adoption and risk preference models. The order condition for the identification of the structural parameters is that the number of variables in the risk model is greater than or equal to that of the adoption model. In addition to the spatial lag as the instrumental variable, other variables in the adoption model were treated as exogenous and instruments to exactly identify the model. Four different models were estimated for the risk treatments for comparison, and due to the fact that a single model is not possible because of the spatial lag factor.
3. Results
Table 1 summarizes the descriptive statistics of the variables considered in the adoption model. The adoption rate is 9%, indicating low adoption of HYV. The average age of the rice farmers is 47 years. The majority of sampled farmers have less than primary school education (5 years of schooling), are Christians (56%), with an average of 6 members in the household. On average, farmers cultivated 1.90 hectares of land, which ascertains the small-scale nature of the rice production business.
In addition, most sampled farmers are male (68%), married (94%), and engaged in upland rice production system (87%). Furthermore, the majority of the sampled farmers perceived high yield, long stem, shorter growing cycle, and good tiller to be very important when considering the adoption of HYV. On the factors related to the access to information, 68% of the sampled rice farmers relied on their friends and relatives (neighbours) on information about improved agricultural technology. The average number of contacts with an extension agent per year is 2. The proportion of sampling across the 4 OGADEP zones includes Ikenne (26%), Ilaro (19%), Ijebu-Ode (27%), and Abeokuta (28%). Lastly, the average values for the risk attitudes were estimated to be approximately 0.80, 0.60, 0.70 and 0.60 for SG1, SG2, LG1, and LG2, respectively.
The results corresponding to the limit of spatial dependence (60 km) are presented in Table 2. The hypothesis of endogenous risk preferences is accepted. Significant correlation between the standard errors of the risk and adoption models confirms the dependency nature of the models. Thus, the models are better estimated in two stages.
Four models were estimated with respect to the four risk treatments, since the inclusion of the spatial lag prevents pooled estimations. The results (Table 2) reveal that risk avoidance (aversion) decreases the propensity to adopt HYV according to all the four models estimated (SG1, SG2, LG1, and LG2). These results generally support the relationship between real-life decisions (adoption and experimental risk-taking attitude). On one hand, they agree with the previously expressed views on neighborhood influence in the adoption decision making processes [23,24]. On the other hand, they affirm the negative effects of risk aversion in the adoption of improved agricultural technology [19,20,21,23]. Additionally, [52], using an instrumental variable approach, found a negative relationship between risk aversion and adoption of new technologies for the case of Chinese broiler growers while [53] used laboratory experiments in a South African setting to find that risk averse individuals are less likely to adopt new technologies. Overall, our results affirm the importance of spatially-dependent risk preference in the adoption of HYV (i.e., the need to account for unobserved spatial heterogeneity in farmers’ risk preferences). As shown in [41] for rice farmers in Nigeria, farmers’ risk preferences are associated with unobserved spatial heterogeneity (e.g., soil, topographic, farmers emulating each other).
As shown in Table 2, Christians are less likely to adopt HYV compared to the practitioners of other religions for large gain lotteries (LG1). This may align with previously expressed views that religious farmers are risk averse [26,54]. Although it is difficult to know the level of belief of individual farmers, a religious group is an important policy variable in Nigeria. Results revealed that the probability of adopting HYV is relatively lower for males compared to females. This result is contrary to most previous positions that males are risk takers.
The results revealed that rice farmers located in Ikenne and Ijebu-Ode agricultural zones were less likely to adopt HYV while farmers living in Ilaro agricultural zone were more likely to adopt HYV compared to farmers living in Abeokuta zone (base category). Variability in climatic environment is one possibility for this pattern of behaviour. Thus, the results underscore the importance of climatic condition as well as geographical locations in adoption decision processes.
As shown in Table 2, access to extension services had positive and significant effect on the adoption of HYV for large gain lotteries (LG1). This is consistent with previous findings, which reported a positive and significant effect of extension contact on the adoption of improved agricultural technology [55,56,57]. Extension agents are meant to inform farmers on improved farm practices yet low extension to farmer ratio in most developing countries explains the limitation of extension services and fulfillment of extension as an institution.
The characteristics of improved rice varieties such as high yield, long stem, and short duration have been previously reported as one of the key factors influencing farmers’ adoption decisions. With the exception of high yield, the results indicate that rice farmers who highly ranked HYV attributes such as shorter growing cycle (LG1 and LG2) and good tiller (SG1, LG1 and LG2) were less likely to adopt HYV. This result is contrary to expectations.
4. Discussion
Farmers who are strongly unwilling to take risky decisions were less likely to adopt HYV relative to those with strong willingness to risk taking. It is expected that a highly risky technology should offer higher yield and income advantages to farmers but aversion to risk may reduce the propensity of adopting such technological innovation. Furthermore, risk loving farmers are likely to be early adopters or allocate a larger proportion of their farm size to improved farm technologies while those who avoid risk are likely to lag behind [26]. Nonetheless, acceptance of innovation by farmers is not a direct, but a complex process. Farmer’s risk preferences have been identified as one of such factors along with the spatial conditions that may determine those preferences, for example, soil type/quality, and emulating other farmers [41]. The farmers’ own risk preferences and how these are shaped by spatial conditions lead to farm management decisions that may have important economic implications. For instance, when a new technology is offered, farmers who are risk averse may become lagged farmers who may lose the opportunity of earning a relatively high income from using the novel technology instead of the traditional technology. However, farmers’ own risk preferences are moderated by the spatial conditions. Thus, farmers may base their decisions on the proven high-yield that resulted from the adoption of innovation by other farmers.
In other words, the results suggest farmers’ technology adoption decisions may not only be influenced by their risk preferences but also by their neighbours’ risk preferences, social networks, soil characteristics, climatic conditions, cultural values, and other environmental factors. Farmers living very closely may be more likely to interact with one another compared to distant ones. Such interaction effects may manifest in farmers’ adoption decisions and risk preference patterns [41]. Hence, social interaction can be used to accelerate the diffusion of agricultural technology especially in rural areas where farmers share common values, culture, and norms. Social network or spatially determined conditions are bonding power in rural communities. Rural dwellers have full information about their neighbours in terms of wealth, family, and other individual attributes. Such information suggests they may take similar decisions with respect to economic activities including production and consumption activities as well as insurance and other risk mitigating process.
Since religion relates to belief, it may affect individuals’ perceptions as well as resource allocation or production and investment decisions [41]. Accordingly, Ambali et al. [41] found heterogeneity of farmers’ risk attitudes across religions. This result provides information on the risk-taking patterns inherent in the norms, values, and politics. The gender results agree with [58], although contrary to most previously expressed views. Many reasons may be adduced to the finding. First, male farmers may be contented with the income earned from rice production since they cultivate more lands than their female counterparts, in agreement with past research findings that wealthy individuals are less averse to risk taking [26,41,54,59,60]. Second, it could be linked to the peculiarity of the labour-intensive nature of rice production enterprise. Third, female headed households may be under financial pressure. This may drive innovativeness and thus willingness to undertake new investment compared to their male counterparts. Lastly, males may be cautious of losing the ‘sure’ output or yield from the traditional varieties than their female counterparts, given their responsibility in the household. Therefore, the desire to increase farm income by female farmers may constitute a push factor for the adoption of risky investment.
Farmers living in the drier Ilaro zone had higher propensity to adopt HYV due largely to the stress-tolerance and drought resistant nature of HYV. As shown in the significant coefficients, the propensity to adopt HYV is higher for Ilaro, Abeokuta, Ikenne, and Ijebu-Ode zones, respectively. The finding also revealed that farmers residing in the low rainfall zone tended to accept HYV because of its suitability for their climate. Indeed, those in the low land areas (Ijebu-Ode zone) were least likely to adopt HYV. Overall, geographical proximity explained the observed adoption patterns among farmers. Access to information and infrastructure is another reason farmers may behave heterogeneously across locations. In line with [61], rice farmers living in the rural agricultural zones or remote areas may have less access to information compared to urban dwellers. Rural areas generally lack access to infrastructural facilities such as accessible roads and schools, which limit access to information. This is in agreement with previous findings that farmers in rural areas are resource poor and risk averse [59,60]. In summary, access to information may influence the decisions to adopt or otherwise.
Another important institutional variable that significantly explained rice farmers’ HYV adoption decisions is access to extension service. Farmers often rely on the information provided by extension agents to make informed farm production and investment decisions. However, low extension service is one of the major challenges confronting farmers in developing countries. This limits access to information and subsequently investment in improved agricultural innovation.
The result on the technology attribute is plausible although it is contrary to previous findings [62,63]. One main reason for this result is the fact that even though these attributes were perceived important, a sizeable proportion of rice farmers did not grow HYV partly because of high preference for a local delicacy, OFADA rice. However, rice farmers perceived high yield as an important attribute in their choice of HYV as shown in the coefficient of this variable. It could be argued that among the various attributes, yield is perceived most important, which is not surprising since higher yield implies more income. Again, most agricultural technologies are developed central to producing more output per hectare of land to appeal to farmers’ judgment and acceptance. It can therefore be submitted that farmers attached more importance to high yield relative to other attributes due largely to the desire to obtaining higher yield and subsequently more income without increasing farmland.
5. Conclusions
Socio-economic, cultural, geological, ecological, and climatic characteristics may determine farmer’s management decisions such as the adoption of a new technology along with farmers’ own perceptions of risk and the perceptions of risk of their neighbours. All these aspects may extend beyond political boundaries, suggesting that policies aiming at achieving agricultural productivity growth (e.g., through the adoption of new technologies) may need to consider these spatial aspects and be implemented not necessarily at the policy boundary level. This may imply relatively higher costs in implementing the policy but also a higher success, and considerations need to be taken on a case-by-case basis.
Evidence of spatial dependency in risk taking suggests that some unobservable factors within farmers’ locations may constitute a driving force for risky decisions such as HYV adoption. Identifying such factors (which may include climatic and environmental variables) will aid policy at ensuring the acceptance of agricultural technological innovation.
It is worth noting some policy relevant issues we found in this research. We found an association between farmer’s risk preferences and farmer’s neighbour’s risk preferences, which may indicate a mix between social learning effects and local conditions that moderate farmers’ risk preferences. Hence, identifying locations where adoption is likely (unlikely to occur) through understanding farmers’ risk preferences is important for policy action. It follows that interpersonal communication and social interaction could be used as effective tool for the diffusion of agricultural innovation especially in the rural areas, in particular where there may be a lack of educational and other important infrastructural facilities such as accessible roads. We found that local conditions matter in farmer’s management decisions such as farmers’ adoption of new technologies. Thus, identifying key local conditions that may ease or make farmer’s adoption of new technologies difficult is crucial to evaluate policy actions aiming to encourage farmers to adopt a new agriculture technology. For instance, farmers located in the low rainfall zone are more willing to take risky adoption decisions relative to those residing in the urban agricultural zone. This suggests that there may be less need for policy support (e.g., provision of information on the advantages of new technologies, provision of infrastructural facilities such as accessible roads to facilitate share of information) in this zone relative to others. It may also be the case that there are locations where the new technology may not be suitable due to local conditions. In this case farmers should not be encouraged to adopt the technology.
Local conditions were found to be crucial and deserve specific attention. Therefore, the availability and use of specific information (i.e., data), beyond the usual information collected in surveys (e.g., farmer’s socio-demographic characteristics such as age, gender, education), such as farmer’s and farmers neighbour’s risk attitudes, climatic variables (e.g., rainfall, temperature, humidity), environmental variables (e.g., soil quality, altitude, pest incidence, infrastructure quality), and neighbours’ willingness to adopt new technology is key to specifically account for these usually unobserved factors in agricultural technology adoption models, and to inform policy makers on what specific aspects need to be taken into consideration when designing and implementing a policy (e.g., encouraging farmers to adopt a new technology). Although we acknowlede that not accounting for these specific aspects may be a limitation of this research (i.e., we are not able to establish how specific spatial heterogeneities are associated with farmer’s risk preferences), the use of spatial econometric techniques enabled us to, at least, control for these aspects in the adoption model used through farmers’ neighbours risk preferences. Further research should focus on the identification of the unobservable factors that influence the farmers’ decision-making processes. For this, future research in agricultural technology adoption should obtain and use information on these spatially determined aspects while using spatial econometric techniques to account for spatially unobserved heterogeneity.
Author Contributions
Conceptualization, O.I.A.; methodology, O.I.A., F.J.A., N.G.; software, O.I.A., F.J.A.; validation, O.I.A., F.J.A. and N.G.; formal analysis, O.I.A. and F.J.A.; investigation, O.I.A.; resources, O.I.A.; data curation, O.I.A.; writing—original draft preparation, O.I.A.; writing—review & editing, O.I.A.; visualization, O.I.A., F.J.A.; supervision, F.J.A. and N.G.; project administration, O.I.A.; funding acquisition, O.I.A., F.J.A. and N.G. All authors have read and agreed to the published version of the manuscript.
Funding
This research was funded by Tertiary Education Trust Fund (TETFUND) of Nigeria while the APC was funded by NG through a voucher.
Institutional Review Board Statement
The study was conducted according to the guidelines of the Declaration of Helsinki, and approved by the Ethics Committee of the University of Reading (protocol code/ethical clearance application number P00140, approved on 12 February 2016).
Informed Consent Statement
Informed consent was obtained from all subjects involved in the study.
Data Availability Statement
The data used for the analyses would be made available on request.
Conflicts of Interest
The authors declare no conflict of interest. The funders had no role in the design of the study; in the collection, analyses, or interpretation of data; in the writing of the manuscript, or in the decision to publish the results.
References
- Gollin, D. Agricultural Productivity and Economic Growth. Handb. Agric. Econ. 2010, 4, 3825–3866. [Google Scholar] [CrossRef]
- Abedullah; Kouser, S.; Qaim, M. Bt Cotton, Pesticide Use and Environmental Efficiency in Pakistan. J. Agric. Econ. 2015, 66, 66–86. [Google Scholar]
- Villano, R.; Bravo-Ureta, B.; Solis, D.; Fleming, E. Modern Rice Technologies and Productivity in the Philippines: Disentangling Technology from Managerial Gaps. J. Agric. Econ. 2015, 66, 129–154. [Google Scholar]
- Dar, W.D.; Laxmipathi Gowda, C.L. Declining agricultural productivity and global food security. J. Crop Improv. 2013, 27, 242–254. [Google Scholar]
- Rahman, S. Impact of technological change on income distribution and poverty in Bangladesh agriculture: An empirical analysis. J. Int. Dev. 1999, 11, 935–955. [Google Scholar]
- Mendola, M. Agricultural technology adoption and poverty reduction: A propensity-score matching analysis for rural Bangladesh. Food Policy 2007, 32, 372–393. [Google Scholar]
- Kijima, Y.; Otsuka, K.; Sserunkuuma, D. Assessing the impact of NERICA on income and poverty in central and western Uganda. Agric. Econ. 2008, 38, 327–337. [Google Scholar]
- Udoh, J.E.; Omonona, T.B. Improved rice variety adoption and its welfare impact on rural farming households in Akwa Ibom State of Nigeria. J. New Seeds 2008, 9, 156–173. [Google Scholar]
- Becerril, J.; Abdulai, A. The impact of improved maize varieties on poverty in Mexico: A propensity score-matching approach. World Dev. 2010, 38, 1024–1035. [Google Scholar]
- Kassie, M.; Shiferaw, B.; Muricho, G. Agricultural technology, crop income, and poverty alleviation in Uganda. World Dev. 2011, 39, 1784–1795. [Google Scholar]
- Mainuddin, M.; Kirby, M. Agricultural productivity in the lower Mekong Basin: Trends and future prospects for food security. Food Secur. 2009, 1, 71–82. [Google Scholar] [CrossRef]
- Dontsop Nguezet, P.M.; Diagne, A.; Okoruwa, O.V.; Ojehomon, V. Impact of improved rice technology adoption (NERICA varieties) on income and poverty among rice farming households in Nigeria: A local average treatment effect (LATE) approach. Q. J. Int. Agric. 2011, 50, 267–291. [Google Scholar]
- Awotide, B.A.; Alene, A.D.; Abdoulaye, T.; Manyong, V.M. Impact of agricultural technology adoption on asset ownership: The case of improved cassava varieties in Nigeria. Food Secur. 2015, 7, 1239–1258. [Google Scholar] [CrossRef]
- Saka, J.; Okoruwa, V.; Lawal, B.; Ajijola, S. Adoption of improved rice varieties among small-holder farmers in south-western Nigeria. World J. Agric. Sci. 2005, 1, 42–49. [Google Scholar]
- Saka, J.; Lawal, B. Determinants of adoption and productivity of improved rice varieties in southwestern Nigeria. Afr. J. Biotechnol. 2009, 8, 4923–4932. [Google Scholar]
- Feder, G.; Just, R.E.; Zilberman, D. Adoption of agricultural innovations in developing countries: A survey. Econ. Dev. Cult. Chang. 1985, 33, 255–298. [Google Scholar] [CrossRef] [Green Version]
- Foster, A.D.; Rosenzweig, M.R. Microeconomics of technology adoption. Annu. Rev. Econ. 2010, 2, 395–424. [Google Scholar] [CrossRef] [PubMed] [Green Version]
- Marra, M.; Pannell, D.J.; Abadi Ghadim, A.K. The economics of risk, uncertainty and learning in the adoption of new agricultural technologies: Where are we on the learning curve? Agric. Syst. 2003, 75, 215–234. [Google Scholar]
- Barham, B.L.; Chavas, J.P.; Fitz, D.; Salas, V.R.; Schechter, L. The roles of risk and ambiguity in technology adoption. J. Econ. Behav. Organ. 2014, 97, 204–218. [Google Scholar] [CrossRef]
- Barham, B.L.; Chavas, J.P.; Fitz, D.; Ríos-Salas, V.; Schechter, L. Risk, learning, and technology adoption. Agric. Econ. 2015, 46, 11–24. [Google Scholar] [CrossRef]
- Ward, P.S.; Singh, V. Using Field Experiments to Elicit Risk and Ambiguity Preferences: Behavioural Factors and the Adoption of New Agricultural Technologies in Rural India. J. Dev. Stud. 2015, 51, 707–724. [Google Scholar] [CrossRef]
- Shee, A.; Azzarri, C.; Haile, B. Farmers’ willingness to pay for improved agricultural technologies: Evidence from a field experience in Tanzania. Sustainability 2020, 12, 216. [Google Scholar] [CrossRef] [Green Version]
- Case, A. Neighborhood influence and technological change. Reg. Sci. Urban Econ. 1992, 22, 491–508. [Google Scholar] [CrossRef]
- Läpple, D.; Kelley, H. Spatial dependence in the adoption of organic drystock farming in Ireland. Eur. Rev. Agric. Econ. 2015, 42, 315–337. [Google Scholar] [CrossRef] [Green Version]
- Tessema, Y.M.; Asafu-Adjaye, J.; Kassie, M.; Mallawaarachchi, T. Do neighbours matter in technology adoption? The case of conservation tillage in northwest Ethiopia. Afr. J. Agric. Resour. Econ.-Afjare 2016, 11, 211–225. [Google Scholar]
- Liu, E.M. Time to change what to sow: Risk preferences and technology adoption decisions of cotton farmers in China. Rev. Econ. Stat. 2013, 95, 1386–1403. [Google Scholar] [CrossRef] [Green Version]
- Liu, E.M.; Huang, J. Risk preferences and pesticide use by cotton farmers in China. J. Dev. Econ. 2013, 103, 202–215. [Google Scholar] [CrossRef] [Green Version]
- Tambo, J.A.; Abdoulaye, T. Climate change and agricultural technology adoption: The case of drought tolerant maize in rural Nigeria. Mitig. Adapt. Strateg. Glob. Chang. 2012, 17, 277–292. [Google Scholar] [CrossRef]
- Anik, A.R.; Salam, M.A. Determinants of adoption of improved onion variety in Bangladesh. J. Agric. Environ. Int. Dev. 2015, 109, 71–88. [Google Scholar]
- Tobler, W.R. A computer movie simulating urban growth in the Detroit region. Econ. Geogr. 1970, 46, 234–240. [Google Scholar] [CrossRef]
- Bandiera, O.; Rasul, I. Social networks and technology adoption in northern Mozambique. Econ. J. 2006, 116, 869–902. [Google Scholar] [CrossRef] [Green Version]
- Conley, T.G.; Udry, C.R. Learning about a new technology: Pineapple in Ghana. Am. Econ. Rev. 2010, 100, 35–69. [Google Scholar] [CrossRef] [Green Version]
- Bockstael, N.E. Modeling economics and ecology: The importance of a spatial perspective. Am. J. Agric. Econ. 1996, 78, 1168–1180. [Google Scholar] [CrossRef]
- Weiss, M.D. Precision farming and spatial economic analysis: Research challenges and opportunities. Am. J. Agric. Econ. 1996, 78, 1275–1280. [Google Scholar] [CrossRef]
- Areal, F.J.; Balcombe, K.; Tiffin, R. Integrating Spatial Dependence into Stochastic Frontier Analysis. Aust. J. Agric. Resour. Econ. 2012, 56, 521–541. [Google Scholar] [CrossRef] [Green Version]
- Sabater-Grande, G.; Georgantzís, N. Accounting for Risk Aversion in Repeated Prisoners’ Dilemma Games: An Experimental Test. J. Econ. Behav. Organ. 2002, 48, 37–50. [Google Scholar] [CrossRef]
- Barreda-Tarrazona, I.; Sabater-Grande, G.; Georgantzis, N. Risk Elicitation through the S-GG Lottery Panel Task: Implementation Note; Working Paper 2020/23; LEE and Economics Department, Universitat Jaume I: Castellon, Spain, 2020. [Google Scholar]
- Barreda-Tarrazona, I.; Jaramillo-Gutierrez, A.; Navarro-Martinez, D.; Sabater-Grande, G. Risk attitude elicitation using a multi-lottery choice task: Real Vs hypothetical incentives. Span. J. Financ. Account. 2011, 40, 609–624. [Google Scholar] [CrossRef] [Green Version]
- Garcia-Gallego, A.; Georgantzis, N.; Jaramillo-Gutierrez, A.; Parravano, M. The lottery-panel task for bi-dimensional parameter-free elicitation of risk attitudes. Rev. Int. Sociol. 2012, 70, 53–72. [Google Scholar] [CrossRef] [Green Version]
- Attanasi, G.; Georgantzis, N.; Rotondi, V.; Vigani, D. Lottery- and survey-based risk attitudes linked through a multichoice elicitation task. Theory Decis. 2018, 84, 341–372. [Google Scholar] [CrossRef]
- Ambali, O.I.; Areal, F.J.; Georgantzis, N. On Spatially Dependent Risk Preferences: The Case of Nigerian Farmers. Sustainability 2021, 13, 5943. [Google Scholar] [CrossRef]
- Nkonya, E.; Schroeder, T.; Norman, D. Factors affecting adoption of improved maize seed and fertiliser in northern Tanzania. J. Agric. Econ. 1997, 48, 1–12. [Google Scholar] [CrossRef]
- Alene, A.D.; Poonyth, D.; Hassan, R.M. Determinants of adoption and intensity of use of improved maize varieties in the Central Highlands of Ethiopia: A Tobit analysis. Agrekon 2000, 39, 633–643. [Google Scholar] [CrossRef]
- Fufa, B.; Hassan, R.M. Determinants of fertilizer use on maize in Eastern Ethiopia: A weighted endogenous sampling analysis of the extent and intensity of adoption. Agrekon 2006, 45, 38–49. [Google Scholar] [CrossRef] [Green Version]
- Dadi, L.; Burton, M.; Ozanne, A. Adoption and intensity of fertiliser and herbicide use in the Central Highlands of Ethiopia. Agrekon 2001, 40, 316–333. [Google Scholar] [CrossRef]
- Idowu, A.O.; Ojiako, I.; Ambali, O.I. Participation and wage of rural female headed households in Nigeria non-farm employment. Eur. Sci. J. 2013, 9, 194–219. [Google Scholar]
- Fuglie, K.O.; Kascak, C.A. Adoption and diffusion of natural-resource-conserving agricultural technology. Rev. Agric. Econ. 2001, 23, 386–403. [Google Scholar] [CrossRef]
- Ahmed, M.H. Adoption of multiple agricultural technologies in maize production of the Central Rift Valley of Ethiopia. Stud. Agric. Econ. 2015, 117, 162–168. [Google Scholar] [CrossRef] [Green Version]
- Neill, S.P.; Lee, D.R. Explaining the adoption and disadoption of sustainable agriculture: The case of cover crops in northern Honduras. Econ. Dev. Cult. Chang. 2001, 49, 793–820. [Google Scholar] [CrossRef] [Green Version]
- Saha, A.; Shumway, C.R.; Talpaz, H. Joint estimation of risk preference structure and technology using expo-power utility. Am. J. Agric. Econ. 1994, 76, 173–184. [Google Scholar] [CrossRef]
- Wooldridge, J.M. Econometric Analysis of Cross Section and Panel Data; MIT Press: Cambridge, UK, 2002; pp. 1–450. [Google Scholar]
- Mao, H.; Zhou, L.; Ifft, J.; Ying, R. Risk preferences, production contracts and technology adoption by broiler farmers in China. China Econ. Rev. 2019, 54, 147–159. [Google Scholar] [CrossRef]
- Brick, K.; Visser, M. Risk preferences, technology adoption and insurance uptake: A framed experiment. J. Econ. Behav. Organ. 2015, 118, 383–396. [Google Scholar] [CrossRef]
- Liebenehm, S.; Waibel, H. Simultaneous Estimation of Risk and Time Preferences among Small-scale Cattle Farmers in West Africa. Am. J. Agric. Econ. 2014, 96, 1420–1438. [Google Scholar] [CrossRef] [Green Version]
- Polson, R.A.; Spencer, D.S. The technology adoption process in subsistence agriculture: The case of cassava in Southwestern Nigeria. Agric. Syst. 1991, 36, 65–78. [Google Scholar] [CrossRef]
- Moser, C.M.; Barrett, C.B. The complex dynamics of smallholder technology adoption: The case of SRI in Madagascar. Agric. Econ. 2006, 35, 373–388. [Google Scholar] [CrossRef]
- Oladele, O. A Tobit analysis of propensity to discontinue adoption of agricultural technology among farmers in Southwestern Nigeria. J. Cent. Eur. Agric. 2006, 6, 249–254. [Google Scholar]
- Davey, K.A.; Furtan, W.H. Factors that affect the adoption decision of conservation tillage in the prairie region of Canada. Can. J. Agric. Econ./Rev. Can. D’Agroecon. 2008, 56, 257–275. [Google Scholar] [CrossRef]
- Wik, M.; Aragie Kebede, T.; Bergland, O.; Holden, S.T. On the measurement of risk aversion from experimental data. Appl. Econ. 2004, 36, 2443–2451. [Google Scholar] [CrossRef]
- Yesuf, M.; Bluffstone, R.A. Poverty, risk aversion, and path dependence in low-income countries: Experimental evidence from Ethiopia. Am. J. Agric. Econ. 2009, 91, 1022–1037. [Google Scholar] [CrossRef]
- Kebede, Y.; Gunjal, K.; Coffin, G. Adoption of new technologies in Ethiopian agriculture: The case of Tegulet-Bulga district Shoa province. Agric. Econ. 1990, 4, 27–43. [Google Scholar]
- Adesina, A.A.; Baidu-Forson, J. Farmers’ perceptions and adoption of new agricultural technology: Evidence from analysis in Burkina Faso and Guinea, West Africa. Agric. Econ. 1995, 13, 1–9. [Google Scholar] [CrossRef]
- Kallas, Z.; Serra, T.; Gil, J.M. Farmers’ objectives as determinants of organic farming adoption: The case of Catalonian vineyard production. Agric. Econ. 2010, 41, 409–423. [Google Scholar] [CrossRef]
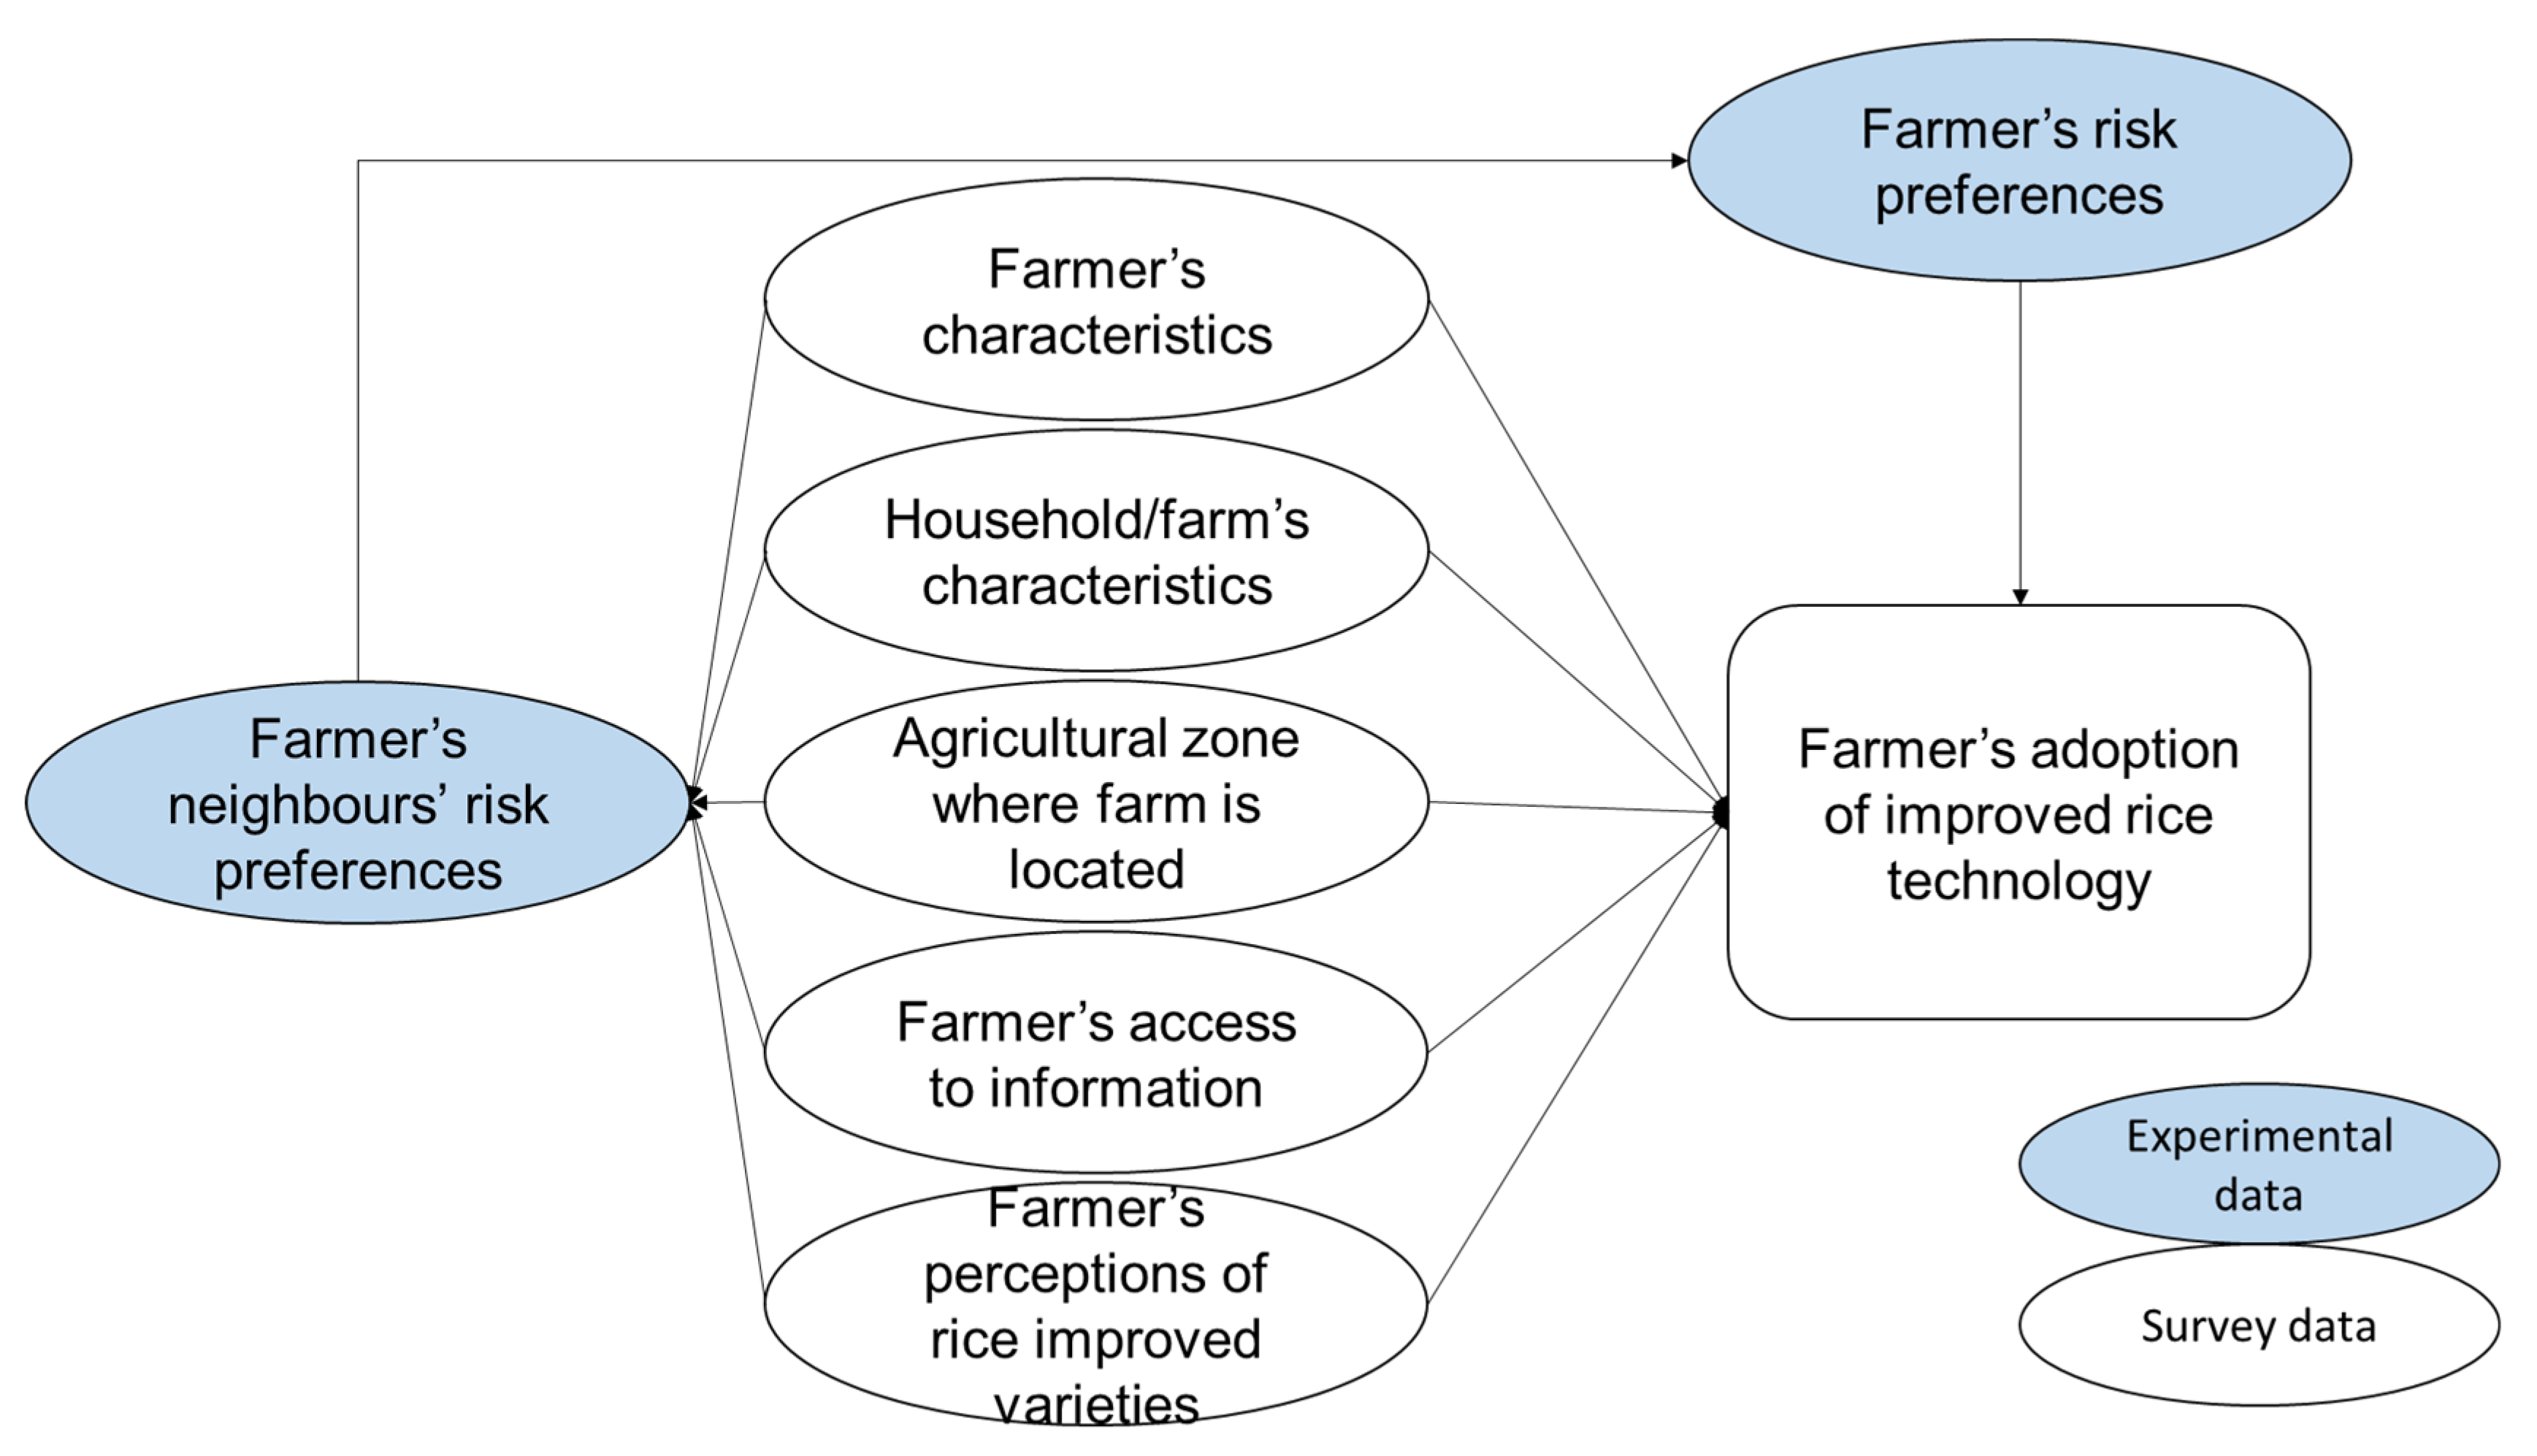
Figure 1.
Conceptual framework for farmer’s adoption of improved rice technology.

Table 1.
Description of the variables used in the adoption decisions model.
| Variables | Definition | Min | Max | Mean | SD |
|---|---|---|---|---|---|
| Adoption | 1 if rice farmer grows HYV, 0 otherwise | 0.00 | 1.00 | 0.09 | |
| Age | Years | 20.00 | 80.00 | 47.00 | 12.50 |
| Education | Years of formal schooling | 0.00 | 16.00 | 4.60 | 4.50 |
| Religion | 1 for Christians, 0 otherwise | 0.00 | 1.00 | 0.56 | |
| Household size | Numbers of current household members | 1.00 | 21.00 | 6.00 | 3.00 |
| Farm size | Size of land cultivated to rice in hectares | 0.20 | 16.00 | 1.90 | 1.50 |
| Sex | 1 if male, 0 otherwise | 0.00 | 1.00 | 0.68 | |
| Married | 1 if married, 0 otherwise | 0.00 | 1.00 | 0.94 | |
| Upland | 1 if upland production system, 0 otherwise | 0.00 | 1.00 | 0.87 | |
| High yield | Perception of importance of high yield | 1.00 | 5.00 | 4.20 | 1.00 |
| Long stem | Perception of importance of long stem | 1.00 | 5.00 | 3.60 | 1.00 |
| Short duration | Perception of importance of short production cycle | 1.00 | 5.00 | 3.80 | 1.00 |
| Good tiller | Perception of importance of good tiller | 1.00 | 5.00 | 3.40 | 1.00 |
| Friends | 1 if rice farmers rely on friends and neighbours for information, 0 otherwise | 0.00 | 1.00 | 0.68 | |
| Extension contact | Number of contact with extension agents per year | 0.00 | 7.00 | 2.30 | 1.00 |
| Ikenne | 1 for Ikenne zone, 0 otherwise | 0.00 | 1.00 | 0.26 | |
| Ilaro | 1 for Ilaro zone, 0 otherwise | 0.00 | 1.00 | 0.19 | |
| Ijebu-Ode | 1 for Ijebu-Ode zone, 0 otherwise. | 0.00 | 1.00 | 0.27 | |
| Abeokuta | Reference zone | 0.00 | 1.00 | 0.28 | |
| SG1 | Small gain one probability index | 0.10 | 1.00 | 0.80 | 0.15 |
| SG2 | Small gain two probability index | 0.10 | 1.00 | 0.60 | 0.13 |
| LG1 | Large gain one probability index | 0.10 | 1.00 | 0.70 | 0.15 |
| LG2 | Large gain two probability index | 0.10 | 1.00 | 0.60 | 0.16 |
Note: perception questions are measured on 5 scales ranging from not at all important (1), somewhat important (2), important (3), very important (4), and extremely important (5). Source: Data Analysis, 2017; Reprinted with permission from Ambali et al 2021
Table 2.
Effect of risk preference on adoption decisions.
| Variables | SG1 | SG2 | LG1 | LG2 |
|---|---|---|---|---|
| Risk Preference | ||||
| Risk avoidance | −7.6850 *** (0.6742) | −8.3689 *** (0.6266) | −7.9113 *** (0.5321) | −9.0092 *** (0.6605) |
| Farmers Specific Factors | ||||
| Age | −0.0015 (0.0096) | −0.0059 (0.0065) | −0.0076 (0.0072) | −0.0001 (0.0072) |
| Education | 0.0617 (0.0432) | 0.0167 (0.0328) | 0.0204 (0.0292) | 0.0389 (0.0277) |
| Christian | −0.0746 (0.1685) | 0.0159 (0.1477) | −0.4742 *** (0.1468) | 0.0152 (0.1568) |
| Household size | −0.0215 (0.0378) | 0.0013 (0.0303) | −0.0098 (0.0308) | −0.0253 (0.0396) |
| Farm size | 0.0154 (0.0854) | 0.0537 (0.0649) | −0.0317 (0.0560) | 0.0527 (0.0702) |
| Male | −0.7156 * (0.3951) | −0.4016 (0.2916) | −0.4286 * (0.2588) | −0.4332 (0.2734) |
| Married | 0.1114 (0.4254) | −0.0237 (0.3691) | 0.3880 (0.4050) | 0.1929 (0.3540) |
| Upland rice | 0.0700 (0.2838) | 0.2017 (0.2531) | −0.1145 (0.3192) | 0.0170 (0.3305) |
| Agricultural Zones | ||||
| Ikenne | −0.6433 (0.8489) | −0.5309 (0.7992) | −0.3852 (0.6478) | −0.6016 (0.6505) |
| Ijebu-Ode | −0.0702 (0.5618) | −0.3789 (0.4570) | −0.2292 (0.3383) | −0.6240 ** (0.2923) |
| Ilaro | 0.9992 *** (0.2994) | 0.6164 *** (0.2256) | 1.0188 *** (0.2461) | 1.7128 *** (0.2237) |
| Access to information | ||||
| Extension contact | 0.0360 (0.0277) | −0.0098 (0.0244) | 0.0593 *** (0.0221) | 0.0265 (0.0249) |
| Friends | −0.2479 (0.2298) | −0.2209 (0.1869) | 0.1403 (0.1752) | 0.2188 (0.1805) |
| Perceptions about Technology attributes | ||||
| High yield | 0.3092 *** (0.1119) | 0.1341 (0.0973) | 0.2633 ** (0.1095) | 0.0714 (0.1056) |
| Long stem | −0.1595 (0.1562) | −0.1697 (0.1213) | −0.1347 (0.1230) | 0.0572 (0.1211) |
| Short duration | −0.4060 (0.2685) | −0.2981 (0.2051) | −0.2999 * (0.1571) | −0.5558 *** (0.1564) |
| Good tiller | −0.3940 * (0.2315) | −0.2468 (0.1832) | −0.2823 * (0.1510) | −0.3040 ** (0.1497) |
| Constant | 6.7752 *** (1.8807) | 6.5916 *** (1.6713) | 6.5119 *** (1.4339) | 6.0872 *** (1.5361) |
| Tests of Correlation of Errors | ||||
| Corr. (SE2 and SE1) | 0.9626 *** | 0.9877 ** | 0.9878 *** | 0.9922 *** |
| Sigma (SE1) | 0.1275 *** | 0.1219 *** | 0.1313 *** | 0.1281 *** |
Diagnostic statistics: SG1: Wald test of exogeneity (correlation = 0): Chi squares (1) = 10.60, Prob > chi2 = 0.0011. Wald Chi2 (18) = 219.59, Prob > chi2 = 0.000. SG2: Wald test of exogeneity (correlation = 0): Chi squares (1) = 12.00, Prob > chi2 = 0.0003, Wald Chi2 (18) = 258.41, Prob > chi2 = 0.0000. LG1: Wald test of exogeneity (correlation = 0): Chi squares (1) = 18.60, Prob > chi2 = 0.0000. Wald Chi2 (18) = 375.74, Prob > chi2 = 0.0000. LG2: Wald test of exogeneity (correlation = 0): Chi squares (1) = 21.42, Prob > chi2 = 0.0000. Wald Chi2 (18) = 386.02, Prob > Chi2 = 0.0000. Note: SE2 = standard error of the adoption model, SE1 = standard error of the risk model, Sigma = standard error of risk model, SE = Standard Error Figures in the parentheses are the SE. *, **, *** implies coefficients are significant at 10%, 5%, and 1%, respectively. Number of Observations (N = 328). Source: Data Analysis, 2017.
Publisher’s Note: MDPI stays neutral with regard to jurisdictional claims in published maps and institutional affiliations. |
© 2021 by the authors. Licensee MDPI, Basel, Switzerland. This article is an open access article distributed under the terms and conditions of the Creative Commons Attribution (CC BY) license (https://creativecommons.org/licenses/by/4.0/).
Share and Cite
MDPI and ACS Style
Ambali, O.I.; Areal, F.J.; Georgantzis, N. Improved Rice Technology Adoption: The Role of Spatially-Dependent Risk Preference. Agriculture 2021, 11, 691. https://0-doi-org.brum.beds.ac.uk/10.3390/agriculture11080691
AMA Style
Ambali OI, Areal FJ, Georgantzis N. Improved Rice Technology Adoption: The Role of Spatially-Dependent Risk Preference. Agriculture. 2021; 11(8):691. https://0-doi-org.brum.beds.ac.uk/10.3390/agriculture11080691
Chicago/Turabian StyleAmbali, Omotuyole Isiaka, Francisco Jose Areal, and Nikolaos Georgantzis. 2021. "Improved Rice Technology Adoption: The Role of Spatially-Dependent Risk Preference" Agriculture 11, no. 8: 691. https://0-doi-org.brum.beds.ac.uk/10.3390/agriculture11080691
Note that from the first issue of 2016, this journal uses article numbers instead of page numbers. See further details here.