Article

Morphological and Physiological Responses of Brassica chinensis on Different Far-Red (FR) Light Treatments Using Internet-of-Things (IoT) Technology

by
Ahmad Nizar Harun
1,
Robiah Ahmad
2,*,
Norliza Mohamed
2,
Abd Rahman Abdul Rahim
2 and
Hazilah Mad Kaidi
2
1
MIMOS Berhad, Jalan Inovasi 3, Taman Teknologi Malaysia, Kuala Lumpur 57000, Malaysia
2
Razak Faculty of Technology and Informatic, Universiti Teknologi Malaysia, Jalan Sultan Yahya Petra, Kuala Lumpur 54100, Malaysia
*
Author to whom correspondence should be addressed.
Submission received: 7 June 2021 / Revised: 23 July 2021 / Accepted: 23 July 2021 / Published: 31 July 2021
(This article belongs to the Special Issue Internet of Things (IoT) for Precision Agriculture Practices)

Abstract

:
Advanced technology in agriculture has enabled the manipulation of the artificial light spectrum in plant development such as improving yield and plant growth. Light manipulation using light-emitting diodes or LEDs can inhibit, delay, or even promote flowering. Some studies have shown that far-red (FR) light can stop flowering, but studies have not fully explored the best method involving intensity and duration to induce plant growth. This paper presents results on LED light manipulation techniques, particularly FR light, on plant flowering control and plant elongation. The light manipulation technique on the combination of colors, photoperiods, and intensities proved that it can stop flowering, and stimulate and control the growth of plants during cultivation. The system was monitored using an Internet-of-Things (IoT) remote monitoring system, and it performed data mining. The results showed that plants that were grown under artificial sunlight (T5) and normal light (T1) treatments were superior compared to others. The FR light delayed flowering until 50 days of planting and accelerated the plant growth and increased the fresh weight by 126%. The experiment showed that a high variable intensity at 300 µmol m−1s−1 showed a great performance and produced the largest leaf area of 1517.0 cm2 and the highest fresh weight of 492.92 g. This study provides new insights to the researchers and the farming community on artificial light systems in improving plant factory production efficiency and in determining the best plant cultivation approach to create a stronger indoor farming management plant.

1. Introduction

Artificial light is widely used in the controlled-environment agriculture (CEA) such as in growth chambers, greenhouses, and indoor and vertical farming due to its advantages in decreasing energy usage while producing high-quality plants and improved yields [1,2]. In addition, well-designed indoor agriculture systems using hydroponics will reduce the use of water and nutrients, pesticides, and insecticides. In controlled environments such as plant factories, a variety of ornamentals and vegetables are now commercially grown. Brassica chinensis, a leafy vegetable that belongs to the mustard family, provides important nutrition to humans. Plant growth and nutrition are affected by many factors such as environmental agronomic factors [3].
The use of light-emitting diodes, or LEDs, as a source of artificial light helps researchers investigate the impacts of light spectrum, light intensity, and the photoperiod on plant growth and morphology in CEA [4,5,6,7]. As a result, a lot of useful data are being developed and can be expanded in the future for plant management systems. Therefore, implementing an information and communication technology infrastructure is now a must, due to the cheaper cost of data processing, storage, and transmission. To achieve smart agriculture, information and communication technologies have been integrated with data analytics, deep learning, and the Internet of Things [8,9,10,11].
Red (R) and blue (B) LEDs are widely used as artificial light in indoor farming; for example, the combinations of 8R:1B and 6R:3B LEDs were found to be more effective than white LED light in improving the development and quality of Chinese kale flower stems [12]. Blue and red light irradiations of the light spectrum were discovered to have an effect on the flower coloration in cherry blossom, where blue light of 450 nm was regarded to be most effective [13]. In addition, strawberry plants’ photosynthetic activity also increased when they were exposed to blue light [14]. More research will be useful in validating the important and ideal wavelength combinations for essential plant species and phytochemicals, including wavelengths such as ultraviolet (UV), yellow (Y), and green (G). A deeper understanding of LED parameters such as spectrum, photoperiod, and light intensities is essential. For higher-quality horticultural goods, a better understanding of spectral combinations and other cultivation conditions (e.g., temperature and nutrition) is helpful [15,16,17,18,19].
Plants react to light via photoreceptors, which are made up of a protein that is covalently bonded to a light-absorbing pigment called a chromophore. Phytochromes are chromoproteins that come in two photo-interconvertible forms: the absorption peaks in red (R, 666 nm) are called Pr, and far-red light (FR, 730 nm) is called Pfr [20]. The distinctive property of phytochromes is crucial in detecting canopy shade and anticipating competition from neighboring plants, which would affect the plant’s growth direction [21]. In many plant species, the photoperiod is a day-length-dependent seasonal variation in physiological or developmental activity, such as flowering. In the hydroponic cultivation of Polygonum tinctorium, the blue light greatly improved the flowering six times [22] compared to white light treatment.
LEDs have a narrow-band spectrum that does not imitate natural daylight in the continuous photosynthetic active radiation (PAR) region between 400 and 700 nm. Most LEDs used in indoor farming emit very little light in the FR, which is normally the region between 710 and 850 nm [23]. This will give a larger ratio of R:FR than that of natural daylight. More FR light treatment on the morphology of the plant is still being researched and, therefore, there is a need to investigate the effect of supplementing the FR-enriched LEDs with other spectrums on plants’ growth and development.
On the flowering characteristics using different combinations of blue, red, and/or FR LEDs, low-intensity blue light has no effect on flowering when paired with red and FR light for night interruption (NI) illumination [24]. Blue radiation reduces the effects of the red-to-FR ratio on extension growth, but not on flowering [25]. The use of FR film and/or red light did not delay flowering by more than 1–3 days under inductive conditions (photoperiods >16 h), but it did reduce flower counts. When the natural irradiance was poor, and particularly in the presence of FR light, blue light encouraged flowering [26]. Artificial LED light with a R:FR ratio greater than that of sunlight has an adverse impact on the growth and early fruit production of young tomato plants [23]. The observed decrease in plant dry mass and decreases in total leaf areas were due to a lack of FR and decrease in whole plant light absorption. When compared to the control, the supplemental FR light dramatically increased plant elongation, resulting in longer plants in tomato plants [27].
The FR treatment duration in the plant factory to achieve simultaneous plant elongation and flowering remains unclear. Even though many studies have indicated that the far-red would stop flowering, studies on the best method or practice involving intensity and duration to induce plant growth have been performed. Various experiments have been conducted to understand and find the best results for plant manipulation techniques. The main objective of this research was to investigate how different LED light treatments affect physiological and morphological responses and control the flowering and elongation of Brassica chinensis in a controlled environment remotely using Internet-of-Things (IoT) technology. The data provided new insights for researchers and the farming community regarding the relationship of artificial light manipulation with plant growth and developments for the common Asian Brassica chinensis.

2. Materials and Methods

2.1. Plant Growth Condition

The Brassica chinensis plants were grown at a constant temperature of 22 °C, relative humidity of 60%, CO2 concentration of 420 ppm, and a photon flux density (PFD) of around 100 µmol m−2 s−1. The seeds were germinated in 3 cm × 3 cm sponge cubes filled with water and were maintained under dark conditions for 3 days. After that, the plants were placed under a rack and treated with a 16:4 ratio of red and blue (RB) LEDs in 12 h daylight. They were transplanted into a container with eight holes (55.5 cm × 42 cm × 13 cm) filled with complete nutrient solution [28] after 7 days of sowing. The fertilizer formulation was created by a researcher from the Malaysian Agricultural Research and Development Institute or MARDI. It was specially formulated for plants that were grown in a lower-temperature environment than a regular sunlight condition. The nutritional solution was replaced and adjusted to a pH of 6 and an electrical conductivity of 2.5 mS cm−1 every two weeks.

2.2. System Design and Performance Evaluation

The sensors used in the systems were to measure temperature and humidity, CO2, and light radiation. The sensor monitoring device and data logger PC software were part of the total system, as illustrated in Figure 1. Every 10 s, sensor data were collected and stored in a software configuration file. Initially, the design started with a careful selection and evaluation of microprocessors for the IoT board design in terms of their speed, RTC, power consumption, and system voltage. as summarized in Table 1 using the same characteristics explained in [29]. They were called the microcontroller board System I and microcontroller board System II using different chipsets, and both are illustrated in Figure 2. System I had the capability of using a radio module socket to adopt numerous radios, but it did not have the sleep mode function, so it continued to train at 2 A at peak and 5 mA at standby compared to System II, which used a single chip set solution (Wi-Fi with microcontroller) and operated on a duty cycle basis. Therefore, System II consumed less current at 30 µA sleep and 300 mA during peak operation. Most of the IoT devices or nodes are powered by batteries. The lowest current consumption will ensure a longer lifetime and reduce battery size. Both systems were evaluated in a day using a high-end multimeter every hour, 30 min, and minute of transmission. Table 2 shows the average current consumption for the two systems.
The next step was to investigate the 2.4 GHz signal blockage or interference caused by nearby elements such as concrete walls and buildings. Three frequencies in the 2.4 GHz frequency bands were selected: 2.40 GHz, 2.45 GHz, and 2.48 GHz, and results from the tests were plotted as a radiation pattern in degree versus RF power (dBm), as shown in Figure 3. The RF signals were severely affected between rotation angles of −155° and +95° at 2.40 GHz, as shown in Figure 3a, which corresponded to the placement of the concrete wall. The RF signals were minimally damaged at 2.45 GHz but still not good between rotation angles of −150° and +135°, as shown in Figure 3b. Meanwhile, the RF signals were slightly affected between angles of −160° and +150° at 2.48 GHz. When there was a concrete block nearby, the high-frequency signals were interrupted, and the RF power registered by the receiver was marginally lowered, according to the findings. Prior to the installation of IoT nodes, precautions were taken to avoid signal degradation and data loss. The control and feedback of the system are shown in Figure 4, whereas the climate control system block diagram is shown in Figure 5. In addition, a similar concept was introduced as an alternative application using wireless communication to activate the actuator and relay remotely at the range of 70 m from a local gateway or PC terminal, as shown in Figure 6.

2.3. LED Light Treatment

Plants were harvested after 30 days of transplanting. The experiments were divided into three parts. Table 3 shows the summary of the experiments for part 1. In this experiment, four different photoperiod investigations were carried out and the results have been reported [7]. The control experiment used 12 h (12 h) light and 12 h (12 h) dark (normal light), which is commonly employed in most companies today. The harvesting period was similar to that of traditional outdoor farming, which lasted around 30 days.
For part 2, the aim of the experiment was to study the effects of FR lighting treatment to control and delay the flowering process during planting time. At 40 days following transplantation, the plants were harvested. Table 4 shows a summary of the stop flowering control experiment:
  • Pulse far-red treatment (730 nm) with a duration of every 1 h during daylight and harvested after 40 days of sowing.
  • Pulse far-red treatment (730 nm) with a duration of every 1 h during daylight and harvested after 50 days of sowing. The intention was to reaffirm the effect of delaying the flowering during Phase 5 for 10 days of extra time.
  • Night interruption for far-red treatment (730 nm), which was from 7:00 p.m. to 7:00 a.m. (12 h duration).
  • Continuous far-red treatment (730 nm) for 24 h.
For part 3, the goal of the experiment was to look into the effects of different intensities of treatment on the plant elongation (Table 5). The intention of this experiment was to understand the behavior or response of the plant to adopt strong LED light at a later stage rather than having a constantly higher intensity at all stages.
  • Gradual increase in intensity based on plant age from 50 to 100 μmol m−2s−1 in 12 h dark and 12 h light duration.
  • Gradual increase in intensity based on plant age from 50 to 100 μmol m−2s−1 in 1 h dark and 1 h light duration.

2.4. Data Equipment and Measurement

A Portable Photosynthesis System Li-6400XT (LICOR, USA) was used to measure net photosynthesis (μmol CO2 m−2s−1), leaf stomata conductance (mol H2O m−2s−1), and transpiration rate (mol H2O m−2s−1). The instantaneous water-use efficiency (WUE) was computed as a ratio between photosynthetic rate and transpiration rate (μmol CO2/μmol H2O) to measure the trade-off between CO2 uptake and water loss.

2.5. Statistical Analysis

Statistical analysis was performed using Windows 24.0 Statistical Product and Service Solutions (SPSS) software. An analysis of variance (ANOVA) was used to determine the significance of all measurements, followed by a least significant difference (LSD) test at the 0.05 level.

3. Results and Discussion

3.1. Plant Flowering Control Experiment

3.1.1. Morphological Responses

Table 6 and Table 7 and Figure 7 demonstrate the results of the stop flowering control of Brassica chinensis impacted by different light treatments. Throughout the study period, the data that were collected were leaf area (LA), dry weight (DW), fresh weight (FW), and moisture content (MC). The plants under treatment T7 had the maximum and the highest FW, DW, and LA values compared to the others. On the other hand, for the stem height (SH) and number of leaves (NOL) of Brassica chinensis, plants that were treated under T9 had a better result, with SH and NOL growing weekly. Plants under the T1 treatment yielded the highest moisture content of 99.15% based on six repetitions.

3.1.2. Physiological Responses

Brassica chinensis physiological responses to various treatments are shown in Figure 8.
a.
Gas exchange response
i.
Photosynthesis rate (A)
In week 1, plants growing under T1 conditions produced higher values of A of 8.33 µmol CO2 m−2 s−1. In comparison to other light treatments, plants exposed to T7 produced higher values and increased in week 2 (6.76 µmol CO2 m−2 s−1) and week 3 (10.48 µmol CO2 m−2 s−1). There were substantial (p < 0.05) differences between the treatments in leaf A impacted by photoperiod light treatments.
ii.
Transpiration rate (E)
Plants grown under T1 conditions produced a greater amount of E in week 1 at 4.28 mol H2O m−2 s−1 with a similar response for results on A. In comparison to other light treatments, plants exposed to T8 produced higher values in week 2 at 5.48 mol H2O m−2 s−1 and T9 had greater values in week 3 than the other light treatments, with 10.01 mol H2O m−2 s−1 compared to other light treatments. When comparing the effects of light treatments on leaf E, there were significant (p < 0.05) differences between the treatments.
iii.
Leaf stomata conductance (gs)
In week 1, plants growing under T1 conditions produced higher gs values of 0.45 mol H2O m−2 s−1. In comparison to other light treatments, plants exposed to T7 had higher values in week 2 (0.55 mol H2O m−2 s−1) and T9 had higher values in week 3 (0.70 mol H2O m−2 s−1). When comparing the effects of light treatments on leaf gs, there were significant (p < 0.05) differences between the treatments.
iv.
Water-use efficiency
In comparison to T6, T7, T8, and T9, plants grown under T1 conditions produced greater WUE values every week at 2.74 µmol CO2/µmol H2O (week 1), 5.38 µmol CO2/µmol H2O (week 2), and 5.38 µmol CO2/µmol H2O (week 3). When the WUE was altered by light treatments, there were significant (p < 0.05) variations between the treatments when compared to one another.
b.
Chlorophyll content
The chlorophyll content of Brassica chinensis was altered by five photoperiod light treatments and the optical density was measured at 663 nm for chlorophyll a and at 645 nm for chlorophyll b. The treatment means for T7 were highest with chl a, chl b, and total chl values of 7.38 mg g−1, 6.17 mg g−1, and 13.55 mg g−1 compared to T1, T6, T8, and T9. The results showed that plants grown under both treatments had significant differences (p < 0.05).

3.1.3. Stop Flowering Experiment

There were two different plant harvesting times for the experiment, which were at 40 days and 50 days after transplanting during the execution of the stop flowering experiment. There was no presence of flowers for both harvesting periods. Traditionally, Brassica chinensis were harvested 30–32 days after being transferred, but in this case, the ultimate maturity level exceeded the day and showed no flowering, indicating that by adding far-red and white colors, the blossoming time will be controlled and stopped using a mixture of red and blue. A summary of the results in the morphological reaction of Brassica chinensis from the stop flowering experiment that encompassed plants grown under T1, T6, T7, T8, and T9 are shown in Table 7. The high mean value of plants’ FW was under the FR pulse treatment and pulse (T7), which was at 530.23 g compared to normal light (T1) at 390.8 g. The same high values were noted for plants under T7 for LA and DW.

3.2. Plant Elongation Experiment

As discussed earlier (Table 5), the process experiments were divided into two phases, namely Phase 9 (normal light versus low variable intensity) and Phase 10 (normal light versus high variable intensity). Brassica chinensis were treated under three different light treatments, which were T1 (normal light), T10 (low variable intensity), and T11 (high variable intensity).

3.2.1. Morphological Responses

Table 8 and Figure 9 indicate the effects of three light treatments on the elongation of Brassica chinensis. Throughout the study period, data on leaf area (LA), dry weight (DW), fresh weight (FW), and moisture content (MC) were collected from plants growing under various light treatments. The plants’ FW for T1, T0, and T11 showed significant differences with the highest fresh weight of 492.92 g under T11. The data for DW revealed a substantial difference for all treatments with T11 having the largest. Plants produced under T11 had a greater LA value than plants cultivated under T1 or T10. In addition, the Brassica chinensis plants had a normal appearance of stem height (SH) and number of leaves (NOL), as shown in Figure 10. The plants treated under T11 also showed higher results in SH and NOL. Plants under T1 yielded the highest MC of 99.15% based on six repetitions.

3.2.2. Physiological Responses

a.
Gas exchange response
i.
Leaf photosynthesis rate (A)
As demonstrated in Figure 10, plants grown under T1 conditions had higher values of A in week 1 (8.33 µmol CO2 m−2 s−1) and week 3 (5.15 µmol CO2 m−2 s−1), while plants cultivated under T11 produced more CO2 at week 3 (8.17 µmol CO2 m−2 s−1) than plants cultivated under other light treatments. When exposed to various light treatments, there were significant (p < 0.05) differences for leaf A between the treatments when compared with another.
ii.
Leaf transpiration rate (E)
Plants grown under T11 produced higher values of E in week 1 at 4.40 mol H2O m−2 s−1 and week 2 at 5.13 mol H2O m−2 s−1, while in week 3, plants grown under T10 gave the highest value at 5.07 mol H2O m−2 s−1. When comparing the effects of different light treatments on Leaf E, it was discovered that there were significant (p < 0.05) differences between the treatments.
iii.
Stomata conductance (gs)
The highest value of gs in week 1 was 4.28 mol H2O m−2 s−1 from plants grown under T1, while plants grown under T11 produced higher values in week 2 (0.37 mol H2O m−2 s−1) and week 3 (0.21 mol H2O m−2 s−1) compared to others. When comparing the effects of different light treatments on leaf gs, there were significant (p < 0.05) variations between the treatments.
iv.
Water use efficiency
In comparison to T10 and T11, plants grown under T1 conditions produced higher weekly values of 2.74 µmol CO2/µmol H2O (week 1), 5.38 µmol CO2/µmol H2O (week 2), and 5.38 µmol CO2/µmol H2O (week 3). When comparing the effects of different light treatments on WUE, there were significant (p < 0.05) variations between treatments.
b.
Chlorophyll content
The chlorophyll content of Brassica chinensis was affected by three photoperiod light treatments. For all treatments, optical density was measured at 663 nm for chlorophyll a and at 645 nm for chlorophyll b. The treatment means for T1 were highest with chl a, chl b, and total chl values of 6.93 mg g−1, 5.94 mg g−1, and 12.87 mg g−1, followed by T10 and T11. The results showed that the differences of plants grown under both treatments were significant (p < 0.05) when compared to each other.
The results in Table 9 show that under a high variable intensity at 300 µmol m−1s−1, the plant FW under T11 was highest compared to other light treatments at 492.92 g. Under normal lighting (T1), the average value percentage of MC was 99.15%. Under a high variable intensity at 300 µmol m−1s−1, the value of LA was highest, with an average value of 1517.0 cm2. The sample plant treated under T11 is as shown in Figure 11.

4. Discussion

4.1. Controlled-Environment Agriculture

The traditional ways to monitor a greenhouse’s environmental conditions and plant growth take a long time and lack automation and synchronization. To address these issues, an Internet-of-Things (IoT)-based device was developed that simultaneously monitors the environmental factors, as well as the growth status. The IoT system [30] has shown how to make a significant contribution to updating floral farming strategies in the future. Our results indicate that the system allows growers to accurately manage environmental factors such as light, temperature, humidity, and CO2, in addition to producing better yields, in-line with the studies by [12,31].
The use of light-emitting diodes (LEDs) as the light source allows for the manipulation of the light spectrum to induce desirable plant characteristics such as compact growth, and early or late flowering. The majority of plant LED lighting research has focused on blue (400 to 500 nm) and red (600 to 700 nm) lights [13,32], and our study reported similar results. In general, increasing the intensity of blue light enhances plant pigmentation while suppressing extension development, resulting in plants that are more compact. Additional wavebands, such as green (500 to 600 nm) [33] and far-red (700 to 800 nm) lights [28], have also been reported to have an impact.
The IoT-based plant monitoring device can be easily extended for studying the effects of various conditions, experimental therapies, plant diseases, and fertilizers. As reviewed by Kamilaris et al. [9], the technology has the potential to stimulate even more research and development into smarter farming, addressing the major challenge of producing higher-quality food on a wider scale and in a more sustainable manner, while also maintaining physical ecosystems and conserving natural resources. The long-term quantitative data from the suggested monitoring system can be utilized to perform data mining to find the optimal plant growing technique and develop a more effective greenhouse management plan.

4.2. Far-Red (FR) Treatment for Flowering Control and Plant Elongation

Brassica chinensis are traditionally harvested 30–32 days after transfer. In the experiment, the ultimate maturity level was extended beyond the day and showed no blooming, indicating that combining far-red and other LEDs and manipulating other LED parameters can control and stop the flowering period. When used at low irradiances, LEDs may be applied to induce photomorphogenic responses or monitor flowering [34]. In this study, the far-red lighting system was shown to delay flowering until 50 days of planting.
Our study has demonstrated that the intensity, duration, and quality of light have an impact on plant responses, in line with [35] and other researchers explained below. When the natural photoperiod is only a few hours long, LED lights have been utilized to facilitate the flowering of a diverse range of ornamental LDP grown in greenhouses. According to [19], LDP flowering is more susceptible to R + FR than B radiation is. Low B photon flux densities are viewed as a long day whether provided as a day extension (DE) or night interruption (NI). B radiation in an NI or DE occurs when the photon flux concentration is sufficiently high and produces a long day, which accelerates the flowering of LDPs. To improve Cyclamen development and flowering while reducing heating and electricity expenditures during winter cultivation, night interruption (NI) along with RB light is advised [36].

5. Conclusions

The results for part 2 clearly demonstrated that leaves for plants under pulse light for 50 days expanded more based on the LA of the plants. Even though the LA results were better under pulse far-red for 50 days, the results showed a higher mean average value for SH and NOL under CL and proved that adding the FR CL variable intensities (100 µmol m−1s−1) to a mixture of RB lights treatment did not interfere with the normal growth of plants, and will not only control and stop flowering, but also stimulate the morphological response of the plants for better growth. The stop flowering method under the LED plant manipulation technique can be used under special conditions when the plant factory has a need to stop flowering due to pricing issues or for production planning purposes. In general, inducing far-red will help to delay the plants for more than 50 days of sowing, but in terms of cost performance per cycle, it should always be the priority when deciding any approaches.
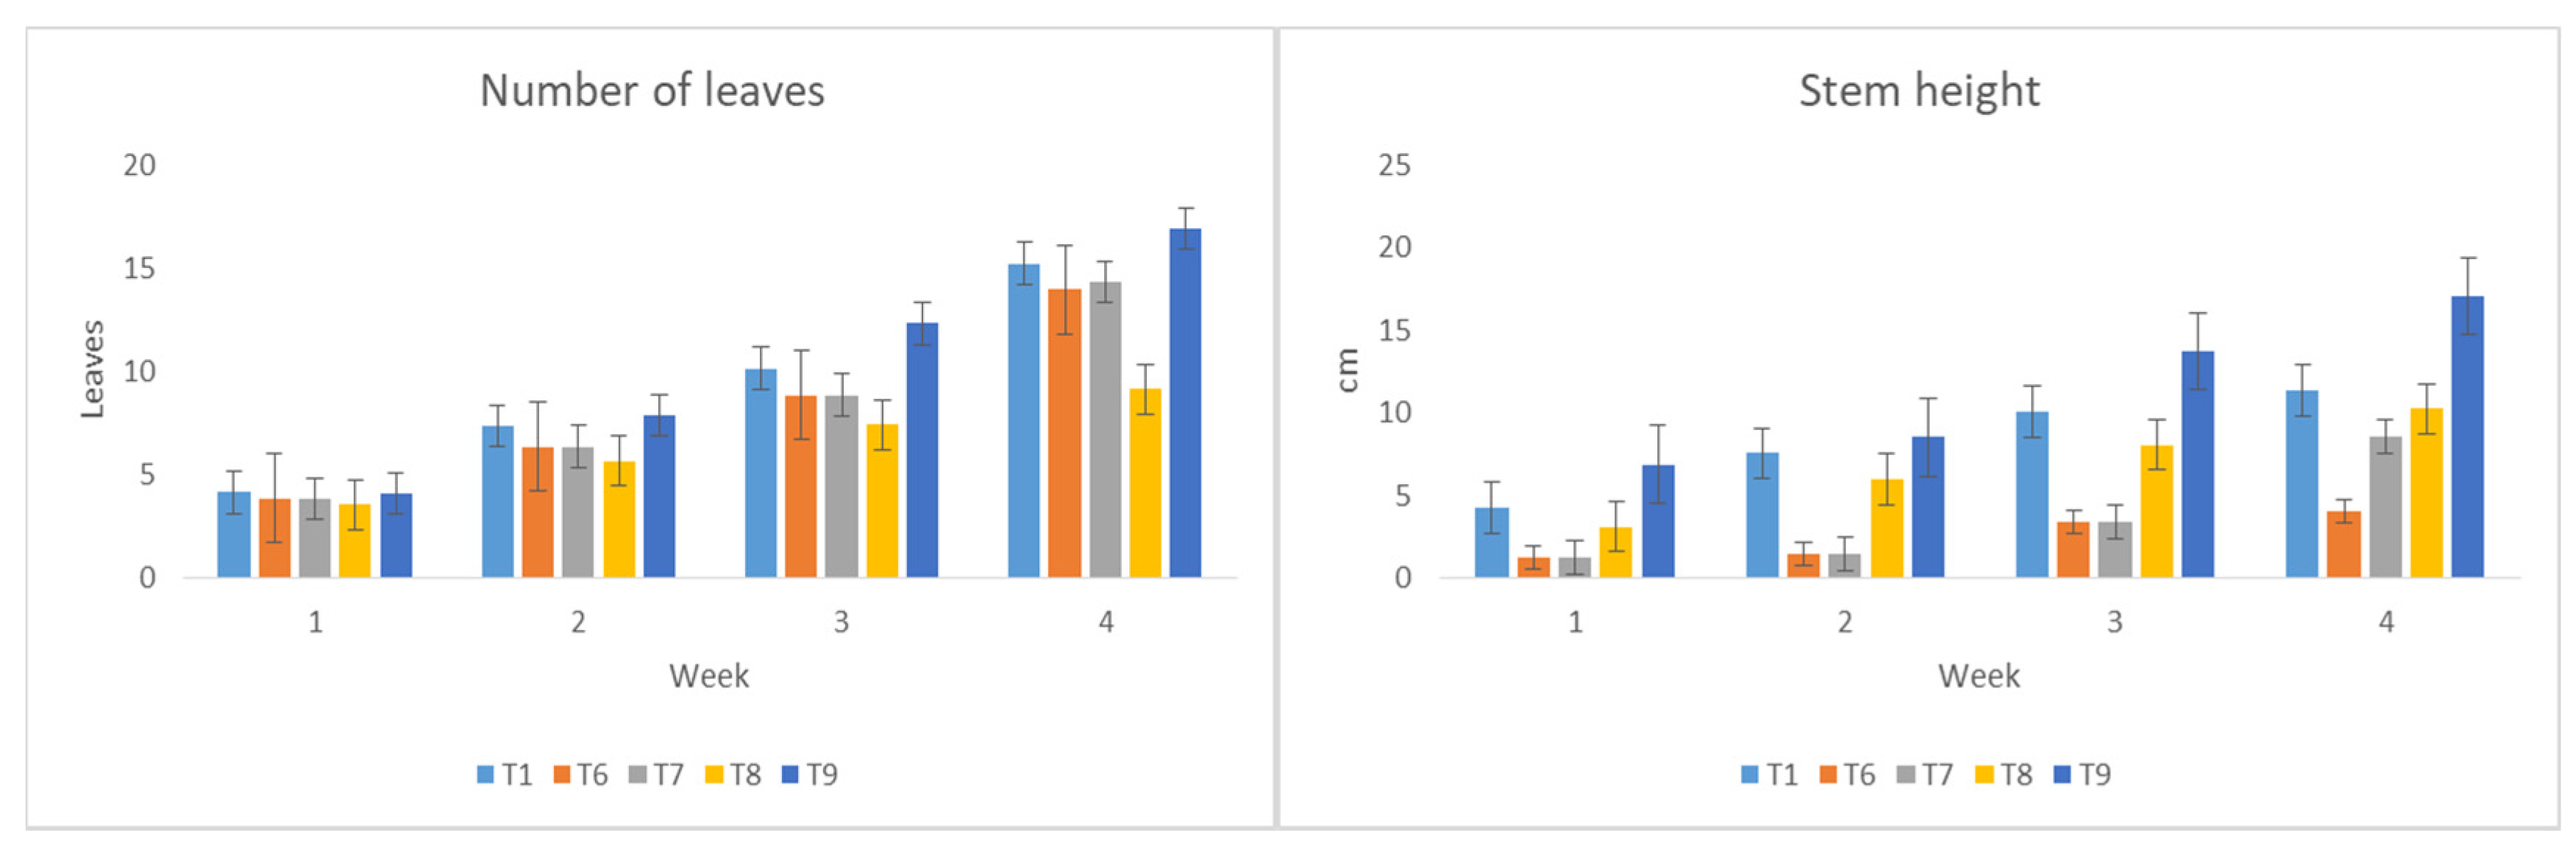
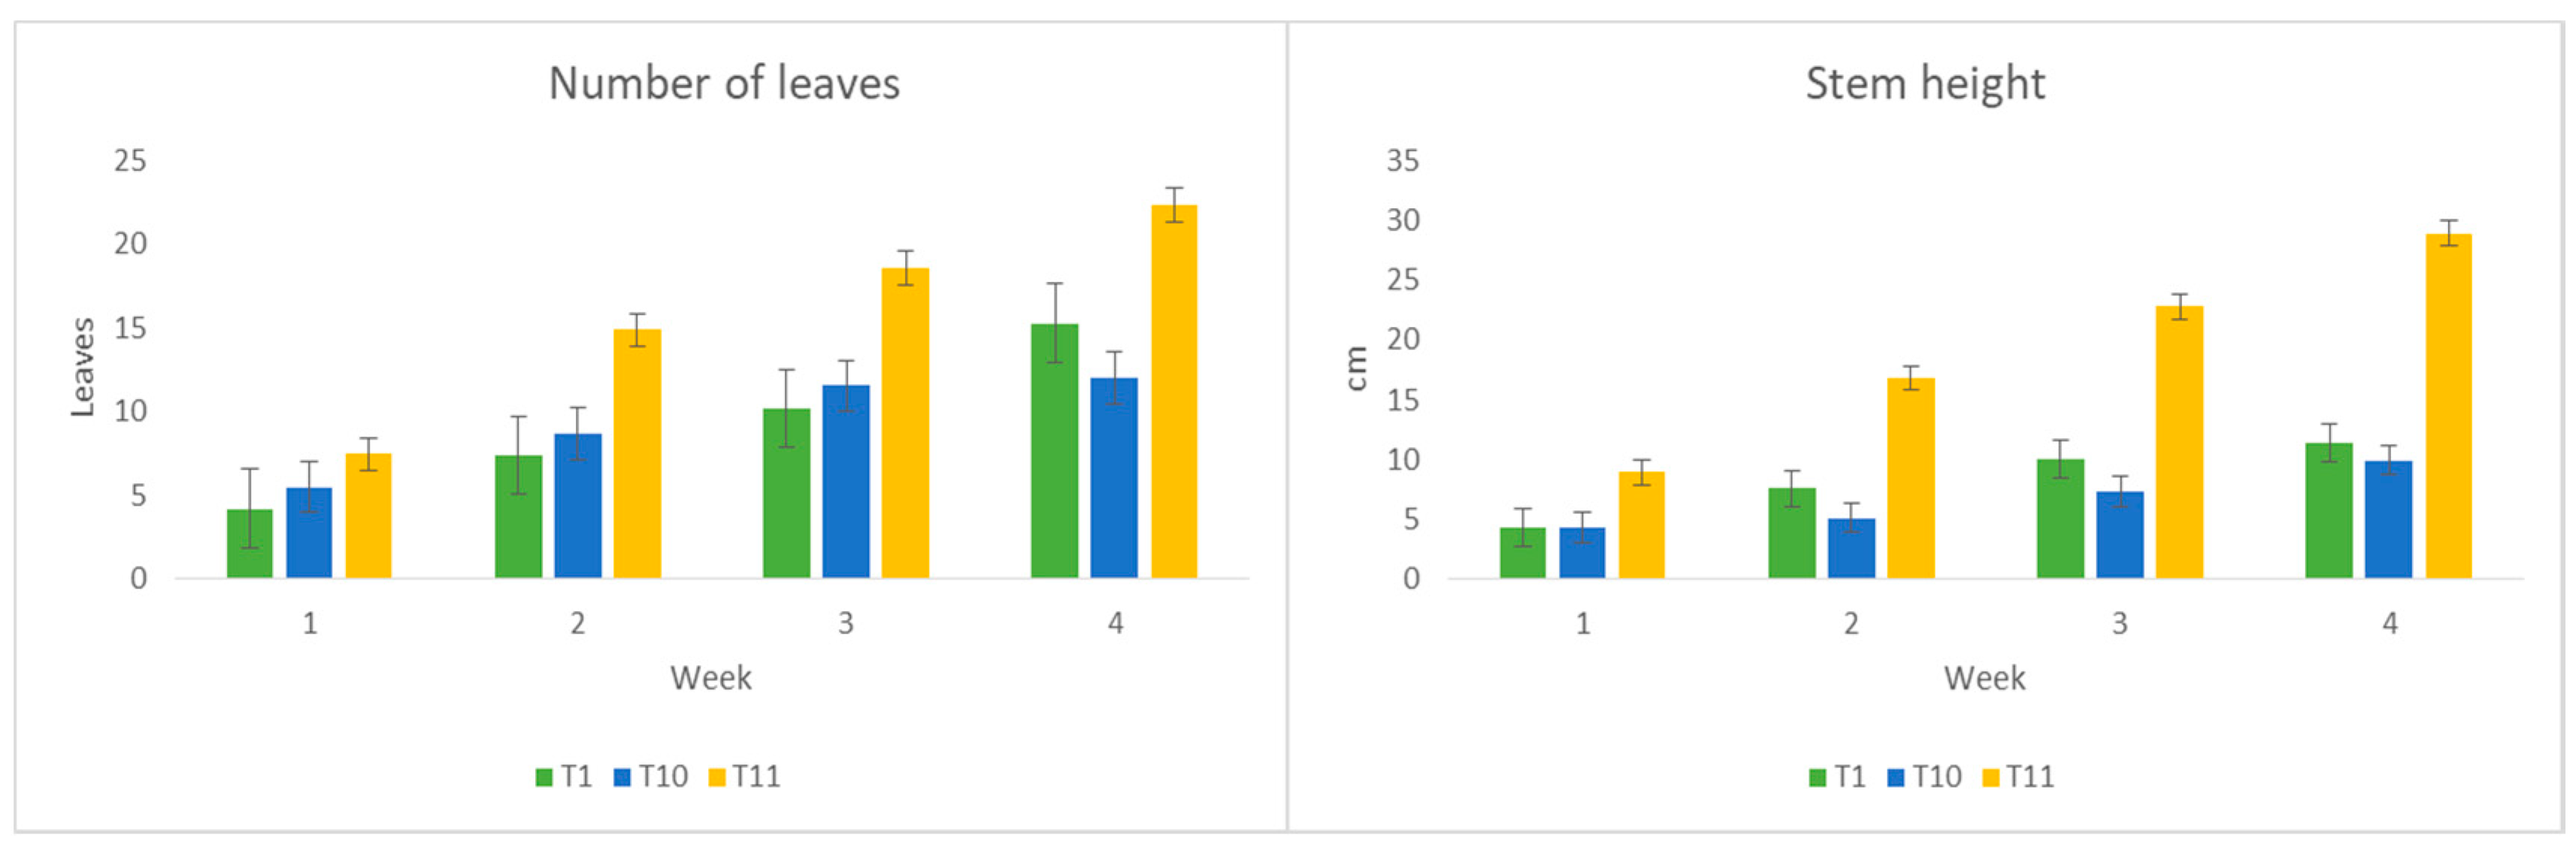
The experiment in part 3 was introduced to understand plant behavior and response while introducing a method to increase mortality for the early adoption of LED lighting. The low light intensity had to be adequate for the plants to grow and later with very high intensity to stimulate growth. The experiment showed that high variable intensity at 300 µmol m−1s−1 showed a great performance and produced a large leaf area with the highest fresh weight. It also had the highest stem height and number of leaves compared to other experiments.
The LED plant manipulation techniques using the developed IoT system were discovered to be the best option to stimulate growth and improve yield. The study also indicated that the circadian clock had no influence on Brassica chinensis under the continuous lighting (CL) system. The far-red lighting system delayed flowering until 50 days of planting, and the plant elongation study accelerated plant growth and increased the fresh weight by 126%. The IoT-based monitoring system managed to control the system parameters to suit the desired conditions for plant growth. The combination of LED parameters as the artificial light opens new possibilities for utilizing unique light wavelengths in vegetable production for plant factories. Further study is needed to determine the best spectral “recipe” for artificial light plant industrial cultivation.

Author Contributions

Conceptualization, writing—original draft preparation, methodology, investigation, A.N.H.; funding acquisition, project administration, R.A.; supervision, data acquisition, reviewing and editing, R.A., N.M. and A.R.A.R.; software and validation, H.M.K. All authors have read and agreed to the published version of the manuscript.

Funding

This research was funded by UTM Transdisciplinary Research (TDR) Grant No: Q.K130000.3556.05G82, Fundamental Research Grant Scheme No: R.K130000.7840.4F144, and the Ministry of Higher Education Malaysia, Grant University Project (GUP) Tier 1 No: Q.K130000.2540.04H55 Universiti Teknologi Malaysia.

Acknowledgments

We are grateful to the Razak Faculty of Technology and Informatics, Universiti Teknologi Malaysia Kuala Lumpur, for providing space and equipment for the experiment, as well as technical assistance from Elite Scientific Instruments Sdn. Bhd. to accomplish this work using LI-COR Bioscience’s technologies.

Conflicts of Interest

The authors declare no conflict of interest.

References

  1. Bantis, F.; Smirnakou, S.; Ouzounis, T.; Koukounaras, A.; Ntagkas, N.; Radoglou, K. Current status and recent achievements in the field of horticulture with the use of light-emitting diodes (LEDs). Sci. Hortic. 2018, 235, 437–451. [Google Scholar] [CrossRef]
  2. Graamans, L.; Baeza, E.; Dobbelsteen, A.V.D.; Tsafaras, I.; Stanghellini, C. Plant factories versus greenhouses: Comparison of resource use efficiency. Agric. Syst. 2018, 160, 31–43. [Google Scholar] [CrossRef]
  3. Zou, L.; Tan, W.K.; Du, Y.; Lee, H.W.; Liang, X.; Lei, J.; Striegel, L.; Weber, N.; Rychlik, M.; Ong, C.N. Nutritional metabolites in Brassica rapa subsp. chinensis var. parachinensis (choy sum) at three different growth stages: Microgreen, seedling and adult plant. Food Chem. 2021, 357, 129535. [Google Scholar] [CrossRef]
  4. Goto, E. Plant production in a closed plant factory with artificial lighting. Acta Hortic. 2012, 37–49. [Google Scholar] [CrossRef]
  5. Olvera-Gonzalez, E.; Alaniz-Lumbreras, D.; Ivanov-Tsonchev, R.; Villa-Hernández, J.; Olvera, E.; González-Ramírez, E.; Araiza-Esquivel, M.; Torres, V.; Castaño, V. Intelligent lighting system for plant growth and development. Comput. Electron. Agric. 2013, 92, 48–53. [Google Scholar] [CrossRef]
  6. Metallo, R.M.; Kopsell, D.A.; Sams, C.E.; Bumgarner, N. Influence of blue/red vs. white LED light treatments on biomass, shoot morphology, and quality parameters of hydroponically grown kale. Sci. Hortic. 2018, 235, 189–197. [Google Scholar] [CrossRef]
  7. Harun, A.N.; Mohamed, N.; Ahmad, R.; Rahim, A.R.A.; Ani, N.N. Improved Internet of Things (IoT) monitoring system for growth optimization of Brassica chinensis. Comput. Electron. Agric. 2019, 164, 104836. [Google Scholar] [CrossRef]
  8. Jayaraman, P.P.; Yavari, A.; Georgakopoulos, D.; Morshed, A.; Zaslavsky, A. Internet of Things Platform for Smart Farming: Experiences and Lessons Learnt. Sensors 2016, 16, 1884. [Google Scholar] [CrossRef]
  9. Kamilaris, A.; Kartakoullis, A.; Prenafeta-Boldú, F.X. A review on the practice of big data analysis in agriculture. Comput. Electron. Agric. 2017, 143, 23–37. [Google Scholar] [CrossRef]
  10. Muangprathub, J.; Boonnam, N.; Kajornkasirat, S.; Lekbangpong, N.; Wanichsombat, A.; Nillaor, P. IoT and agriculture data analysis for smart farm. Comput. Electron. Agric. 2019, 156, 467–474. [Google Scholar] [CrossRef]
  11. Mehra, M.; Saxena, S.; Sankaranarayanan, S.; Tom, R.J.; Veeramanikandan, M. IoT based hydroponics system using Deep Neural Networks. Comput. Electron. Agric. 2018, 155, 473–486. [Google Scholar] [CrossRef]
  12. Zhang, Y.; Ji, J.; Song, S.; Su, W.; Liu, H. Growth, Nutritional Quality and Health-Promoting Compounds in Chinese Kale Grown under Different Ratios of Red:Blue LED Lights. Agronomy 2020, 10, 1248. [Google Scholar] [CrossRef]
  13. An, S.; Arakawa, O.; Tanaka, N.; Zhang, S.; Kobayashi, M. Effects of blue and red light irradiations on flower colouration in cherry blossom (Prunus × yedoensis ‘Somei-yoshino’). Sci. Hortic. 2020, 263, 109093. [Google Scholar] [CrossRef]
  14. Yoshida, H.; Mizuta, D.; Fukuda, N.; Hikosaka, S.; Goto, E. Effects of varying light quality from single-peak blue and red light-emitting diodes during nursery period on flowering, photosynthesis, growth, and fruit yield of everbearing strawberry. Plant Biotechnol. 2016, 33, 267–276. [Google Scholar] [CrossRef] [PubMed] [Green Version]
  15. Senol, R.; Kilic, S.; Tasdelen, K. Pulse timing control for LED plant growth unit and effects on carnation. Comput. Electron. Agric. 2016, 123, 125–134. [Google Scholar] [CrossRef]
  16. Chen, X.-L.; Yang, Q.-C.; Song, W.-P.; Wang, L.-C.; Guo, W.-Z.; Xue, X.-Z. Growth and nutritional properties of lettuce affected by different alternating intervals of red and blue LED irradiation. Sci. Hortic. 2017, 223, 44–52. [Google Scholar] [CrossRef]
  17. Son, K.-H.; Lee, S.-R.; Oh, M.-M. Comparison of Lettuce Growth under Continuous and Pulsed Irradiation Using Light-Emitting Diodes. Korean J. Hortic. Sci. 2018, 36, 542–551. [Google Scholar] [CrossRef] [Green Version]
  18. Nissim-Levi, A.; Kitron, M.; Nishri, Y.; Ovadia, R.; Forer, I.; Oren-Shamir, M. Effects of blue and red LED lights on growth and flowering of Chrysanthemum morifolium. Sci. Hortic. 2019, 254, 77–83. [Google Scholar] [CrossRef]
  19. Lopez, R.G.; Meng, Q.; Runkle, E.S. Blue radiation signals and saturates photoperiodic flowering of several long-day plants at crop-specific photon flux densities. Sci. Hortic. 2020, 271, 109470. [Google Scholar] [CrossRef]
  20. Burlingame, L.L. General biology. Gen. Biol. 2011. [Google Scholar] [CrossRef]
  21. Devlin, P.F. Plants wait for the lights to change to red. Proc. Natl. Acad. Sci. USA 2016, 113, 7301–7303. [Google Scholar] [CrossRef] [PubMed] [Green Version]
  22. Nakai, A.; Tanaka, A.; Yoshihara, H.; Murai, K.; Watanabe, T.; Miyawaki, K. Blue LED light promotes indican accumulation and flowering in indigo plant, Polygonum tinctorium. Ind. Crop. Prod. 2020, 155, 112774. [Google Scholar] [CrossRef]
  23. Kalaitzoglou, P.; Van Ieperen, W.; Harbinson, J.; Van Der Meer, M.; Martinakos, S.; Weerheim, K.; Nicole, C.C.S.; Marcelis, L.F.M. Effects of Continuous or End-of-Day Far-Red Light on Tomato Plant Growth, Morphology, Light Absorption, and Fruit Production. Front. Plant Sci. 2019, 10, 322. [Google Scholar] [CrossRef] [Green Version]
  24. Meng, Q.; Runkle, E. Low-intensity blue light in night-interruption lighting does not influence flowering of herbaceous ornamentals. Sci. Hortic. 2015, 186, 230–238. [Google Scholar] [CrossRef]
  25. Park, Y.; Runkle, E.S. Blue radiation attenuates the effects of the red to far-red ratio on extension growth but not on flowering. Environ. Exp. Bot. 2019, 168, 103871. [Google Scholar] [CrossRef]
  26. Gautam, P.; Terfa, M.T.; Olsen, J.E.; Torre, S. Red and blue light effects on morphology and flowering of Petunia × hybrida. Sci. Hortic. 2015, 184, 171–178. [Google Scholar] [CrossRef]
  27. Zhang, Y.-T.; Zhang, Y.-Q.; Yang, Q.-C.; Li, T. Overhead supplemental far-red light stimulates tomato growth under intra-canopy lighting with LEDs. J. Integr. Agric. 2019, 18, 62–69. [Google Scholar] [CrossRef] [Green Version]
  28. Harun, A.N.; Ahmad, R.; Mohamed, N. Plant growth optimization using variable intensity and Far Red LED treatment in indoor farming. In Proceedings of the 2015 International Conference on Smart Sensors and Application (ICSSA), Kuala Lumpur, Malaysia, 26–28 May 2015. [Google Scholar] [CrossRef]
  29. Ibrahim, N.H.N.; Ibrahim, A.R.; Mat, I.; Harun, A.N.; Witjaksono, G. LoRaWAN in Climate Monitoring in Advance Precision Agriculture System. In Proceedings of the 2018 International Conference on Intelligent and Advanced System (ICIAS), Kuala Lumpur, Malaysia, 13–14 August 2018; pp. 1–6. [Google Scholar] [CrossRef]
  30. Liao, M.-S.; Chen, S.-F.; Chou, C.-Y.; Chen, H.-Y.; Yeh, S.-H.; Chang, Y.-C.; Jiang, J.-A. On precisely relating the growth of Phalaenopsis leaves to greenhouse environmental factors by using an IoT-based monitoring system. Comput. Electron. Agric. 2017, 136, 125–139. [Google Scholar] [CrossRef]
  31. Zhou, J.; Wang, J.; Hang, T.; Li, P. Photosynthetic characteristics and growth performance of lettuce (Lactuca sativa L.) under different light/dark cycles in mini plant factories. Photosynthetica 2020, 58, 740–747. [Google Scholar] [CrossRef] [Green Version]
  32. Ani, N.N.; Harun, A.N.; Samsuri, S.F.M.; Ahmad, R. The Malaysia-Japan Model on Technology Partnership. Malays. Jpn. Model Technol. Partnersh. 2015, 49–58. [Google Scholar] [CrossRef]
  33. Kudo, R.; Ishida, Y.; Yamamoto, K. Effects of green light irradiation on induction of disease resistance in plants. Acta Hortic. 2011, 251–254. [Google Scholar] [CrossRef]
  34. Jeong, S.W.; Hogewoning, S.; van Ieperen, W. Responses of supplemental blue light on flowering and stem extension growth of cut chrysanthemum. Sci. Hortic. 2014, 165, 69–74. [Google Scholar] [CrossRef]
  35. Runkle, E.S. Manipulating Light Quality to Elicit Desirable Plant Growth and Flowering Responses. IFAC Proc. Vol. 2013, 46, 196–200. [Google Scholar] [CrossRef]
  36. Yamada, A.; Tanigawa, T.; Suyama, T.; Matsuno, T.; Kunitake, T. Effects of red:Far-red light ratio of night-break treatments on growth and flowering of Eustoma grandiflorum (Raf.) shinn. Acta Hortic. 2011. [Google Scholar] [CrossRef]
Figure 1. System architecture.
Agriculture 11 00728 g001
Figure 2. System board overview: (a) System I; (b) System II.
Agriculture 11 00728 g002
Figure 3. RF radiation at (a) 2.40 GHz frequency, (b) 2.45 GHz frequency, and (c) 2.48 GHz frequency.
Agriculture 11 00728 g003
Figure 4. The control and feedback block diagram.
Agriculture 11 00728 g004
Figure 5. The climate control block diagram.
Agriculture 11 00728 g005
Figure 6. The wireless actuator mote.
Agriculture 11 00728 g006
Figure 7. The morphological responses for T1, T6, T7, T8, and T9.
Agriculture 11 00728 g007
Figure 8. The physiological responses for T1, T6, T7, T8, and T9.
Agriculture 11 00728 g008
Figure 9. The morphological response for Brassica chinensis under T1, T10, and T11.
Agriculture 11 00728 g009
Figure 10. The physiological responses for Brassica chinensis under T1, T10, and T11.
Agriculture 11 00728 g010
Figure 11. High variable intensity at 300 µmol m−1s−1 after 30 days of sowing.
Agriculture 11 00728 g011
Table 1. Board comparison for microcontroller System 1 and System II.
System 1System 2
Speed16 MHz, 16 MIPS80 MHz
RTCOnboard with battery backupOnboard with battery backup
Power consumption2 A peak, 5 mA standby300 mA peak, 30 µA sleep
System voltage5 V DC3.3 V DC
Table 2. Current consumption comparison.
The Average Current Consumption System 1 and System 2 at 25 °C
Wakeup/Transmit Interval8-Bit Board32-Bit Board
Every 1 h (24 times/day)10 mA45 µA
Every 30 min (48 times/day)30 mA60 µA
Every minute (1440 times/day)50 mA90 µA
Table 3. The parameters for simulating growth experiment (part 1).
PhaseTrialTreatmentStimulate Growth Study
Photoperiod-Intensity (μmol)Duration
12 h Light 12 h Dark1 h Light 1 h Dark24 h LightVariableTime to Harvest
(Days)
1T1Normal Light100 30
T2Pulse Treatment 100 30
2T1Normal Light100 30
T3CL Treatment 100 30
3T1Normal Light100 30
T4High Intensity300 30
4T1Normal Light100 30
T5Artificial Sunlight 50 to 30030
Table 4. The LED parameters for flowering control experiment (part 2).
PhaseTrialTreatmentFlowering Control
Far RedPhotoperiod-Intensity (μmol)Duration
12 h Light 12 h Dark1 h Light 1 h Dark12 h DarkTime to Harvest
(Days)
5T1Normal Light 100 40
T6Pulse-interruption20100 (RBW)Far-Red 40
6T1Normal Light 100 40
T7Pulse-interruption20100 (RBW)Far-Red 50
7T1Normal Light 100 40
T8Night-interruption20100 (RBW) Far-Red40
8T1Normal Light 100 40
T9CL-interruption20100 (RBW) Far-Red40
Table 5. The LED parameters for plant elongation experiment (part 3).
PhaseTrialTreatmentPlant Elongation
Photoperiod-Intensity (μmol)Duration
12 h Light 12 h Dark1 h Light 1 h DarkVariableTime to Harvest
9T1Normal Light100 30
T10Variable Intensity100 50–10030
10T1Normal Light100 30
T11Variable Intensity100 50–30030
Table 6. The values of FW, DW, LA, and MC for T1, T6, T7, T8, and T9.
TreatmentsParameters
LA (cm2)DW (g)FW (g)MC (%)
T1810.77 a3.32 a390.80 a99.15 a
T6750.32 b19.46 b492.928 b96.05 b
T7830.23 c21.32 c530.23 c95.97 c
T8215.74 d0.96 d16.80 d94.28 d
T9260.88 e1.46 e24.25 e93.97 e
The LSD test revealed a significant difference between the means of 96 plants from Brassica chinensis a, b, c, d, and e at the p < 0.05 probability level.
Table 7. Primary and secondary data comparison of growth responses for stop flowering study.
TreatmentPrimary DataSecondary Data
FW (g)MC (%)LA (cm2)DW (g)SH (cm)NOL
T1390.899.15810.773.3211.4515.25
T6492.9296.05750.3219.464.0313.99
T7530.2395.97830.2321.328.5614.32
T816.894.28215.740.9610.269.16
T924.2593.97260.881.4617.0716.9
Each trial content of 48 replicates from six containers.
Table 8. The values of FW, DW, LA, and MC for T1, T6, T7, T8, and T9.
TreatmentsParameters
LA (cm2)DW (g)FW (g)MC (%)
T1810.77 a3.32 a390.80 a99.15 a
T10976.84 b1.54 b149.73 b98.97 b
T111517.0 c10.45 c492.92 c97.87 c
The LSD test revealed a significant difference between the means of 96 plants from Brassica chinensis a, b, and c at the p < 0.05 probability level.
Table 9. Primary and secondary data comparison of growth responses for plant elongation process.
TreatmentPrimary DataSecondary Data
FW (g)MC (%)LA (cm2)DW (g)SH (cm)NOL
T1390.899.15810.773.3211.4515.25
T10149.7398.97976.841.549.9512.00
T11492.9297.871517.010.4528.922.31
Each trial content of 48 replicates from six containers.
Publisher’s Note: MDPI stays neutral with regard to jurisdictional claims in published maps and institutional affiliations.

