Article

Image Analysis Methods in Classifying Selected Malting Barley Varieties by Neural Modelling

by
Agnieszka A. Pilarska
1,*,
Piotr Boniecki
2,
Małgorzata Idzior-Haufa
3,
Maciej Zaborowicz
2,
Krzysztof Pilarski
2,
Andrzej Przybylak
2 and
Hanna Piekarska-Boniecka
4
1
Department of Plant-Derived Food Technology, Poznań University of Life Sciences, ul. Wojska Polskiego 31, 60-624 Poznan, Poland
2
Department of Biosystems Engineering, Poznan University of Life Sciences, ul. Wojska Polskiego 50, 60-627 Poznan, Poland
3
Department of Gerodontology and Oral Pathology, Poznan University of Medical Sciences, ul. Bukowska 70, 60-812 Poznan, Poland
4
Faculty of Horticulture and Landscape Architecture, Poznan University of Life Sciences, 60-637 Poznan, Poland
*
Author to whom correspondence should be addressed.
Submission received: 5 June 2021 / Revised: 20 July 2021 / Accepted: 30 July 2021 / Published: 1 August 2021
(This article belongs to the Special Issue Latest Advances for Smart and Sustainable Agriculture)

Abstract

:
Quality evaluation of products is a critical stage in the process of production. It also applies to the production of beer and its main ingredients, i.e., hops, yeast, malting barley and other components. The research described in this paper deals with the multifaceted quality evaluation of malting barley needed for the production of malt. The project aims to elaborate on the original methodology used for identifying grain varieties, grain contamination degree and other visual characteristics of malting barley employing new computer technologies, including artificial intelligence (AI) and neural image analysis. The neural modelling and digital image analysis assist in identifying the quality of barley varieties. According to the study, information concerning the colour of barley varieties presented in digital images is sufficient for this purpose. The multi-layer perceptron (MLP)-type neural network generated using a data set describing the colour of kernels presented in digital images was the best model for recognising the analysed malting barley varieties. The proposed procedure may bring specific benefits to malthouses, influencing the beer production quality in the future.

1. Introduction

New information technologies are entering different sectors of the food industry. Wherever possible, computerisation and automation of production processes replace human labour [1,2,3,4]. This aims to improve production processes by introducing better efficiency and, at the same time, maintaining the good quality of generated products and reducing expenditure [5,6,7]. These modern solutions are also being introduced to the food sector, and beer production is one of the rapidly developing branches of this industry [8,9,10]. The efficiency of the processes carried out at the brewhouse depends mainly on the raw materials applied and the selection of adequate technological parameters. It is of great importance to develop new technologies and equipment and use new and selected raw materials to achieve the desired quality of the final product [11]. Moreover, the final product should fulfil certain parameters to meet consumer requirements [12,13]. The high quality of products determines the improvements in ingredient production technologies (Figure 1).
The primary ingredients necessary for beer production include malting barley and malt extracted from selected barley varieties [14]. The malted barley grains are used for producing enzymes in such a quantity that will enable far-reaching hydrolysis of the polymers contained in barley caryopses and their proper loosening to facilitate the extraction process [15]. Malt, i.e., germinated and dried grains of brewing barley, is ground and heated up in water (to extract the nutrients) until nourishing sugar and a protein-rich solution known as wort (pronounced as wert) are obtained. It is the perfect medium for the growth and fermentation of yeast [16]. The process of fermentation by inoculated yeasts is of fundamental importance for the aromatic profile of the produced beer. The polyphenols from malt and hops (added during the production) fundamentally influence the physical quality of beer [17]. Malting barley is used only in the malt industry. Malt must quickly achieve complete physiological maturity and must germinate quickly and evenly. A good level of grain uniformity is also an important factor. Brewing barley is associated with two-rowed barley. It is due to the structure of the grain, which should be well-filled, bulbous, barrel-shaped and symmetrical. It must retain the characteristics of the highest quality grain, with a delicate and thin husk [18]. It cannot be infested with pathogenic fungi and have a musty smell.
Barley grains used in the malting plant must be of high quality, with a strictly determined composition and low protein content because grains with a high protein content decelerate the relaxation (during grist production) and limit the malt extract efficiency. Varietal purity determines the type of the produced malt, and the malthouses mix preferred varieties to make the specific type of grist expected by the breweries [19]. Therefore, grains must always be checked for varietal purity and technological quality of the process [20].
Several grain testing methods are used, including immunological analysis, protein electrophoresis, DNA analysis, high-performance liquid chromatography, isoenzyme analysis, a combination of attenuated total reflectance mid-infrared spectroscopy and chemometrics, as well as quantitative trait locus (QTL) analysis [21,22,23,24,25]. However, most of these methods are labour-intensive and expensive, and the tests can be only performed at specialised laboratories.
Visual evaluation of grains with regard to the variety, in line with the International Rules for Seed Testing developed by the International Seed Testing Association (ISTA), constitutes an alternative approach [26]. The ISTA method is the primary tool to promote uniformity in the seed testing industry. Since the technique is much easier to conduct in malting plants, it is more common than chemical methods. Its reliability, however, to a large extent, depends on the skills and experience of the person conducting the evaluation. The process begins with choosing a representative sample of the purchased grain. It is followed by a visual assessment of grain quality, which involves manual segregation. Even though it is carried out by highly trained malthouse workers, such classification is subjective.
Another technique—computer image analysis—is fast, inexpensive and relatively effective. It is an alternative and prospective method of the assessment of selected physical attributes of kernels [20]. Computer classification of grain varieties has already been studied for many years [14,27,28,29,30]. This method involves the creation of numerous algorithms for feature computation, focusing on various aspects of an image, such as texture, brightness and colour, shape and topology of the region [31]. These are the characteristics that are taken into account in the grain analysis. Digital image analysis is a developmental technique that is based on the creation of advanced algorithms. Older classification models were based on analyses of whole kernel regions only [27,28], while for some time now, manufacturers have been conducting segmentation of kernel images (grain images) into specific areas that are individually checked using various algorithms. The suggested image analysis procedure is based on the assumption that certain traits are determined genetically [14,32,33,34].
In this project, the focus is directed to the visual assessment of contamination and the hue of the grains as well as barley varieties. Each characteristic poses certain difficulties in terms of its recognition. Polish standards (PN-R-74109 and PN-R-74110) are applicable with respect to barley contamination. These standards help identify certain grain groups, such as broken or ungerminated grains. However, there are some reservations concerning the qualification of grains based on the subjective opinions of laboratory technicians and impacts on their input (human-related factors, e.g., fatigue). Furthermore, there are no codified standards to assist in distinguishing malting barley varieties. Therefore, malthouses and specialised laboratories have to develop their own criteria for identifying grains. Now, experts use chemical tests to establish malt parameters that enable variety identification.
First and foremost, this aim of this project was to identify algorithms required to carry out a digital image analysis and select optimal neural models, establishing the topology of artificial neural networks (ANNs). ANNs were used for the following reasons: (i) Neural models are excellent classifiers commonly used in engineering practice, for example in the process of solving the so-called autonomous problems; (ii) the problem of over-fitting the classifier to the learning data, the solution to which is provided by the ANN simulator used during the research, which divides the learning set into training, validation and test sets. The error analysis of the generated ANN for individual sets can be used to identify the phenomenon of fitting, over-training along with other aspects important to this study and (iii) the generated neural classifier algorithms can be easily implemented in the subsequently developed information systems supporting the beer production process.
The presented technology may help to solve the problems of variety identification and calculation of contamination level to a standard that is close or even superior to human abilities. Adequate results may lead to the automation of the visual evaluation process of grains. The developed ANN could be described as a dedicated information tool to support decision-making processes in broadly understood beer production.

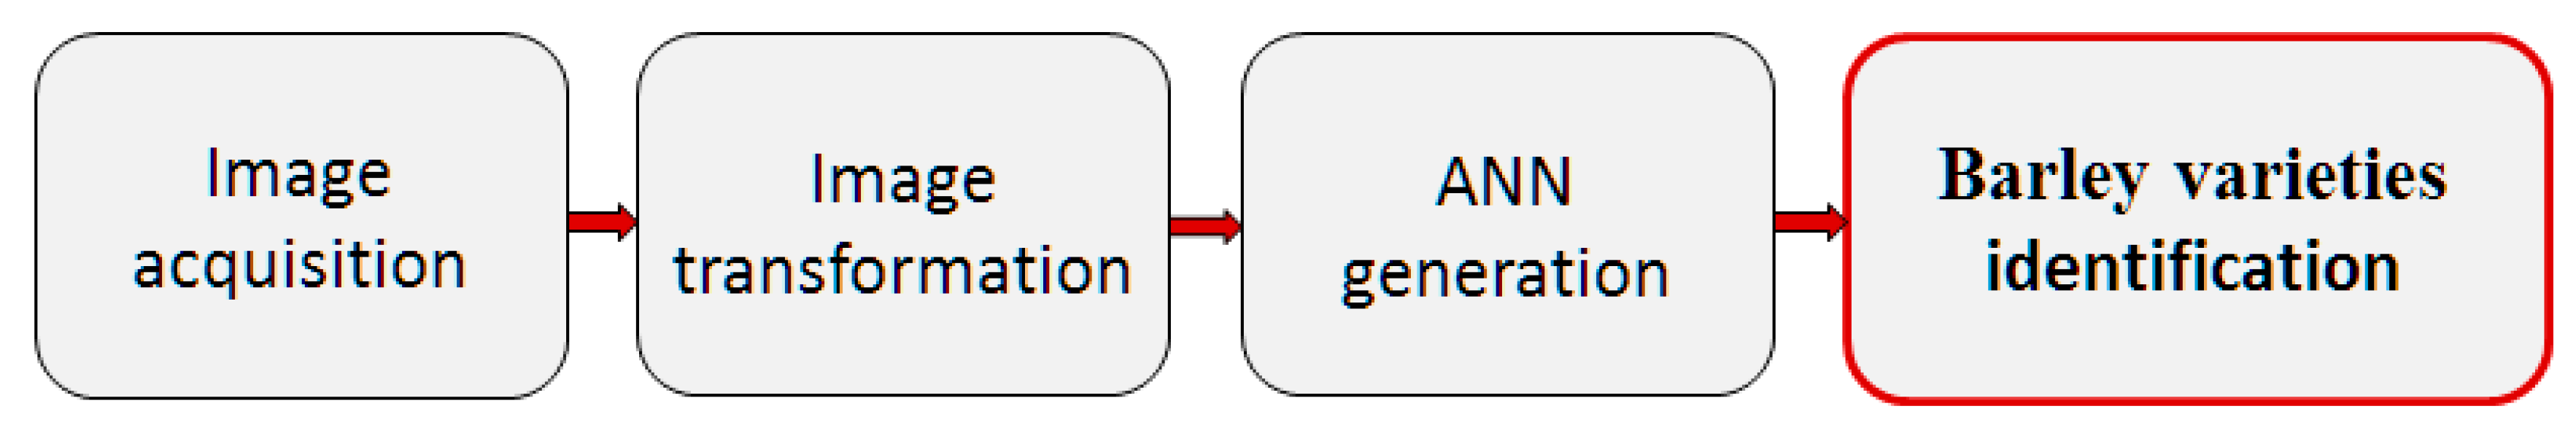
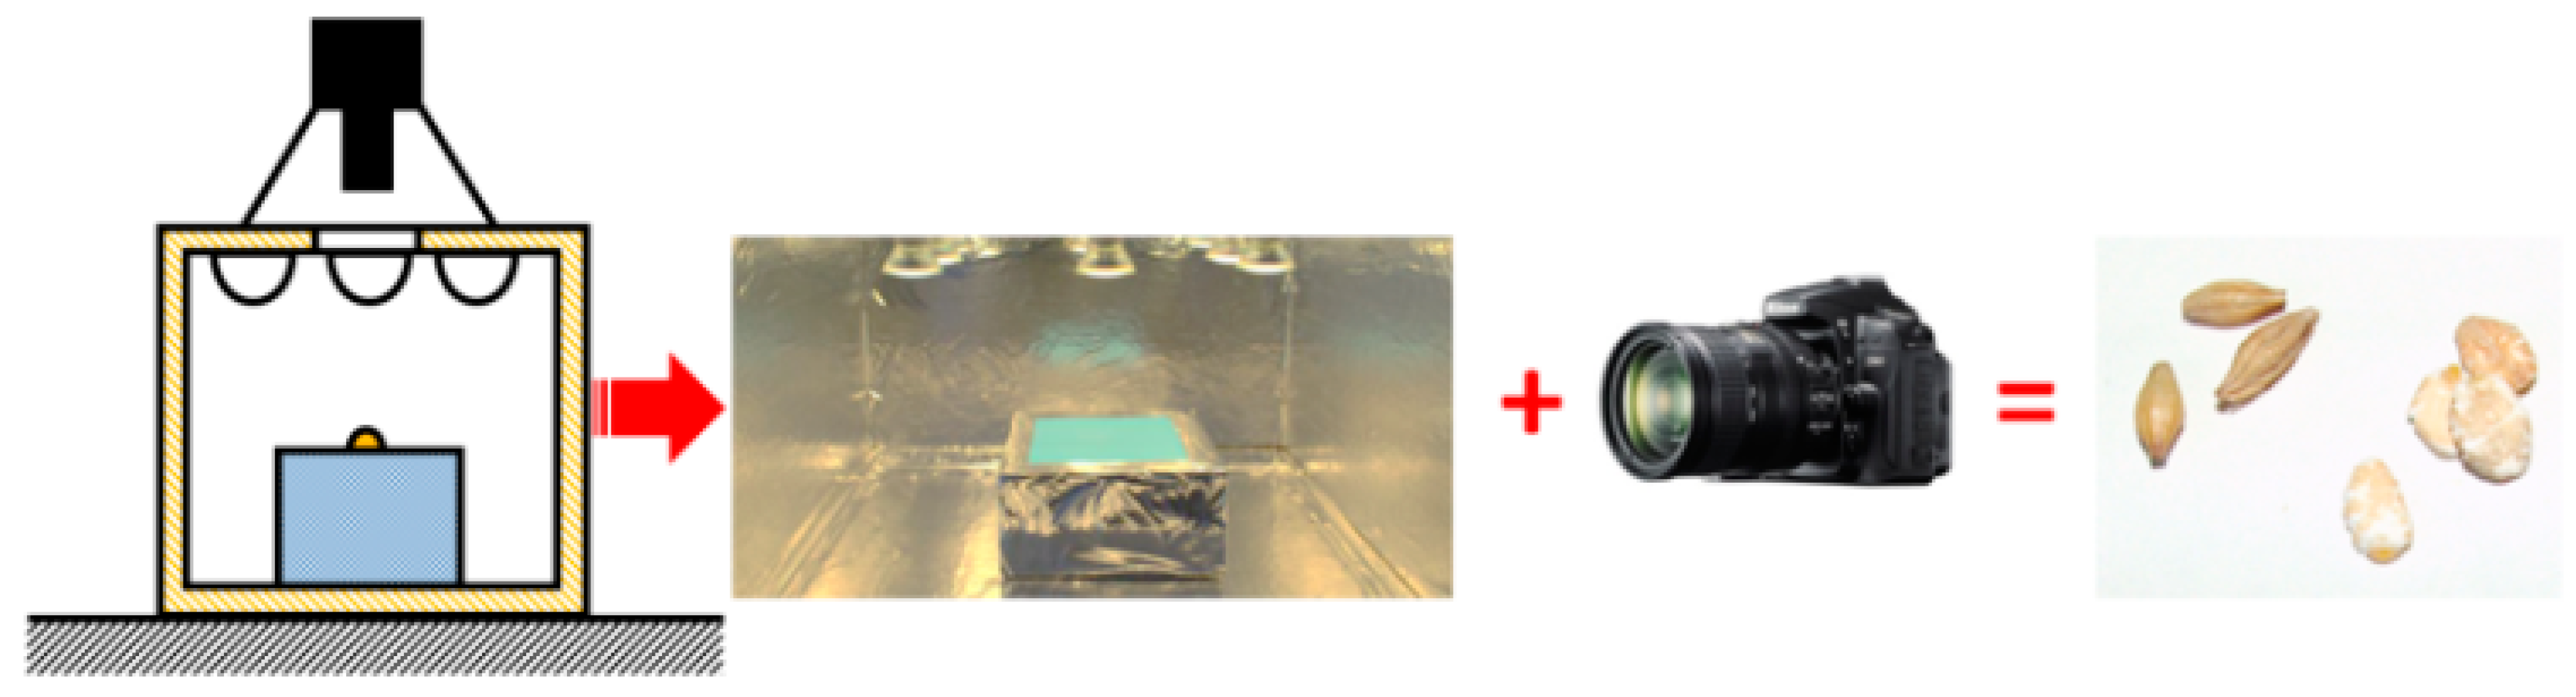
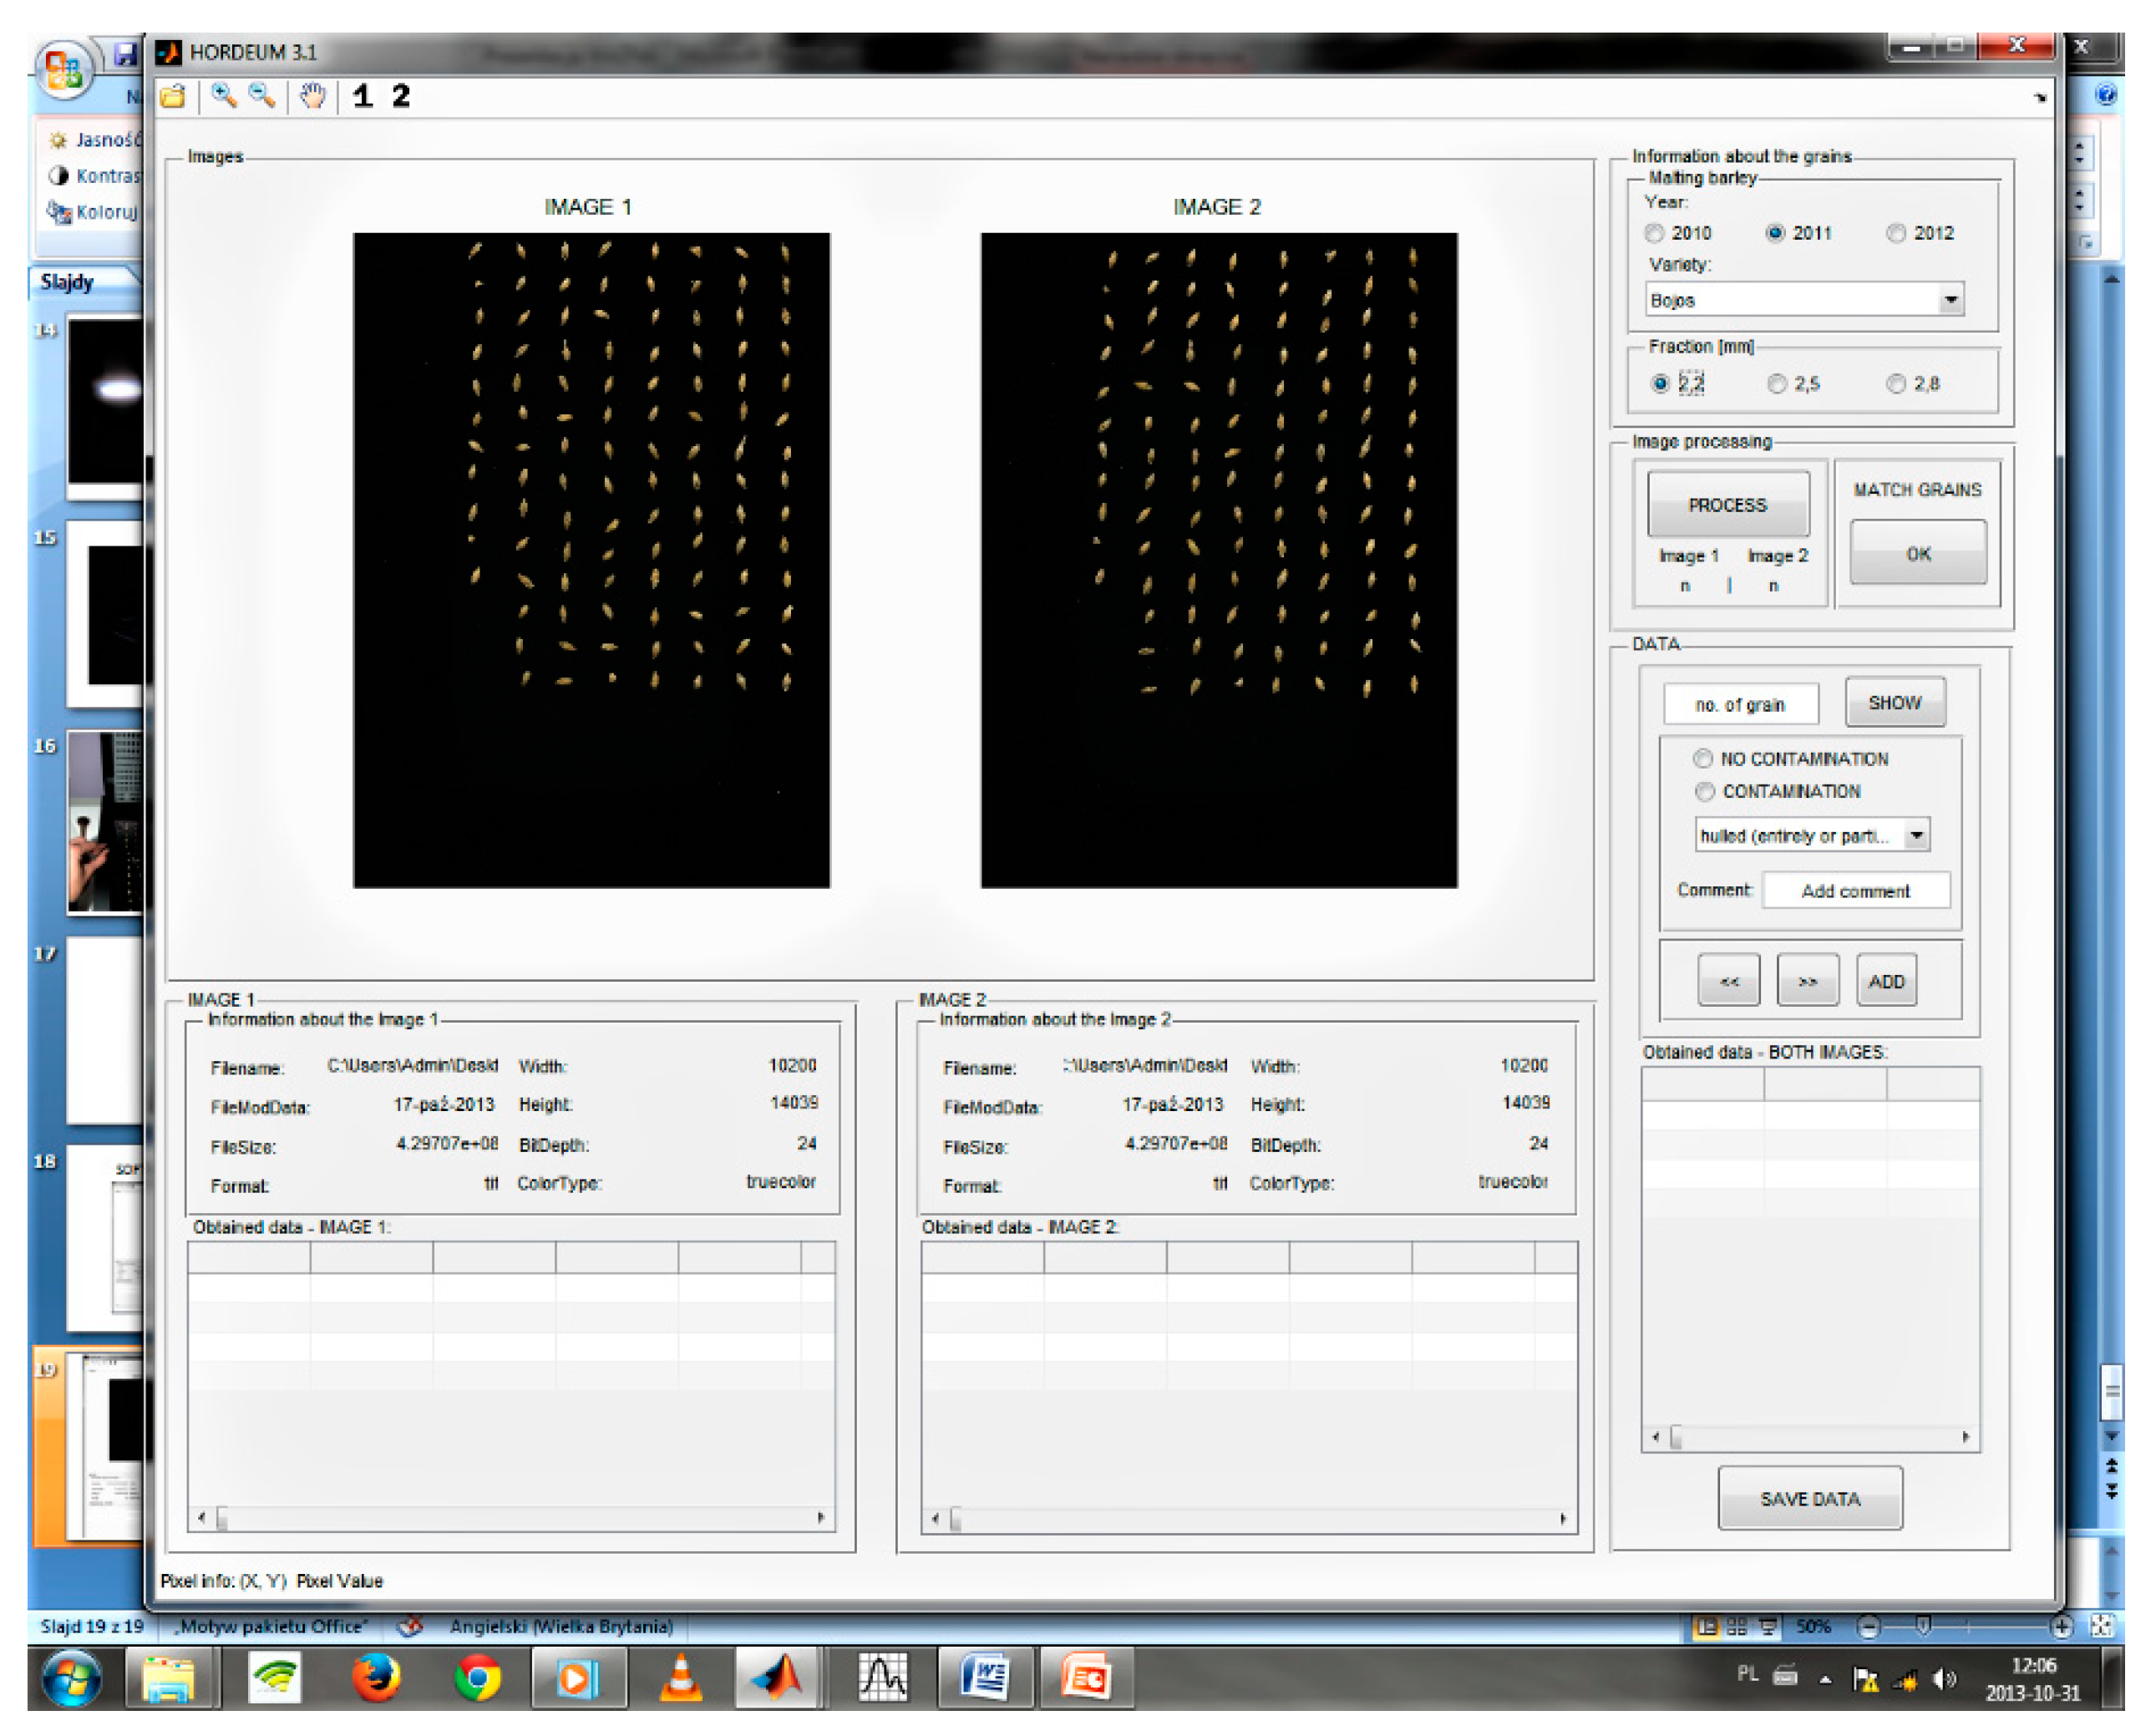
2. Materials and Methods

As part of the project, a variety identification of barley grains was performed. The investigation was carried out following the neural image analysis methodologies concerning corn kernels and rapeseed. The study was performed in Poland at the Poznan University of Life Sciences. In this paper, three selected spring varieties were analysed: Beatrix, Sebastian and Xanadu. Selected barley varieties represent standard specifications (see Table 1) applied to malt production. The parameters of the above-defined varieties of barley were compared to four exemplary parameters (brewing quality, extract potential, wort viscosity and Kolbach index) indicated in Table 1, which are commonly used in a wide range of image analysis.
The first stage involved selecting representative samples of barley grains to capture images. For each variety, up to 700 individual grains were selected. They complied with general qualitative criteria, i.e., showing no signs of mechanical damage or disease. Grain images were taken using a special test stand [14,20] (see Figure 2). The stand was equipped with an independent source of light: eight LED bulbs (with colour temperature resembling daylight) and luminance of 5.6 klx (for all enabled bulbs; 5.6 klx: standard LED lighting parameters, klx—calibration factor applies to both lighting intensity and luminance measurements; luminance is a photometric quantity which measures the intensity of light emitted in a given direction, (cd/m²).
The images were captured with a Nikon D90 camera, AF-S Nikkor 18–70 mm 1:3.5–4.5G ED lens and 8× magnification (2 rings, 67 mm, +2, +4). The camera was set up on a tripod with a special mount which ensured that the camera lens was directed towards the substrate, i.e., directly at the grain placed on the background. The background for the grain was a specially prepared plate spray-painted in matt blue. This prevented reflections caused by the lighting and provided contrast for the barley grain, which further facilitated segmentation of the grain in the computer system (barley grain does not contain blue colour).
Next, the images were processed and analysed using the in-house developed software “Hordeum 2.0” and “Hordeum 3.1” (Figure 3 and Figure 4), using MATLAB 2011b. This software acquires information on the features (Figure 3) of the grains from the pictures and then processes them using neural network models employing an additional toolbox of MATLAB (Neural Network Toolbox). A total of 1000 digital images of randomly selected samples (112 grains per image) were taken. The 800 best-quality images of grains of three varieties (Beatrix, Sebastian and Xanadu) were selected for further analysis using developed IT system. Each picture provided 46 input variables (geometrical and non-geometrical):
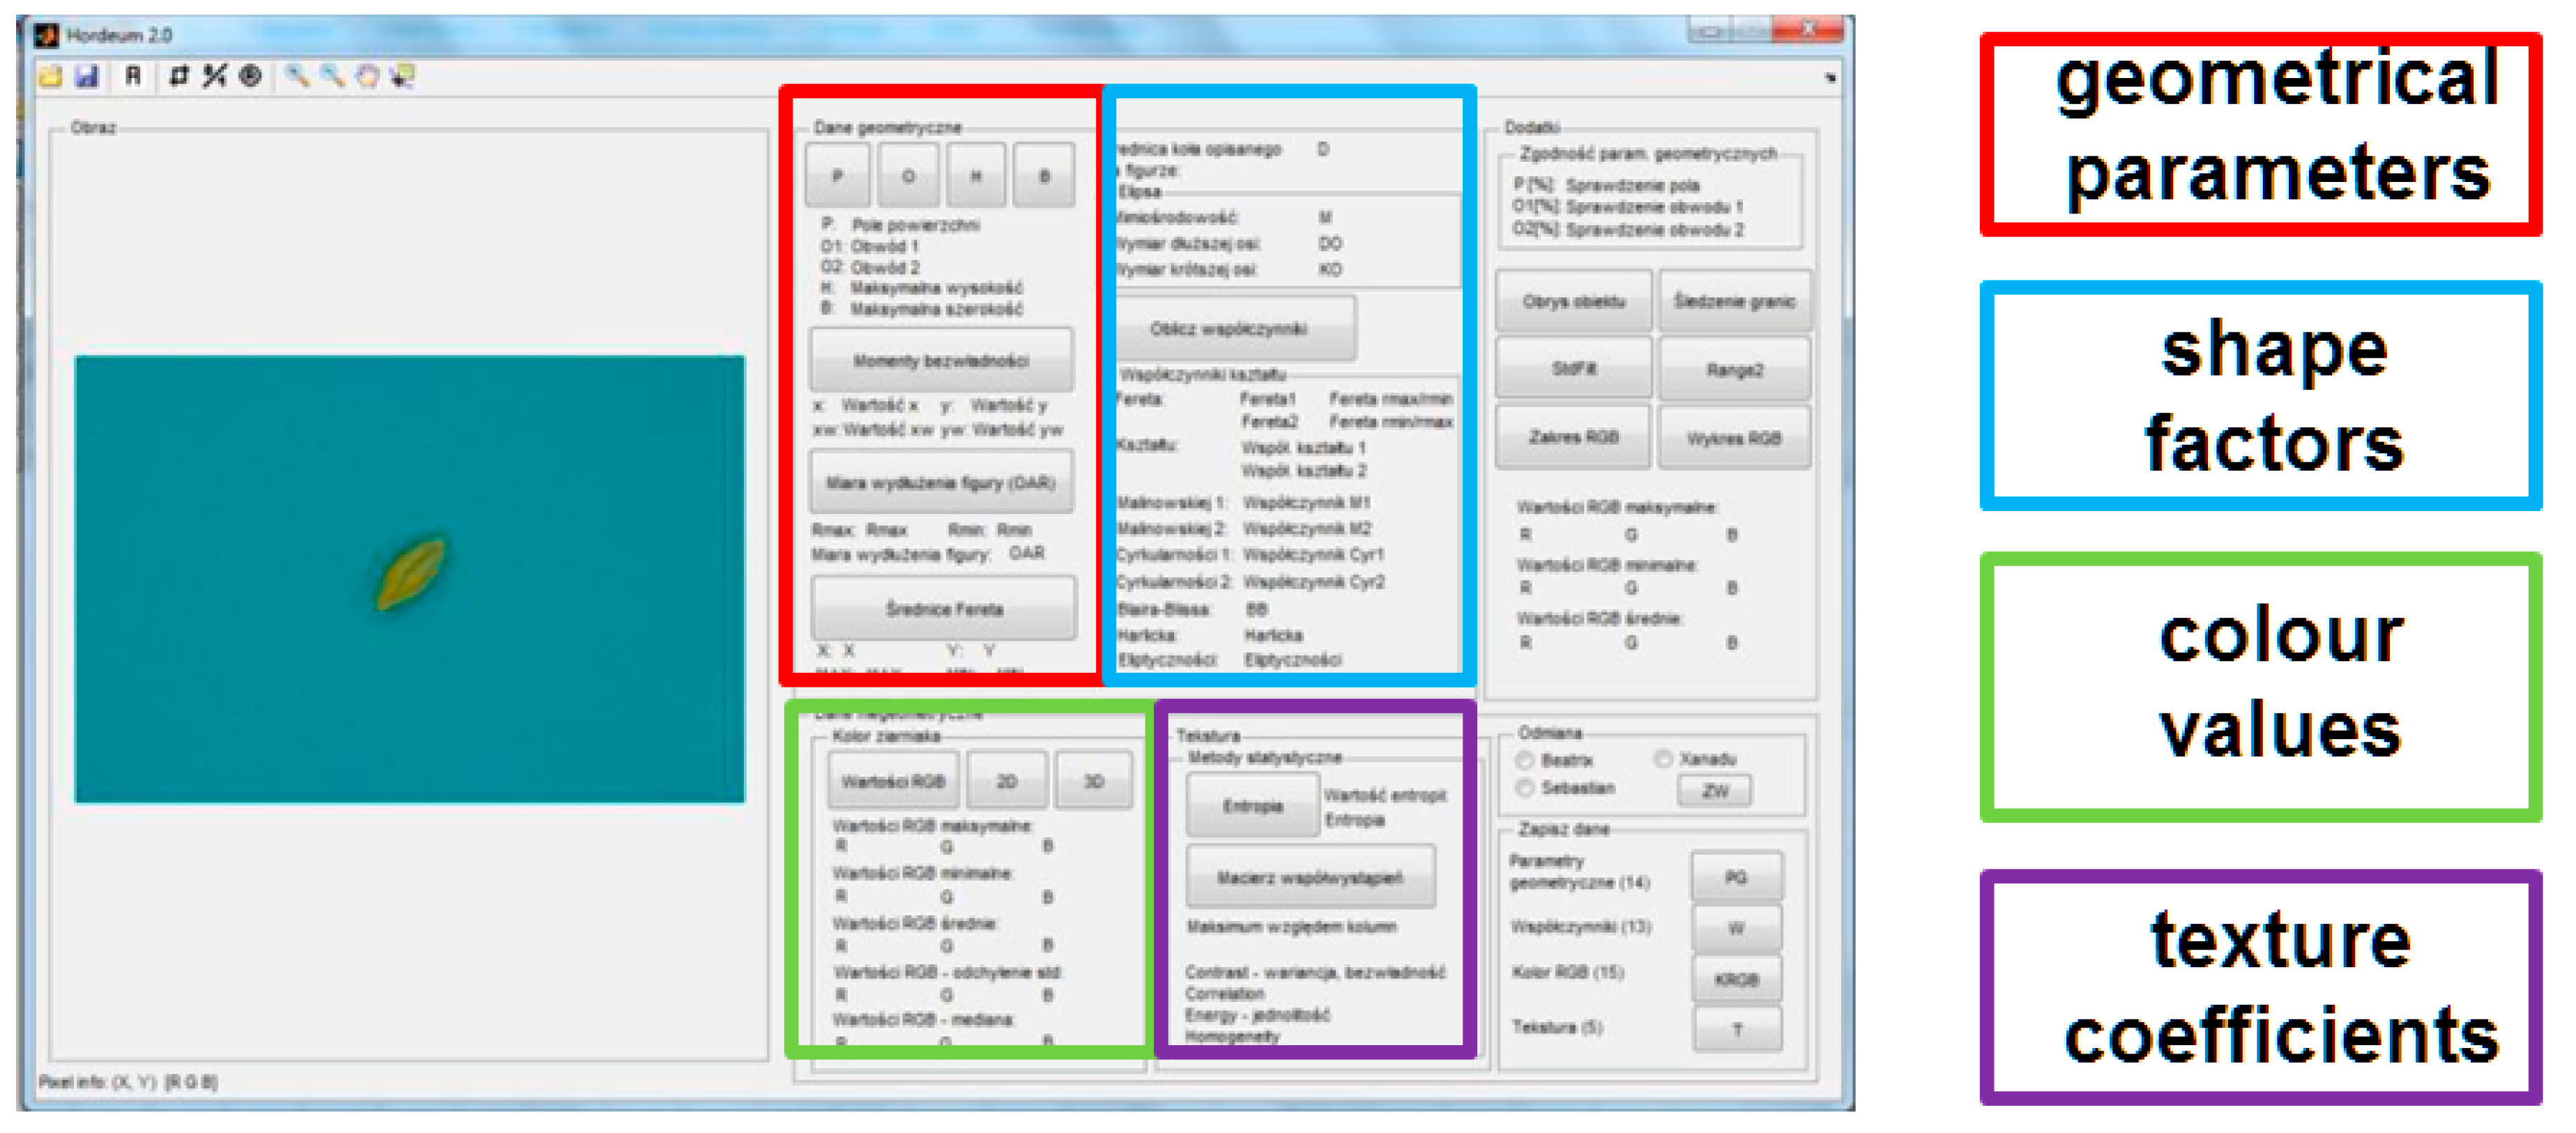
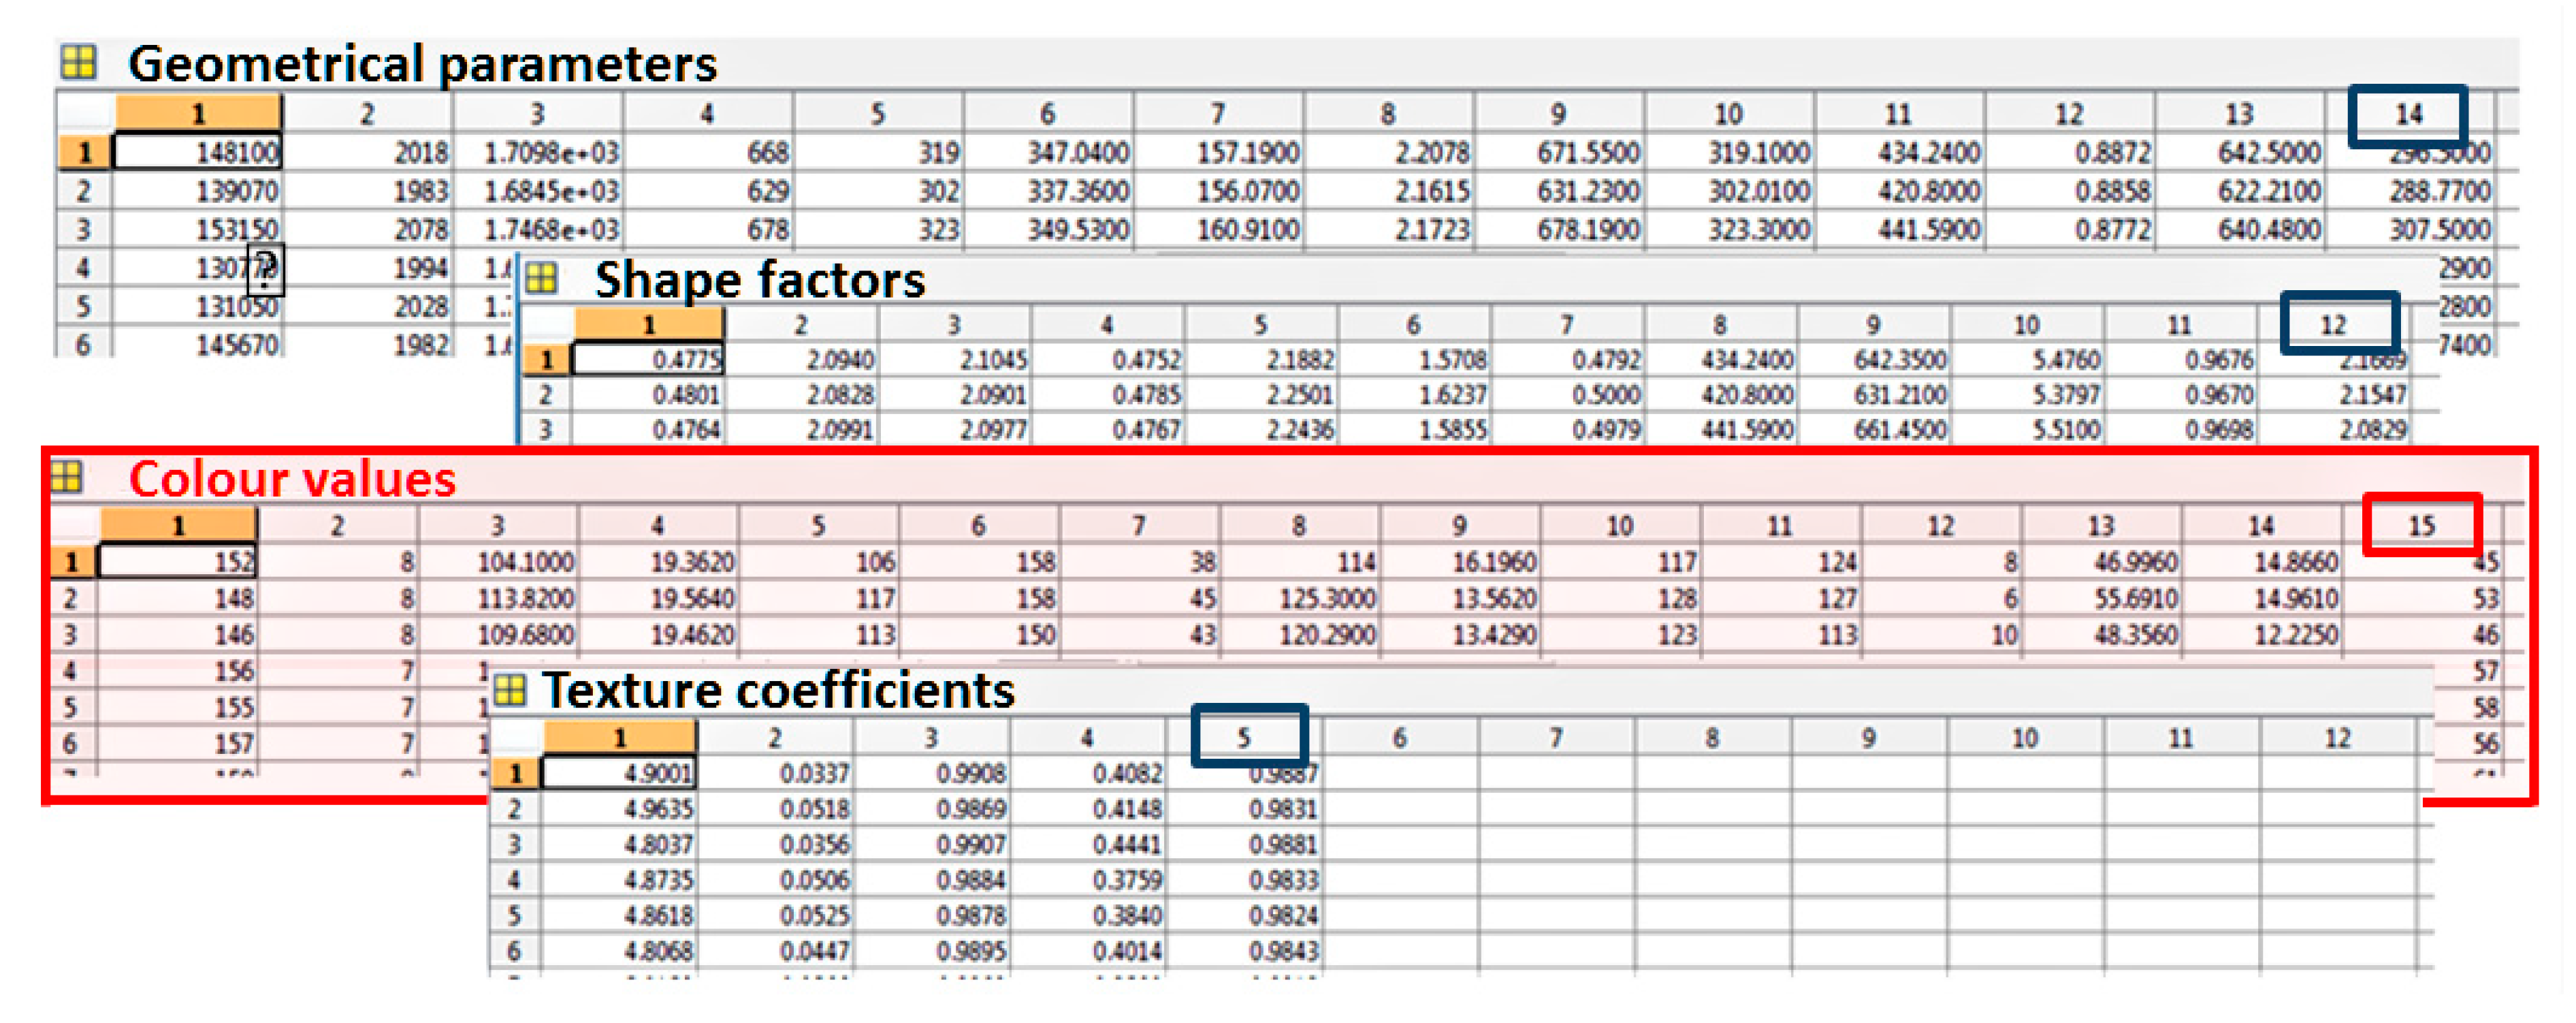
  • − Geometrical parameters, such as the grain area, circumference, height, width, inertia moments, Feret’s diameter, (maximum and minimum) radius from the centre of gravity, aspect ratio and dimensionless quantities (14 variables);
  • − Shape-related factors, such as Feret’s, Malinowska, circularity, Blair–Bliss, Haralick and ellipticity (12 variables);
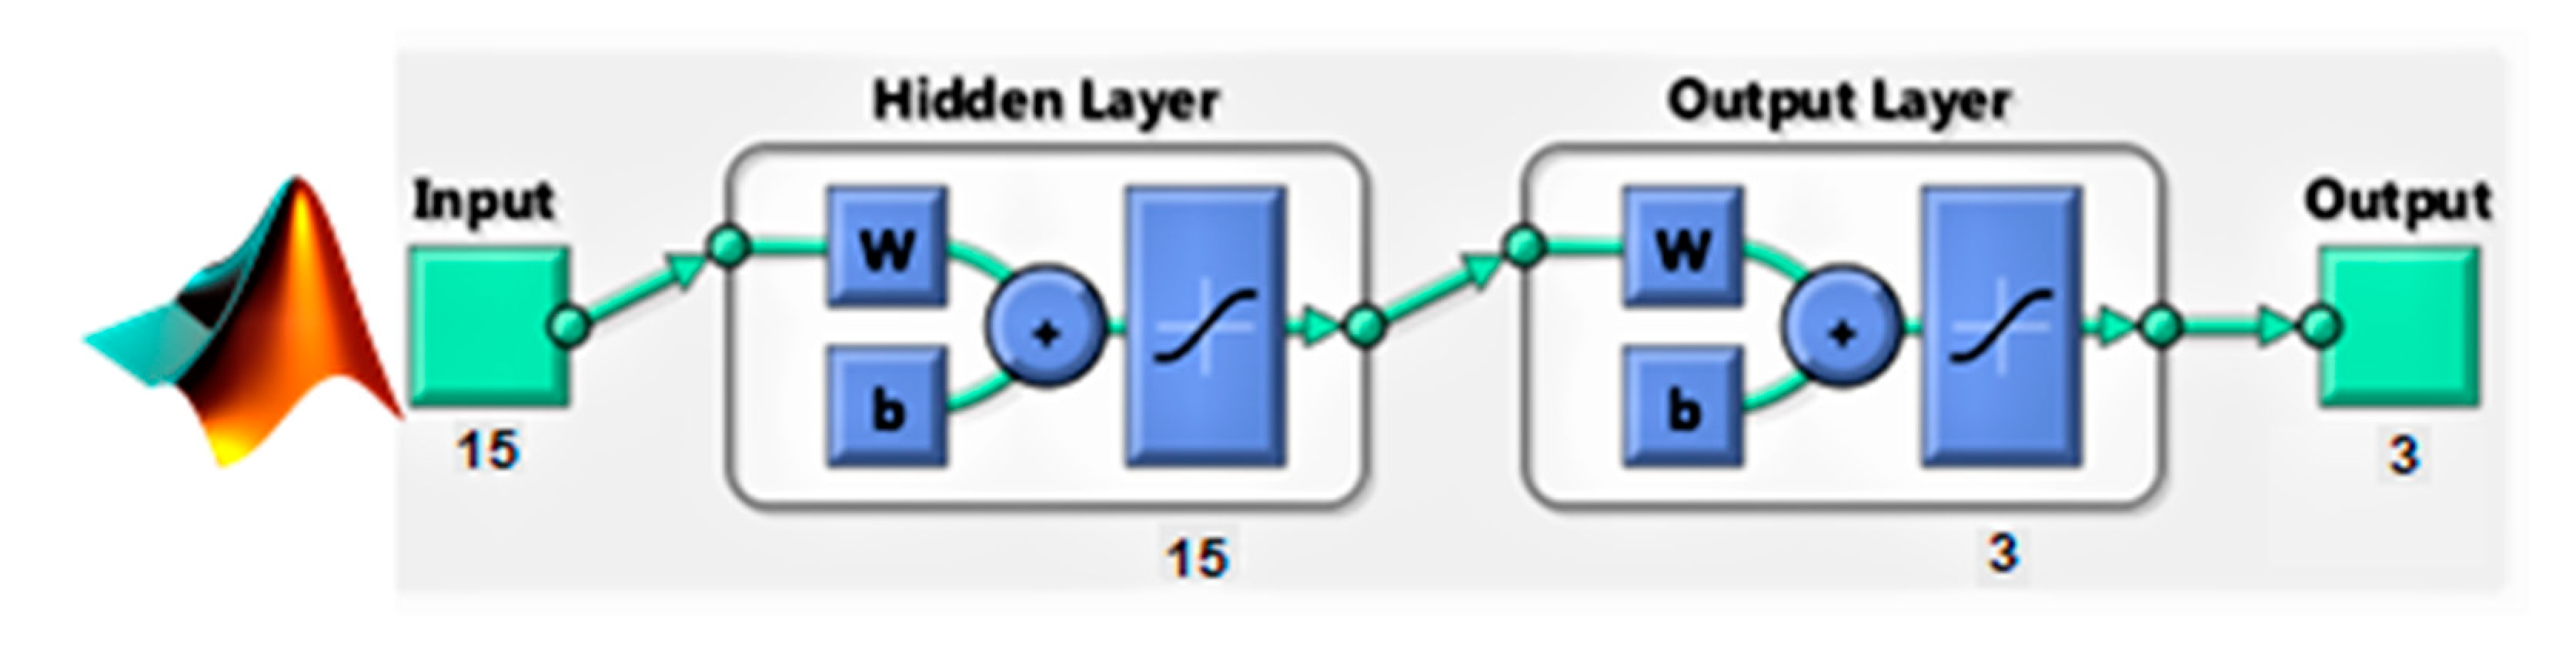
  • − Colour values, such as the maximum and minimum values, mean and median and standard deviation (15 variables);
  • − Texture-related coefficients, such as a breakup and coefficients of the co-matrix (five variables).
Figure 3. The structure of “Hordeum 2.0” software with four graphic descriptor groups.
Agriculture 11 00732 g003
Figure 4. The main window of the new version of “Hordeum 3.1” software.
Agriculture 11 00732 g004
With the “Hordeum 2.0” software, it was possible to obtain a training set to generate artificial neural networks [14]. In the project, 46 input variables were divided into four separate data sets (see Figure 3) [14,21].
During the work, significant modifications were made to the code of the “Horodeum 2.0” application. The “Horodeum 3.1” software significantly supports the process of developing training sets necessary for creating neural models. The working window of the created application is presented below (Figure 4). Design and operation of in-house developed software “Hordeum 2.0” and “Hordeum 3.1” has been described in detail in previously analysed materials [2,14].
A schematic procedure for neural identification of selected malting barley varieties is shown in Figure 5.
The first stage of the procedure (image acquisition) consisted of the acquisition of adequate digital images. The second stage involved the identification of relevant parameters of grain images and their conversion into training sets. The third stage was the process of the generation of classification neural network models. As a consequence of the mentioned stages, a qualitative classification of barley was carried out.
The Root Mean Square (RMS) error is a usual measure of classification correctness of the generated ANN. This measure can be described as the total error of the network concerning the data set (training, testing and validation). It is worth noting that the determination of the RMS error for previously defined subsets of training data is a standard during the operation of many neural simulators implemented in various systems, such as MATLAB or STATISTICA. For the calculation, the following formula is used [2,4]:
R M S = i = 1 n ( y i z i ) 2 n
  • N—number of cases;
  • yi—real values;
  • zi—values determined using the network.
RMS error is the root of the mean square error and is the total error made by the ANN for a previously defined data set (training, validation and test). It is determined by summing the squares of individual errors, dividing the obtained sum by the number of included values and determining the square root of the quotient obtained. The RMS error is usually the most interpretable single value describing the total error of the generated neural network.
The design of four training sets suitable for four generated sets (Figure 3) used in Neural Network Toolbox (MATLAB) is shown in Figure 6.
A block diagram showing the neural model generated using the Neural Network Toolbox (MATLAB) is shown in Figure 7.
Figure 7 shows the structure of the optimal MLP-type neural network (multilayer perceptron) which was presented in the standard notation used in the ANN simulator implemented in the MATLAB system.

3. Results and Discussion

We attempted to establish neural network models that could help classify varieties of malting barley using the Neural Network Toolbox. Processing of data sets using the MATLAB Toolbox provided the outcomes illustrated in Table 2. Therefore, the numerical values in Table 2 represent the computer simulation results generated by the NNT simulator implemented in the computer system used (MATLAB).
Table 2 presents the generated network topologies (for four groups of image parameters). The optimal ANN, being a multi-layer perceptron, was obtained for colour values as the representative parameter, MLP 15:15-15-3:3. It is worth clarifying that MLP 15:15-15-3:3 represents a three-layer multilayer perceptron containing 15 neurons in the input layer (representing 15 colour characterising parameters), 15 neurons in the hidden layer and three neurons in the output layer of the generated ANN (see Figure 7).
The RMS error is represented by a numerical value facilitating interpretation that illustrates the total error of the ANN. In the case of MLP models, 15:15-15-3:3 (the neural network type generated by Neural Network Toolbox (MATLAB)), RMS errors were acceptable in terms of learning, validation and test sets. They are shown in Table 2 (a blue frame).
The comparison of the four neural network models showed that the best one for identifying the malting barley varieties was the multi-layer perceptron (MLP) neural network type generated with the third data set concerning colour information (see Table 2).
The MLP topology employing the 15:15-15-3:3 structure was considered an optimal artificial neural network (ANN). The input layer included 15 neurons demonstrating a linear postsynaptic function. The sole hidden layer had 15 sigmoid neurons. On the other hand, the network output had one sigmoid neuron that represented a three-state nominal variable. The neural model was trained using the back-propagation (BP) method in 10 cycles, including 1000 epochs each, and its training was further optimised with the conjugate gradient (CG) algorithm for 2000 epochs.
In conclusion, colour turned out to be an identifying trait, represented by 15 characteristic parameters in classifying selected malting barley varieties. To indicate the hierarchy of these parameters in terms of significance level, sensitivity analysis of the input variables to the performance of the neural model was performed (MLP 15:15-15-3:3). However, the primary objective of this study was only to identify the optimal neural classifier. The obtained results are sufficient for conducting further research in the discussed area. The optimal selected ANN model could be used in the new software to swiftly identify the varieties of barley grains.
The classification usually involves calculation of image attributes. An image attribute is a numeric quantity that is typical to the image or its fragment. As already mentioned in the introduction, numerous algorithms for feature computation focus on various aspects of the image. For example, Neuman et al. (1989) analysed colour characteristics of various types of wheat and demonstrated their significant differences [35]. Paliwal et al. (1999) focused on attributes such as colour and shape to distinguish grains of wheat, barley, oats and rye [36]. Szczypinski and Zapotyczny (2012) discovered main areas of a single barley grain, which enabled estimation of their rotation and quality [32]. For individual grain images, Koziołek et al. (2017) proposed the analysis of a single grain tool based on several descriptors, including colour [32].
However, it is difficult to classify grains if more than one can be seen in a single picture. The application of computer vision to visible-light pictures, along with soft computing and learning methods [37], expert systems [38] or a discriminant analysis [20], could be a solution to the problem. Moreover, the application of neural networks or the k-nearest neighbour algorithm to classify varieties of wheat and barley (using GLCM features) could also be helpful [39,40,41]. As literature shows, imaging systems employing different light spectra have also been applied [23]. Support vector machines (SVMs) are another form of classifier (in addition to the already mentioned k-NN and neural networks) that has proved its usefulness during studies concerning the quality of rice [42]. It should be noted that this classifier has considerable capabilities in terms of both grain and plant identification [43]. Interesting results were also published by Ramirez-Paredes and Hernandez-Belmonte in 2020 [31]. In their article, the authors presented a concept of machine learning (ML) algorithms designed to evaluate the quality of malting barley grain varieties. Several trait vectors combined with a non-linear classifier were compared; it was found that a local phase quantisation (LPQ) descriptor combined with features of colour and shape could provide even better results than improved local descriptors. Despite the above-mentioned significant advances, it should be noted that neural classifiers have the advantage of generating results in “real time” during operation. This gives them a significant advantage over other classifiers and has led to their use as modules in complex IT systems that support the broadly understood production.
The neural modelling and digital image analysis techniques used in this study enable effective identification of the quality of barley varieties. It has been found that the multilayer perceptron (MLP), successfully used in other disciplines, is the best model for recognising the analysed malting barley varieties [44,45]. The analysis results proved that in the process of grain classification, MLP sufficed to gather information concerning the colour of barley types presented in digital images. The presented technique has practical importance, as it can be applied to an automated qualitative assessment of selected malting barley varieties. It also shows potential as an effective tool supporting the decision-making process in beer production.
Compared to other methods, MLP is uncomplicated in terms of its implementation and very effective. The standard activation function for MLP networks is the logistic function (also called the sigmoid function). In the ANN simulator implemented in the MATLAB system, it was used by default in all layers of the generated ANN. Currently, MLPs are among the most popular network architectures, particularly as effective neural classifiers. MLP networks can be trained using many algorithms, such as the conjugate gradient method, quasi-Newton algorithm, Levenberg–Marquardt algorithm, backpropagation error algorithm, fast propagation algorithm and delta-bar-delta algorithm.
To sum up, the proposed procedure may facilitate the method of barley assessment compared to the current method used by manufacturers. In addition to providing specific utility benefits for the malthouse, it may also positively affect the quality of beer production.

4. Conclusions

The study results proved artificial neural networks to be helpful in identifying selected varieties of malting barley. The MLP-type neural network with the 15:15-15-3:3 structure generated using a data set describing the colour of kernels presented in digital images was the best model for recognising the analysed malting barley varieties. The information concerning the colour of barley grains encoded in a set of 15 selected coefficients (graphic colour descriptors) proved to be the most significant in the identification process. The sensitivity analysis of all four generated neural models, especially in terms of empirical data reduction (e.g., using the Karhunen–Loeve transform or KLT method) is the subject of ongoing work.

Author Contributions

Conceptualisation, A.A.P., P.B. and M.Z.; methodology, P.B., M.Z., K.P. and A.P.; software, P.B., M.Z. and M.I.-H.; validation, A.A.P., M.I.-H. and H.P.-B.; formal analysis, A.A.P. and H.P.-B.; investigation, P.B., M.Z., K.P. and A.P.; resources, A.A.P., P.B. and K.P.; data curation, P.B. and M.Z.; writing—original draft preparation, A.A.P. and P.B.; writing—review and editing, A.A.P., M.I.-H. and H.P.-B.; visualisation, P.B. and A.P.; supervision, P.B. and H.P.-B.; project administration, P.B. and M.Z.; funding acquisition, P.B., M.I.-H. and A.P. All authors have read and agreed to the published version of the manuscript.

Funding

The study was funded by the National Centre for Research and Development under project No. PBS3/B8/26/2015.

Institutional Review Board Statement

Not applicable.

Informed Consent Statement

Not applicable.

Conflicts of Interest

The author declared no conflict of interest.

References

  1. Boniecki, P.; Idzior-Haufa, M.; Pilarska, A.A.; Pilarski, K.; Kolasa-Więcek, A. Neural classification of compost maturity by means of the Self-Organizing Feature Map artificial neural network and Learning Vector Quantization algorithm. Int. J. Environ. Res. Public Health 2019, 16, 3294. [Google Scholar] [CrossRef] [Green Version]
  2. Nowakowski, K.; Boniecki, P.; Tomczak, R.J. Identification process of corn and barley kernels damages using neural image analysis. In Proceedings of the 3rd International Conference on Digital Image Processing, Chengdu, China, 8 July 2011; Volume 8009, pp. 15–17. [Google Scholar]
  3. Zaborowicz, M.; Boniecki, P.; Piekarska-Boniecka, H.; Koszela, K.; Mueller, W.; Górna, K.; Okoń1, P. Neural classification of the selected family of butterflies. In Proceedings of the 9th International Conference on Digital Image Processing (ICDIP), Hong Kong, China, 21 July 2017; Volume 10420/1. [Google Scholar]
  4. Boniecki, P.; Koszela, K.; Piekarska-Boniecka, H.; Nowakowski, K.; Przybył, J.; Zaborowicz, M.; Raba, B.; Dach, J. Identification of selected apple pests, based on selected graphical parameters. In Proceedings of the 5th International Conference on Digital Image Processing, Beijing, China, 19 July 2013; Volume 8878. [Google Scholar]
  5. Pilarski, K.; Pilarska, A.A.; Witaszek, K.; Dworecki, Z.; Żelaziński, T.; Ekielski, A.; Makowska, A.; Michniewicz, J. The impact of extrusion on the biogas and biomethane yield of plant substrates. J. Ecol. Eng. 2016, 17, 264–272. [Google Scholar] [CrossRef]
  6. Pilarska, A.A.; Pilarski, K.; Ryniecki, A.; Tomaszyk, K.; Dach, J.; Wolna-Maruwka, A. Utilization of vegetable dumplings waste from industrial production by anaerobic digestion. Int. Agrophys. 2017, 31, 93–102. [Google Scholar] [CrossRef]
  7. Pilarska, A.A.; Wolna-Maruwka, A.; Pilarski, K. Kraft lignin grafted with polyvinylpyrrolidone as a novel microbial carrier in biogas production. Energies 2018, 11, 3246. [Google Scholar] [CrossRef] [Green Version]
  8. Przybył, K.; Pilarska, A.; Duda, A.; Wojcieszak, D.; Frankowski, J.; Koszela, K.; Boniecki, P.; Kujawa, S.; Mueller, W.; Zaborowicz, M. Health properties and evaluation of quality of dried strawberry fruit produced using the convective drying method with neural image analysis. In Proceedings of the 18th International Conference on Digital Image Processing, Guangzhou, China, 29–31 October 2019; Volume 11179. [Google Scholar]
  9. Boniecki, P.; Zaborowicz, M.; Pilarska, A.; Piekarska-Boniecka, H. Identification process of selected graphic features apple tree pests by neural models type MLP, RBF and DNN. Agriculture 2020, 10, 218. [Google Scholar] [CrossRef]
  10. Boniecki, P.; Piekarska-Boniecka, H.; Koszela, K.; Nowakowski, K.; Kujawa, S.; Majewski, A.; Weres, J.; Raba, B. Neural identification of selected apple pests. Comput. Electron. Agric. 2015, 110, 9–16. [Google Scholar] [CrossRef]
  11. Goode, D.L.; Lalor, E. The malt and hop crisis tech-nologies to maximise proces ability and cost effciency. Brew. Distill. Int. 2008, 4, 37–40. [Google Scholar]
  12. Aroh, K. Review: Beer Production. SSRN Electron. J. 2019, 24, 1568. [Google Scholar] [CrossRef]
  13. Mildner-Szkudlarz, S.; Bajerska, J.; Górnaś, P.; Segliņa, D.; Pilarska, A.; Jesionowski, T. Physical and bioactive properties of muffins enriched with raspberry and cranberry pomace powder: A promising application of fruit by-products rich in biocompounds. Plant Foods Hum. Nutr. 2016, 71, 165–173. [Google Scholar] [CrossRef] [Green Version]
  14. Raba, B. Determination of Malting Barley Grain Impurities Using Computer Image Analysis and Artificial Intelligence Methods. Ph.D. Thesis, Institute of Biosystem Engineering, Faculty of Agriculture and Bioengineering, Poznan University of Life Sciences, Poznan, Poland, 2014. [Google Scholar]
  15. Deme, G.D.; Asfaw, B.T.; Gari, M.T. Evaluation of malting potential of different barley varieties. J. Water Pollut. Purific. Res. 2019, 6, 24–35. [Google Scholar]
  16. Bokulichn, N.A.; Bamforth, C.W. The Microbiology of malting and brewing. Microbiol. Mol. Biol. Rev. 2013, 2, 157–172. [Google Scholar] [CrossRef] [PubMed] [Green Version]
  17. da Costa Jardim, C.; de Souza, D.; Machado, I.C.K.M.; Massochin Nunes Pinto, L.; de Souza Ramos, R.C.; Garavaglia, J. Sensory profile, consumer preference and chemical composition of craft beers from Brazil. Beverages 2018, 4, 106. [Google Scholar] [CrossRef] [Green Version]
  18. Siller, A.; Hashemi, M.; Wise, C.; Smychkovich, A.; Darby, H. Date of planting and nitrogen management for winter malt barley production in the Northeast, USA. Agronomy 2021, 11, 797. [Google Scholar] [CrossRef]
  19. Scobie, M.N.; Jones, M.G.K. Identification of barley varieties by protein profiling. In Genetics and Improvement of Barley Malt Quality; SpringerLink: New York, NY, USA, 2010; pp. 99–112. [Google Scholar]
  20. Szczypiński, P.M.; Klepaczko, A.; Zapotoczny, P. Identifying barley varieties by computer vision. Comp. Electron. Agric. 2015, 110, 1–8. [Google Scholar] [CrossRef]
  21. Bietz, J.A. Separation of cereal proteins by reversed-phase high-performance liquid chromatography. J. Chromatogr. 1983, 255, 219–238. [Google Scholar] [CrossRef]
  22. Kotal, F.; Radová, Z. A simple method for determination of deoxynivalenol in cerealsand flours. Czech J. Food Sci. 2002, 20, 63–68. [Google Scholar] [CrossRef] [Green Version]
  23. Porker, K.; Zerner, M.; Cozzolino, D. Classification and authentication of barley (Hordeum vulgare) malt varieties: Combining attenuated total reflectance mid-infrared spectroscopy with chemometrics. Food Anal. Methods 2017, 10, 675–682. [Google Scholar] [CrossRef]
  24. Pantano, P.; La Scala, L.; Olibrio, F.; Galluzzo, F.G.; Bongiorno, C.; Buscemi, M.D.; Macaluso, A.; Vella, A. QuEChERS LC–MS/MS screening method for mycotoxin detection in cereal products and spices. Int. J. Environ. Res. Public Health 2021, 18, 3774. [Google Scholar] [CrossRef]
  25. Wang, J.; Xiaojian Wu, X.; Yue, W.; Zhao, C.; Yang, J.; Zhou, M. Identification of QTL for barley grain size. PeerJ 2021, 9, e11287. [Google Scholar] [CrossRef]
  26. International Seed Testing Association–ISTA International Rules for Seed Testing 2021; International Seed Testing Association–ISTA: Bassersdorf, Switzerland, 2021.
  27. Neuman, M.; Sapirstein, H.D.; Shwedyk, E.; Bushuk, W. Discrimination of wheat class and variety by digital image analysis of whole grain samples. J. Cereal Sci. 1987, 6, 125–132. [Google Scholar] [CrossRef]
  28. Visen, N.S.; Paliwal, J.; Jayas, D.S.; White, N.D.G. AE—Automation and emerging technologies: Specialist neural networks for cereal grain classification. Biosyst. Eng. 2002, 82, 151–159. [Google Scholar] [CrossRef]
  29. Zapotoczny, P. Discrimination of wheat grain varieties using image analysis and neural networks. Part, I. Single kernel texture. J. Cereal Sci. 2011, 54, 60–68. [Google Scholar] [CrossRef]
  30. Mebatsion, H.K.; Paliwal, J.; Jayas, D.S. Automatic classification of non-touching cereal grains in digital images using limited morphological and color features. Comput. Electron. Agric. 2013, 90, 99–105. [Google Scholar] [CrossRef]
  31. Ramirez-Paredes, J.-P.; Hernandez-Belmonte, U.-H. Visual quality assessment of malting barley using color, shape and texture descriptors. Comput. Electron. Agric. 2020, 168, 105110. [Google Scholar] [CrossRef]
  32. Szczypiński, P.M.; Zapotoczny, P. Computer vision algorithm for barley kernel identification, orientation estimation and surface structure assessment. Comput. Electron. Agric. 2012, 87, 32–38. [Google Scholar] [CrossRef]
  33. Kociołek, M.; Szczypiński, P.M.; Klepaczko, A. Preprocessing of barley grain images for defect identification. In Proceedings of the Signal Processing: Algorithms, Architectures, Arrangements, and Applications (SPA), Poznan, Poland, 20–22 September 2017; pp. 365–370. [Google Scholar]
  34. Zaborowicz, M.; Fojud, A.; Koszela, K.; Mueller, W.; Gorna, K.; Okon, P.; Piekarska-Boniecka, H. Dedicates computer system AOTK for image processing and analysis of horse navicular bone. In Proceedings of the 9th International Conference on Digital Image Processing (ICDIP), Hong Kong, China, 21 July 2017; Volume 10420. [Google Scholar]
  35. Neuman, M.R.; Sapirstein, H.D.; Shwedyk, E.; Bushuk, W. Wheat grain colour analysis by digital image processing I. Methodology. J. Cereal Sci. 1989, 10, 175–182. [Google Scholar] [CrossRef]
  36. Paliwal, J.; Shashidhar, N.S.; Jayas, D.S. Grain kernel identification using kernel signature. Trans. ASAE 1999, 42, 1921–1924. [Google Scholar] [CrossRef]
  37. Sabanci, K.; Toktas, A.; Kayabasi, A. Grain classifier with computer vision using adaptive neuro-fuzzy inference system. J. Sci. Food Agric. 2017, 97, 3994–4000. [Google Scholar] [CrossRef]
  38. Szturo, K.; Szczypiński, P.M. Ontology based expert system for barley grain classification. In Proceedings of the Signal Processing: Algorithms, Architectures, Arrangements, and Applications (SPA), Poznan, Poland, 20–22 September 2017; pp. 360–364. [Google Scholar]
  39. Guevara-Hernandez, F.; Gil, J.G. A machine vision system for classification of wheat and barley grain kernels. Span. J. Agric. Res. 2011, 9, 672–680. [Google Scholar] [CrossRef]
  40. Goyal, S. Predicting properties of cereals using artificial neural networks: A review. Sci. J. Crop Sci. 2013, 2, 95–115. [Google Scholar]
  41. Ronge, R.V.; Sardeshmukh, M.M. Comparative analysis of Indian wheat seed classification. In Proceedings of the International Conference on Advances in Computing, Communications and Informatics, ICACCI 2014, IEEE, Delhi, India, 24–27 September 2014; pp. 937–942. [Google Scholar]
  42. Kaur, H.; Baljit, S. Classification and grading rice using multi-class SVM. Int. J. Scient. Res. Publ. 2013, 3, 1–5. [Google Scholar]
  43. Le, V.N.T.; Apopei, B.; Alameh, K. Effective plant discrimination based on the combination of local binary pattern operators and multiclass support vector machine methods. Inf. Process. Agric. 2019, 6, 116–131. [Google Scholar]
  44. Rezvani, R.; Katiraee, M.; Jamalian, A.H.; Mehrabi, S.H.; Vezvaei, A. A new method for hardware design of Multi-Layer Perceptron neural networks with online training, Conference Paper. In Proceedings of the 2012 IEEE 11th International Conference on Cognitive Informatics and Cognitive Computing, Kyoto, Japan, 22–24 August 2012. [Google Scholar]
  45. Sildir, H.; Aydin, E.; Kavzoglu, T. Design of feedforward neural networks in the classification of hyperspectral imagery using superstructural optimization. Remote Sens. 2020, 12, 956. [Google Scholar] [CrossRef] [Green Version]
Figure 1. Beer production (own source).
Agriculture 11 00732 g001
Figure 2. The test stand used to capture images under the project.
Agriculture 11 00732 g002
Figure 5. The creational pattern of a neural classifier.
Agriculture 11 00732 g005
Figure 6. The design of four training sets of the MATLAB Neural Network Toolbox.
Agriculture 11 00732 g006
Figure 7. The structure of the model of the MLP 15:15-15-3:3 neural network type generated by the Neural Network Toolbox (MATLAB).
Agriculture 11 00732 g007
Table 1. Details of the three selected varieties of barley.
SpecificationBeatrixSebastianXanadu
Brewing quality5.106.856.60
Extract potential377
Wort viscosity777
Kolbach index766
Table 2. The preliminary outcomes of neural network processing using the Neural Network Toolbox.
Model SpecificationGeometrical
Parameters
Shape
Factors
Colour
Values
Texture
Coefficients
Best ANNMLP
14:14-18-3:3
MLP
12:12-11-3:3
MLP
15:15-15-3:3
MLP
5:5-13-3:3
Quality of training0.6700.5730.9670.647
Quality of validation0.6600.5930.9520.633
Quality of testing0.5670.5870.9490.680
Training error0.3930.4200.1200.392
Validation error0.4000.4220.1220.410
Testing error0.4340.4280.1350.377
Publisher’s Note: MDPI stays neutral with regard to jurisdictional claims in published maps and institutional affiliations.

