Article

Relationship between Maize Seed Productivity in Mexico between 1983 and 2018 with the Adoption of Genetically Modified Maize and the Resilience of Local Races

by
Alberto Santillán-Fernández
1,2,
Yolanda Salinas-Moreno
3,*,
José René Valdez-Lazalde
4,
Mauricio Antonio Carmona-Arellano
5,
Javier Enrique Vera-López
5 and
Santiago Pereira-Lorenzo
6
1
Catedrático-Conacyt, Colegio de Postgraduados Campus Campeche, Champotón, Campeche 24450, Mexico
2
International Doctorate Program of Agricultural and Environmental Sciences of the Universidad de Santiago de Compostela, Galicia, 27002 Lugo, Spain
3
Department of Genetic, Instituto Nacional de Investigaciones Forestales, Agrícolas y Pecuarias, Campus Altos de Jalisco, Tepatitlán de Morelos, Jalisco 47600, Mexico
4
Department of Forestry, Colegio de Postgraduados Campus Montecillo, Texcoco, Estado de México 56230, Mexico
5
Department of Agricultural Sciences, Colegio de Postgraduados Campus Campeche, Champotón, Campeche 24450, Mexico
6
Department of Plant Production and Engineering Projects, Escuela Politécnica Superior, Universidad de Santiago de Compostela. Galicia, 27002 Lugo, Spain
*
Author to whom correspondence should be addressed.
Submission received: 4 July 2021 / Revised: 30 July 2021 / Accepted: 31 July 2021 / Published: 3 August 2021
(This article belongs to the Section Seed Science and Technology)

Abstract

:
Mexico depends on maize imports to satisfy its national demand. The use of native maize varieties among subsistence farmers can help to reduce the cereal’s imports. However, the agricultural policy in Mexico to improve the productivity per hectare has centered on the use of improved varieties; among them, the transgenic variety. In this study, the maize productivity in Mexico from 1983 to 2018 was analyzed to determine the influence of agricultural policies in the sector, and the factors that condition the adoption of transgenic maize. It was found that the agricultural policy improved the productivity of those regions with irrigation; however, for rainfed regions, the expected technological changes were not achieved because the ancestral tradition in cultivation, associated with the greater variety of native maize and to a larger indigenous population, was stronger. The adoption of transgenic maize also had low significance in the rainfed regions, since the increase in field yields is not economically profitable with regards to the increase in production costs. Therefore, the agricultural policy to increase productivity ought to be directed at the protection of subsistence farmers, revaluing the use of native varieties that have shown higher resilience to technological and environmental changes.

1. Introduction

Maize (Zea mays L.) is the cereal of highest production worldwide, above wheat (Triticum aestivum L.) and rice (Oryza sativa L.); it constitutes the basis of the human diet for countries of Latin America [1], where Mexico is considered its center of origin [2]. However, Mexico is not the main producer of maize in the world; 57.35% of the world production is concentrated in two countries, the United States of America (USA, 35.42%) and China (21.93%) [1].
Unlike Mexico, USA bases its productivity on the use of transgenic maize varieties, which provide higher yields in the field than conventional varieties, which allows the USA to have yields higher than 10 t ha−1 while Mexico obtains on average 3.33 t ha−1 [3]. In Mexico, maize production is carried out using improved varieties and native varieties, since 64 native maize races are cultivated derived from the millenary domestication process of its wild relative teosinte combined with different environments, agricultural systems and ethnic groups, which confers it great agro-diversity [4].
In Mexico, approximately 7 million hectares of grain maize are grown, with a production of 23 million tons. However, national consumption is around 39 million tons, so the deficit is resolved with imports of grain from the United States of America [1]. This scenario seems difficult to revert in the short term because the per capita consumption went from 123 kg in 2000 to 196 kg in 2018 [5], with a population that annually increases in one million people with a total of 125 million in 2018 [6].
To guarantee food security of grain maize in Mexico, the national agricultural policy has established strategies and programs whose goals have been to increase the field yields and to increase the profitability for producers [7,8]. Thus, in 1994, in the Program for Direct Support to the Farmland (Programa de Apoyos Directos al Campo, PROCAMPO) [9], in the six-year period of 2007–2012, the use of genetically modified maize varieties was fostered [10]; and since 2012 the Sustainable Modernization of Traditional Agriculture Program (Modernización Sustentable de la Agricultura Tradicional, MasAgro) was created [11].
The objective of the PROCAMPO program was not only to increase grain maize production through the increase of the surface planted (ha), but also to standardize the property rights on the land [9]; meanwhile, the MasAgro program attempts to make social agriculture for subsistence more productive, to satisfy the demands of the grain and family supply [11]. In contrast with these two programs that have been applied, the strategy of producing genetically modified maize varieties to increase the yields in the field has not been implemented [12].
Santillán-Fernández et al. [13] consider that the analysis of agricultural productivity helps to understand and improve the competitiveness of a crop, when studying the interaction of the surface planted with the yields in the field, where the soil preparation and sowing techniques are manifested with the practices of agronomic management and the adoption of new production technologies. To analyze agricultural productivity, the decomposition of the production growth factors model proposed by [14] has proven to be an efficient methodology that accurately determines the influence of field yields, surface planted and the interaction of both, on production growth in a final period compared to an initial period.
The decomposition of growth factors model of agricultural production has been applied with good results in the analysis of sectors such as fruits and vegetables [15], fruticulture [16], and specific crops such as sugarcane (Saccharum officinarum L.) [13] and vanilla (Vanilla planifolia Jacks. ex Andrews) [17]. An important factor for the productivity of an agricultural sector to improve is the adoption of new technologies of production, where the age, level of studies, size of the plot, and family income that the activity represents for producers are factors that condition the adoption [18].
In this context, the objective of this study was to analyze the productivity of grain maize in Mexico from 1983 to 2018 through the decomposition of production growth factors model, to determine the influence that agricultural policies have had on the growth of the sector, and the factors that condition the adoption of genetically modified maize. The starting hypothesis is that the low productivity of grain corn in Mexico is associated with the water production regime, which in turn is a factor that influences the decision of the producer at the time of selecting the variety to be cultivated, and therefore influences the adoption of transgenic varieties.

2. Materials and Methods

2.1. Global Maize Production and Consumption

Data were obtained from the Food and Agriculture Organization of the United Nations (FAO) about the following: production (t), surface planted (ha), field yield (t ha−1), consumption (t), imports (t) and exports (t) of the main grain maize producer and consumer countries in the world for the period 2007–2018 [1].

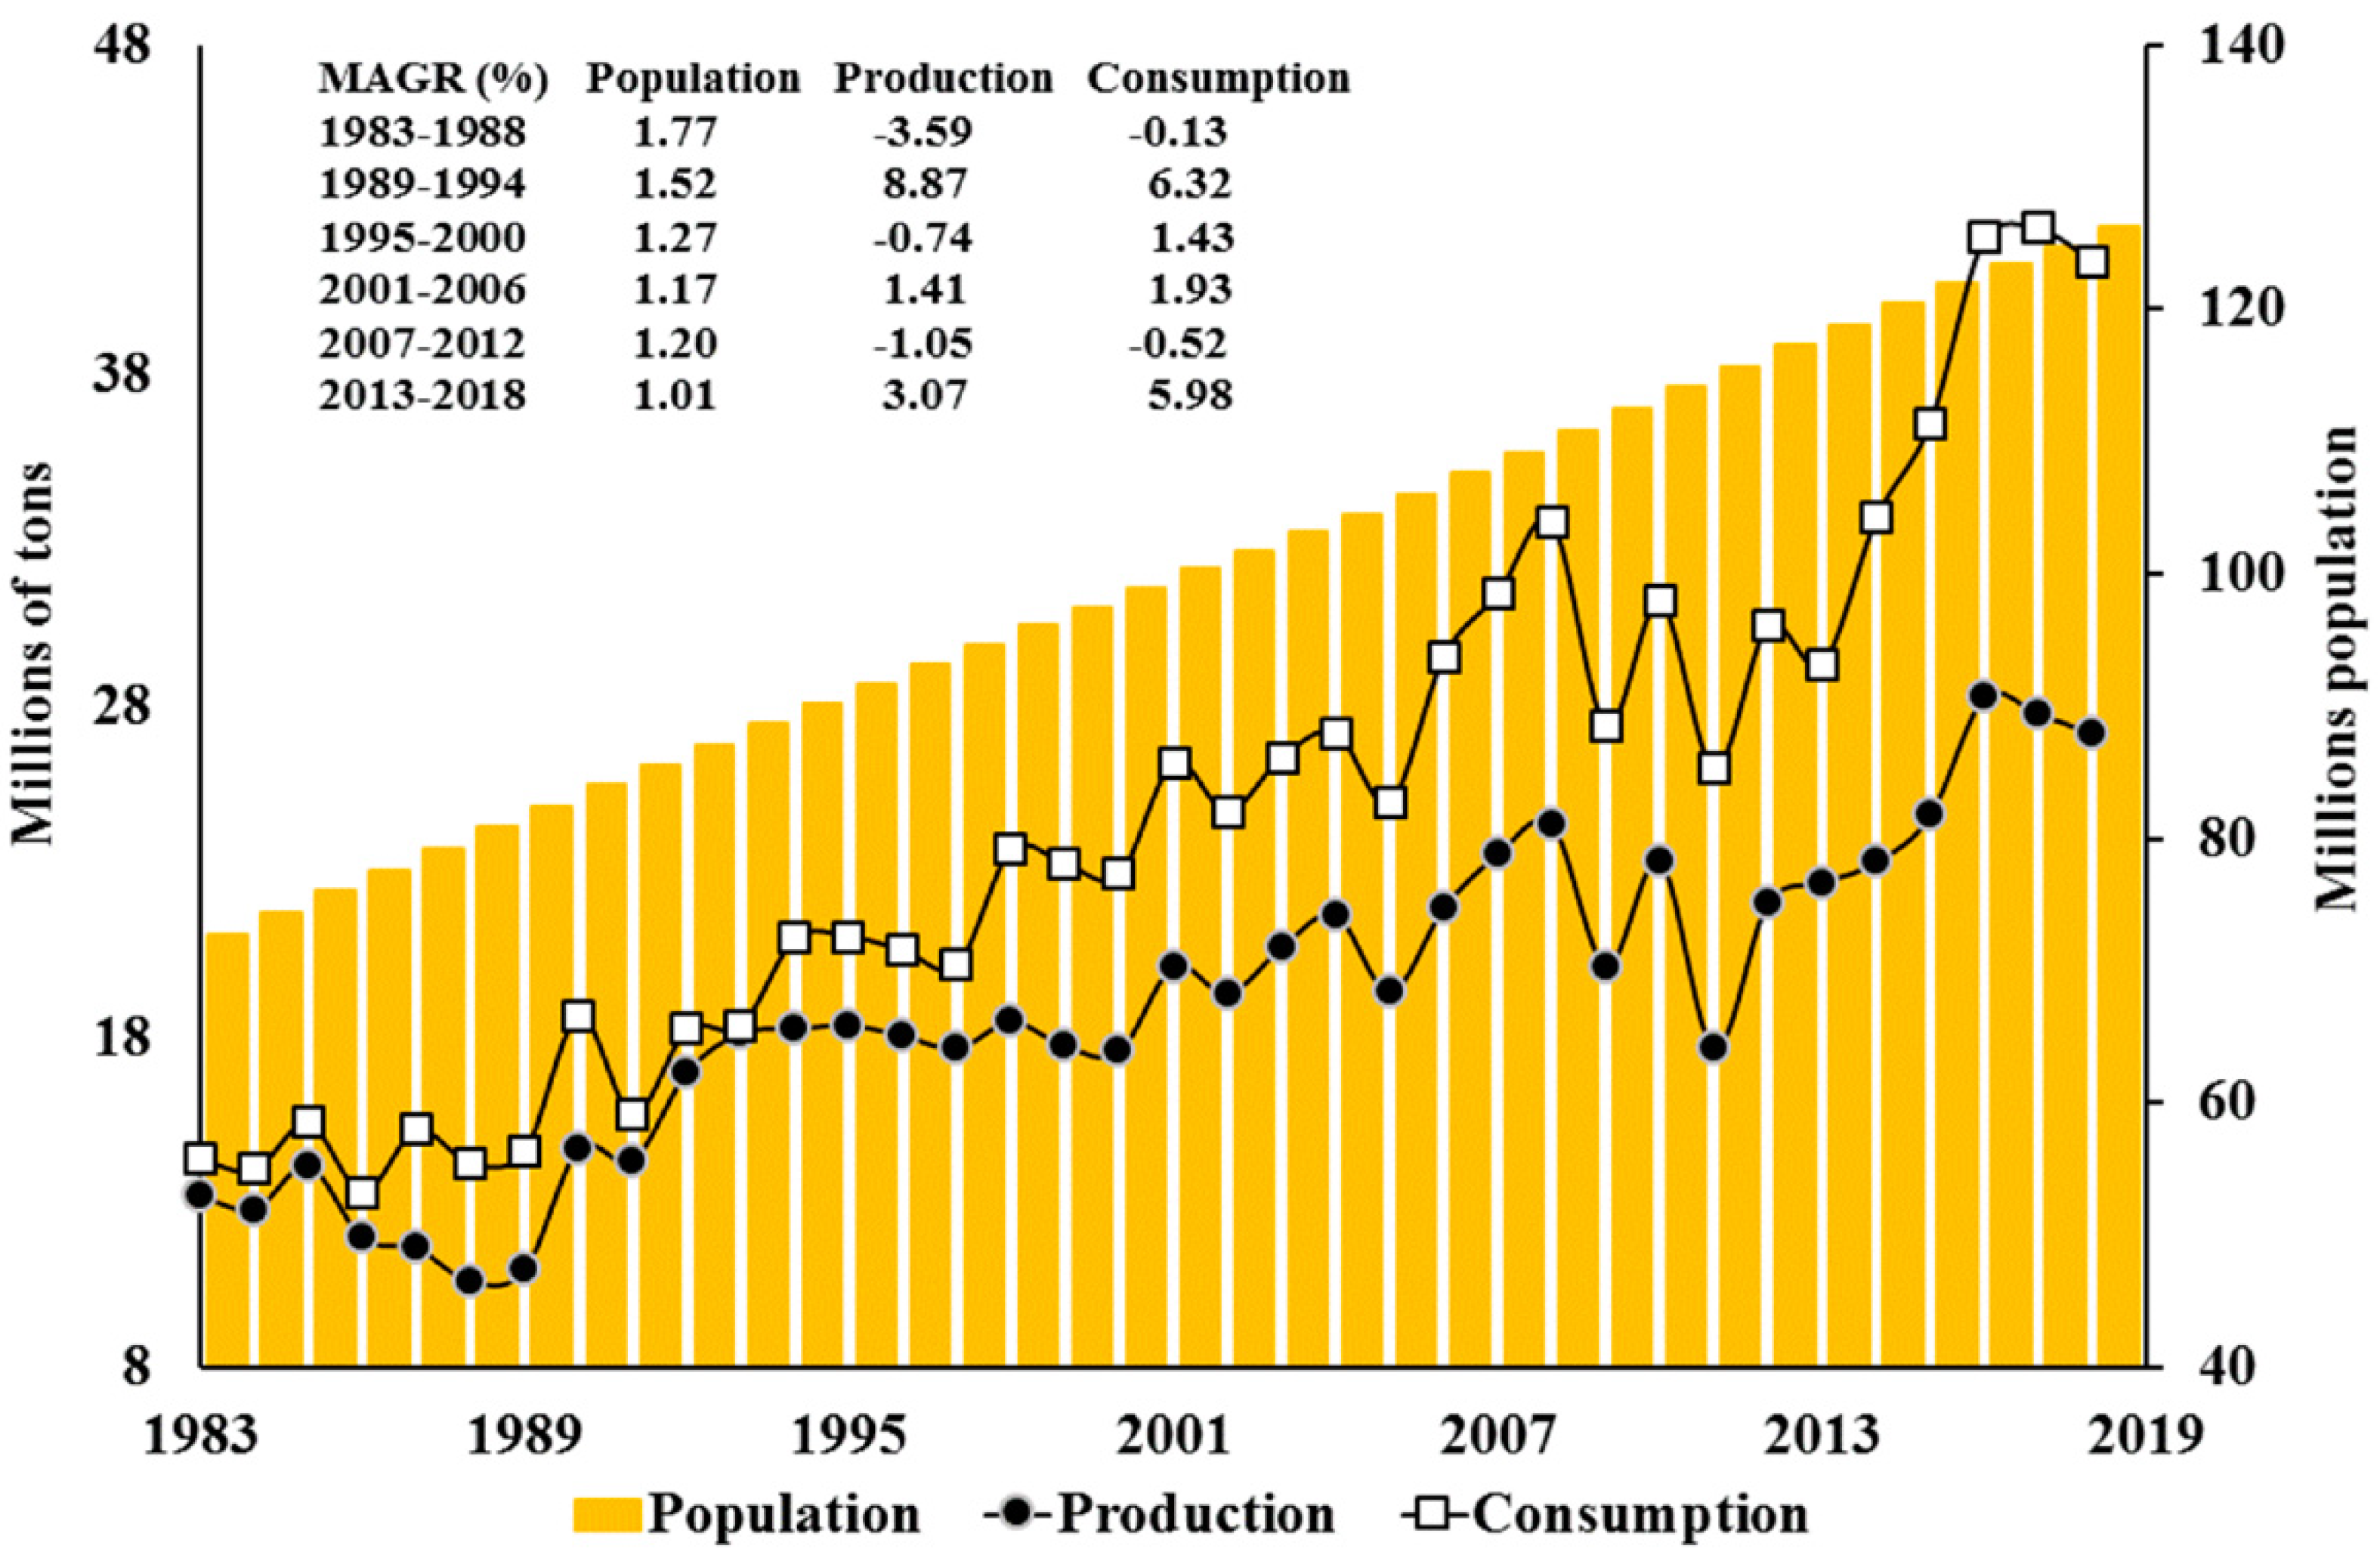
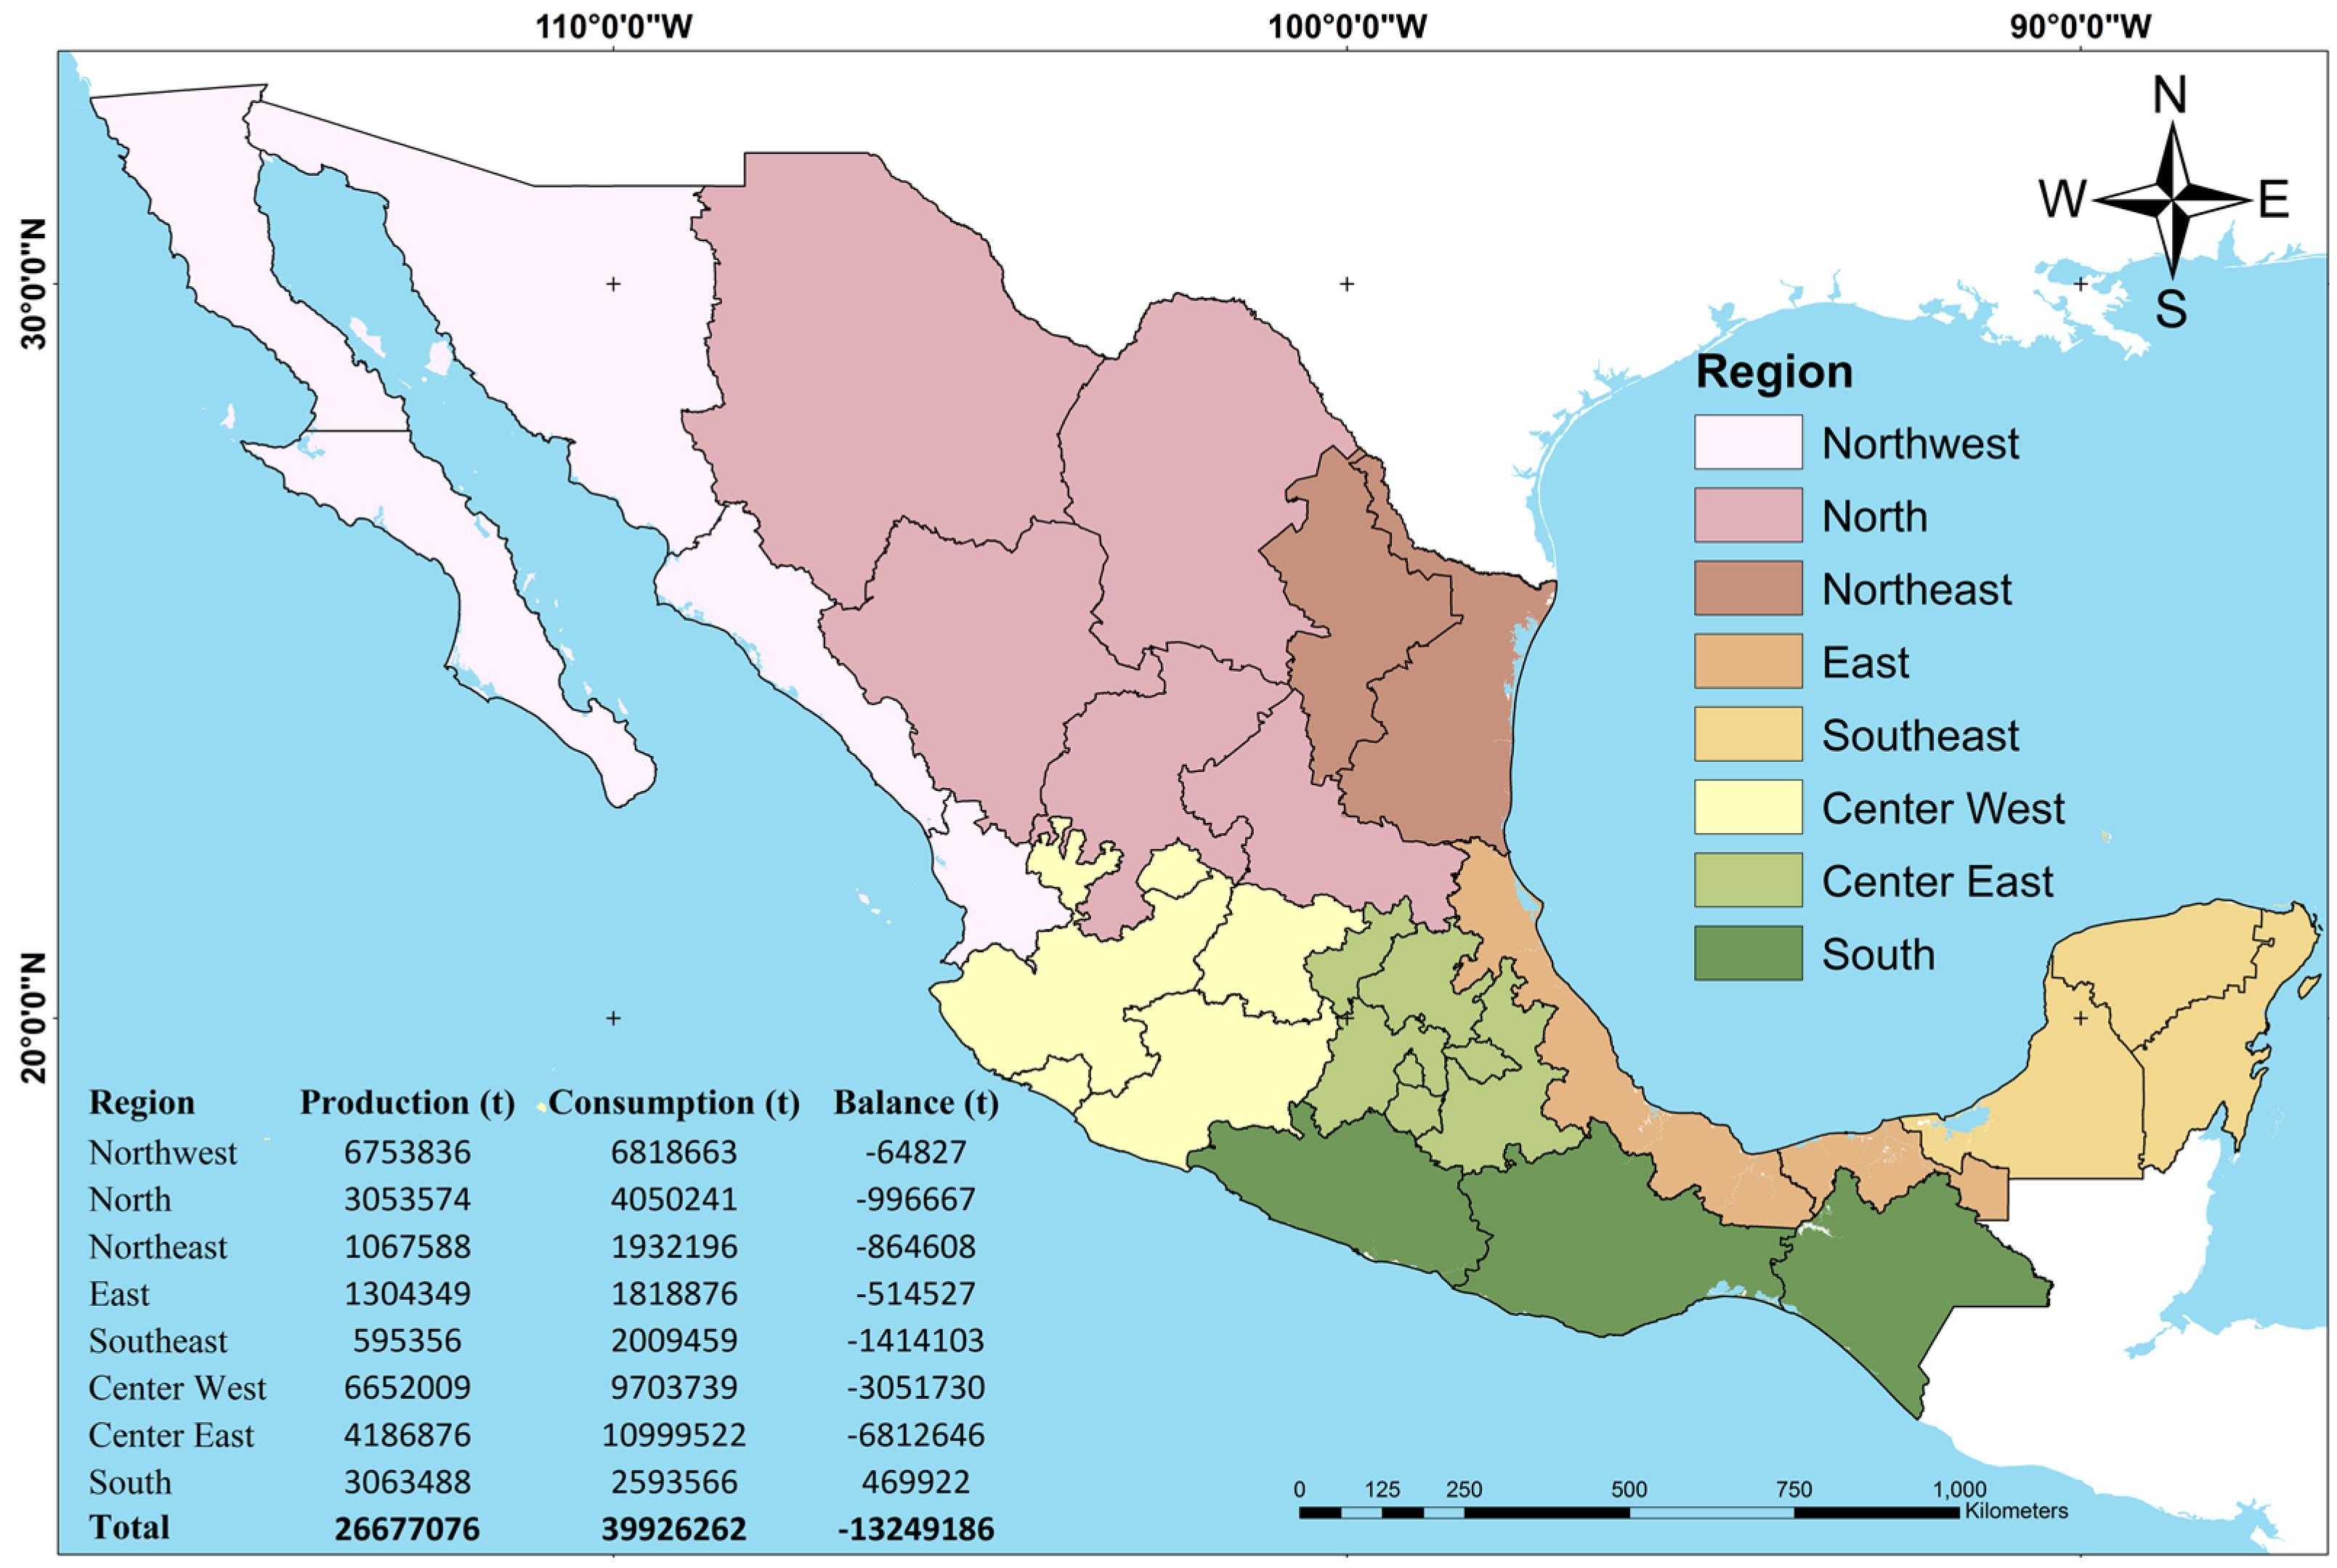
2.2. Maize Production and Consumption in Mexico

Data about grain maize production (t), consumption (t), and number of inhabitants (population) from 1983 to 2018 in Mexico were obtained from FAOSTAT [1]. The 1983–2018 series was divided into six-year periods, according to the six-year periods of governments in Mexico: 1983–1988, 1989–1994, 1995–2000, 2001–2006, 2007–2012 and 2013–2018. In each period, the Mean Annual Growth Rate (MAGR) in % was calculated for each variable.
The following variables were obtained from the Agricultural and Fishing Information System [19]: production (t), surface planted (ha), field yield (t ha−1), and consumption (t) of grain maize at the state level from 1983 to 2019. The first three variables were obtained for the two production cycles that are found in Mexico: Spring–Summer (SS) and Fall–Winter (FW) in the two modalities, irrigation and rainfed. For the case of consumption (t), there was only information available starting from the period 2013–2018. The classification of Mexico’s economic zones proposed by [20] was taken as a reference to obtain the average balances of 2013–2018 on production minus consumption per region.

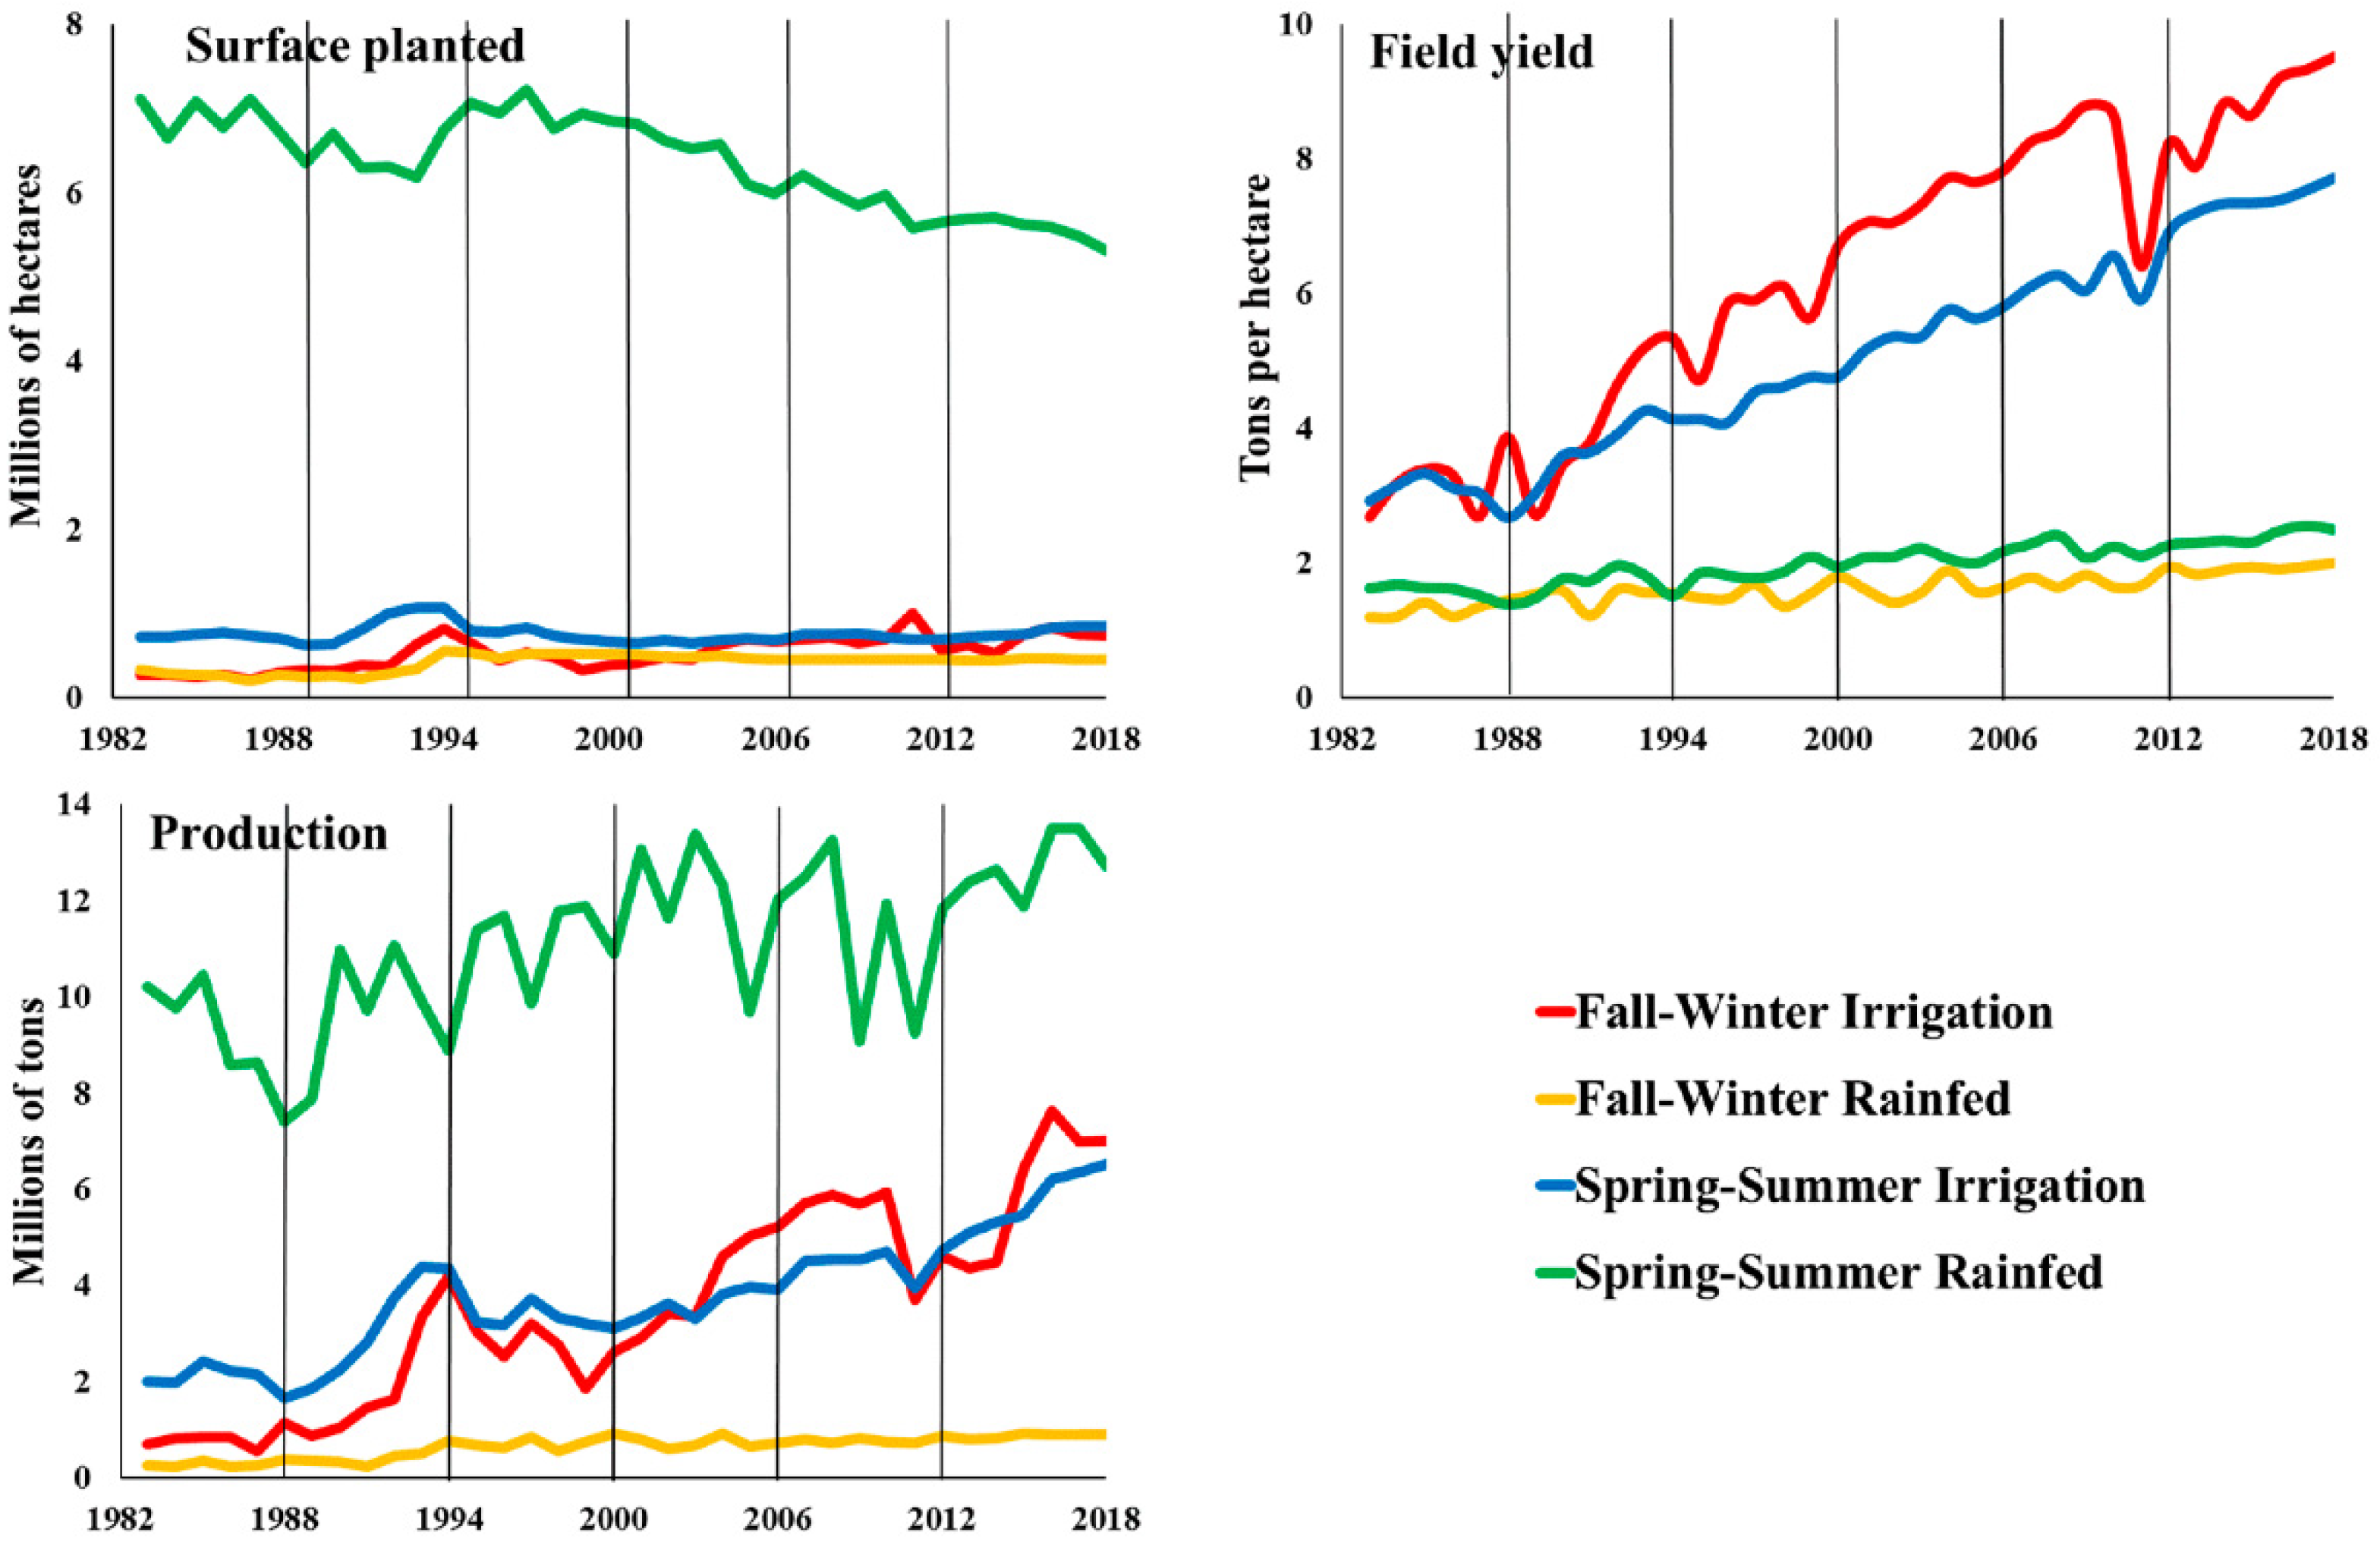
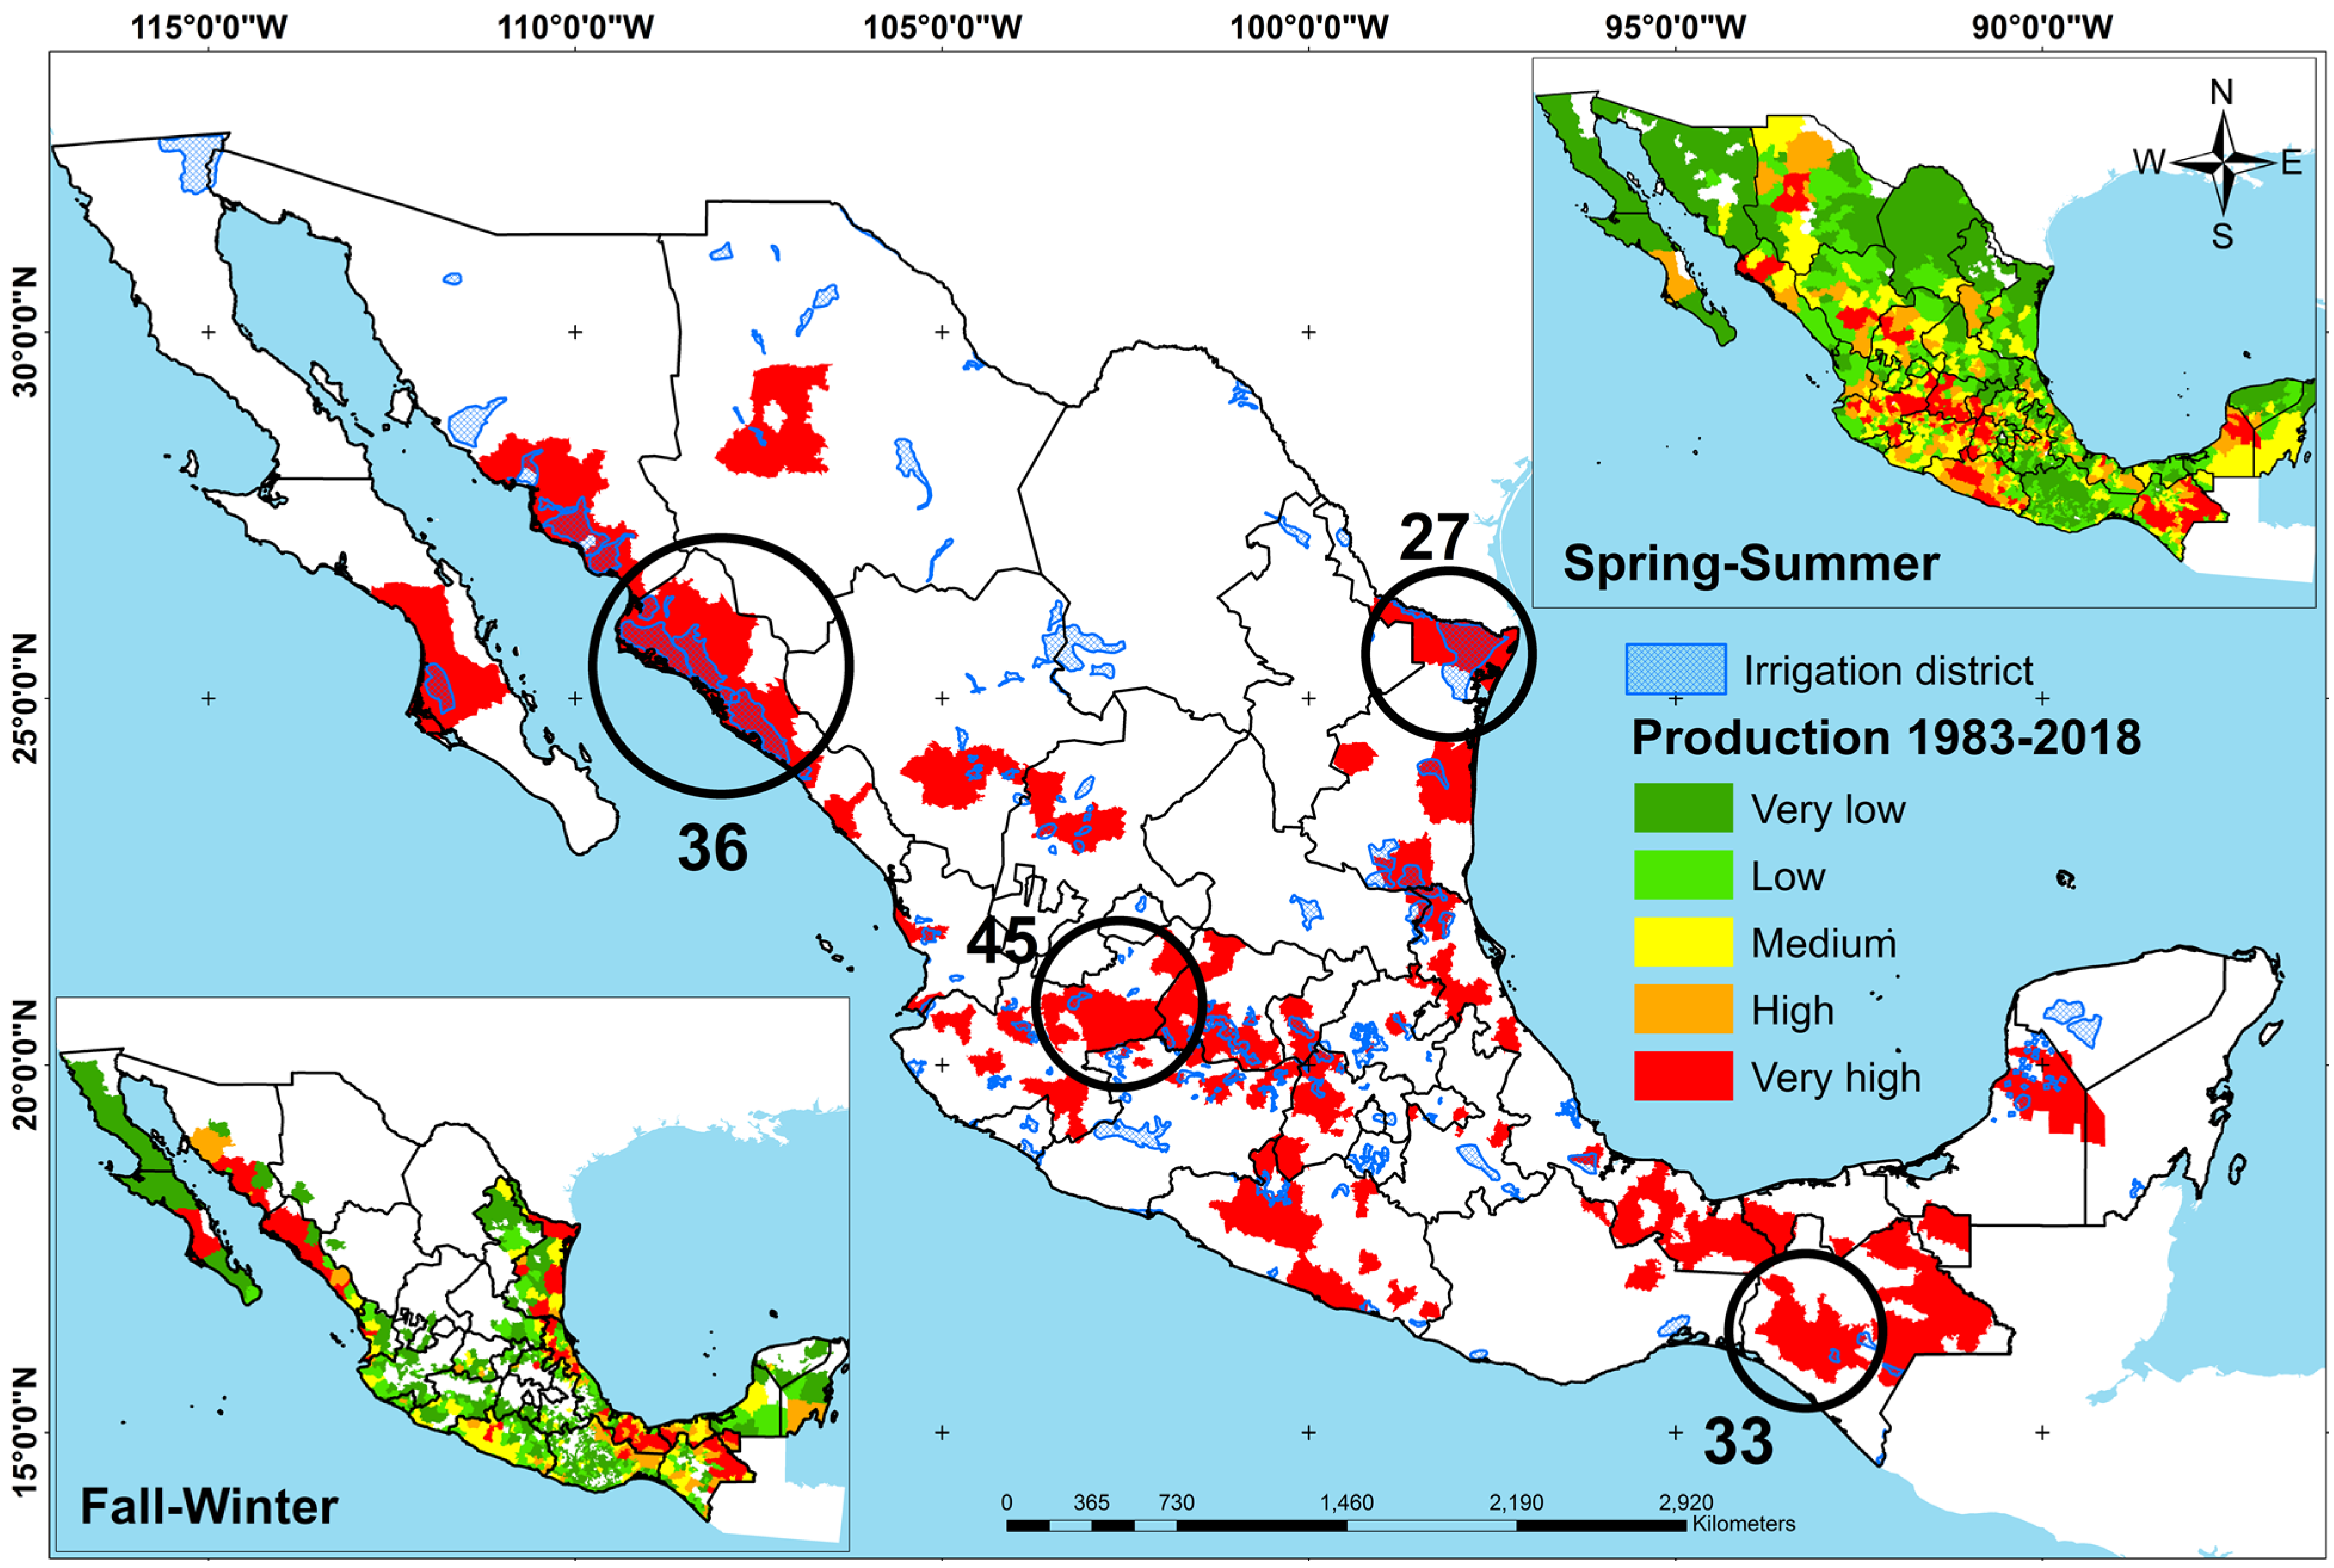
2.3. Grain Maize Productivity in Mexico

To analyze the grain maize productivity at the national and state level, the decomposition of production growth factors model proposed by [14] was used. The model determines in percentage the influence that field yields (FY), surface planted (SP), and the FY×SP interaction have on the production growth in a final period compared to an initial period.
The periods analyzed were 1983–1988 versus 1989–1994, 1989–1994 versus 1995–2000, 1995–2000 versus 2001–2006, 2001–2006 versus 2007–2012, and 2007–2012 versus 2013–2018. In addition, the methodology proposed by [13] was used to classify the states where production increased and those where it decreased in 2013–2018 compared to 2007–2012 (Table 1).
The national productivity was also analyzed through an analysis of variance, the significant differences for the variables production (t), surface planted (ha), and field yield (t ha−1) for the periods 1983–1988, 1989–1994, 1995–2000, 2001–2006, 2007–2012 and 2013–2018 were determined with Tukey’s means test with a reliability of 95 % (α = 0.05).

2.4. Indicators of GMO Maize Adoption

Data were obtained from the Agricultural and Fishing Information System [19] for grain maize production (t) of the municipalities that showed continuous operations from 1983 to 2018 in SS and FW. To determine the areas of highest productivity, the annual production per municipality for the period of analysis was added, and through tools of Geographic Information Systems, it was represented spatially. The results were grouped into five class intervals: very low, low, medium, high and very high production, both for SS and FW.
Finally, to determine whether producers from the main grain maize-producing regions in Mexico are willing to adopt GMO maize, a survey was applied between August and November, 2017. The criteria used to select producers were their availability and references in the region, and they were called on by state agencies from the Ministry of Agriculture, Livestock Production, Rural Development, Fishing and Food. The survey included questions about age (years), schooling (years of study), experience in the activity (years), surface planted (ha), field yield (t ha−1) in SS and FW, and family income represented by the activity (%), as well as the question: Would you adopt GMO maize?

3. Results and Discussion

3.1. Grain Maize Production and Consumption at the Global Level

Out of the global production of grain maize from 2007–2018, 73.76% was concentrated in 5 countries, with USA (35.42%) and China (21.93%) as the main producers, followed by Brazil (9.34%), Argentina (4.59%) and Mexico (2.48%) (Table 2). The production from USA and China in the analysis period was based on the broad surface planted that was destined to the maize crop, and to the good field yields, which for the case of China (5.71 t ha−1) were only exceeded by Argentina (6.85 t ha−1).
The intensive model of maize production that has been developed in USA is the result of the interaction of mechanized systems with the adoption of transgenic varieties, which allows for obtaining the best field yields of the world (9.93 t ha−1) [7]. In Latin America, Brazil (third world producer) and Argentina (fourth) also base their production in the use of transgenic maize varieties [21]. For the case of Mexico, the low field yields that it presented (3.33 t ha−1) are the result of the combination of native varieties with traditional rainfed production systems, which according to [22,23] are explained by the ethnography and culture of the country, since it is the center of origin of maize.
The maize that is imported in Mexico comes from the USA [7], so authors such as [24,25] maintain that the aversion of the Mexican population toward transgenic maize is unjustified, since the deficit between production and consumption is actually covered with transgenic maize. In this regard, [4] found that the cultivation of native races in Mexico contributes to imports of the grain being lower and ensures food security of the regions with greatest social backwardness, where, in addition, the native races show higher resilience to the rainfed environmental conditions, which has allowed them to remain in the preference of subsistence producers [26,27].

3.2. Maize Production and Consumption in Mexico

The deficit between production and consumption, which Mexico has historically showed, had its origin in the 1970s when the agrifood policy of the country encouraged the import of the grain in face of high production costs [28]. Since 1994, the difference between production and consumption shows a growing trend (Figure 1), and this fact coincides with the signature of the North American Free Trade Agreement (NAFTA) that Mexico established with USA and Canada.
According to [29], the signature of NAFTA caused Mexico to increase the imports of grain maize, by reducing the import customs fees. However, NAFTA only evidenced the productivity problems of the Mexican farmland with negative MAGR, which have been worsened by the sustained increase of the population that demands more grain maize with a per capita mean of 196 kg (Figure 1) [5].
The agrifood policy in Mexico in the six-year period of 1983–1988 caused the MAGR of this period to be negative (−3.59%), since imports were prioritized over the programs to strengthen the farmland [30]. The largest increase in production happened in the six-year period of 1989–1994 (MAGR, 8.87%) with the Program for Direct Support to the Farmland (Programa de Apoyos Directos al Campo, PROCAMPO) [9], which not only entailed strategies to improve competitiveness but also regularized the property rights over land. The social and economic crisis that Mexico experienced in the period of 1995–2000 had an impact on the national agricultural productivity, and maize (MAGR, −0.74%) was not the exception [30].
The enactment of the Rural Sustainable Development Law (Ley de Desarrollo Rural Sustentable, LDRS) in 2001 [31] meant there was an upturn for the agricultural sector in the six-year period of 2001–2006 (MAGR, 1.41%). However, in the period of 2007–2012 with the national policy of allowing GMO maize cultivation, the productivity decreased (MAGR, −1.05%) due to the uncertainty generated among small-scale producers [24]. In the last six-year period (2013–2018) with the MasAgro program, national production increased through the use of native maize varieties (MAGR, 3.07%) with small-scale producers [32]. Despite all these efforts, grain maize production in Mexico is insufficient to guarantee food security of a population in continuous growth [33].
Grain maize production in Mexico is performed in two periods: Spring–Summer (planted in May and harvested in October) and Fall–Winter (planted in December and harvested in May), both in two modalities, irrigation and rainfed. The technological gap between the regions of irrigation and rainfed production is evident in the field yields (Table 3); while for irrigation they are higher than 7 t ha−1, for rainfed they are lower than 2 t ha−1. Donnet et al. [32] attributed these differences not only to the irrigation systems, but rather to the use of improved varieties, because maize production in irrigation is for industrial use, while rainfed is normally for subsistence with native seeds selected from previous harvests.
Out of the surface planted with grain maize in Mexico, 73.98% depends on summer rains and contributes 49.83% of the total production, and it develops in a context of subsistence, with low technological level and inadequate agronomic management [32] resulting in field yields of 2.42 t ha−1 (Table 3). This is different from irrigation zones where 46.75% of national production was obtained in 19.91% of the surface planted, with average yields higher than 7 t ha−1. In Mexico, for every 1 ha of irrigation cultivation, 4 ha are planted in rainfed conditions, and for every ton of grain maize in rainfed conditions, 3.76 t were obtained with irrigation.
The problem of low rainfed grain maize productivity has been documented by [7,28,32]. These authors agree that the problem is spatial, seasonal and cultural, since more than 80% of the producers, particularly in the southeast of the country, cultivate grain maize of native varieties in plots of less than 2 ha, in the ancestral milpa system (association of native maize with bean -Phaseolus vulgaris- and squash -Cucurbita spp.-), with rudimentary low-cost farming tasks (cultivation management).
The growing trend in the production of grain maize for the SS-Rainfed cycle can be reverted in the short term, as consequence of the reduction of the surface planted since the year 2000 and a null growth of field yields in the same cycle (Figure 2). In this regard, [33] considers that the constant production of grain maize that Mexico has maintained in the last decade is due to the increase in productive efficiency, particularly in the irrigation areas, which compensates the low productivity per surface planted in the rainfed areas.
To determine the regions in Mexico with the highest deficits between production and consumption, the classification proposed by [20] was used, which divides the country into eight economic zones based on the existence of natural resources that allow certain productive activities and on the degree of development of the production forces. The Center East (6.81 million tons, which represents 51.65% of the national deficit), Center West (2.99 million tons, 22.68%) and Southeast (1.41 million tons, 10.72%) were the zones with the highest deficit of grain maize; in total, the three regions added up to 85.05% of national deficit (Figure 3).
According to [6], the highest grain maize deficit shown by the Center East region (51.65% of the national deficit) is due to two factors: it is the region with the highest number of inhabitants in urban zones (33.81% of the national total), and mostly represents industrial, non-agricultural activity. In contrast, the South region was the only zone in the country without deficit; this zone was characterized by containing the highest diversity of native maize races, with the highest levels of indigenous (rural) population, in addition to being a region with subsistence agriculture and rudimentary production systems that depend on summer rains [22,23]. The demographic and economic differences between both regions expose the capacity of rural zones to produce their own food, so the challenge is: How to feed the cities? [34,35].

3.3. Grain Maize Productivity in Mexico

When analyzing the production of grain maize in Mexico from 1983 to 2018, through Tukey’s means tests, a continuous significant increase was found in each six-year period, as a result of an improvement in the field yields that compensated the reduction of the surface planted (Table 4). However, when using the decomposition of production growth factors model proposed by [14], the apparent efficiency in the production system did not consider that the growth of grain maize productivity between six-year periods presented a decreasing trend, since it went from 16.4% in 1995–2000 compared to 1989–1994, to 6.9% in 2013–2018 compared to 2007–2012 (Table 5).
According to [8,25] the growth from 1983 to 2000 is explained by the strengthening of the policies for centralized support in agricultural production, technological research, guarantee prices, use of improved varieties and fertilizers, supports for commercialization, credit, and agricultural insurance. The decrease in productivity since 2001 coincides with a stage of policies for decentralized support to the farmland, where the private sector participated in technological changes, research, dissemination, and promotion of input use; and where producers made their own decisions about the destination of the subsidies contributed by the government [25]. In this regard, [18] found that the agricultural competitiveness of the local and subsistence production systems is strengthened as the government establishes mechanisms to monitor and evaluate, since in most cases the producers channel part of the subsidies as a complement to the family income.
In 2013–2018 the productivity of grain maize at the national level had a growth of 6.9% compared to 2007–2012, as a response to an increase in the efficiency of field yields (10.5%) (Table 5). When analyzing the productivity of grain maize by states, it was found that 20 out of the 32 states had growth, from which 11 were managed under a rainfed water regime and nine under irrigation (Table 6).
Villegas et al. [11] consider that the growth in grain maize productivity of rainfed areas is explained by the inclusion of federal programs such as MasAgro that develop regional strategies of sustainable intensification of maize production, through innovation networks composed by research platforms, demonstrative modules, and extension areas where sustainable agronomic technologies and practices are evaluated, developed and adapted, which promote the use of improved maize seeds [36]. Carpentieri-Pípolo et al. and Sales-Rocha et al. [37,38] found that native maize varieties cultivated in a traditional system tend to stand out in comparison to commercial varieties in the long-term, because the native varieties have genotypes capable of responding better to abiotic and biotic stress, providing a better stability of the yield.
However, [33] found that the rainfed areas with grain maize production in Mexico are the most vulnerable to the effects of the future climate. This scenario is especially critical because nine out of the 12 states that presented reductions in their productivity are managed under rainfed conditions (categories D, E and F). The states that reduced their productivity are located mostly in the center and south of the country (Table 6), in the South economic region [20], where there is currently no deficit between production–consumption and where the greatest variety of native maize and indigenous population are concentrated [22,23].
The reduction in grain maize productivity of 12 states (categories D, E and F) represented 45.10% of the surface planted for the period of 2013–2018, with a production of 26.90% of the national total, and with average field yields of 2.15 t ha−1. On the contrary, eight states (Category C) produced 52.45% of the national total in 31.28% of the surface planted with field yields higher than 10 t ha−1 (Table 6).
The increase in grain maize productivity of the states located in category C was because they managed to make their field yields more efficient, since their surfaces planted decreased. Two factors explained the increase in the field yields: use of improved maize seeds [11] and use of irrigation [39], whether in their totality as in the case of Sinaloa (main maize producer in Mexico) or with irrigation that aids the summer rains (rainfed) in Jalisco (second producer) and Estado de México (third producer).
However, two states that are a reference in grain maize production at the national level presented a reduction in their productivity: Guanajuato (fifth producer, category D) and Chiapas (7, F), which compromise 11.1% of the national production (Table 6). The low productivity showed by Guanajuato was due to the reduction of its field yields because of the strong competition over the use of water with other cyclic crops such as berries and vegetables [40]. For the case of Chiapas, the reconversion of the maize production areas to more profitable crops explains why both the surface planted and the field yields have decreased [41].

3.4. Indicators of GMO Maize Adoption

When adding the annual production in t per municipality from 1983 to 2018 per production cycle SS and FW, and grouping this production in class intervals: very low, low, medium, high and very high; it was found that the main grain maize-producing regions in the SS cycle were located in the states of Jalisco and Chiapas, while for the FW cycle they were located in Sinaloa and Tamaulipas. In these regions, a total of 141 surveys were applied to key producers: Jalisco (45), Chiapas (33), Sinaloa (36) and Tamaulipas (27) to determine the factors that condition the adoption of GMO maize in Mexico (Figure 4).
Mwangi and Kariuki [42] found that the factors that condition the adoption of new technologies in the production systems of small-scale agricultural producers are associated with age, schooling, size of the plot, and importance that the activity represents in the family income. When characterizing the producers from the main grain maize-producing regions in Mexico, it was found that the size of the plots and the % that the activity represents for the family income (FI) seem to condition the adoption of GMO maize (Table 7).
From the producers, 56% answered that they are willing to adopt GMO maize particularly in the regions that are managed with irrigation (Sinaloa and Tamaulipas), the remaining 44% sustained their negative in the environmental conditions (rainfed) of their production areas (Jalisco and Chiapas). Of the total producers, 94% said they were aware that the use of transgenic varieties increases production costs. Noriero-Escalante and Massieu-Trigo [43] found that the regions with commercial maize production are more prone to the adoption of GMO maize because the increase in their production costs is less significant than in the areas with subsistence production.
González-Estrada and Alferes-Varela [28] found that the main problems in maize cultivation in Mexico are associated with the low productivity per the surface planted, a problem that GMO maize does not resolve, since the increase in field yields is not economically profitable with regard to the increase in production costs [24]. Hernández-Hernández et al. [25] found that the economic and agronomic potential of the adoption of genetically modified maize seeds in Mexico has been unviable because the improved seeds proposed solve problems related to resistance to glyphosate and corn budworm, factors that historically have not been a problem in the production of grain maize in Mexico.

4. Conclusions

The agricultural policy in Mexico during the period of 2013–2018 fostered grain maize production through the Sustainable Modernization of Traditional Agriculture, compared to the period 2007–2012, when the use of transgenic varieties was promoted. Despite these efforts to modernize the cultivation with a view of high yields through the intensive use of inputs and improved seeds, the technological changes expected were not achieved in the center and south of the country; the ancestral tradition has been stronger in the crop, associated with the greater variety of native maize varieties and a larger indigenous population. The production regions under rainfed conditions showed the greatest decreases in productivity and the lowest levels of adoption of transgenic varieties; the main reason for this exposed by producers is the increase in production costs, which is why producers prefer the cultivation of native varieties. Therefore, the agricultural policy to increase productivity ought to be directed toward the protection of subsistence farmers, revaluing the use of native and resilient varieties, and strengthening the hydro-agricultural infrastructure in rainfed areas.

Author Contributions

Conceptualization, information analysis and writing of original draft, A.S.-F.; Data review and monitoring results, Y.S.-M.; Information analysis and writing of final manuscript, J.R.V.-L.; Writing, revising and editing of the final manuscript, M.A.C.-A.; Writing, revising and editing of the final manuscript, J.E.V.-L.; Writing, revising and editing of the final manuscript, S.P.-L. All authors have read and agreed to the published version of the manuscript.

Funding

This research received no external funding.

Institutional Review Board Statement

Not applicable.

Informed Consent Statement

Not applicable.

Data Availability Statement

The data are available with the author for correspondence, at reasonable request.

Acknowledgments

This study is part of the doctoral thesis of the first author in the International Doctorate Program of Agricultural and Environmental Sciences of the Universidad de Santiago de Compostela, Spain; and to Project number 364. Sustainable productive reconversion for the development of rural producers in Campeche, assigned to the first author by the Consejo Nacional de Ciencia y Tecnologia (CONACyT). To the anonymous reviewers of the article, for their comments, which helped to enrich the research.

Conflicts of Interest

The authors declare no conflict of interest.

References

  1. FAOSTAT. The Food and Agriculture Organization Corporate Statistical Database. Crops. Available online: http://www.fao.org/faostat/es/#data/QC (accessed on 17 February 2020).
  2. Dyer, G.A.; Taylor, J.E. A crop population perspective on maize seed systems in Mexico. Proc. Natl. Acad. Sci. USA 2008, 105, 470–475. [Google Scholar] [CrossRef] [Green Version]
  3. Mottaleb, K.A.; Loladze, A.; Sonder, K.; Kruseman, G.; Vicente, F.S. Threats of Tar Spot Complex disease of maize in the United States of America and its global consequences. Mitig. Adapt. Strat. Glob. Chang. 2019, 24, 281–300. [Google Scholar] [CrossRef] [Green Version]
  4. Santillán-Fernández, A.; Salinas-Moreno, Y.; Valdez-Lazalde, J.R.; Bautista-Ortega, J.; Pereira-Lorenzo, S. Spatial Delimitation of Genetic Diversity of Native Maize and Its Relationship with Ethnic Groups in Mexico. Agronomy 2021, 11, 672. [Google Scholar] [CrossRef]
  5. SIAP. Atlas Agroalimentario 2012–2018: Sistema de Información Agroalimentaria y Pesquera. Available online: https://nube.siap.gob.mx/gobmx_publicaciones_siap/pag/2018/Atlas-Agroalimentario-2018 (accessed on 23 January 2021).
  6. INEGI. México en Cifras: Instituto Nacional de Estadística y Geografía. Available online: https://www.inegi.org.mx/app/areasgeograficas/?ag=00 (accessed on 15 February 2020).
  7. González-Merino, A.; Ávila-Castañeda, J.F. El maíz en Estados Unidos y en México: Hegemonía en la producción de un cultivo. Argumentos 2014, 27, 215–237. [Google Scholar]
  8. Sánchez-Cano, J.E.S. La política agrícola en México, impactos y retos. Rev. Mex. Agronegocios 2014, 35, 946–956. [Google Scholar]
  9. Corte-Cruz, P.S.; Carrillo-Huerta, M.M. Impactos del Programa Procampo en la producción de maíz y frijol en México, 2000–2010. EconoQuantum 2018, 15, 95–112. [Google Scholar] [CrossRef]
  10. Espinosa-Calderón, A.; Turrent-Fernández, A.; Tadeo-Robledo, M.; Vicente-Tello, S.; Gómez-Montiel, N.; Valdivia-Bernal, R.; Sierra-Macias, M.; Zamudio-González, B. Ley de Semillas y Ley Federal de Variedades Vegetales y transgénicos de maíz en México. Rev. Mex. Cienc. Agrícolas 2014, 5, 293–308. [Google Scholar] [CrossRef] [Green Version]
  11. Villegas, M.N.O.; Villarreal, L.Z.; Salvatierra, N.M.; Lara, O.G.H. Leyes de semillas y maíz transgénico. Análisis desde la co-producción entre ciencia y regímenes económico-políticos en México. Agric. Soc. Y Desarro. 2018, 15, 413–442. [Google Scholar] [CrossRef]
  12. Santillán-Fernández, A.; Salinas-Moreno, Y.; Valdez-Lazalde, J.R.; Pereira-Lorenzo, S. Spatial-Temporal Evolution of Scientific Production about Genetically Modified Maize. Agriculture 2021, 11, 246. [Google Scholar] [CrossRef]
  13. Santillán-Fernández, A.; Santoyo-Cortes, V.H.; García-Chávez, L.R.; Covarrubias-Gutiérrez, I. Dinámica de la producción cañera en México: Periodo 2000 a 2011. Agroproductividad 2014, 7, 23–29. [Google Scholar]
  14. Gómez-Oliver, L. La Política Agrícola en el Nuevo Estilo de Desarrollo Latinoamericano; Organización de las Naciones Unidas para la Alimentación y la Agricultura: Santiago, Chile, 1994; p. 675. [Google Scholar]
  15. Cruz-Delgado, D.; Leos-Rodríguez, J.A.; Altamirano-Cárdenas, J.R. México: Factores explicativos de la producción de frutas y hortalizas ante la apertura comercial. Rev. Chapingo Ser. Hortic. 2013, 19, 267–278. [Google Scholar] [CrossRef]
  16. Schwentesius, R.R.; Sangerman, J.D.M. Desempeño competitivo de la fruticultura mexicana, 1980–2011. Rev. Mex. Cienc. Agrícolas 2014, 5, 1287–1300. [Google Scholar] [CrossRef] [Green Version]
  17. Santillán-Fernández, A.; Salas-Zúñiga, A.; Vásquez-Bautista, N. La productividad de la vainilla (Vanilla planifolia Jacks. ex Andrews) en México de 2003 a 2014. Rev. Mex. Cienc. For. 2018, 9, 50–69. [Google Scholar] [CrossRef] [Green Version]
  18. Soto, J.L.; Hartwich, F.; Monge, M.; Ampuero, L. Innovación en el Cultivo de Quinua en Bolivia: Efectos de la Interacción Social y de las Capacidades de Absorción de los Pequeños Productores; International Food Policy Research Institute: Washington, DC, USA, 2006; p. 95. [Google Scholar]
  19. SIAP. Producción Agrícola: Sistema de Información Agroalimentaria y Pesquera. Available online: http://www.numerosdelcampo.sagarpa.gob.mx/publicnew/productosAgricolas (accessed on 25 September 2020).
  20. Mendoza-Vargas, M. Ángel Bassols Batalla y la renovación de la geografía mexicana. Terra Bras. 2017, 9, 1–18. [Google Scholar] [CrossRef] [Green Version]
  21. Hernández-Vidal, N. Territorializando STS: An analysis of current discussions about agro-biotechnology governance in Latin America, Europe, and the USA. Tapuya 2018, 1, 70–83. [Google Scholar] [CrossRef] [Green Version]
  22. Ureta, C.; González-Salazar, C.; González, E.J.; Álvarez-Buylla, E.R.; Martínez-Meyer, E. Environmental and social factors account for Mexican maize richness and distribution: A data mining approach. Agric. Ecosyst. Environ. 2013, 179, 25–34. [Google Scholar] [CrossRef]
  23. Perales, H.; Golicher, D. Mapping the diversity of maize races in Mexico. PLoS ONE 2014, 9, e114657. [Google Scholar] [CrossRef] [Green Version]
  24. Chauvet, M.; Lazos, E. El maíz transgénico en Sinaloa: ¿tecnología inapropiada, obsoleta o de vanguardia? Implicaciones socioeconómicas de la posible siembra comercial. Sociológica/México 2014, 29, 7–44. [Google Scholar]
  25. Hernández-Hernández, B.; Rendón-Medel, R.; Toledo, J.U.; Santoyo-Cortés, V.H. Potencial económico y agronómico de la adopción de semillas de maíz genéticamente modificado en México. Rev. Mex. Cienc. Agrícolas 2016, 7, 3051–3061. [Google Scholar]
  26. Huffman, W.E.; Jin, Y.; Xu, Z. The economic impacts of technology and climate change: New evidence from US corn yields. Agric. Econ. 2018, 49, 463–479. [Google Scholar] [CrossRef]
  27. Hufford, M.B.; Berny-Mier y Teran, J.C.; Gepts, P. Crop biodiversity: An unfinished magnum opus of nature. Annu. Rev. Plant. Biol. 2019, 70, 727–751. [Google Scholar] [CrossRef] [PubMed]
  28. González-Estrada, A.; Alferes-Varela, M. Competitividad y ventajas comparativas de la producción de maíz en México. Rev. Mex. Cienc. Agrícolas 2010, 1, 381–396. [Google Scholar]
  29. Valencia-Romero, R.; Sánchez-Bárcenas, H.; Robles-Ortiz, D. Soberanía Alimentaria de granos básicos en México: Un enfoque de cointegración de Johansen a partir del TLCAN. Análisis Económico 2019, 34, 223–248. [Google Scholar] [CrossRef]
  30. Los Santos-Ramos, D.; Romero-Rosales, T.; Bobadilla-Soto, E.E. Dinámica de la producción de maíz y frijol en México de 1980 a 2014. Agron. Mesoam. 2017, 28, 439–453. [Google Scholar] [CrossRef] [Green Version]
  31. LDRS. Ley de Desarrollo Rural Sustentable. Diario Oficial de la Federación. Camara de Diputados del H. Congreso de la Unión. Ciudad de México. Available online: http://www.diputados.gob.mx/LeyesBiblio/pdf/235_120419.pdf (accessed on 7 April 2020).
  32. Donnet, M.L.; López-Becerril, I.D.; Black, J.R.; Hellin, J. Productivity differences and food security: A metafrontier analysis of rain-fed maize farmers in MasAgro in Mexico. Aims Agric. Food 2017, 2, 129–148. [Google Scholar] [CrossRef]
  33. Murray-Tortarolo, G.N.; Jaramillo, V.J.; Larsen, J. Food security and climate change: The case of rainfed maize production in Mexico. Agric. For. Meteorol. 2018, 253, 124–131. [Google Scholar] [CrossRef]
  34. Palacios-Argüello, L.; Morganti, E.; González-Feliu, J. Food hub: Una alternativa para alimentar las ciudades de manera sostenible. Rev. Transp. Territ. 2017, 17, 10–33. [Google Scholar] [CrossRef]
  35. Sosa-Baldivia, A.; Ruíz-Ibarra, G. La disponibilidad de alimentos en México: Un análisis de la producción agrícola de 35 años y su proyección para 2050. Pap. Población 2017, 23, 207–230. [Google Scholar] [CrossRef]
  36. Sánchez-Toledano, B.I.; Kallas, Z.; Gil, J.M. Importancia de los objetivos sociales, ambientales y económicos de los agricultores en la adopción de maíz mejorado en Chiapas, México. Rev. La Fac. Cienc. Agrar. Uncuyo 2017, 49, 269–287. [Google Scholar]
  37. Carpentieri-Pípolo, V.; Souza, A.D.; Silva, D.A.D.; Barreto, T.P.; Garbuglio, D.D.; Ferreira, J.M. Avaliação de cultivares de milho crioulo em sistema de baixo nível tecnológico. Acta Sci. Agron. 2010, 32, 229–233. [Google Scholar] [CrossRef] [Green Version]
  38. Sales-Rocha, R.; Rodríguez-Nascimento, M.; Barroso-Chagas, J.T.; Nunes de Almeida, R.; Ricardo dos Santos, P.; Queiroz da Silva Sanfim de Sant’Anna, C.; Pureza da Cruz, D.; Danilo da Silva-Costa, K.; Amaral-Gravina, G.; Figueiredo-Daher, R. Association among Agro-morphological Traits by Correlations and Path in Selection of Maize Genotypes. J. Exp. Agric. Int. 2019, 34, 1–12. [Google Scholar] [CrossRef]
  39. Juárez-Hernández, S.; Pardo, C.S. Assessing the potential of alternative farming practices for sustainable energy and water use and GHG mitigation in conventional maize systems. Environ. Dev. Sustain. 2020, 22, 8029–8059. [Google Scholar] [CrossRef]
  40. García-Rodríguez, J.G.; Mendoza-Elos, M.; Cervantes-Ortiz, F.; Ramirez-Pimentel, J.G.; Agrirre-Mancilla, C.L.; Gracía-Perea, M.A.; Figueroa-Rivera, M.G.; Rodríguez-Pérez, G.; Rodríguez-Herrera, S.A. Adaptabilidad de híbridos precomerciales tropicales de maíz en el Bajío de Guanajuato, México. Rev. Investig. Agrar. Y Ambient. 2019, 10, 57–65. [Google Scholar] [CrossRef]
  41. Pérez-Pérez, E.F.; Villafuerte-Solís, D. El dilema de los campesinos frente a los imperativos del mercado neoliberal en Los Altos de Chiapas, México. Estud. Rural. 2019, 9, 1–18. [Google Scholar]
  42. Mwangi, M.; Kariuki, S. Factors determining adoption of new agricultural technology by smallholder farmers in developing countries. J. Econ. Sustain. Dev. 2015, 6, 208–216. [Google Scholar]
  43. Noriero-Escalante, L.; Massieu-Trigo, Y.C. Campesinos maiceros en Tlaxcala: Viabilidad, caracterización y respuestas ante el maíz transgénico. Soc. Y Ambiente 2018, 16, 179–206. [Google Scholar] [CrossRef]
Figure 1. Temporal evolution of the Mexican population and its relationship with the production and consumption of maize from 1983 to 2018 (MAGR, Mean Annual Growth Rate).
Agriculture 11 00737 g001
Figure 2. Temporal evolution of the surface planted, field yield, and grain maize production in Mexico from 1983 to 2018, per production cycle and water regime.
Agriculture 11 00737 g002
Figure 3. Agrifood balance between production and consumption of grain maize in Mexico per economic region from 2013 to 2018.
Agriculture 11 00737 g003
Figure 4. Main maize-producing zones in Mexico from 1983 to 2018 obtained from the sum of the production at the municipal level in the spring–summer and fall–winter cycles [19]. The circles indicate the regions where surveys were applied to key producers: Jalisco (45), Chiapas (33), Sinaloa (36) and Tamaulipas (27).
Agriculture 11 00737 g004
Table 1. Typology used to determine the production growth of an agricultural sector in function of the percentage variations of the surface planted and field yields.
TypologyProduction Growth (%) *Factors That Explain the Growth
Surface Planted (%)Field Yield (%)
AIncreasesIncreasesIncreases
BIncreasesIncreasesDecreases
CIncreasesDecreasesIncreases
DDecreasesIncreasesDecreases
EDecreasesDecreasesIncreases
FDecreasesDecreasesDecreases
* Production growth (%) = Surface planted (%) ± Field yield (%). The growth increases or decreases as a function of the factor that conditions it most; for example, for categories C and E, the surface planted decreases and the field yield increases. However, the production for category C grows since the field yields compensated the reduction in surface planted, which does not happen in category E, where the reduction of surface planted was higher than the efficiency in increase of field yields.
Table 2. Field and commercial indicators of the main producer and consumer countries of grain maize at the global level from 2007 to 2018.
Field IndicatorsCommercial Indicators
CountryProduction *RankingSurface Planted **Yieldt ha−1Consumption *RankingImport *PlaceExport *Ranking
Quantity%Quantity%Quantity%Quantity%Quantity%
USA334.9335.42133.7819.029.93310.6426.9311.530.962751.3132.601
China207.3921.93236.0820.325.71271.7323.5627.734.8450.240.1532
Brazil88.299.34314.598.224.6461.135.3031.370.862825.4116.142
Argentina43.444.5944.112.326.8514.051.2270.010.0113520.2812.893
Mexico23.422.4857.023.963.3339.143.39413.158.2321.320.8416
Others248.0826.24 81.9946.184.52456.7339.60 136.0085.11 58.8637.39
Total945.55100.00 177.55100.00 1153.42100.00 159.78100.00 157.41100.00
* Millions of tons, ** Millions of hectares. The quantity of consumption for the period analyzed was higher than that of production, which was due to the initial stock in each of the years, considering the amount of grain in storage.
Table 3. Average of field indicators for grain maize production in Mexico per production cycle and water regime from 2013 to 2018.
CycleSurface PlantedField YieldProduction
ha%t ha−1t%
Fall-Winter Irrigation706,498.419.38%8.906,151,702.9824.00%
Fall-Winter Rainfed459,989.726.11%1.93877,570.413.42%
Spring-Summer Irrigation793,171.7810.53%7.435,832,350.8022.75%
Spring-Summer Rainfed5,570,905.1173.98%2.4212,774,029.2049.83%
Total7,530,565.02100.00% 25,635,653.39100.00%
Table 4. Tukey’s means test for field indicators of grain maize production in Mexico, 1983–2018.
PeriodsSurface Planted (ha)Production (t)Field Yield (t ha−1)
1983–19888,188,027.00 ab12,364,635.33 e1.78 e
1989–19948,109,741.50 b15,521,672.50 d2.13 d
1995–20008,718,844.07 a17,958,842.95 c2.36 d
2001–20068,164,037.21 ab20,508,540.40 b2.80 c
2007–20127,794,831.34 bc21,845,399.47 b3.19 b
2013–20187,530,565.02 c25,635,653.36 a3.55 a
Means with the same letter per column are not statistically different (Tukey, α = 0.05).
Table 5. Analysis of maize productivity in Mexico from1983 to 2018 obtained through the decomposition of production growth factors of the population.
PeriodsGrowth *
(%)
Growth Factors (%)
InitialFinalSurface PlantedField YieldInteraction
1983–19881989–199415.4−0.816.4−0.2
1989–19941995–200016.46.39.40.7
1995–20002001–20069.8−5.716.6−1.1
2001–20062007–20128.0−4.212.8−0.6
2007–20122013–20186.9−3.210.5−0.4
* Growth (%) = Surface planted (%) ± Field yield (%) ± Interaction (%).
Table 6. Grain maize productivity by state in 2013–2018 compared to 2007–2012 obtained through the decomposition of production growth factors model.
StateGrowth
(%)
Growth Factors (%)TypologyProductivity in % for the 2013–2018 PeriodWater
Regime *
Economic
Region
Surface
Planted
Field YieldInteractionSurface
Planted
ProductionField YieldRanking
Baja California97.43.440.553.5A0.010.027.7832IrrigationNorthwest
Baja California Sur41.329.67.83.9A0.090.166.5929IrrigationNorthwest
Campeche2311.310.21.5A2.471.772.5014RainfedSoutheast
Coahuila18.49.38.20.9A0.410.141.2730IrrigationNorth
Michoacán17.20.2170A6.327.294.154RainfedCenter West
Quintana Roo266.118.41.5A1.000.220.8927RainfedSoutheast
Sonora24.31.522.40.4A0.420.897.1319IrrigationNorthwest
Tamaulipas3011.915.52.6A2.483.264.7811IrrigationNortheast
Tlaxcala191.916.70.4A1.621.402.9316RainfedCenter East
Veracruz3.90.63.30A7.664.842.218RainfedEast
Morelos3.65.9−2.2−0.1B0.400.383.1824RainfedCenter East
Nuevo Leon24.478.6−26.6−27.6B0.740.281.4525RainfedNortheast
Colima15.4−927.3−2.9C0.160.184.0128RainfedCenter West
Chihuahua210210C2.915.306.266IrrigationNorth
Durango15.6−2.518.7−0.6C2.241.362.1617IrrigationNorth
Hidalgo6.3−2.48.9−0.2C3.292.722.9112IrrigationCenter East
Jalisco10.6−5.517.1−1C7.5714.076.372RainfedCenter West
Estado de México24.6−3.429.3−1.3C7.018.053.973RainfedCenter East
Sinaloa0.2−10.612.1−1.3C7.0220.2310.091IrrigationNorthwest
Tabasco3.8−6.210.7−0.7C1.080.551.8422RainfedEast
Guanajuato−4.20.2−4.40D5.266.204.075IrrigationCenter West
Guerrero−3.90.1−40D6.364.722.699RainfedSouth
Oaxaca−6.5−8.11.7−0.1E7.372.631.2913RainfedSouth
Puebla−4.4−8.74.7−0.4E7.213.901.8910RainfedCenter East
Yucatán−14.9−23.811.2−2.3E1.600.410.9223RainfedSoutheast
Zacatecas−28.9−29.91.3−0.3E2.691.481.9715RainfedNorth
Aguascalientes−112.2−19.9−101.99.6F0.530.271.9026IrrigationCenter West
Chiapas−14.4−0.8−13.70.1F9.174.901.867RainfedSouth
Ciudad de México−54.2−49.7−6.62.1F0.050.021.3431RainfedCenter East
Nayarit−32.8−27.7−6.41.3F0.500.594.1221RainfedNorthwest
Queretaro−15.3−7.3−8.50.5F1.431.142.7618IrrigationCenter East
San Luis Potosi−12.1−4.1−8.30.3F2.950.641.0620RainfedNorth
* The states are categorized in rainfed or irrigation in function of the larger surface planted by water regime from 2013 to 2018.
Table 7. Socioeconomic characterization of the producers in the main maize-producing regions in Mexico from 1983 to 2018.
RegionnYearSurface
(ha)
Yield
(t ha−1)
% FI% GMO Adoption
AgeStudiesExperienceF-WS-SF-WS-SYesNo
Sinaloa3657 a9 a37 a8.38 a1.76 bc8.68 a1.63 b87 a8416
Jalisco4547 c11 a17 c2.27 b6.21 a7.79 a2.12 a52 c5644
Tamaulipas2753 b9 a23 b3.67 b1.19 c4.53 b1.36 c69 b7228
Chiapas3350 b6 b25 b0.51 c2.86 b3.48 b1.67 b49 c1288
Mean 529263.713.016.121.69645644
n = Number of surveys. % FI = % that the activity represents for the family income. Means with the same letter by column are not statistically different (Tukey, α = 0.05).
Publisher’s Note: MDPI stays neutral with regard to jurisdictional claims in published maps and institutional affiliations.

