
Proximal Sensing in Grasslands and Pastures

School of Plant and Environmental Sciences, Virginia Tech, Blacksburg, VA 24061, USA
*
Author to whom correspondence should be addressed.
Agriculture 2021, 11(8), 740; https://0-doi-org.brum.beds.ac.uk/10.3390/agriculture11080740
Submission received: 7 July 2021
/
Revised: 30 July 2021
/
Accepted: 31 July 2021
/
Published: 4 August 2021
(This article belongs to the Special Issue Enhancing Farm-Level Decision Making through Innovation)
Abstract
:Reliable measures of biomass, species composition, nitrogen status, and nutritive value provide important indicators of the status of pastures and rangelands, allowing managers to make informed decisions. Traditional methods of sample collection necessitate significant investments in time and labor. Proximal sensing technologies have the potential to collect more data with a smaller investment in time and labor. However, methods and protocols for conducting pasture assessments with proximal sensors are still in development, equipment and software vary considerably, and the accuracy and utility of these assessments differ between methods and sites. This review summarizes the methods currently being developed to assess pastures and rangelands worldwide and discusses these emerging technologies in the context of diffusion of innovation theory.
1. Introduction
Grasslands cover an estimated 40% of the Earth’s surface [1], performing vital ecosystem services such as cycling nutrients, carbon, and water, and providing habitat for wildlife and pasture for livestock [2]. However, grasslands are declining globally in extent, due to land-use changes such as development, conversion to cropland, or abandonment [1,3] or degrading due to climate change [4]. Assessing the health of a grassland necessitates the collection of reliable data on its productivity, plant species composition, and potentially its nutritive value [5]. Traditional techniques for collecting these data are time and labor-intensive, requiring field visits, specialized equipment, and teams with expert knowledge of local ecosystems. Advances in sensor technologies may reduce the time or labor required to conduct such measurements. While recent applications of remote sensing technologies in grasslands and pastures have been discussed in detail in prior research [6], proximal sensing technologies such as handheld sensors or sensors mounted on unmanned aerial vehicles (UAVs) flown at low altitude have received less attention.
Innovation diffusion is the study of how novel and potentially useful technologies spread throughout a social system [7]. Innovation diffusion theories emerged out of studies of the dissemination of novel agricultural practices and technologies [8]. As such, they may be superior frameworks by which to evaluate the spread of innovative proximal sensing technologies for measuring or predicting indicators of pasture or rangeland health and function.
To diffuse successfully, an innovation must have five attributes demonstrating its advantage over previous systems: relative advantage, definable as the perceived superiority of the innovation over other methods; compatibility with the technological, cultural, social, and economic systems into which it must be integrated; a complexity not exceeding that of necessity; trialability, which is a term for the ease by which the innovation may be tested without major commitment; and observability of the superior outcomes of the innovation [7].
In this paper, we assess the current state of proximal sensing technologies as they relate to measuring plant height and biomass, species composition, and nutritive value of pastures and rangelands and assess the advantages and obstacles to their adoption within the framework of theories on the diffusion of innovations.
2. Measuring Plant Height and Predicting Aboveground Biomass
Measurements of sward height and biomass can provide data on the structure and health of a grassland. Sward height measurements can indicate the vigor, habitat value, or maturity of a grassland. Similarly, aboveground biomass is an indicator of grassland or rangeland health and, when monitored long-term, can indicate whether a grassland is gaining, losing, or maintaining its capacity to provide valuable ecosystem services such as forage production or preservation of water quality [9]. Data on aboveground biomass allow managers to determine appropriate levels of forage utilization to meet economic goals while maintaining ecosystem services [10].
Traditional methods of measuring aboveground biomass rely on destructive harvest of forage from small areas delineated by a quadrat or frame [11]. The harvested biomass then must be dried in a dedicated oven before dry matter can be determined. This process is labor-intensive, and the ovens needed for drying samples can be a significant investment. On extensive rangelands, an additional limitation of this method is that samples are often collected along a small transect that must represent areas of hundreds or thousands of hectares in size due to limitations on time and labor available to technicians or scientists. As such, improper site selection can mean that the calculated aboveground biomass is not representative of the area, and management decisions based on the results may not have the desired effect [12].
2.1. Traditional Alternatives to Destructive Harvest
A number of alternatives to hand-harvesting forage samples have been developed to shorten the time required to assess biomass in a pasture. Plate meters are used for quick, non-destructive estimations of pasture biomass by measuring the height of a sward under compression by a plate on a measuring stick or pole. Plate meters are calibrated by taking measurements in a pasture typical of the area in which they are to be used, harvesting biomass on the site of each measurement, and comparing plate height to biomass with a regression model to develop a predictive equation [13]. Plate meters vary in accuracy depending on site and season, as morphology and stage of growth influence a tiller’s resistance to compression [14]. Plate meters cannot be used if pasture species have robust reproductive tillers or stems that hold the plate above the sward canopy, as this will lead to inaccurate biomass predictions when plates are calibrated on vegetative swards [13]. Additionally, while the shortened sampling time compared to hand harvesting may allow for more sites to be sampled, the number of samples and area that can be sampled is still smaller than what can be accomplished with UAVs [15].
Robel poles are another non-destructive method of estimating pasture or rangeland biomass [16]. A Robel pole is a rod marked with contrasting colors at set intervals that is placed vertically in a sward. Personnel then stand at a set distance from the pole and record the height at which the sward obscures its markings. This is performed from four directions (often the cardinal directions) per placement, and the process is repeated until the necessary sample size has been collected. Robel poles avoid many of the issues intrinsic to plate meters by providing an indication of vegetative height and density without the need for compressing tillers. However, they face many of the same logistical limitations: a significant commitment of personnel and time to measure relatively small areas of often large ecosystems.
2.2. Use of Proximal Sensors to Measure Plant Height and Predict Biomass
Methods for assessing pasture height and biomass using proximal sensors vary. However, the principle for most methods is similar to that of plate meters in that pasture height measurements are initially compared to hand-harvested biomass to calibrate a predictive equation [15]. Photographs, LiDAR, and ultrasonic measurements are the most common methods used in proximal sensing pasture assessments [17,18].
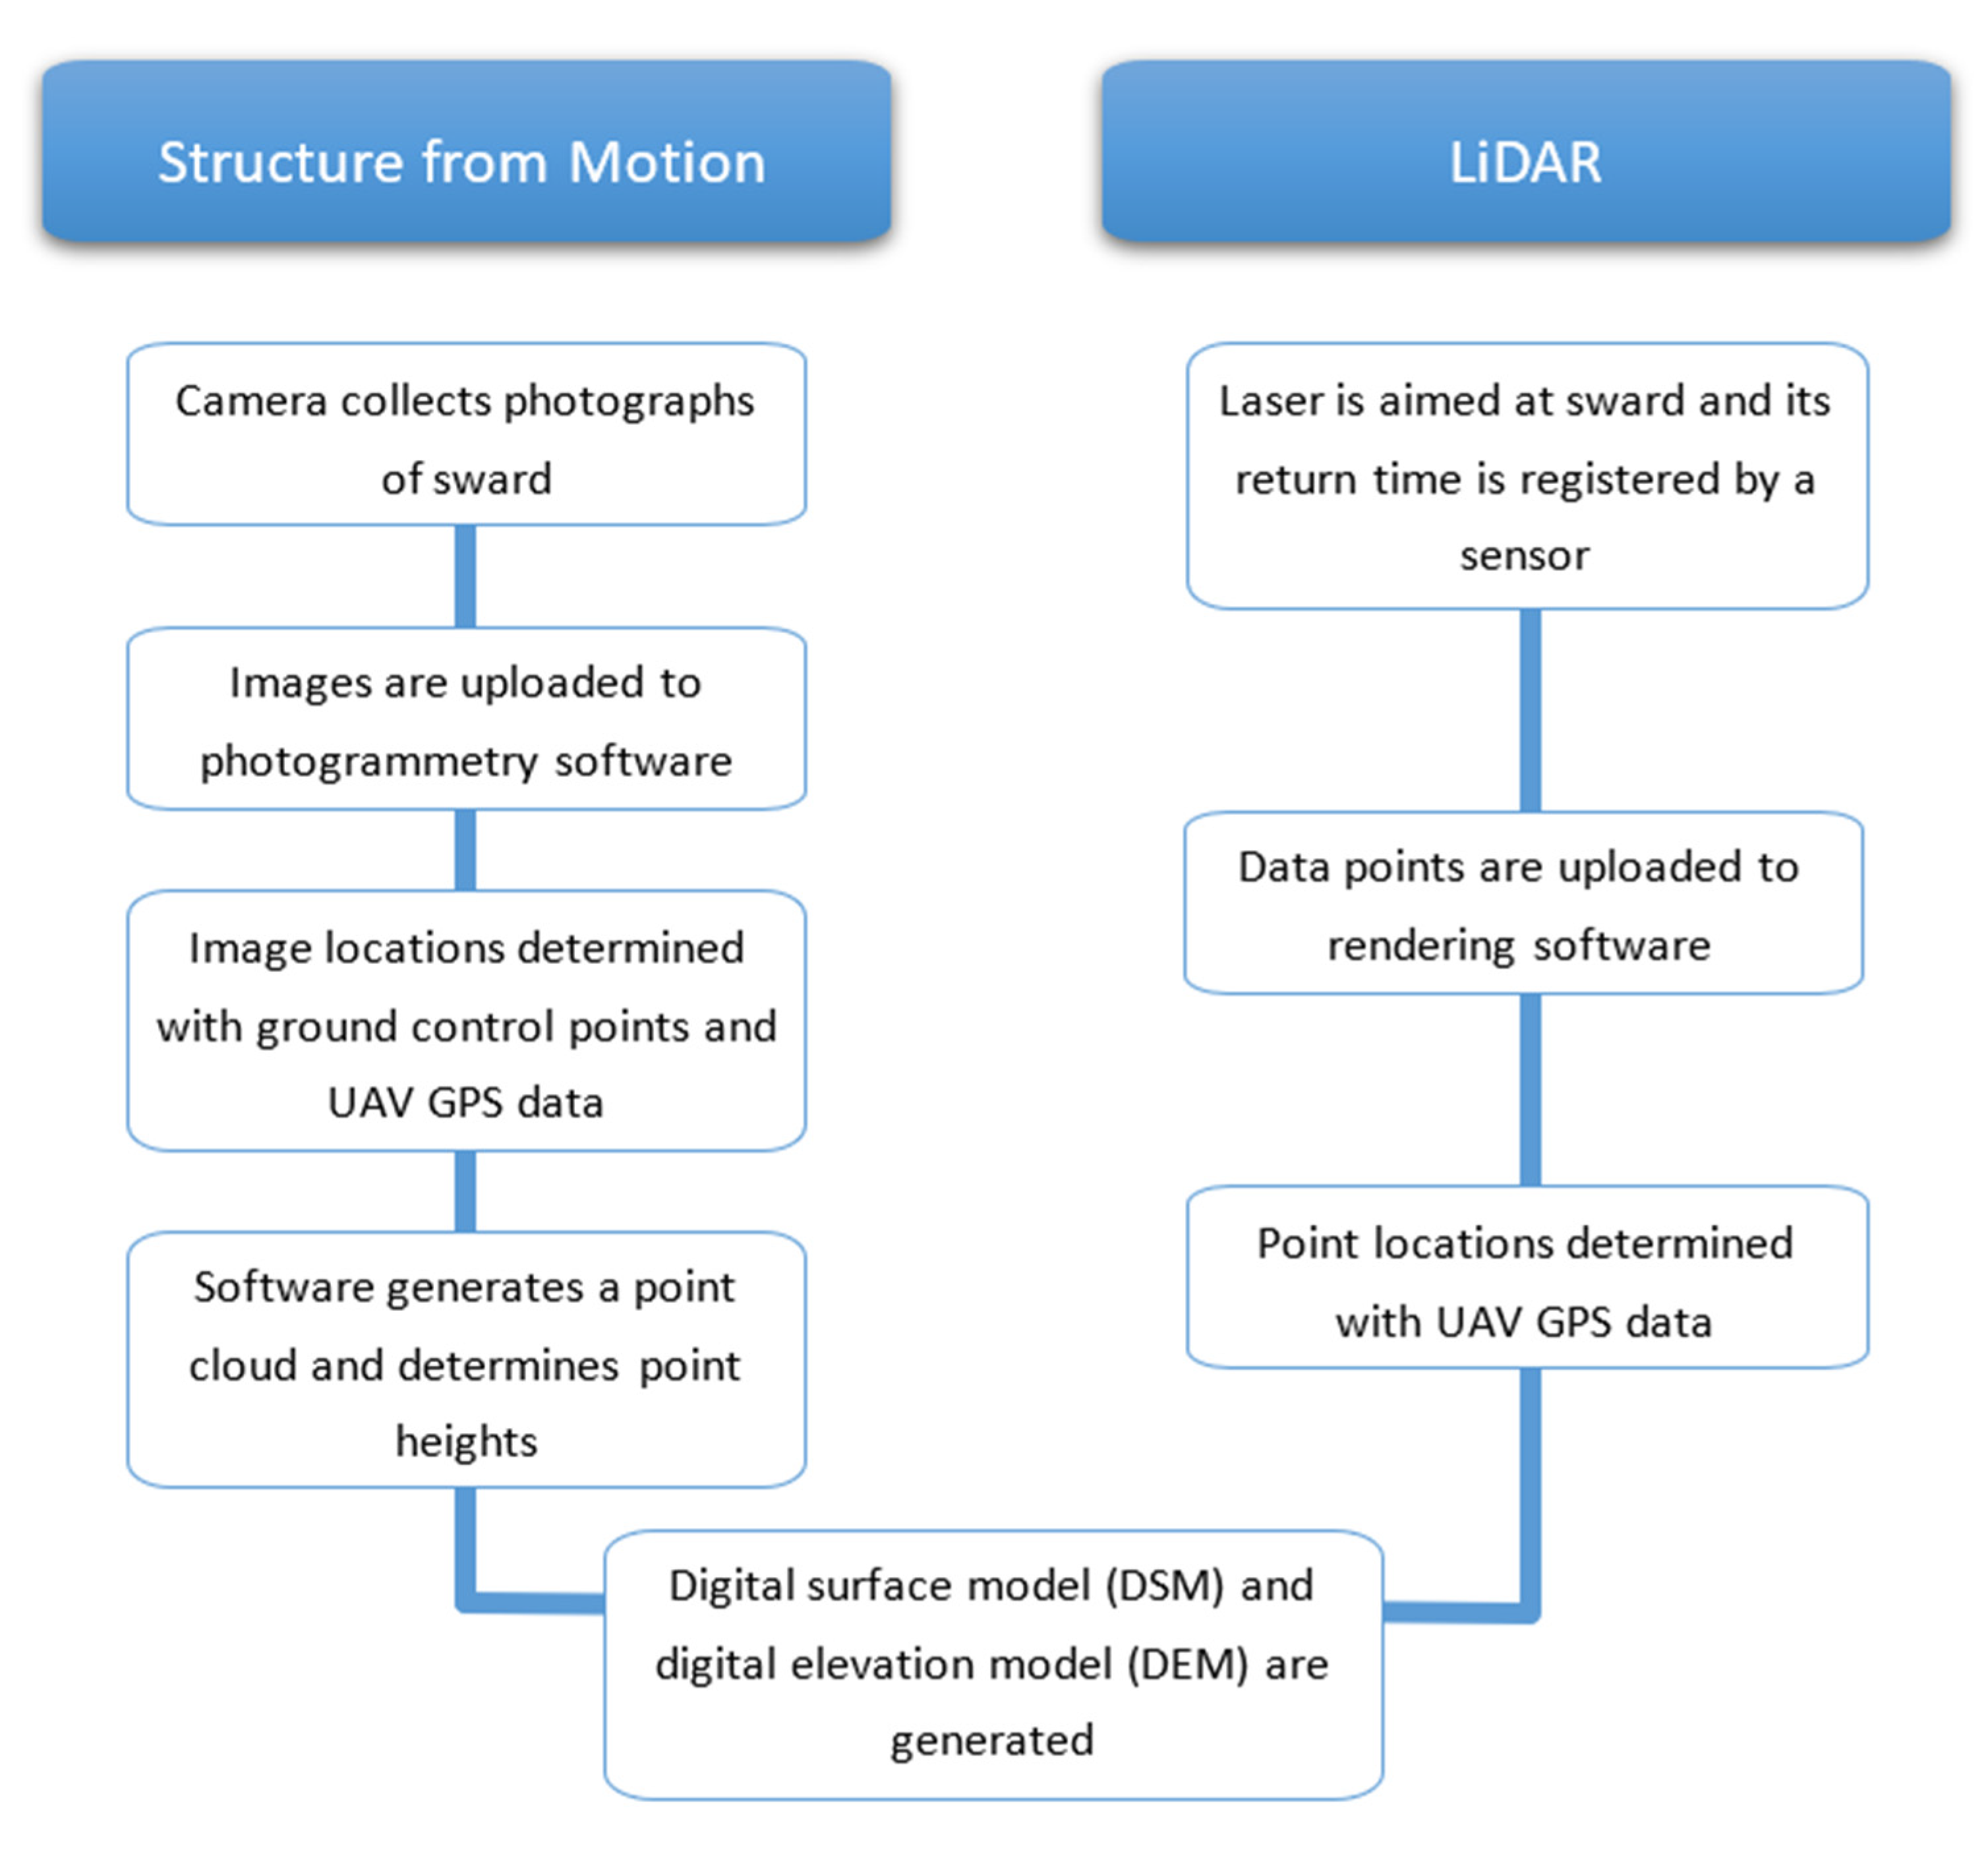
Photographic determinations of pasture height may be carried out with a simple red-green-blue (RGB) camera mounted onto a UAV or other vehicle [19] or held on a pole [20]. Ground control points (GCPs) are high-visibility objects used to provide a frame of reference for determining the position of the UAV in the pasture being photographed and are georeferenced using GPS after they are placed in the pasture [21]. The UAV is flown over the pasture, taking pictures rapidly at low altitude. The pictures are then loaded into a Structure from Motion (SfM) photogrammetry program which uses the GCP to reconstruct the path of the UAV and generate a point cloud, from which a digital surface model (DSM) and digital elevation model (DEM) are derived (Figure 1). By subtracting the height of the DEM from the DSM, canopy height may be calculated for a given point [21]. As with plate meters, these height data are then combined with hand-harvested biomass to derive a regression model to predict pasture biomass as a function of UAV-measured height [22]. Once the model has been developed and tested, the UAV’s height data may be used for determining biomass without the need for further hand-harvesting of biomass samples [21].
Light detection and ranging (LiDAR) generates point clouds much like SfM techniques but relies on a different mechanism to do so. With LiDAR, a laser aimed at the ground bounces back to a sensor, which records the time it took for the light to return, and from this interval calculates the distance from the LiDAR equipment [20].
When combined with the position of the UAV, LiDAR data can provide thousands of height measurements of a pasture or rangeland with a single flight [23]. Once the point cloud has been generated, a DSM is developed. The calibration of biomass prediction from height data is similar to the process used in SfM, with an initial comparison of LiDAR-generated height data with hand-harvested biomass samples [20].
Ultrasonic sensors operate similarly to LiDAR in that they emit a signal and calculate sward height based on the time it takes the signal to return to the sensor—the primary difference between the two being that one sensor uses ultrasound, and the other, light [24]. Ultrasonic sensors are mounted to vehicles both to facilitate more speedy measures and because the height of the sensor relative to the ground needs to remain constant for the sensor to correctly calculate sward height [17]. Recent improvements in ultrasonic sensor technology allow the sensor to detect the distance of both the ground and the sward canopy, resulting in more accurate measurements of height, as well as predictions of biomass [25]. However, the improved sensors are not yet commercially available.
Height measurements generated by proximal sensors can also be combined with spectral reflectance measurements to more accurately estimate pasture biomass [26]. Spectral reflectance indices are a measurement of the reflectance of objects at specific wavelengths. In a pasture setting, spectral reflectance is influenced by a number of factors, including chlorophyll concentration in leaves, plant species in the pasture, the presence and proportion of senescent leaves, and the leaf area index (LAI) of the pasture, which is the ratio of leaf area per given unit of ground area [27]. Spectral reflectance indices have been used on their own to estimate biomass in pastures and rangelands, but the many factors influencing reflectance at different wavelengths lead to difficulties in standardizing approaches between sites. Additionally, as the LAI increases, the sensitivity of reflectance indices decreases as less light is reflected back from denser swards [17]. In practical terms, this means that the most productive pastures present the greatest difficulty in accurately estimating biomass using spectral reflectance indices.
However, when spectral reflectance is combined with LiDAR or ultrasonic measurements of pasture height in a linear model, predictions of pasture biomass can be more accurate than by using either technique alone (Table 1). LiDAR combined with the NDVI resulted in a 25% increase in prediction accuracy for green pasture biomass [27]. This is a result of the capacity of spectral reflectance to differentiate between green biomass and senescent material, while LiDAR measurements can detect only standing biomass regardless of stage of growth [26]. Similarly, combining ultrasonic height measurements with spectral measurements such as the normalized spectral vegetation index (NSVI) can result in higher accuracy for predicting biomass than using either technology alone [26].
Structure from Motion, LiDAR, and ultrasonic sensor technologies generate useful predictions of forage height and biomass using current techniques. However, each has unique advantages and disadvantages. The primary advantage of LiDAR is its accuracy. Obanawa and colleagues reported a margin of error for measured pasture height of 12 ± 10 mm for LiDAR compared to 24 ± 13 mm for SfM [20]. Additionally, ultrasonic sensors usually assume a fixed distance to the ground due to being mounted on a vehicle, yet terrain and bumpy driving may interfere with the validity of that assumption [17]. However, LiDAR equipment can be prohibitively expensive compared to the equipment needed for ultrasonic measurements or SfM. Another consideration is weather—SfM may be confounded by days with highly variable light conditions, whereas LiDAR and ultrasonic technologies are more robust to such situations. In summary, SfM and ultrasonic approaches may be more accessible for many people due to the simplicity and cost of equipment, but for height and yield estimations, LiDAR can be more accurate.
3. Grassland Species Composition
Determining the composition of plant communities in pastures and rangelands is critical to assessing the ecological health of a landscape and making informed management decisions. A census of plant species composition can identify species of economic value, conservation concern, or undesirable species which may need suppression. Regular monitoring of plant species composition can provide data on shifts in plant communities resulting from past management, biotic and abiotic stressors, or disturbances such as fire or drought [5]. Most surveys of plant species composition in pastures or rangeland require the same dedication of time and labor as the assessments of biomass discussed above and also face the same limitations in sampling area and representativeness of sites selected for survey. However, measuring plant species composition also requires personnel with proficiency in plant identification and familiarity with species local to sampling sites. The seasonality of plant growth may also limit preferable survey seasons to certain times of the year. Consequently, time and personnel availability remain substantial constraints to the number and scope of surveys that can be conducted on any particular landscape. Developing more efficient survey methods could increase the scope and frequency of monitoring programs.
Surveys of species composition using UAVs rely on the collection of high-resolution imagery for plant identification, followed by data processing and analysis. High-resolution imagery can be collected with a variety of cameras mounted to UAVs, including unmodified commercially available RGB cameras, or cameras specifically designed or modified to capture light outside the visible range, such as NIR [29]. After images have been collected, they may be evaluated to determine if blurring, overexposure, or other issues that preclude reliable analysis are present. Remaining images are then processed with software, which uses the timestamp and GPS data associated with each photo to create an orthomosaic—a single image stitched together from the many collected by the drone [30]. The orthomosaic may require additional processing prior to final analyses depending on the site, equipment, software, and species being surveyed. Methods of analysis can then include visual tagging of species by human operators or using mapping or image processing software to identify objects or areas based on patterns of pixels in the orthomosaic [31].
Past research using UAVs to identify plants at the species level have largely focused on a single highly visible species, such as tree species [32,33], weeds in monocropped farming systems [34], woody invasive species [35], species with conspicuous blooms [36], or species in arid landscapes with unique morphology [37]. These studies consistently found that analyses of UAV-derived high-resolution imagery compared favorably with traditional sampling methods when assessing the abundance and distribution of a target species.
We found only one study using UAV-derived high-resolution imagery to classify multiple species simultaneously in a grassland setting. Lu and He used blue, green, and NIR spectrum imagery processed with machine learning software to assess the abundance and distribution of six species in a temperate grassland, including forbs and grasses [29]. The simultaneous assessment necessitated training the image analysis program to recognize the species. This was achieved by identifying species in the field and photographing them with the equipment to be used in the UAV surveys in order to generate differentiable reflectance values for spectral analysis. This approach averaged 85% accuracy when compared with on-ground assessments; however, the authors noted that the method failed to detect plants below the sward canopy, whether from lodging or early growth stage. Additionally, due to differences in spectral reflectance species had at different stages of their life cycles, it was necessary for the authors to sample some species multiple times during the growing season to retrain the software.
Though comprehensive species inventories remain beyond the capabilities of proximal sensing technology at present, UAV-derived high-resolution imagery has been used to map cover classes in a variety of environments: desert ecosystems in West Asia [38], Western rangelands of North America [30,39,40,41], and grasslands in the Tibetan plateau [42]. The processes are similar to those outlined above for species identification but with lower-resolution imagery and training personnel or programs to recognize vegetation types rather than species based on pixel patterns [30].
Thus far, plant identification and mapping using proximal sensing technology is incapable of replacing field work for comprehensive inventories of species on most landscapes. Even when multiple species may be identified using sensor imagery, species lower in the sward canopy may go undetected, and a field crew proficient in plant identification is necessary for helping train image processing software to recognize species of interest. Nevertheless, proximal sensing technologies have demonstrated their utility in expanding the scope and frequency of monitoring programs in many contexts, as well as their usefulness in collecting data about large shifts across landscapes. As such, they can readily augment, rather than replace, traditional methods of conducting plant surveys for scientists and land managers.
4. Nutritional Status and Nutritive Value
The process for estimating the nutritional status of plants—e.g., what concentrations of nitrogen or phosphorus they may have—is functionally identical to the process for estimating nutritive value of the sward for grazing animals. For both, a proximal sensor collects images of the site across a range of spectra, while a field crew collects samples of pasture from geotagged sites in the field. The samples are chemically analyzed for the variables of interest, and then these values are compared to spectral data by means of linear regression and/or machine learning to find the spectrum and equation that best explain variance in the variable of interest [43].
Results using this technique vary, with high reported coefficients of determination for some monospecific stands of forage [40] and more variable predictive capability in heterogeneous swards [44] (Table 2). Approaches combining spectral data with other environmental variables reported higher prediction accuracy than those relying on spectral data alone, both in homogenous and heterogenous swards. A study of nutritive value of alfalfa (Medicago sativa) in the United States reported 9–17% higher prediction accuracy when combining spectral data and growing degree units than when models were based on spectral data alone [45]. Another study on mixed temperate grasslands in Germany reported a 21% increase in prediction accuracy for crude protein (CP) and 91% increase for prediction accuracy of acid detergent fiber (ADF) when ultrasonic sward height measurements were included in calibration models than with spectral data alone [46]. Similarly, a study on perennial ryegrass (Lolium perenne) and white clover (Trifolium repens) swards in New Zealand reported 21% greater prediction accuracy for CP and 28% greater prediction accuracy for metabolizable energy (ME) when spectral data were combined with selected topographic and edaphic variables in models [47].
5. Innovation Diffusion and Proximal Sensing Technologies
Returning to innovation diffusion theory, an innovation must have five characteristics if it is to be widely adopted throughout a system: relative advantage over past methods; compatibility with needs and values of potential adopters, as well as extant social, technological, and economic systems; complexity not exceeding that of necessity; trialability, or capacity to be tested before committing to the innovation; and observability of the superior outcomes of the innovation [7].
5.1. Relative Advantage
Proximal sensing technologies have the capacity to generate vastly more data than traditional methods of pasture and rangeland assessment. Additionally, proximal sensors mounted on UAVs can travel farther, faster than most fieldwork teams. For certain aspects of assessing pasture or rangeland health, such as measuring height and productivity, proximal sensing technology has a high degree of accuracy and clear relative advantage over repeatedly hand-harvesting pasture. In other areas, however, such as comprehensive assessments of pasture species, or measuring the nutritive value or nutrient status of a sward, proximal sensing technology can augment but not replace traditional methods of data collection at present.
5.2. Compatibility
Compatibility refers to the extent to which an innovation aligns with the needs, values, and past experiences of potential adopters, as well as the extent to which it can be integrated into extant social, economic, and technological systems [7]. Scientists and natural resources professionals both need and value enhanced capacity for data collection [50]. Similarly, farmers and ranchers face a trend of increasing intensification in agricultural production, with an increased focus on data collection and precision agriculture [51]; however, in some countries, the median age of agricultural producers is over 60 years [52], and age has been shown to have an inverse relationship with willingness to adopt technological innovations in some agricultural communities [53,54].
While proximal sensing technologies are in the process of emerging from and being further integrated into extant economic and technological systems, prior research on analogous precision agriculture innovations demonstrates that a threshold of adoption may need to be reached before industry-scale informational and technological support for potential adopters is available [55]. At present, there are few studies on the rates of adoption of proximal sensing technologies or related technologies such as UAVs by agricultural producers, and extant studies focus primarily on row crop production rather than pasture [56]. As such, it seems unlikely that the threshold of adoption of proximal sensing technologies is high enough for farmers and ranchers to expect consistent commercial support for proximal sensing technologies they may wish to integrate into their farms.
5.3. Complexity
The complexity of various proximal sensing technologies is likely to be a barrier to adoption for many land managers such as farmers or conservation professionals. Traditional methods of assessing sward height and biomass, species composition, or nutritive value are labor-intensive, yet straightforward. Individuals can be trained in height and biomass data collection and nutritive sample harvesting in short order, and many manuals, tutorials, and courses on taking these measurements are available [57]. However, assessing plant species composition requires knowledge of plant identification or the use of botanical keys despite the simplicity of the processes often used. In contrast, proximal sensing technologies are novel as well as diverse in their equipment, methods, and results. Consequently, potential adopters must first familiarize themselves with the array of options available, learn to use the sensor technology they deem most suitable for their purposes, and then process the data generated by sensors. Alternately, potential adopters may be able to outsource the data processing stage if the service is offered by organizations or companies to which they have access; just such an approach is being tested for remote pasture sensing technology in an American dairy cooperative [58].
5.4. Trialability
In general, the barriers to adoption resulting from the complexity of proximal sensing technologies present similar issues in terms of trialability. For example, if opting to use UAV-mounted proximal sensors, operators must learn to pilot a drone and, depending on local laws, may need certification or licensing to do so [59]. Data processing requires computers with robust processors, as well as software capable of processing raw sensor data [11]. However, some proximal sensing technologies are becoming more accessible and require less expertise to use. Some smartphone apps have emerged for the use of SfM for making 3D maps of objects and scenes. Similarly, a smartphone and tablet were recently released with built-in LiDAR capable of generating point clouds from handheld scanning [60].
Cost is another potential obstacle to the trialability of proximal sensing technologies. Many proximal sensors represent a significant financial investment for land managers such as farmers or conservation professionals, beyond what may constitute an acceptable loss if the technology fails to meet their needs. Again, the emerging LiDAR-equipped tablets and cell phones mentioned above may mitigate cost as an obstacle to adoption, to some extent; the smartphone and tablet are a fraction of the cost of most other proximal sensors and may be used simply by walking through a field or pasture. However, the point clouds generated still require postprocessing for accurate determinations of pasture height. While this may be done with open-source software, it still requires an investment of time to learn the program and process the point cloud.
5.5. Observability
Observability, in Rogers’ theory, relates both to the visibility of positive outcomes of an innovation as well as to the visibility of the innovation itself when used by adopters [3]. In terms of observable outcomes, for scientists or natural resources professionals, the volume of data generated by proximal sensing technologies is an observable advantage [46]. For land managers such as farmers, observable advantages of proximal sensing technologies may be more in the spheres of economic or ecological outcomes resulting from the data generated. Prior research demonstrates that innovations that augment the capacity of agricultural producers to make decisions benefiting their economic and ecological goals are more likely to be adopted [56].
6. Conclusions
Proximal sensing technologies are becoming more accessible and useful over time, and their increasing adoption for augmenting data collection programs for pasture and rangeland research appears assured. However, many barriers to the widespread adoption of these technologies by farmers remain: they are often complex to deploy in the field and require postprocessing of data; many proximal sensing systems are expensive, reducing their trialability by producers; and the technologies may require more widespread adoption before sufficient informational and technological support is available. At present, proximal sensors cannot replace traditional fieldwork and on-site monitoring programs, but they can greatly enhance the amount of data collected as well as the scope of data collection possible [11]. We conclude that their adoption will increase as the technology matures and barriers to adoption such as cost and complexity decrease. Additional research quantifying the use of these technologies by agricultural producers is needed, as is qualitative research on perceptions of proximal sensing technologies and barriers to their adoption.
Author Contributions
Conceptualization, B.T.; literature review and writing—original draft preparation, S.G. Both authors have read and agreed to the published version of the manuscript.
Funding
This work is supported by the Cyber-Physical Systems (CPS) (Joint NSF) Competitive Grants Program grant no. 2018-67007-28380 from the USDA National Institute of Food and Agriculture.
Conflicts of Interest
The authors declare no conflict of interest.
References
- White, R.P.; Murray, S.; Rohweder, M.; Prince, S.D.; Thompson, K.M. Grassland Ecosystems; World Resources Institute: Washington, DC, USA, 2000. [Google Scholar]
- Bengtsson, J.; Bullock, J.M.; Egoh, B.; Everson, C.; Everson, T.; O’Connor, T.; O’Farrell, P.J.; Smith, H.G.; Lindborg, R. Grasslands—More important for ecosystem services than you might think. Ecosphere 2019, 10, e02582. [Google Scholar] [CrossRef]
- Cislaghi, A.; Giupponi, L.; Tamburini, A.; Giorgi, A.; Bischetti, G.B. The Effects of Mountain Grazing Abandonment on Plant Community, Forage Value and Soil Properties: Observations and Field Measurements in an Alpine Area. Catena 2019, 181, 104086. [Google Scholar] [CrossRef]
- Joyce, L.A.; Briske, D.D.; Brown, J.R.; Polley, H.W.; McCarl, B.A.; Bailey, D.W. Climate Change and North American Rangelands: Assessment of Mitigation and Adaptation Strategies. Rangel. Ecol. Manag. 2013, 66, 512–528. [Google Scholar] [CrossRef] [Green Version]
- Kallenbach, R.L. Describing the Dynamic: Measuring and Assessing the Value of Plants in the Pasture. Crop. Sci. 2015, 55, 2531–2539. [Google Scholar] [CrossRef]
- Svoray, T.; Perevolotsky, A.; Atkinson, P.M. Ecological Sustainability in Rangelands: The Contribution of Remote Sensing. Int. J. Remote Sens. 2013, 34, 6216–6242. [Google Scholar] [CrossRef]
- Rogers, E.M. Diffusion of Innovations, 4th ed.; Simon and Schuster: New York, NY, USA, 2010. [Google Scholar]
- Mcgrath, C.; Zell, D. The Future of Innovation Diffusion Research and Its Implications for Management: A Conversation with Everett Rogers. J. Manag. Inq. 2001, 10, 386–391. [Google Scholar] [CrossRef]
- Derner, J.D.; Schuman, G.E. Carbon Sequestration and Rangelands: A Synthesis of Land Management and Precipitation Effects. J. Soil Water Conserv. 2007, 62, 77–85. [Google Scholar]
- Holechek, J.L. An Approach for Setting the Stocking Rate; Rangel: New York, NY, USA, 1988. [Google Scholar]
- Friedel, M.H.; Chewings, V.H.; Bastin, G.N. The Use of Comparative Yield and Dry-Weight-Rank Techniques for Monitoring Arid Rangeland. Rangel. Ecol. Manag. Range Manag. Arch. 1988, 41, 430–435. [Google Scholar] [CrossRef]
- Schalau, J. Rangeland Monitoring: Selecting Key Areas. 2010. Available online: https://extension.arizona.edu/sites/extension.arizona.edu/files/pubs/az1259.pdf (accessed on 12 October 2020).
- Rayburn, E.B.; Rayburn, S.B. A Standardized Plate Meter for Estimating Pasture Mass in On-Farm Research Trials. Agron. J. 1998, 90, 238–241. [Google Scholar] [CrossRef]
- Dougherty, M.; Burger, J.A.; Feldhake, C.M.; AbdelGadir, A.H. Calibration and Use of Plate Meter Regressions for Pasture Mass Estimation in an Appalachian Silvopasture. Arch. Agron. Soil Sci. 2013, 59, 305–315. [Google Scholar] [CrossRef]
- Bareth, G. Replacing Manual Rising Plate Meter Measurements with Low-Cost UAV-Derived Sward Height Data in Grasslands for Spatial Monitoring. J. Photogramm. Remote Sens. Geoinf. Sci. 2018, 86, 157–168. [Google Scholar] [CrossRef]
- Harmoney, K.R.; Moore, K.J.; George, J.R.; Brummer, E.C.; Russell, J.R. Determination of Pasture Biomass Using Four Indirect Methods. Agron. J. 1997, 89, 665–672. [Google Scholar] [CrossRef]
- Legg, M.; Bradley, S. Ultrasonic Arrays for Remote Sensing of Pasture Biomass. Remote Sens. 2020, 12, 111. [Google Scholar] [CrossRef] [Green Version]
- Moeckel, T.; Safari, H.; Reddersen, B.; Fricke, T.; Wachendorf, M. Fusion of Ultrasonic and Spectral Sensor Data for Improving the Estimation of Biomass in Grasslands with Heterogeneous Sward Structure. Remote Sens. 2017, 9, 98. [Google Scholar] [CrossRef] [Green Version]
- Cunliffe, A.M.; Brazier, R.E.; Anderson, K. Ultra-Fine Grain Landscape-Scale Quantification of Dryland Vegetation Structure with Drone-Acquired Structure-from-Motion Photogrammetry. Remote Sens. Environ. 2016, 183, 129–143. [Google Scholar] [CrossRef] [Green Version]
- Obanawa, H.; Yoshitoshi, R.; Watanabe, N.; Sakanoue, S. Portable LiDAR-Based Method for Improvement of Grass Height Measurement Accuracy: Comparison with SfM Methods. Sensors 2020, 20, 4809. [Google Scholar] [CrossRef]
- Grüner, E.; Astor, T.; Wachendorf, M. Biomass Prediction of Heterogeneous Temperate Grasslands Using an SfM Approach Based on UAV Imaging. Agronomy 2019, 9, 54. [Google Scholar] [CrossRef] [Green Version]
- Rueda-Ayala, V.P.; Peña, J.M.; Höglind, M.; Bengochea-Guevara, J.M.; Andújar, D. Comparing UAV-Based Technologies and RGB-D Reconstruction Methods for Plant Height and Biomass Monitoring on Grass Ley. Sensors 2019, 19, 535. [Google Scholar] [CrossRef] [Green Version]
- Wang, D.; Xin, X.; Shao, Q.; Brolly, M.; Zhu, Z.; Chen, J. Modeling Aboveground Biomass in Hulunber Grassland Ecosystem by Using Unmanned Aerial Vehicle Discrete Lidar. Sensors 2017, 17, 180. [Google Scholar] [CrossRef] [Green Version]
- Pittman, J.J.; Arnall, D.B.; Interrante, S.M.; Moffet, C.A.; Butler, T.J. Estimation of Biomass and Canopy Height in Bermudagrass, Alfalfa, and Wheat Using Ultrasonic, Laser, and Spectral Sensors. Sensors 2015, 15, 2920–2943. [Google Scholar] [CrossRef] [PubMed] [Green Version]
- Legg, M.; Bradley, S. Ultrasonic Proximal Sensing of Pasture Biomass. Remote Sens. 2019, 11, 2459. [Google Scholar] [CrossRef] [Green Version]
- Fricke, T.; Wachendorf, M. Combining Ultrasonic Sward Height and Spectral Signatures to Assess the Biomass of Legume–Grass Swards. Comput. Electron. Agric. 2013, 99, 236–247. [Google Scholar] [CrossRef]
- Schaefer, M.T.; Lamb, D.W. A Combination of Plant NDVI and LiDAR Measurements Improve the Estimation of Pasture Biomass in Tall Fescue (Festuca Arundinacea Var. Fletcher). Remote Sens. 2016, 8, 109. [Google Scholar] [CrossRef] [Green Version]
- Cooper, S.D.; Roy, D.P.; Schaaf, C.B.; Paynter, I. Examination of the Potential of Terrestrial Laser Scanning and Structure-from-Motion Photogrammetry for Rapid Nondestructive Field Measurement of Grass Biomass. Remote Sens. 2017, 9, 531. [Google Scholar] [CrossRef] [Green Version]
- Lu, B.; He, Y. Species Classification Using Unmanned Aerial Vehicle (UAV)-Acquired High Spatial Resolution Imagery in a Heterogeneous Grassland. ISPRS J. Photogramm. Remote Sens. 2017, 128, 73–85. [Google Scholar] [CrossRef]
- Laliberte, A.S.; Rango, A. Image Processing and Classification Procedures for Analysis of Sub-Decimeter Imagery Acquired with an Unmanned Aircraft over Arid Rangelands. GIScience Remote Sens. 2011, 48, 4–23. [Google Scholar] [CrossRef] [Green Version]
- Cruzan, M.B.; Weinstein, B.G.; Grasty, M.R.; Kohrn, B.F.; Hendrickson, E.C.; Arredondo, T.M.; Thompson, P.G. Small Unmanned Aerial Vehicles (Micro-UAVs, Drones) in Plant Ecology. Appl. Plant. Sci. 2016, 4, 1600041. [Google Scholar] [CrossRef]
- Baena, S.; Moat, J.; Whaley, O.; Boyd, D.S. Identifying Species from the Air: UAVs and the Very High Resolution Challenge for Plant Conservation. PLoS ONE 2017, 12, e0188714. [Google Scholar] [CrossRef] [Green Version]
- Miyoshi, G.T.; Arruda, M.d.S.; Osco, L.P.; Marcato Junior, J.; Gonçalves, D.N.; Imai, N.N.; Tommaselli, A.M.G.; Honkavaara, E.; Gonçalves, W.N. A Novel Deep Learning Method to Identify Single Tree Species in UAV-Based Hyperspectral Images. Remote Sens. 2020, 12, 1294. [Google Scholar] [CrossRef] [Green Version]
- Bah, M.D.; Hafiane, A.; Canals, R. Deep Learning with Unsupervised Data Labeling for Weed Detection in Line Crops in UAV Images. Remote Sens. 2018, 10, 1690. [Google Scholar] [CrossRef] [Green Version]
- Alvarez-Taboada, F.; Paredes, C.; Julián-Pelaz, J. Mapping of the Invasive Species Hakea Sericea Using Unmanned Aerial Vehicle (UAV) and WorldView-2 Imagery and an Object-Oriented Approach. Remote Sens. 2017, 9, 913. [Google Scholar] [CrossRef] [Green Version]
- Tay, J.Y.L.; Erfmeier, A.; Kalwij, J.M. Reaching new heights: Can drones replace current methods to study plant population dynamics? Plant Ecol. 2018, 219, 1139–1150. [Google Scholar] [CrossRef]
- Gallacher, D. Drone-Based Vegetation Assessment in Arid Ecosystems. In Sabkha Ecosystems; Springer: Berlin, Germany, 2019; pp. 91–98. [Google Scholar]
- Gallacher, D.; Khafaga, M.T.; Ahmed, M.T.M.; Shabana, M.H.A. Plant Species Identification via Drone Images in an Arid Shrubland. In Proceedings of the 10th International Rangeland Congress, Saskatoon, SK, Canada, 17–22 July 2016; pp. 981–982. [Google Scholar]
- Breckenridge, R.P.; Dakins, M.; Bunting, S.; Harbour, J.L.; Lee, R.D. Using Unmanned Helicopters to Assess Vegetation Cover in Sagebrush Steppe Ecosystems. Rangel. Ecol. Manag. 2012, 65, 362–370. [Google Scholar] [CrossRef]
- Gillan, J.K.; Karl, J.W.; van Leeuwen, W.J. Integrating Drone Imagery with Existing Rangeland Monitoring Programs. Environ. Monit. Assess. 2020, 192, 1–20. [Google Scholar] [CrossRef] [PubMed]
- Laliberte, A.S.; Browning, D.M.; Herrick, J.E.; Gronemeyer, P. Hierarchical Object-Based Classification of Ultra-High-Resolution Digital Mapping Camera (DMC) Imagery for Rangeland Mapping and Assessment. J. Spat. Sci. 2010, 55, 101–115. [Google Scholar] [CrossRef]
- Sun, Y.; Yi, S.; Hou, F. Unmanned Aerial Vehicle Methods Makes Species Composition Monitoring Easier in Grasslands. Ecol. Indic. 2018, 95, 825–830. [Google Scholar] [CrossRef]
- Michez, A.; Philippe, L.; David, K.; Sébastien, C.; Christian, D.; Bindelle, J. Can Low-Cost Unmanned Aerial Systems Describe the Forage Quality Heterogeneity? Insight from a Timothy Pasture Case Study in Southern Belgium. Remote Sens. 2020, 12, 1650. [Google Scholar] [CrossRef]
- Wijesingha, J.; Astor, T.; Schulze-Brüninghoff, D.; Wengert, M.; Wachendorf, M. Predicting Forage Quality of Grasslands Using UAV-Borne Imaging Spectroscopy. Remote Sens. 2020, 12, 126. [Google Scholar] [CrossRef] [Green Version]
- Noland, R.L.; Wells, M.S.; Coulter, J.A.; Tiede, T.; Baker, J.M.; Martinson, K.L.; Sheaffer, C.C. Estimating Alfalfa Yield and Nutritive Value Using Remote Sensing and Air Temperature. Field Crops Res. 2018, 222, 189–196. [Google Scholar] [CrossRef]
- Safari, H.; Fricke, T.; Wachendorf, M. Determination of Fibre and Protein Content in Heterogeneous Pastures Using Field Spectroscopy and Ultrasonic Sward Height Measurements. Comput. Electron. Agric. 2016, 123, 256–263. [Google Scholar] [CrossRef]
- Pullanagari, R.R.; Kereszturi, G.; Yule, I. Integrating Airborne Hyperspectral, Topographic, and Soil Data for Estimating Pasture Quality Using Recursive Feature Elimination with Random Forest Regression. Remote Sens. 2018, 10, 1117. [Google Scholar] [CrossRef] [Green Version]
- Serrano, J.; Shahidian, S.; Marques da Silva, J. Monitoring Seasonal Pasture Quality Degradation in the Mediterranean Montado Ecosystem: Proximal versus Remote Sensing. Water 2018, 10, 1422. [Google Scholar] [CrossRef] [Green Version]
- Duranovich, F.; Yule, I.; Lopez-Villalobos, N.; Shadbolt, N.; Draganova, I.; Morris, S. Using Proximal Hyperspectral Sensing to Predict Herbage Nutritive Value for Dairy Farming. Agronomy 2020, 10, 1826. [Google Scholar] [CrossRef]
- Anderson, K.; Gaston, K.J. Lightweight Unmanned Aerial Vehicles Will Revolutionize Spatial Ecology. Front. Ecol. Environ. 2013, 11, 138–146. [Google Scholar] [CrossRef] [Green Version]
- Pathak, H.S.; Brown, P.; Best, T. A Systematic Literature Review of the Factors Affecting the Precision Agriculture Adoption Process. Precis. Agric. 2019, 20, 1292–1316. [Google Scholar] [CrossRef]
- Kennedy, C.A.; Brunson, M.W. Creating a Culture of Innovation in Ranching. Rangelands 2007, 29, 35–40. [Google Scholar] [CrossRef]
- Michels, M.; von Hobe, C.-F.; Musshoff, O. A Trans-Theoretical Model for the Adoption of Drones by Large-Scale German Farmers. J. Rural. Stud. 2020, 75, 80–88. [Google Scholar] [CrossRef]
- Ghajar, S.; Fernández-Giménez, M.E.; Wilmer, H. Home on the Digital Range: Ranchers’ Web Access and Use. Rangel. Ecol. Manag. 2019, 72, 711–720. [Google Scholar] [CrossRef] [Green Version]
- Eastwood, C.; Klerkx, L.; Nettle, R. Dynamics and Distribution of Public and Private Research and Extension Roles for Technological Innovation and Diffusion: Case Studies of the Implementation and Adaptation of Precision Farming Technologies. J. Rural. Stud. 2017, 49, 1–12. [Google Scholar] [CrossRef]
- Bramley, R.G.V.; Ouzman, J. Farmer Attitudes to the Use of Sensors and Automation in Fertilizer Decision-Making: Nitrogen Fertilization in the Australian Grains Sector. Precis. Agric. 2019, 20, 157–175. [Google Scholar] [CrossRef]
- Rangeland Monitoring|Rangelands Gateway. Available online: https://rangelandsgateway.org/topics/maintaining-improving-rangelands/rangeland-monitoring (accessed on 27 July 2021).
- Organic Valley to Pioneer Use of Satellite Technology to Improve Pasture Grazing. Available online: https://www.organicvalley.coop/newspress/organic-valley-pioneer-use-satellite-technology-improve-pasture-grazing/ (accessed on 24 July 2021).
- Reger, M.; Bauerdick, J.; Bernhardt, H. Drones in Agriculture: Current and Future Legal Status in Germany, the EU, the USA and Japan. Landtechnik 2018, 73, 62–80. [Google Scholar]
- Perez, S. Snapchat among First to Leverage IPhone 12 Pro’s LiDAR Scanner for AR TechCrunch. 2020. Available online: https://social.techcrunch.com/2020/10/13/snapchat-among-first-to-leverage-iphone-12-pros-lidar-scanner-for-ar/ (accessed on 13 October 2020).
Figure 1.
The processes by which pasture height data are generated using Structure for Motion photogrammetry and LiDAR in proximal sensing.
Figure 1.
The processes by which pasture height data are generated using Structure for Motion photogrammetry and LiDAR in proximal sensing.


Table 1.
Studies using proximal sensing technologies to estimate pasture height or dry matter (DM) yield.
Table 1.
Studies using proximal sensing technologies to estimate pasture height or dry matter (DM) yield.
| Author(s) | Year | Technology Used 1 | Variable | R2 | Pasture Type | Location |
|---|---|---|---|---|---|---|
| Frick and Wachendorf [26] | 2013 | Combination of ultrasonic and spectral sensors | DM | 0.83 in mixed swards 0.88–0.90 for species-specific calibrations | Mixed grass and legume swards | Germany |
| Schaefer and Lamb [27] | 2016 | Combination of LiDAR and spectral sensors | Green DM | 0.61 | Tall fescue (Schedonorous arundinacea) | Australia |
| Cooper et al. [28] | 2017 | SfM, TLS | DM | SfM: 0.72 TLS: 0.57 | Smooth brome (Bromus inermis) | South Dakota, USA |
| Wang et al. [23] | 2017 | LiDAR | DM | 0.34 | Semi-arid steppe | Inner Mongolia, China |
| Legg and Bradley [25] | 2019 | Ultrasonic sensor | DM | 0.7–0.8 | Unspecified | New Zealand |
| Grüner et al. [21] | 2019 | SfM | DM Height | 0.64–0.75 0.59–0.81 | Mixed grass and legume swards | Germany |
| Obanawa et al. [20] | 2020 | SfM from pole-mounted and UAV-mounted cameras; LiDAR | Height | 0.94 for UAV SfM, 0.91 for handheld SfM, 0.93 for LiDAR | Annual ryegrass (Lolium multiflorum) | Japan |
1 Abbreviations: LiDAR: light detection and ranging; SfM: structure from motion photogrammetry; TLS: terrestrial laser scanning; UAV: unmanned aerial vehicle.
Table 2.
Studies using proximal sensing technologies to assess forage nutrient concentrations in pastures or rangelands.
Table 2.
Studies using proximal sensing technologies to assess forage nutrient concentrations in pastures or rangelands.
| Author(s) | Year | Technology Used | Variables 1 | R2 | Pasture Type | Location |
|---|---|---|---|---|---|---|
| Safari et al. [46] | 2016 | Handheld spectroradiometer and ultrasonic sensor | CP | 0.64–0.85 | Mixed temperate grasslands | Germany |
| ADF | 0.63–0.75 | |||||
| Noland et al. [45] | 2018 | Near-infrared sensor | CP | 0.87 | Alfalfa (Medicago sativa) pasture | Minnesota, USA |
| NDF | 0.76 | |||||
| Serrano et al. [48] | 2018 | Near-infrared sensor and optical sensor | CP | 0.69 | Dryland Meditteranean pastures | Portugal |
| NDF | 0.78 | |||||
| Pullanagari et al. [47] | 2018 | Hyperspectral sensors and topographic data | CP | 0.83 | Perennial ryegrass (Lolium perenne) and white clover (Trifolium repens) sward | New Zealand |
| NDF | 0.76 | |||||
| Wijesingha et al. [44] | 2020 | Hyperspectral sensors | CP | 0.42 | Mixed temperate grasslands | Germany |
| ADF | 0.34 | |||||
| Michez et al. [43] | 2020 | Optical and multispectral sensors | CP | 0.54 | Timothy (Phleum pratense) pasture | Belgium |
| ADF | 0.82 | |||||
| NDF | 0.84 | |||||
| Duranovich et al. [49] | 2020 | Hyperspectral sensors | CP | 0.78 | Perennial ryegrass and white clover sward | New Zealand |
| ADF | 0.55 | |||||
| NDF | 0.54 | |||||
| ME | 0.67 |
1 Abbreviations: CP: crude protein. ADF: acid detergent fiber. NDF: neutral detergent fiber. ME: metabolizable energy.
Publisher’s Note: MDPI stays neutral with regard to jurisdictional claims in published maps and institutional affiliations. |
© 2021 by the authors. Licensee MDPI, Basel, Switzerland. This article is an open access article distributed under the terms and conditions of the Creative Commons Attribution (CC BY) license (https://creativecommons.org/licenses/by/4.0/).
Share and Cite
MDPI and ACS Style
Ghajar, S.; Tracy, B. Proximal Sensing in Grasslands and Pastures. Agriculture 2021, 11, 740. https://0-doi-org.brum.beds.ac.uk/10.3390/agriculture11080740
AMA Style
Ghajar S, Tracy B. Proximal Sensing in Grasslands and Pastures. Agriculture. 2021; 11(8):740. https://0-doi-org.brum.beds.ac.uk/10.3390/agriculture11080740
Chicago/Turabian StyleGhajar, Shayan, and Benjamin Tracy. 2021. "Proximal Sensing in Grasslands and Pastures" Agriculture 11, no. 8: 740. https://0-doi-org.brum.beds.ac.uk/10.3390/agriculture11080740
Note that from the first issue of 2016, this journal uses article numbers instead of page numbers. See further details here.