
Full-Season Cover Crops and Their Traits That Promote Agroecosystem Services

 and
and
Abstract
:1. Introduction
2. Materials and Methods
2.1. Experimental Design
2.2. Data Collection
2.3. Soil Fungal and Bacterial Community Characterization
2.4. Data Analyses
3. Results
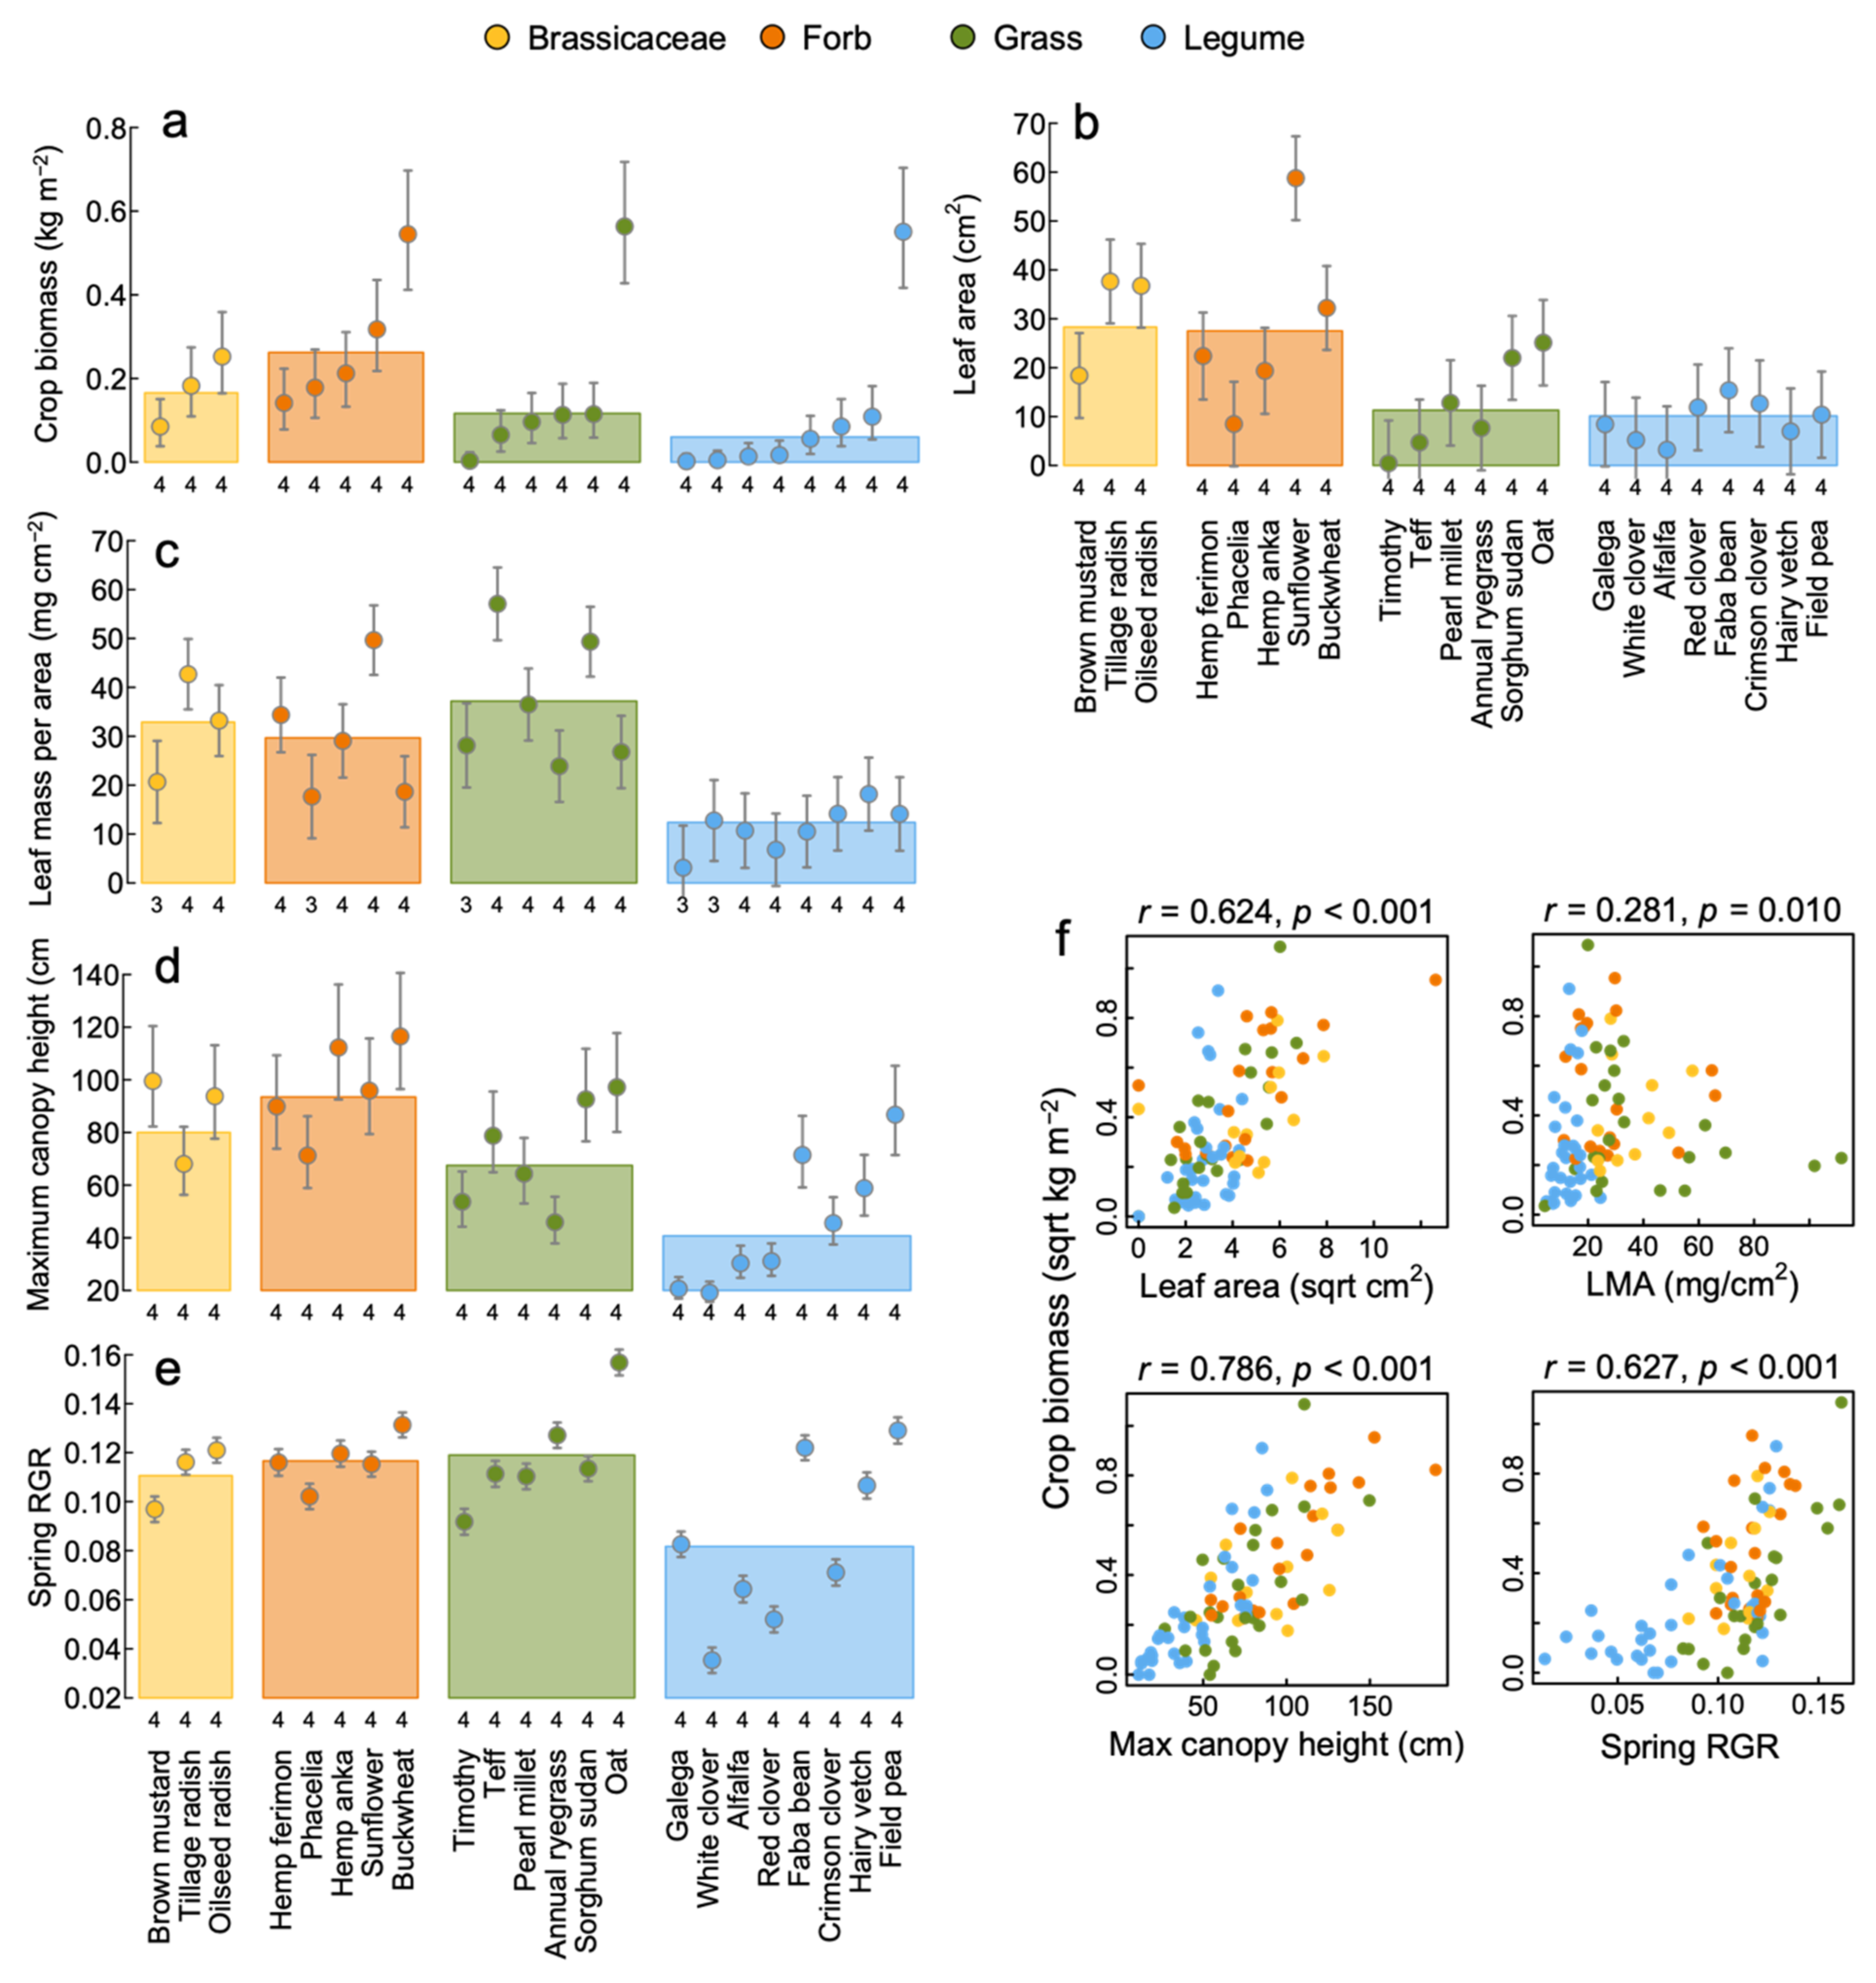
3.1. Aboveground Productivity and Functional Traits
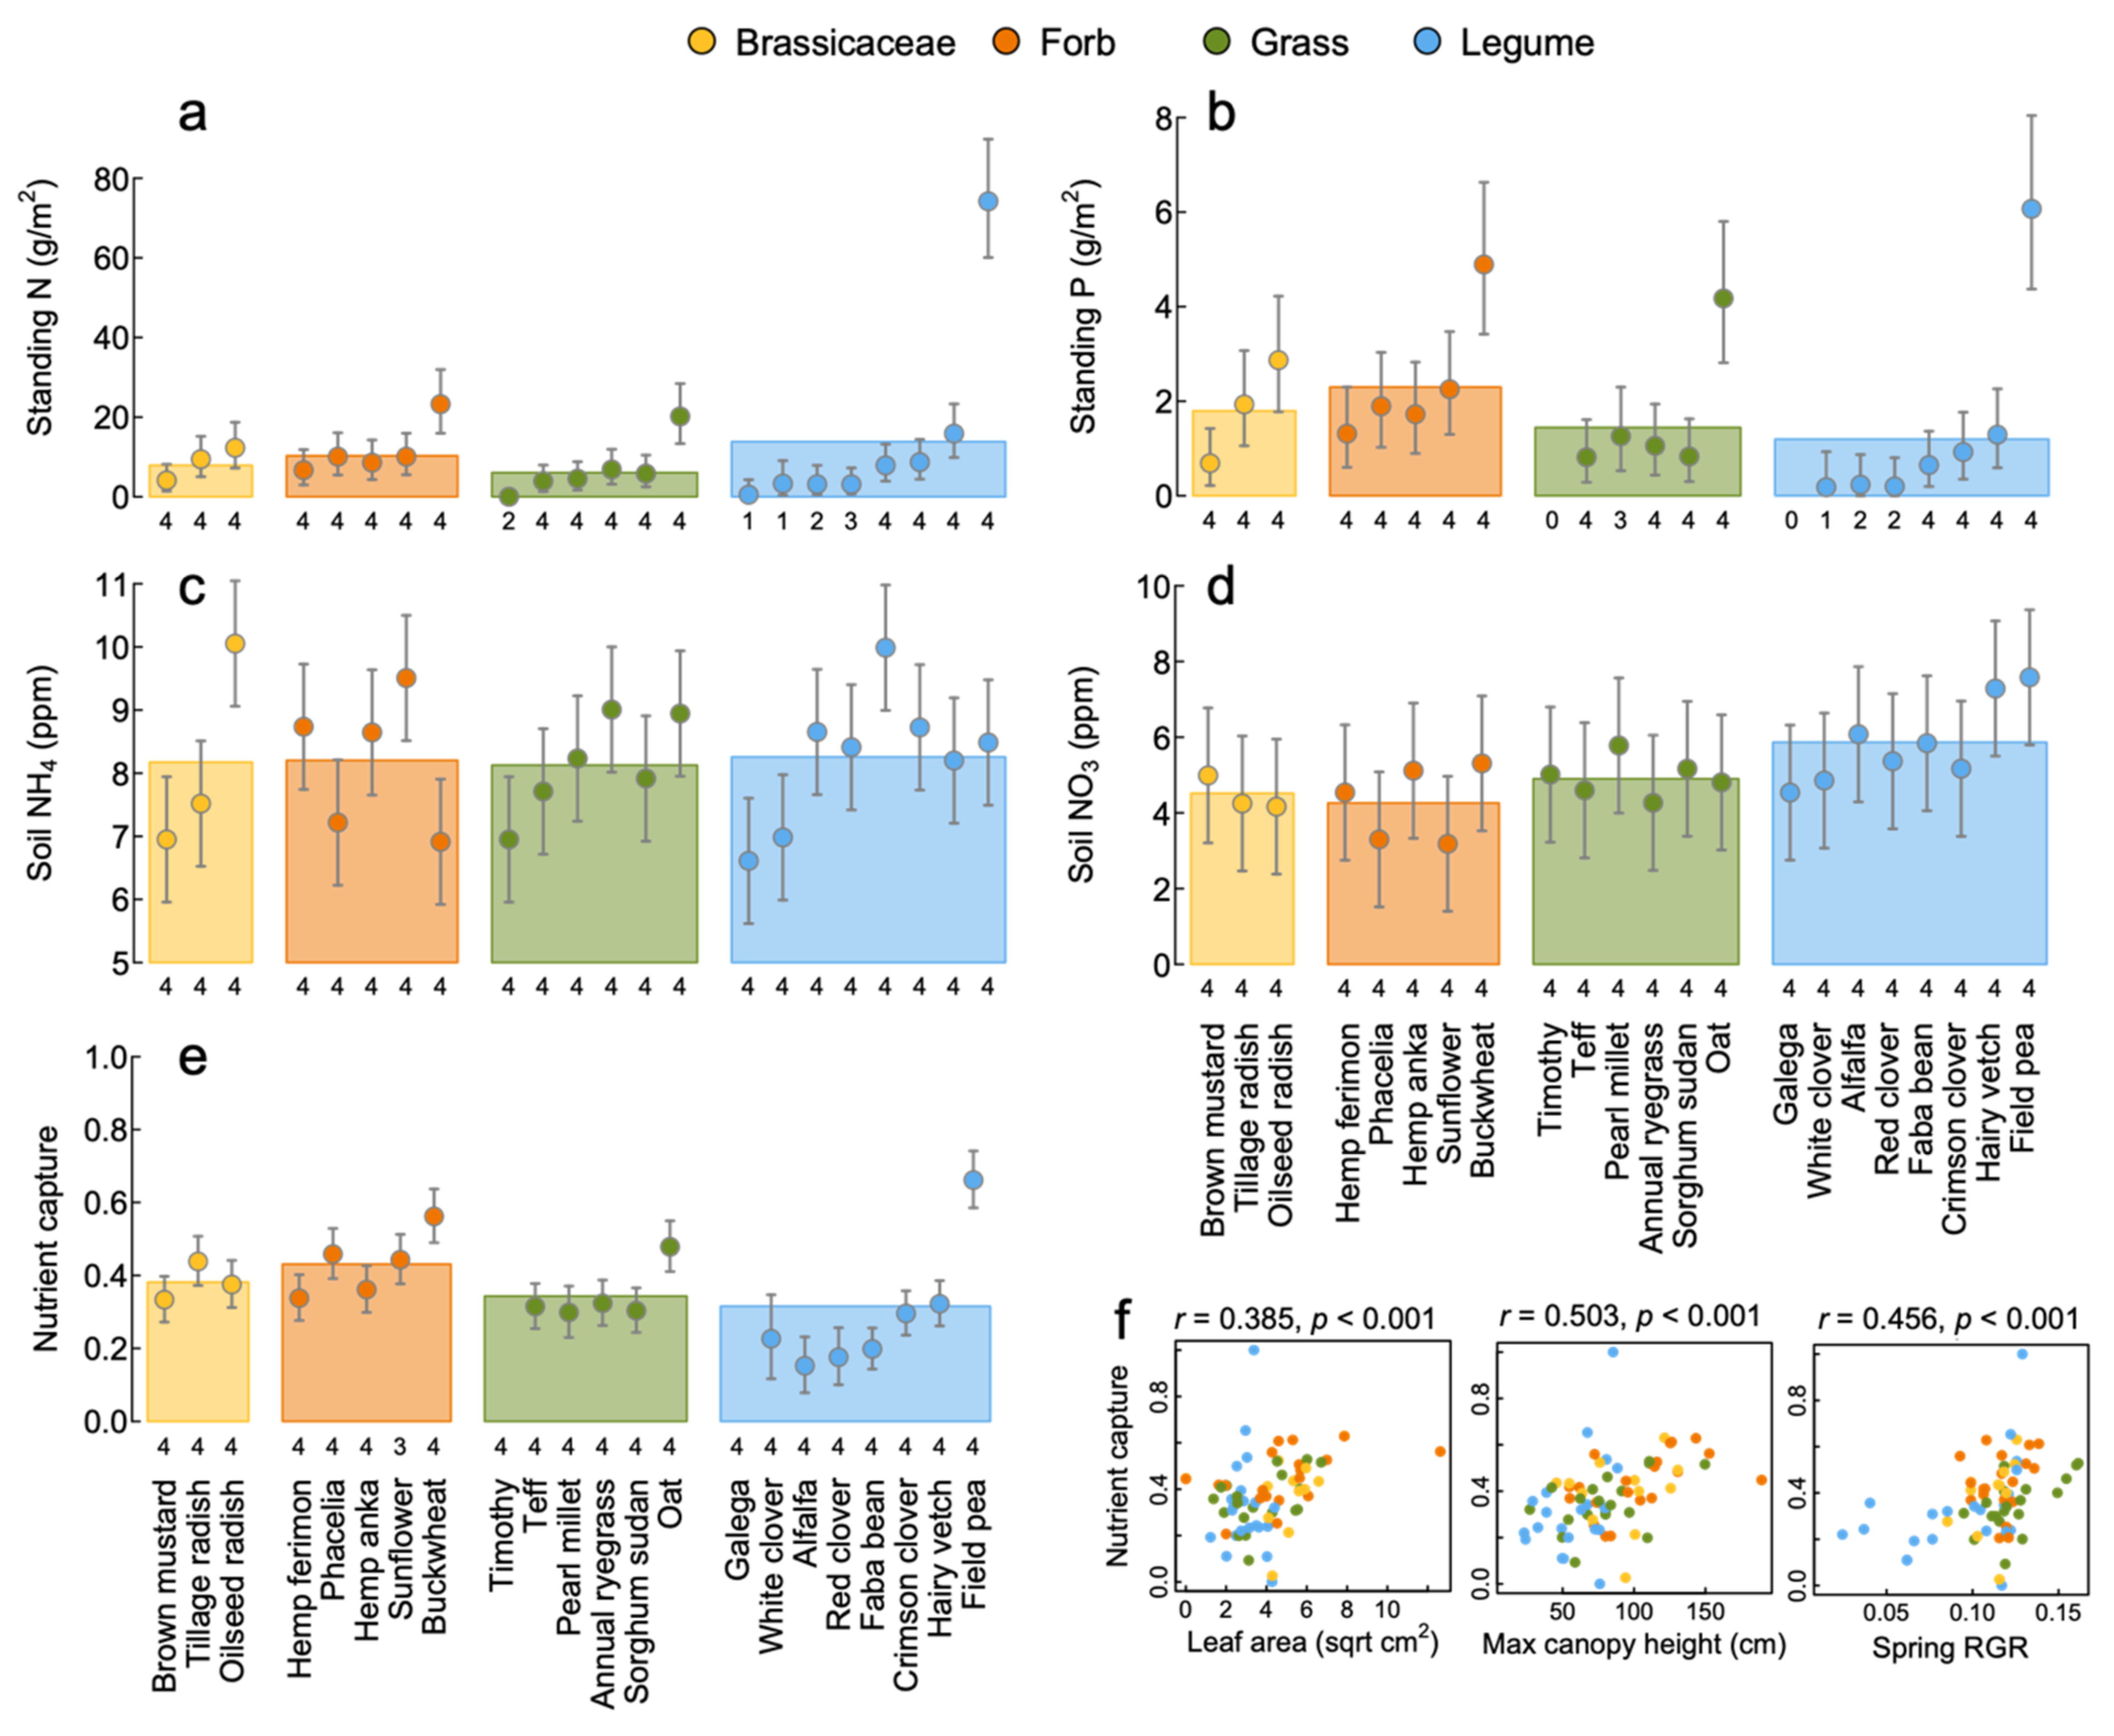
3.2. Nutrient Capture
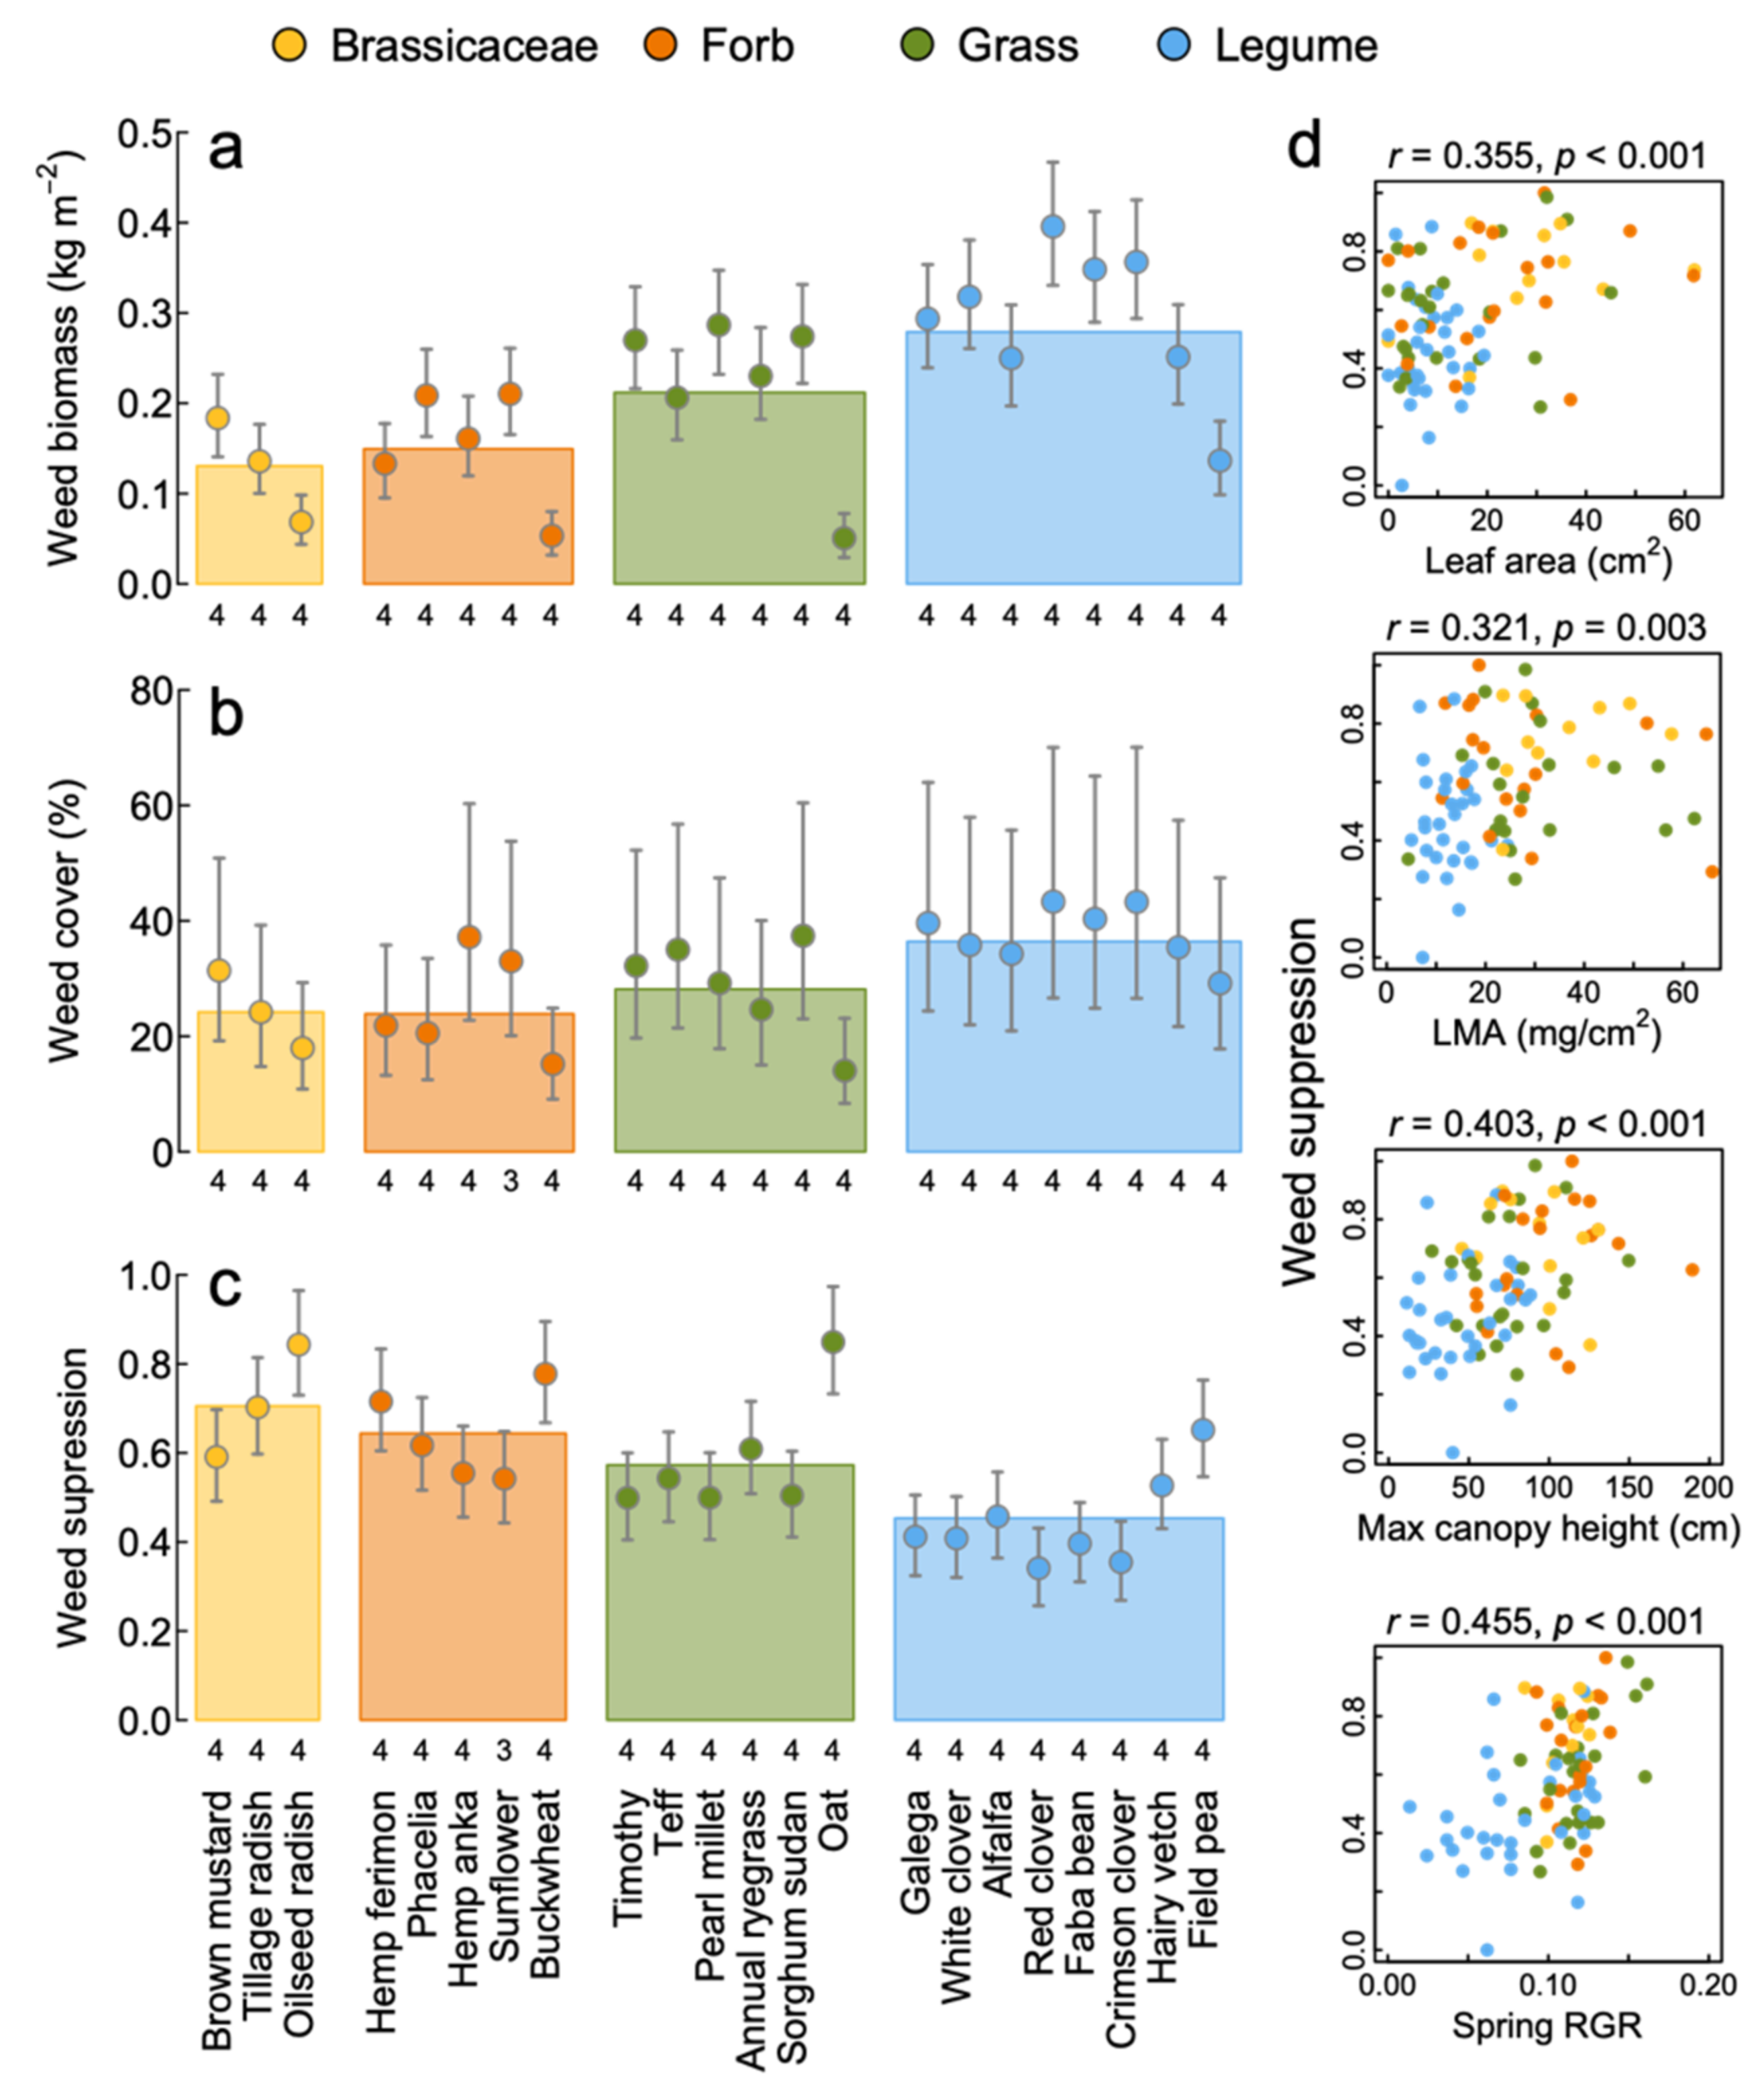
3.3. Weed Suppression
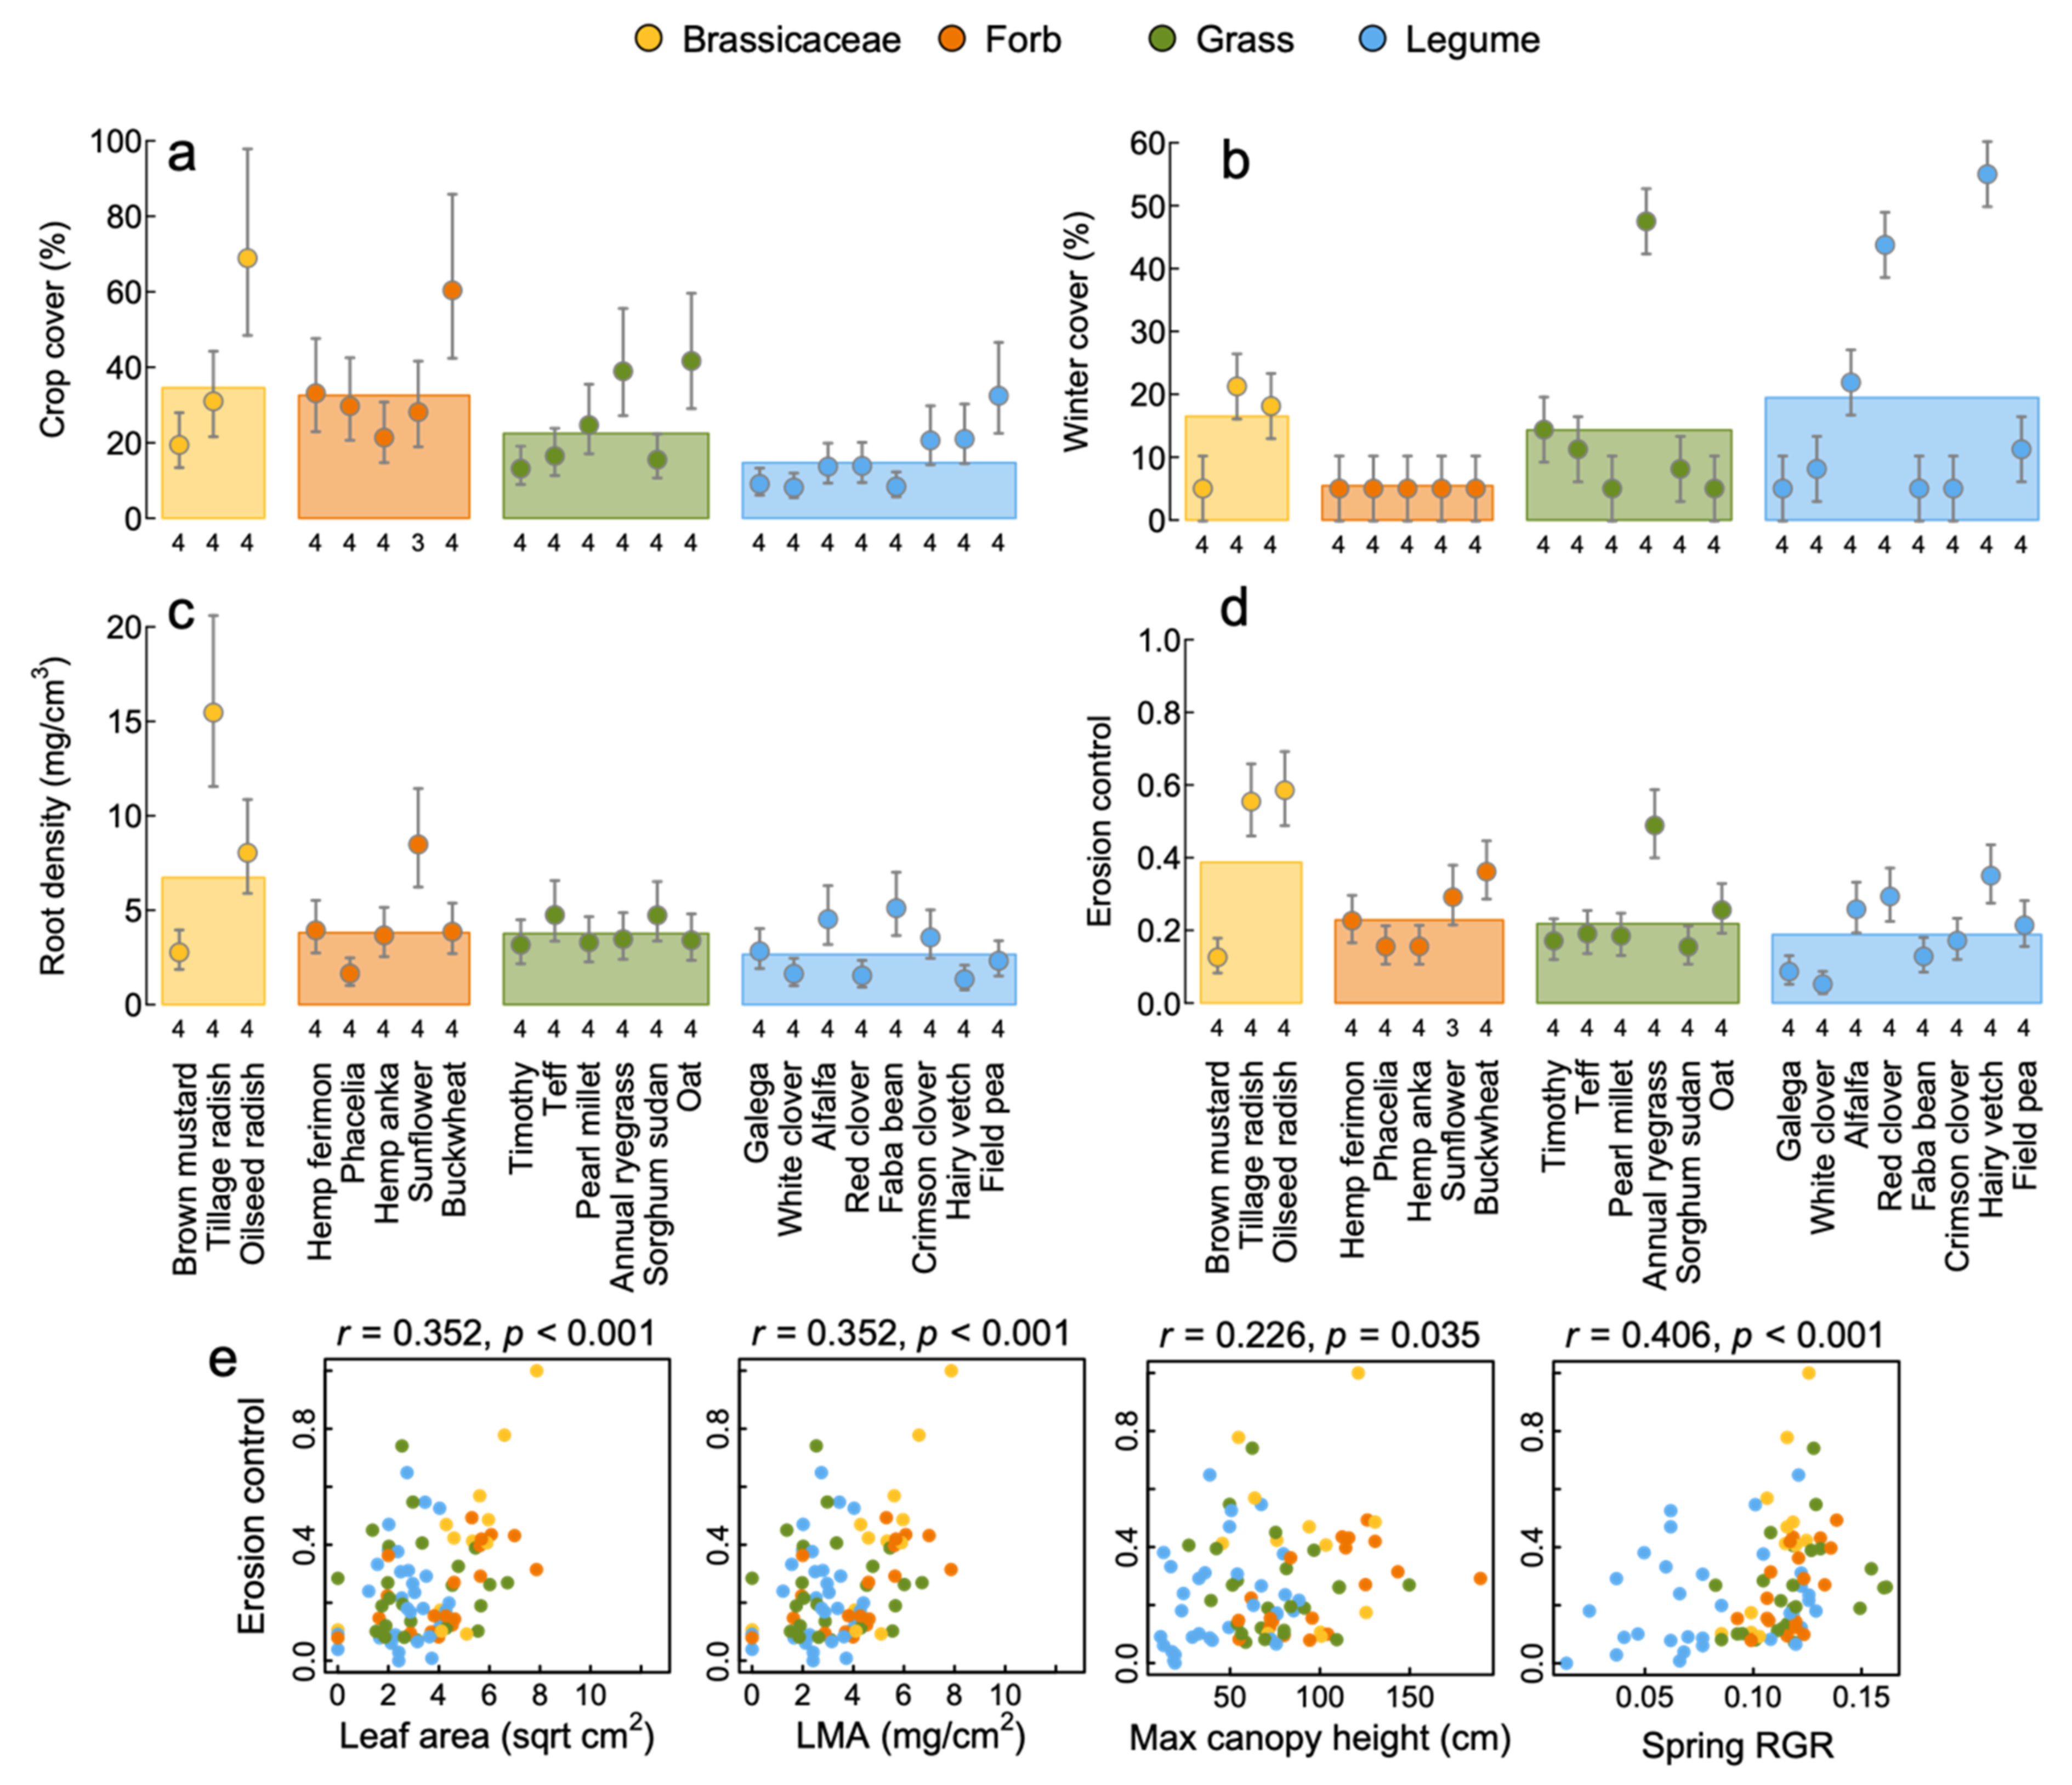
3.4. Erosion Control
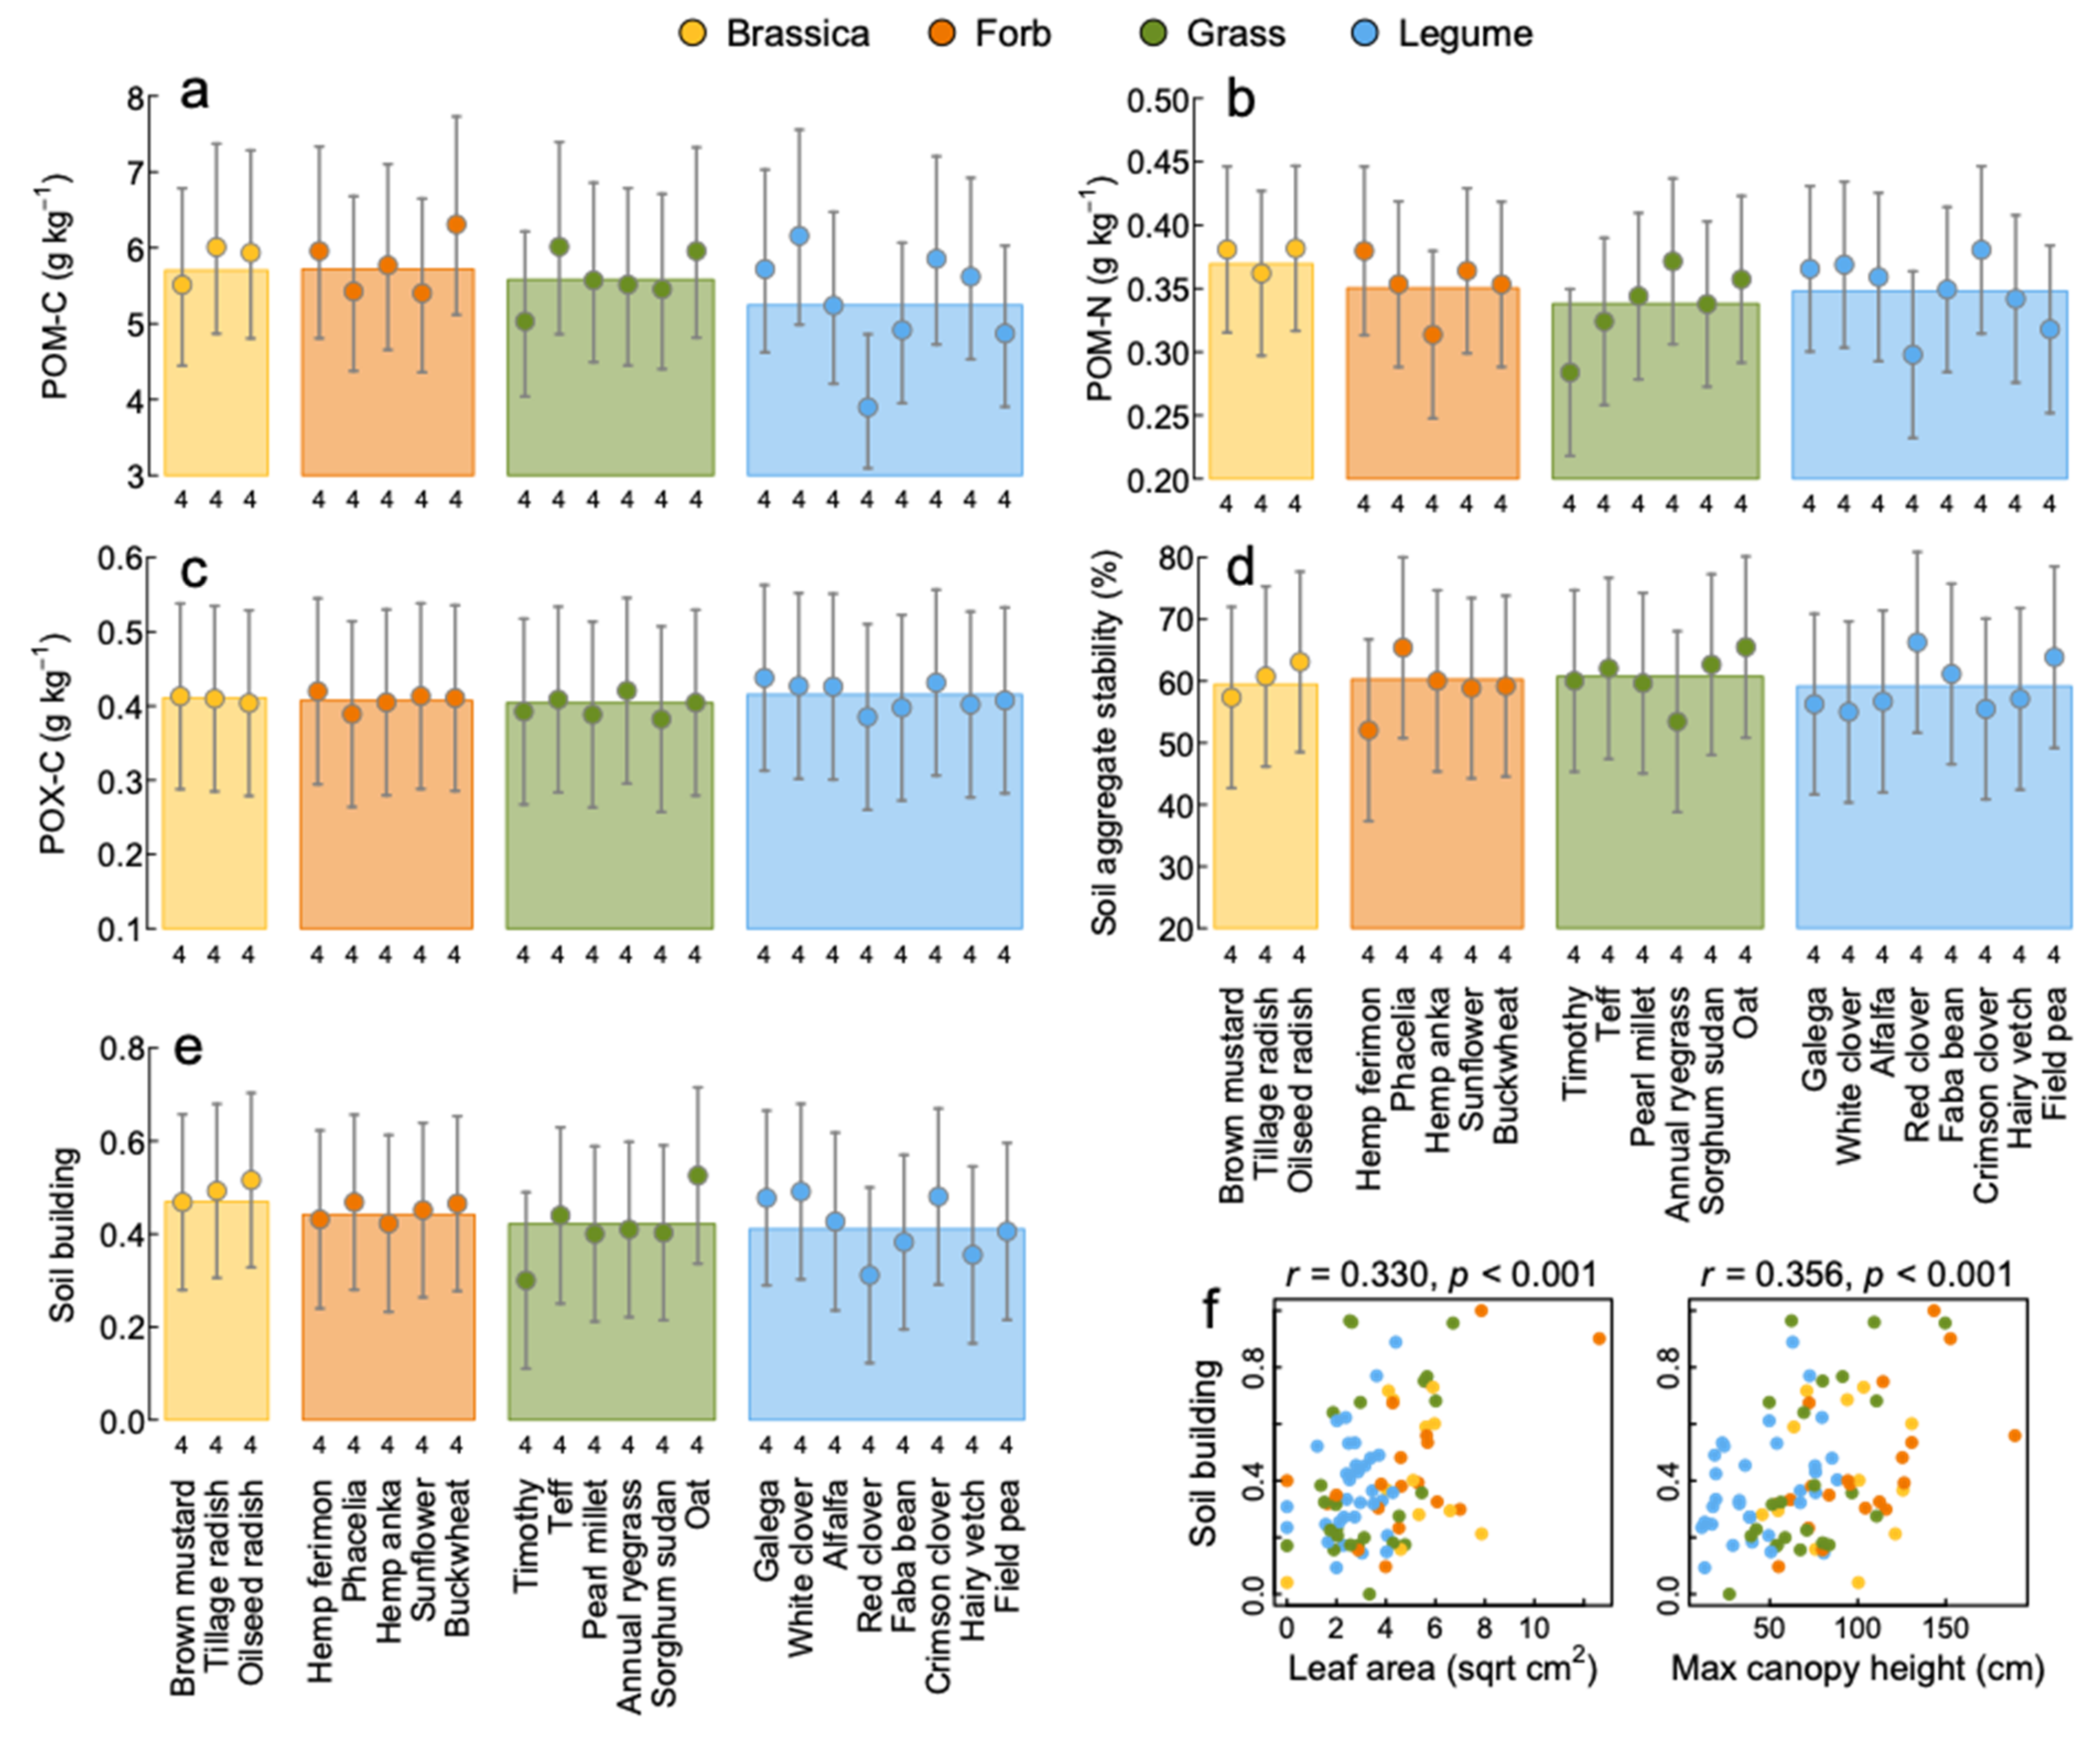
3.5. Soil Building
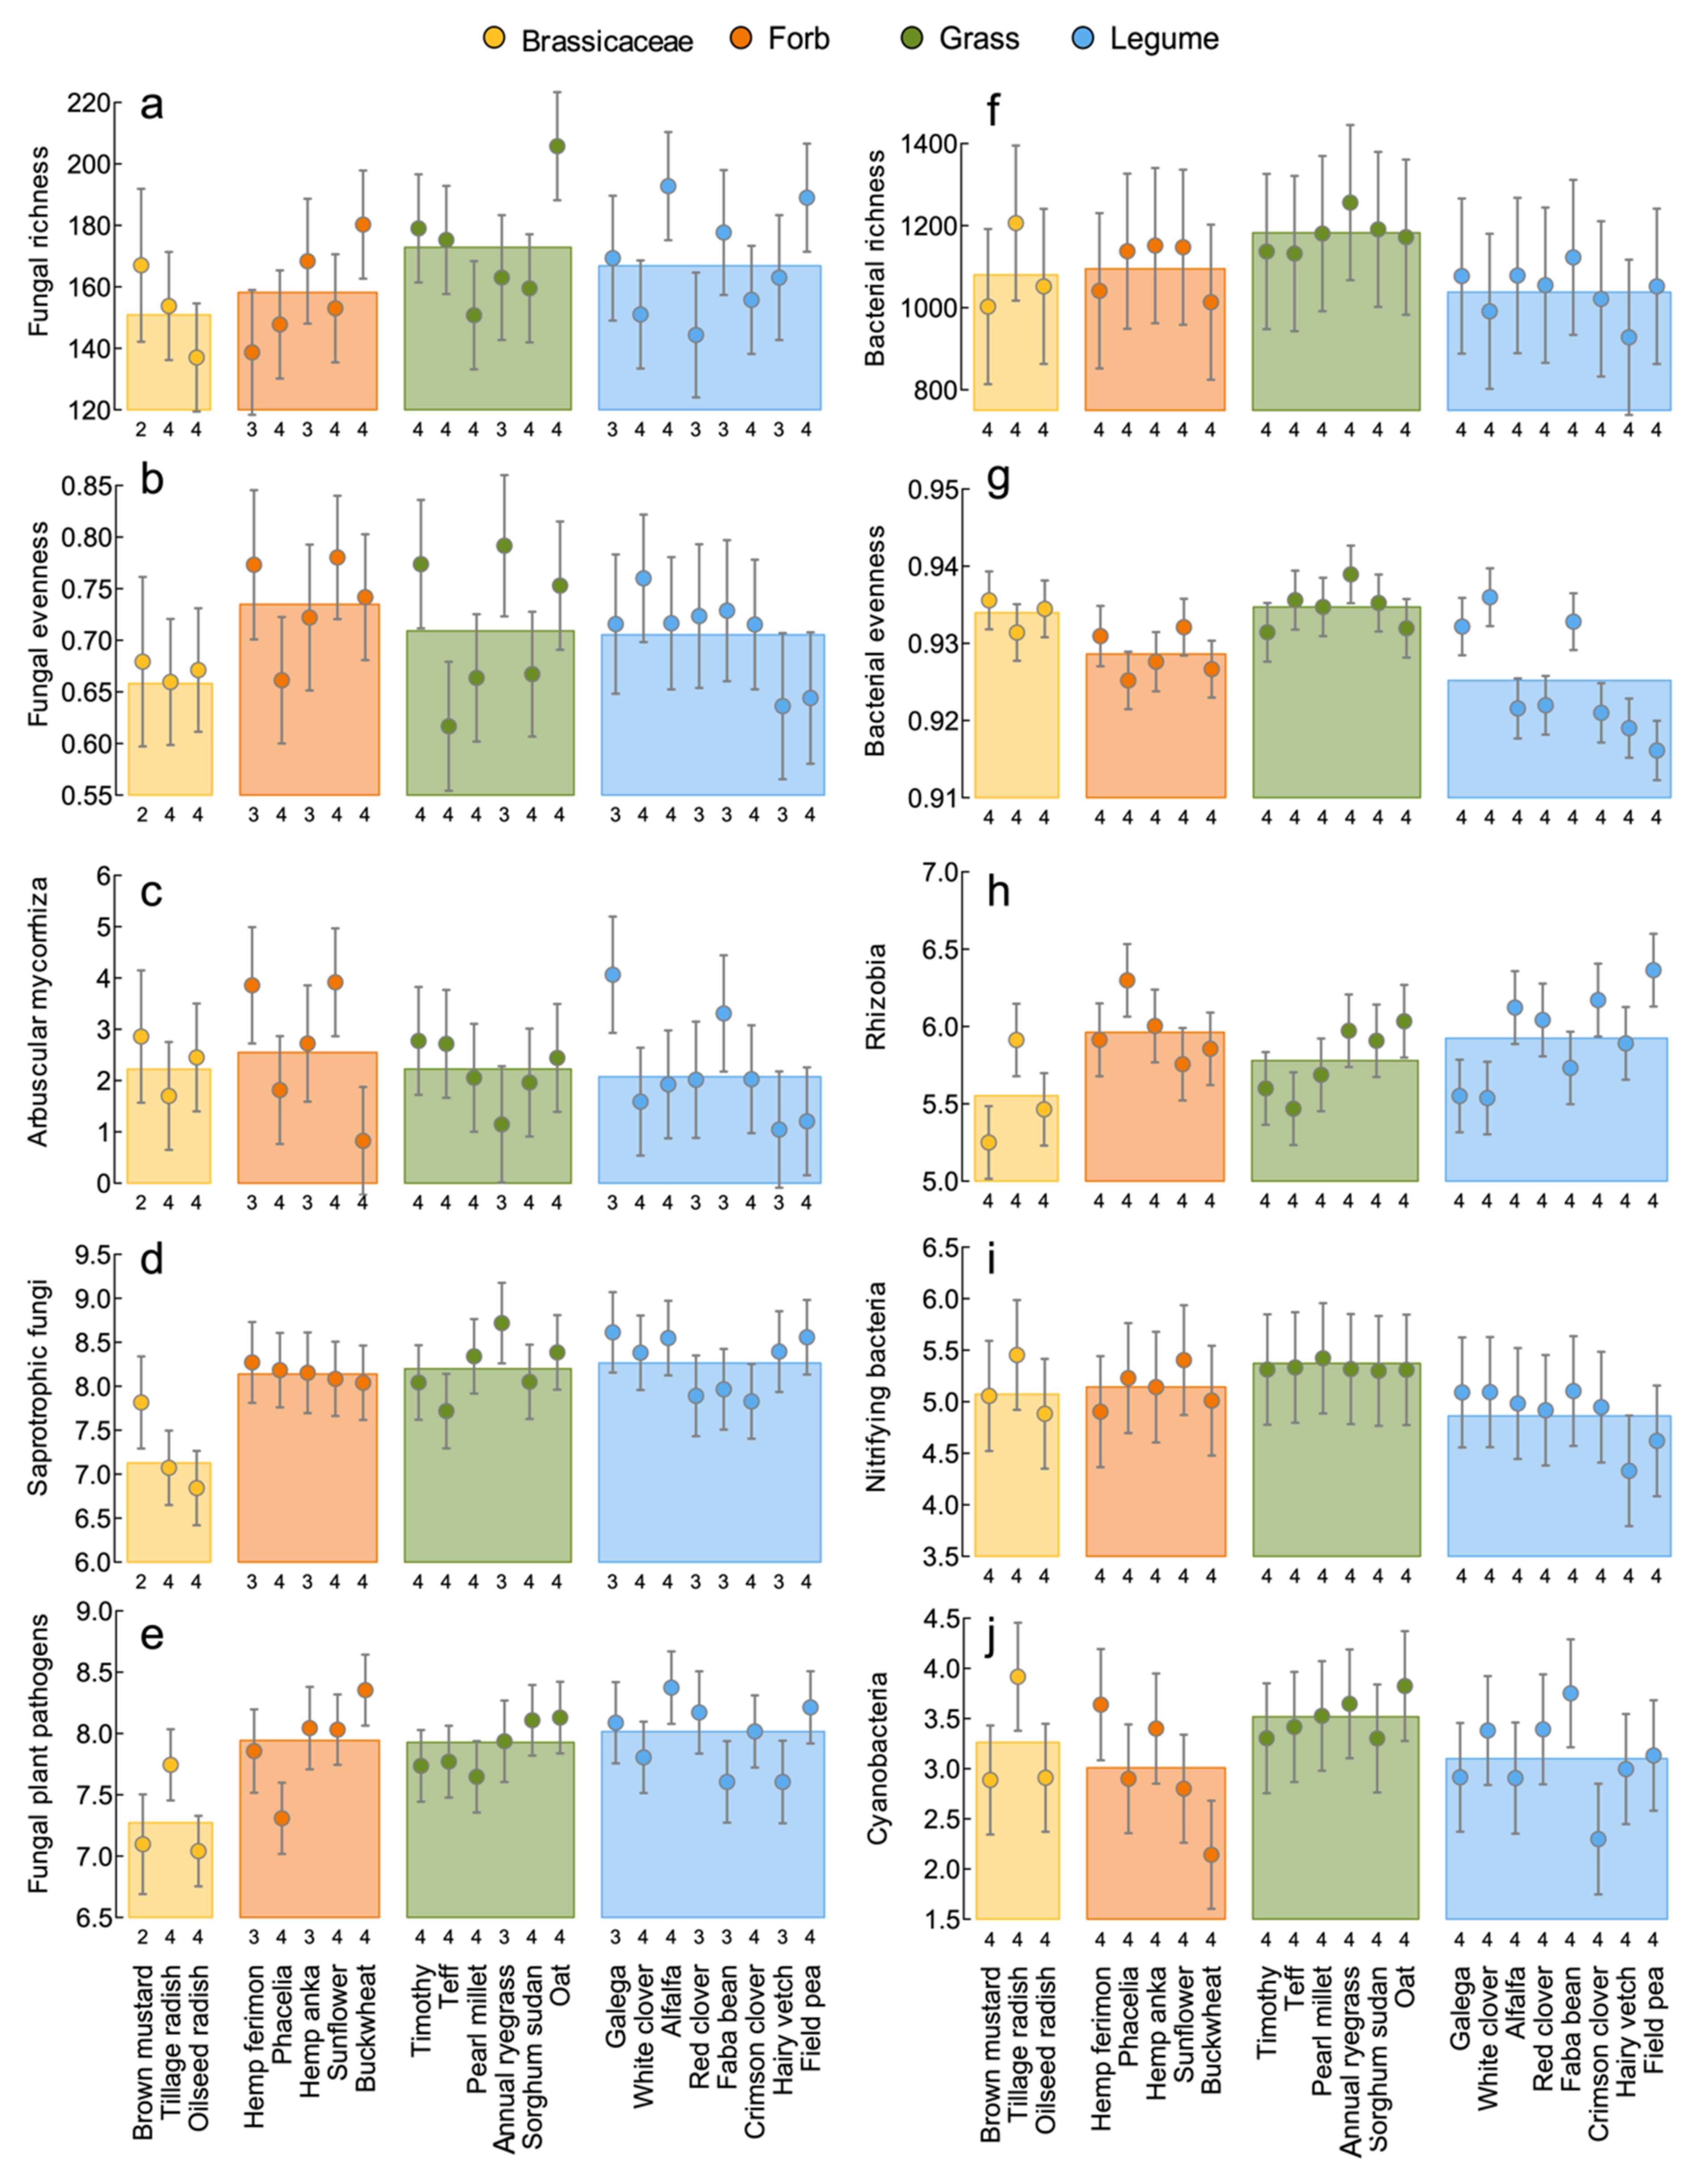
3.6. Soil Health
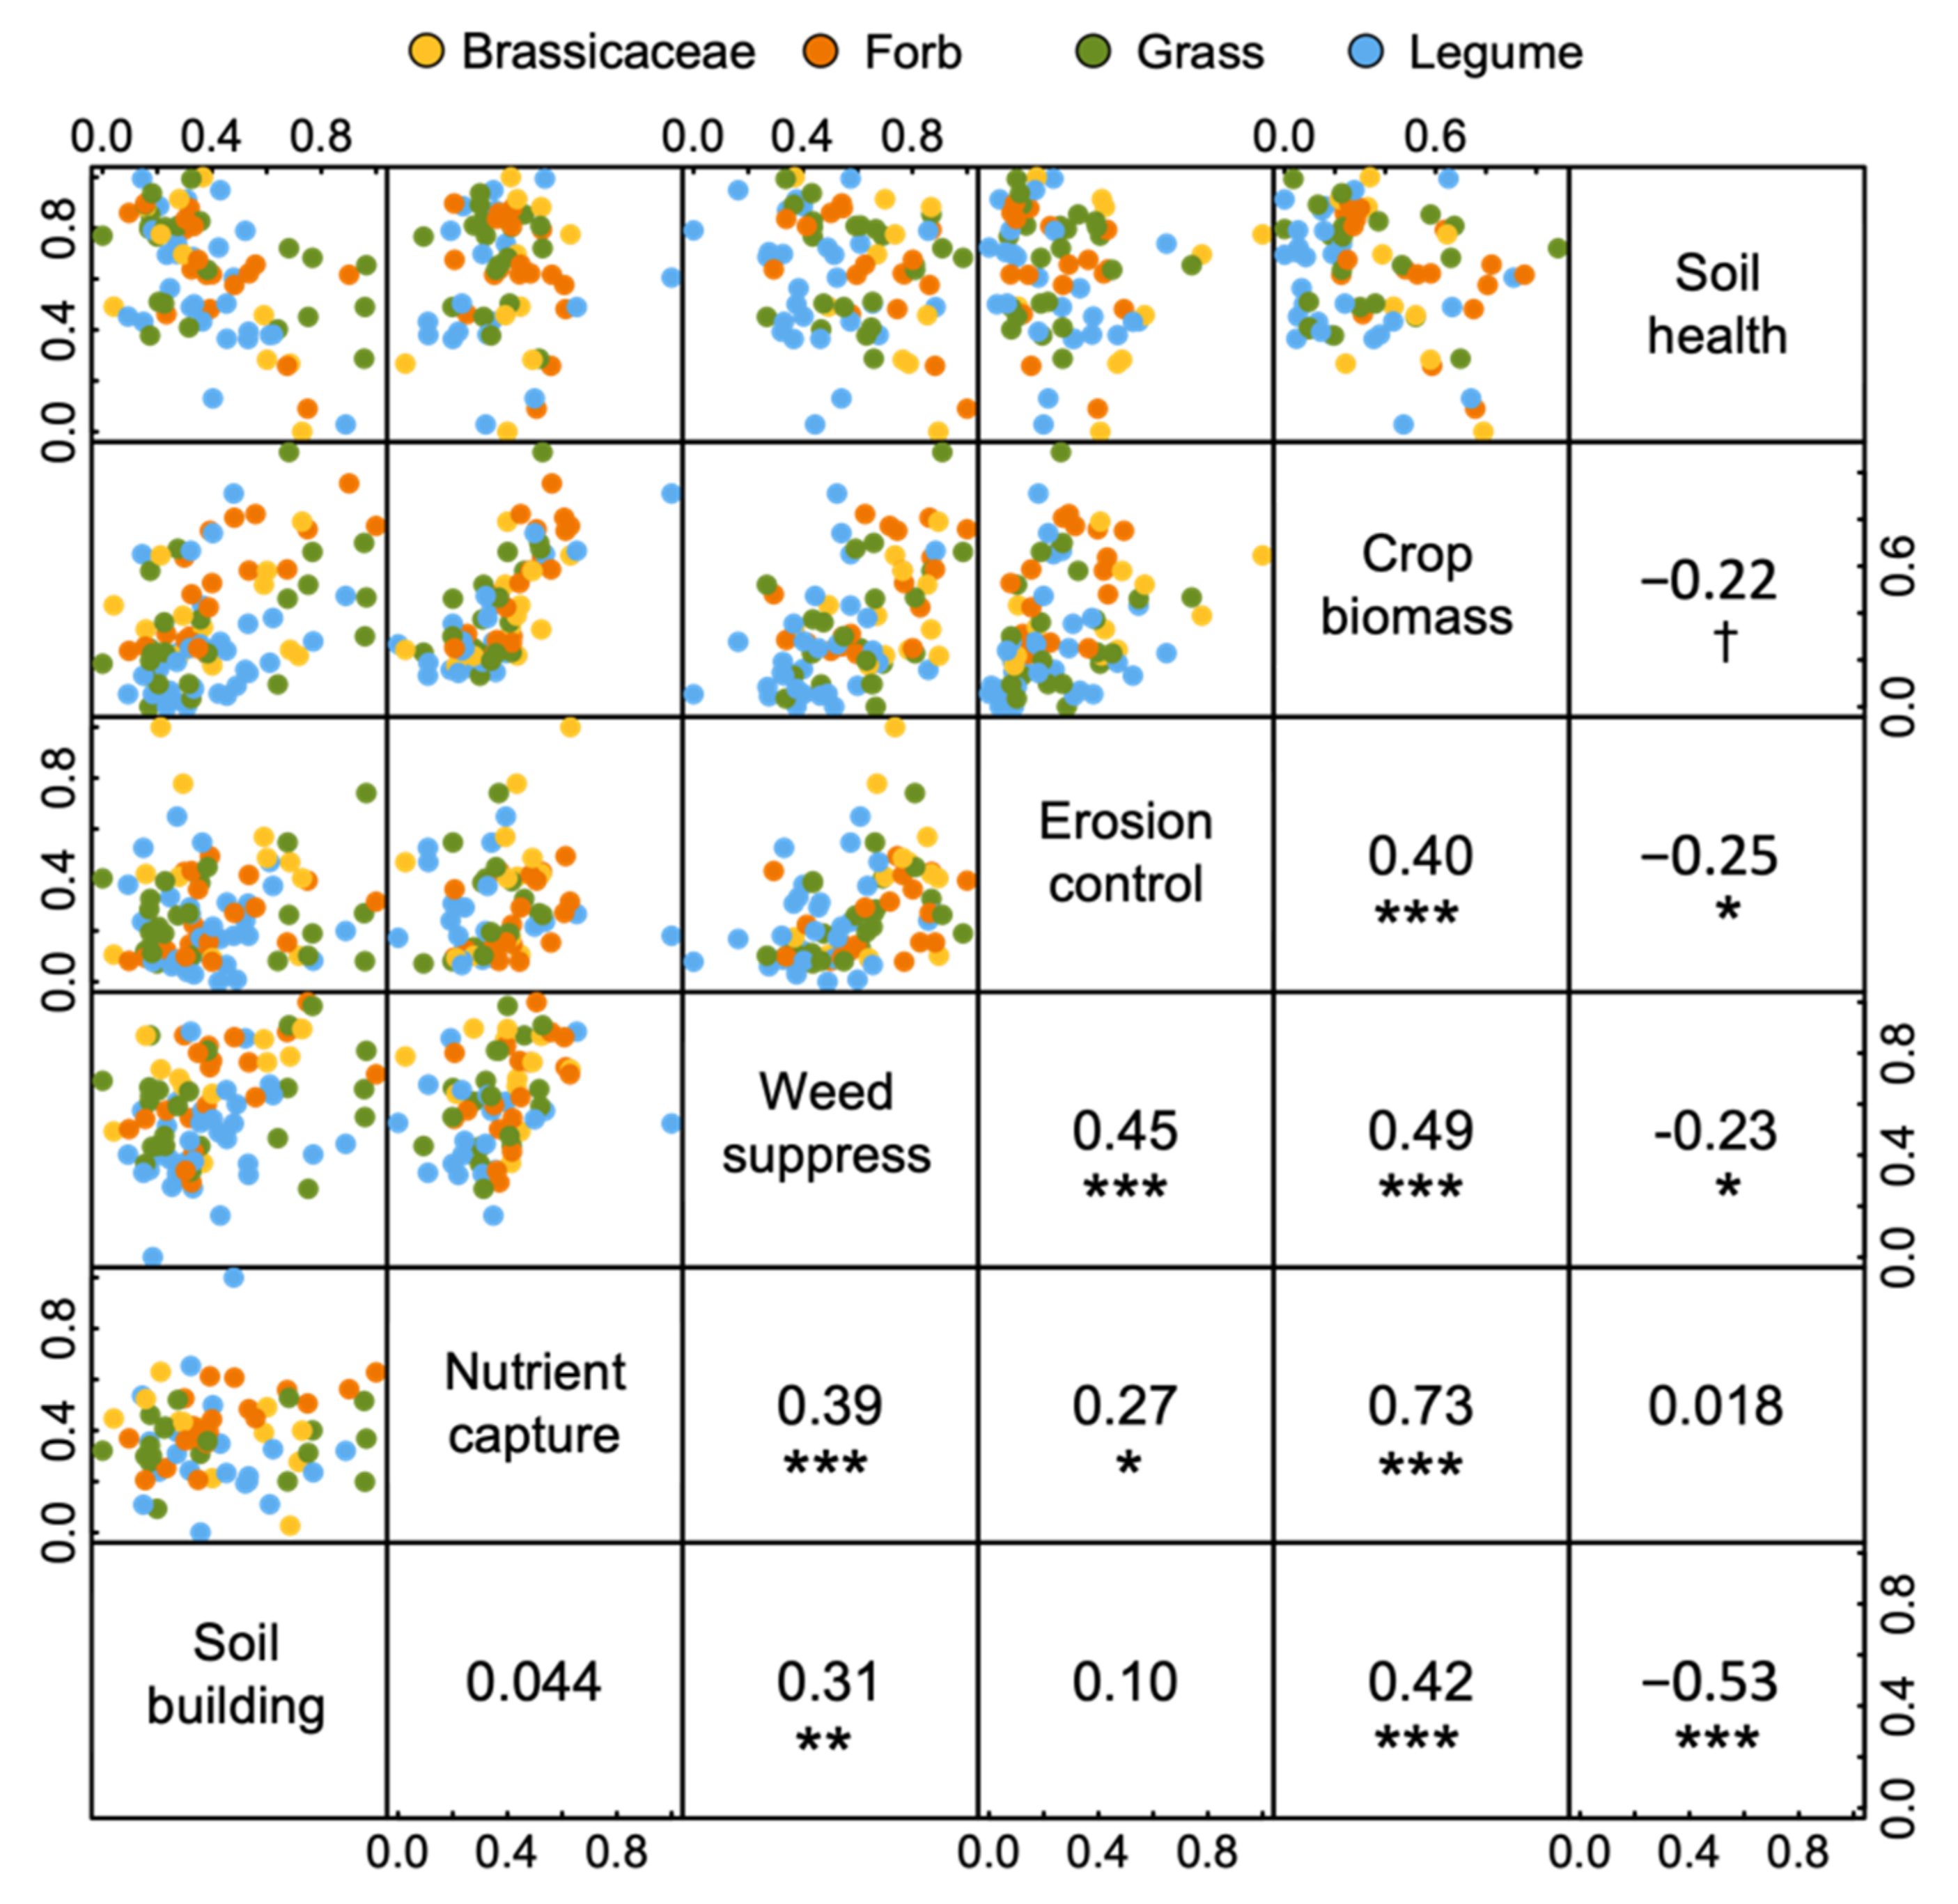
3.7. Correlations among Ecosystem Services
4. Discussion
4.1. Productivity, Nutrient Capture and Weed Suppression
4.2. Soil Building and Erosion Control
4.3. Soil Health: Linking Microbial Communities, Agroecosystem Services and Crop Traits
5. Conclusions
Supplementary Materials
Author Contributions
Funding
Institutional Review Board Statement
Informed Consent Statement
Data Availability Statement
Acknowledgments
Conflicts of Interest
References
- Pretty, J.; Bharucha, Z.P. Sustainable intensification in agricultural systems. Ann. Bot. 2014, 114, 1571–1596. [Google Scholar] [CrossRef]
- Fróna, D.; Szenderák, J.; Harangi-Rákos, M. The Challenge of Feeding the World. Sustainability 2019, 11, 5816. [Google Scholar] [CrossRef] [Green Version]
- Zhang, W.; Ricketts, T.H.; Kremen, C.; Carney, K.; Swinton, S.M. Ecosystem services and dis-services to agriculture. Ecol. Econ. 2007, 64, 253–260. [Google Scholar] [CrossRef] [Green Version]
- Power, A.G. Ecosystem services and agriculture: Tradeoffs and synergies. Philos. Trans. R. Soc. Lond. B Biol. Sci. 2010, 365, 2959–2971. [Google Scholar] [CrossRef]
- Gaba, S.; Lescourret, F.; Boudsocq, S.; Enjalbert, J.; Hinsinger, P.; Journet, E.-P.; Navas, M.-L.; Wery, J.; Louarn, G.; Malézieux, E.; et al. Multiple cropping systems as drivers for providing multiple ecosystem services: From concepts to design. Agron. Sustain. Dev. 2015, 35, 607–623. [Google Scholar] [CrossRef] [Green Version]
- Newbold, T.; Hudson, L.N.; Hill, S.L.; Contu, S.; Lysenko, I.; Senior, R.A.; Börger, L.; Bennett, D.J.; Choimes, A.; Collen, B.; et al. Global effects of land use on local terrestrial biodiversity. Nature 2015, 520, 45–50. [Google Scholar] [CrossRef] [PubMed] [Green Version]
- Emmerson, M.; Morales, M.B.; Oñate, J.J.; Batáry, P.; Berendse, F.; Liira, J.; Aavik, T.; Guerrero, I.; Bommarco, R.; Eggers, S.; et al. How Agricultural Intensification Affects Biodiversity and Ecosystem Services. Adv. Ecol. Res. 2016, 55, 43–97. [Google Scholar]
- Philip Robertson, G.; Gross, K.L.; Hamilton, S.K.; Landis, D.A.; Schmidt, T.M.; Snapp, S.S.; Swinton, S.M. Farming for Ecosystem Services: An Ecological Approach to Production Agriculture. Bioscience 2014, 64, 404–415. [Google Scholar] [CrossRef]
- Tilman, D. Global environmental impacts of agricultural expansion: The need for sustainable and efficient practices. Proc. Natl. Acad. Sci. USA 1999, 96, 5995–6000. [Google Scholar] [CrossRef] [Green Version]
- Bender, S.F.; Wagg, C.; van der Heijden, M.G.A. An Underground Revolution: Biodiversity and Soil Ecological Engineering for Agricultural Sustainability. Trends Ecol. Evol. 2016, 31, 440–452. [Google Scholar] [CrossRef]
- Blanco-Canqui, H.; Shaver, T.M.; Lindquist, J.L.; Shapiro, C.A.; Elmore, R.W.; Francis, C.A.; Hergert, G.W. Cover Crops and Ecosystem Services: Insights from Studies in Temperate Soils. Agron. J. 2015, 107, 2449–2474. [Google Scholar] [CrossRef] [Green Version]
- Daryanto, S.; Fu, B.; Wang, L.; Jacinthe, P.-A.; Zhao, W. Quantitative synthesis on the ecosystem services of cover crops. Earth-Sci. Rev. 2018, 185, 357–373. [Google Scholar] [CrossRef]
- Snapp, S.S.; Swinton, S.M.; Labarta, R.; Mutch, D.; Black, J.R.; Leep, R.; Nyiraneza, J.; O’Neil, K. Evaluating Cover Crops for Benefits, Costs and Performance within Cropping System Niches. Agron. J. 2005, 97, 322–332. [Google Scholar] [CrossRef]
- Abdalla, M.; Hastings, A.; Cheng, K.; Yue, Q.; Chadwick, D.; Espenberg, M.; Truu, J.; Rees, R.M.; Smith, P. A critical review of the impacts of cover crops on nitrogen leaching, net greenhouse gas balance and crop productivity. Glob. Chang. Biol. 2019, 25, 2530–2543. [Google Scholar] [CrossRef] [Green Version]
- Thorup-Kristensen, K.; Magid, J.; Jensen, L.S. Catch crops and green manures as biological tools in nitrogen management in temperate zones. Adv. Agron. 2003, 79, 227–302. [Google Scholar] [CrossRef]
- Wittwer, R.A.; Dorn, B.; Jossi, W.; van der Heijden, M.G. Cover crops support ecological intensification of arable cropping systems. Sci. Rep. 2017, 7, 41911. [Google Scholar] [CrossRef] [Green Version]
- Ordóñez-Fernández, R.; de Torres, M.A.; Márquez-García, J.; Moreno-García, M.; Carbonell-Bojollo, R.M. Legumes used as cover crops to reduce fertilisation problems improving soil nitrate in an organic orchard. Eur. J. Agron. 2018, 95, 1–13. [Google Scholar] [CrossRef]
- Perrone, S.; Grossman, J.; Liebman, A.; Sooksa-nguan, T.; Gutknecht, J. Nitrogen fixation and productivity of winter annual legume cover crops in Upper Midwest organic cropping systems. Nutr. Cycl. Agroecosyst. 2020, 117, 61–76. [Google Scholar] [CrossRef] [Green Version]
- Friberg, H.; Edel-Hermann, V.; Faivre, C.; Gautheron, N.; Fayolle, L.; Faloya, V.; Montfort, F.; Steinberg, C. Cause and duration of mustard incorporation effects on soil-borne plant pathogenic fungi. Soil Biol. Biochem. 2009, 41, 2075–2084. [Google Scholar] [CrossRef]
- Sharma, R.; Sindhu, S.; Sindhu, S.S. Suppression of Alternaria blight disease and plant growth promotion of mustard (Brassica juncea L.) by antagonistic rhizosphere bacteria. Appl. Soil Ecol. 2018, 129, 145–150. [Google Scholar] [CrossRef]
- Jin, X.; Wang, J.; Li, D.; Wu, F.; Zhou, X. Rotations with Indian Mustard and Wild Rocket Suppressed Cucumber Fusarium Wilt Disease and Changed Rhizosphere Bacterial Communities. Microorganisms 2019, 7, 57. [Google Scholar] [CrossRef] [PubMed] [Green Version]
- Teasdale, J.R. Contribution of Cover Crops to Weed Management in Sustainable Agricultural Systems. J. Prod. Agric. 1996, 9, 475–479. [Google Scholar] [CrossRef]
- Teasdale, J.R.; Brandsaeter, L.O.; Calegari, A.; Skora Neto, F. Cover Crops and Weed Management. In Non-Chemical Weed Management: Principles, Concepts and Technology; Upadhyaya, M.K., Blackshaw, R.E., Eds.; CABI: Wallingford, UK, 2007. [Google Scholar]
- Brust, J.; Claupein, W.; Gerhards, R. Growth and weed suppression ability of common and new cover crops in Germany. Crop Prot. 2014, 63, 1–8. [Google Scholar] [CrossRef]
- Lefebvre, M.; Leblanc, M.L.; Watson, A.K. Seed Dormancy and Seed Morphology Related to Weed Susceptibility to Biofumigation. Weed Sci. 2018, 66, 199–214. [Google Scholar] [CrossRef]
- Tribouillois, H.; Fort, F.; Cruz, P.; Charles, R.; Flores, O.; Garnier, E.; Justes, E. A functional characterisation of a wide range of cover crop species: Growth and nitrogen acquisition rates, leaf traits and ecological strategies. PLoS ONE 2015, 10, e0122156. [Google Scholar] [CrossRef] [PubMed]
- Blesh, J. Functional traits in cover crop mixtures: Biological nitrogen fixation and multifunctionality. J. Appl. Ecol. 2018, 55, 38–48. [Google Scholar] [CrossRef] [Green Version]
- Wendling, M.; Büchi, L.; Amossé, C.; Sinaj, S.; Walter, A.; Charles, R. Influence of root and leaf traits on the uptake of nutrients in cover crops. Plant Soil 2016, 409, 419–434. [Google Scholar] [CrossRef] [Green Version]
- Saleem, M.; Pervaiz, Z.H.; Contreras, J.; Lindenberger, J.H.; Hupp, B.M.; Chen, D.; Zhang, Q.; Wang, C.; Iqbal, J.; Twigg, P. Cover crop diversity improves multiple soil properties via altering root architectural traits. Rhizosphere 2020, 16, 100248. [Google Scholar] [CrossRef]
- Caruso, C.M.; Maherali, H.; Martin, R.A. A meta-analysis of natural selection on plant functional traits. Int. J. Plant Sci. 2020, 181, 44–55. [Google Scholar] [CrossRef]
- Reich, P.B.; Wright, I.J.; Cavender-Bares, J.; Craine, J.M.; Oleksyn, J.; Westoby, M.; Walters, M.B. The Evolution of Plant Functional Variation: Traits, Spectra, and Strategies. Int. J. Plant Sci. 2003, 164, S143–S164. [Google Scholar] [CrossRef]
- Petchey, O.L.; Gaston, K.J. Functional diversity: Back to basics and looking forward. Ecol. Lett. 2006, 9, 741–758. [Google Scholar] [CrossRef]
- Díaz, S.; Lavorel, S.; de Bello, F.; Quétier, F.; Grigulis, K.; Robson, T.M. Incorporating plant functional diversity effects in ecosystem service assessments. Proc. Natl. Acad. Sci. USA 2007, 104, 20684. [Google Scholar] [CrossRef] [Green Version]
- Faucon, M.-P.; Houben, D.; Lambers, H. Plant Functional Traits: Soil and Ecosystem Services. Trends Plant Sci. 2017, 22, 385–394. [Google Scholar] [CrossRef]
- Funk, J.L.; Larson, J.E.; Ames, G.M.; Butterfield, B.J.; Cavender-Bares, J.; Firn, J.; Laughlin, D.C.; Sutton-Grier, A.E.; Williams, L.; Wright, J. Revisiting the Holy Grail: Using plant functional traits to understand ecological processes. Biol. Rev. 2017, 92, 1156–1173. [Google Scholar] [CrossRef]
- Liu, C.; Li, Y.; Yan, P.; He, N. How to Improve the Predictions of Plant Functional Traits on Ecosystem Functioning? Front. Plant Sci. 2021, 12, 96. [Google Scholar] [CrossRef]
- Lavorel, S.; Garnier, E. Predicting changes in community composition and ecosystem functioning from plant traits: Revisiting the Holy Grail. Funct. Ecol. 2002, 16, 545–556. [Google Scholar] [CrossRef]
- Ackerly, D.D.; Cornwell, W.K. A trait-based approach to community assembly: Partitioning of species trait values into within- and among-community components. Ecol. Lett. 2007, 10, 135–145. [Google Scholar] [CrossRef] [PubMed]
- Kunstler, G.; Lavergne, S.; Courbaud, B.; Thuiller, W.; Vieilledent, G.; Zimmermann, N.E.; Kattge, J.; Coomes, D.A. Competitive interactions between forest trees are driven by species’ trait hierarchy, not phylogenetic or functional similarity: Implications for forest community assembly. Ecol. Lett. 2012, 15, 831–840. [Google Scholar] [CrossRef] [PubMed] [Green Version]
- Kunstler, G.; Falster, D.; Coomes, D.A.; Hui, F.; Kooyman, R.M.; Laughlin, D.C.; Poorter, L.; Vanderwel, M.; Vieilledent, G.; Wright, S.J.; et al. Plant functional traits have globally consistent effects on competition. Nature 2016, 529, 204–207. [Google Scholar] [CrossRef] [Green Version]
- Wagg, C.; Ebeling, A.; Roscher, C.; Ravenek, J.; Bachmann, D.; Eisenhauer, N.; Mommer, L.; Buchmann, N.; Hillebrand, H.; Schmid, B.; et al. Functional trait dissimilarity drives both species complementarity and competitive disparity. Funct. Ecol. 2017, 31, 2320–2329. [Google Scholar] [CrossRef]
- Poorter, H.; Niinemets, Ü.; Poorter, L.; Wright, I.J.; Villar, R. Causes and consequences of variation in leaf mass per area (LMA): A meta-analysis. New Phytol. 2009, 182, 565–588. [Google Scholar] [CrossRef]
- Neves, F.S.; Araújo, L.S.; Espírito-Santo, M.M.; Fagundes, M.; Fernandes, G.W.; Sanchez-Azofeifa, G.A.; Quesada, M. Canopy Herbivory and Insect Herbivore Diversity in a Dry Forest–Savanna Transition in Brazil. Biotropica 2010, 42, 112–118. [Google Scholar] [CrossRef]
- Loughnan, D.; Williams, J.L. Climate and leaf traits, not latitude, explain variation in plant–herbivore interactions across a species’ range. J. Ecol. 2019, 107, 913–922. [Google Scholar] [CrossRef]
- Schuldt, A.; Ebeling, A.; Kunz, M.; Staab, M.; Guimarães-Steinicke, C.; Bachmann, D.; Buchmann, N.; Durka, W.; Fichtner, A.; Fornoff, F.; et al. Multiple plant diversity components drive consumer communities across ecosystems. Nat. Commun. 2019, 10, 1460. [Google Scholar] [CrossRef] [Green Version]
- De Vries, F.T.; Manning, P.; Tallowin, J.R.B.; Mortimer, S.R.; Pilgrim, E.S.; Harrison, K.A.; Hobbs, P.J.; Quirk, H.; Shipley, B.; Cornelissen, J.H.C.; et al. Abiotic drivers and plant traits explain landscape-scale patterns in soil microbial communities. Ecol. Lett. 2012, 15, 1230–1239. [Google Scholar] [CrossRef] [PubMed]
- Cortois, R.; Schröder-Georgi, T.; Weigelt, A.; van der Putten, W.H.; De Deyn, G.B. Plant–soil feedbacks: Role of plant functional group and plant traits. J. Ecol. 2016, 104, 1608–1617. [Google Scholar] [CrossRef]
- Baets, S.D.; Poesen, J.; Knapen, A.; Galindo, P. Impact of root architecture on the erosion-reducing potential of roots during concentrated flow. Earth Surf. Process. Landf. 2007, 32, 1323–1345. [Google Scholar] [CrossRef]
- Stokes, A.; Atger, C.; Bengough, A.G.; Fourcaud, T.; Sidle, R.C. Desirable plant root traits for protecting natural and engineered slopes against landslides. Plant Soil 2009, 324, 1–30. [Google Scholar] [CrossRef]
- Macleod, C.J.A.; Humphreys, M.W.; Whalley, W.R.; Turner, L.; Binley, A.; Watts, C.W.; Skøt, L.; Joynes, A.; Hawkins, S.; King, I.P.; et al. A novel grass hybrid to reduce flood generation in temperate regions. Sci. Rep. 2013, 3, 1683. [Google Scholar] [CrossRef] [Green Version]
- Costanzo, A.; Bàrberi, P. Functional agrobiodiversity and agroecosystem services in sustainable wheat production. A review. Agron. Sustain. Dev. 2014, 34, 327–348. [Google Scholar] [CrossRef] [Green Version]
- Londo, G. The decimal scale for releves of permanent quadrats. Vegetatio 1976, 33, 61–64. [Google Scholar] [CrossRef]
- Meyer, S.T.; Scheithe, L.; Hertzog, L.; Ebeling, A.; Wagg, C.; Roscher, C.; Weisser, W.W. Consistent increase in herbivory along two experimental plant diversity gradients over multiple years. Ecosphere 2017, 8, e01876. [Google Scholar] [CrossRef] [Green Version]
- Keeney, D.R.; Nelson, D.W. Nitrogen—Inorganic Forms. Methods Soil Anal. 1983, 643–698. [Google Scholar] [CrossRef]
- Nelson, D.W. Determination of ammonium in KCl extracts of soils by the salicylate method. Commun. Soil Sci. Plant Anal. 1983, 14, 1051–1062. [Google Scholar] [CrossRef]
- Angers, D.A.; Mehuys, G.R. Aggregate stabiltiy to water. In Soil Sampling and Methods of Analysis; Carter, M.R., Ed.; CRC Press: Boca Raton, FL, USA, 1993; pp. 651–657. [Google Scholar]
- Culman, S.W.; Snapp, S.S.; Freeman, M.A.; Schipanski, M.E.; Beniston, J.; Lal, R.; Drinkwater, L.E.; Franzluebbers, A.J.; Glover, J.D.; Grandy, A.S.; et al. Permanganate Oxidizable Carbon Reflects a Processed Soil Fraction that is Sensitive to Management. Soil Sci. Soc. Am. J. 2012, 76, 494–504. [Google Scholar] [CrossRef] [Green Version]
- Gardes, M.; Bruns, T.D. ITS primers with enhanced specificity for basidiomycetes—Application to the identification of mycorrhizae and rusts. Mol. Ecol. 1993, 2, 113–118. [Google Scholar] [CrossRef] [PubMed]
- White, T.J.; Bruns, T.; Lee, S.; Taylor, J. Amplification and direct sequencing of fungal ribosomal RNA genes for phylogenetics. PCR Protoc. A Guide Methods Appl. 1990, 18, 315–322. [Google Scholar]
- Herlemann, D.P.R.; Labrenz, M.; Jürgens, K.; Bertilsson, S.; Waniek, J.J.; Andersson, A.F. Transitions in bacterial communities along the 2000 km salinity gradient of the Baltic Sea. ISME J. 2011, 5, 1571–1579. [Google Scholar] [CrossRef] [PubMed] [Green Version]
- McMurdie, P.J.; Holmes, S. Waste not, want not: Why rarefying microbiome data is inadmissible. PLoS Comput. Biol. 2014, 10, e1003531. [Google Scholar] [CrossRef] [Green Version]
- Bolyen, E.; Rideout, J.R.; Dillon, M.R.; Bokulich, N.A.; Abnet, C.C.; Al-Ghalith, G.A.; Alexander, H.; Alm, E.J.; Arumugam, M.; Asnicar, F.; et al. Reproducible, interactive, scalable and extensible microbiome data science using QIIME 2. Nat. Biotechnol. 2019, 37, 852–857. [Google Scholar] [CrossRef]
- Callahan, B.J.; McMurdie, P.J.; Rosen, M.J.; Han, A.W.; Johnson, A.J.A.; Holmes, S.P. DADA2: High-resolution sample inference from Illumina amplicon data. Nat. Methods 2016, 13, 581–583. [Google Scholar] [CrossRef] [Green Version]
- Martin, M. Cutadapt removes adapter sequences from high-throughput sequencing reads. EMBnet J. 2011, 17, 3. [Google Scholar] [CrossRef]
- Quast, C.; Pruesse, E.; Yilmaz, P.; Gerken, J.; Schweer, T.; Yarza, P.; Peplies, J.; Glöckner, F.O. The SILVA ribosomal RNA gene database project: Improved data processing and web-based tools. Nucleic Acids Res. 2013, 41, D590–D596. [Google Scholar] [CrossRef] [PubMed]
- Abarenkov, K.; Henrik Nilsson, R.; Larsson, K.H.; Alexander, I.J.; Eberhardt, U.; Erland, S.; Høiland, K.; Kjøller, R.; Larsson, E.; Pennanen, T.; et al. The UNITE database for molecular identification of fungi—Recent updates and future perspectives. New Phytol. 2010, 186, 281–285. [Google Scholar] [CrossRef]
- Nguyen, N.H.; Song, Z.; Bates, S.T.; Branco, S.; Tedersoo, L.; Menke, J.; Schilling, J.S.; Kennedy, P.G. FUNGuild: An open annotation tool for parsing fungal community datasets by ecological guild. Fungal Ecol. 2016, 20, 241–248. [Google Scholar] [CrossRef]
- Gopalakrishnan, S.; Sathya, A.; Vijayabharathi, R.; Varshney, R.K.; Gowda, C.L.L.; Krishnamurthy, L. Plant growth promoting rhizobia: Challenges and opportunities. 3 Biotech 2015, 5, 355–377. [Google Scholar] [CrossRef] [Green Version]
- Luecker, S.; Nowka, B.; Rattei, T.; Spieck, E.; Daims, H. The Genome of Nitrospina gracilis Illuminates the Metabolism and Evolution of the Major Marine Nitrite Oxidizer. Front. Microbiol. 2013, 4, 27. [Google Scholar] [CrossRef] [PubMed] [Green Version]
- Sorokin, D.Y.; Berben, T.; Melton, E.D.; Overmars, L.; Vavourakis, C.D.; Muyzer, G. Microbial diversity and biogeochemical cycling in soda lakes. Extremophiles 2014, 18, 791–809. [Google Scholar] [CrossRef] [Green Version]
- Van Kessel, M.A.; Speth, D.R.; Albertsen, M.; Nielsen, P.H.; Op den Camp, H.J.; Kartal, B.; Jetten, M.S.; Lücker, S. Complete nitrification by a single microorganism. Nature 2015, 528, 555–559. [Google Scholar] [CrossRef] [Green Version]
- Vessey, J.K. Plant growth promoting rhizobacteria as biofertilizers. Plant Soil 2003, 255, 571–586. [Google Scholar] [CrossRef]
- Singh, J.S.; Kumar, A.; Rai, A.N.; Singh, D.P. Cyanobacteria: A Precious Bio-resource in Agriculture, Ecosystem, and Environmental Sustainability. Front. Microbiol. 2016, 7, 529. [Google Scholar] [CrossRef] [Green Version]
- Chittora, D.; Meena, M.; Barupal, T.; Swapnil, P.; Sharma, K. Cyanobacteria as a source of biofertilizers for sustainable agriculture. Biochem. Biophys. Rep. 2020, 22, 100737. [Google Scholar] [CrossRef] [PubMed]
- Crews, T.E.; Rumsey, B.E. What Agriculture Can Learn from Native Ecosystems in Building Soil Organic Matter: A Review. Sustainability 2017, 9, 578. [Google Scholar] [CrossRef] [Green Version]
- Gyssels, G.; Poesen, J.; Bochet, E.; Li, Y. Impact of plant roots on the resistance of soils to erosion by water: A review. Prog. Phys. Geogr. Earth Environ. 2005, 29, 189–217. [Google Scholar] [CrossRef] [Green Version]
- Vannoppen, W.; Vanmaercke, M.; De Baets, S.; Poesen, J. A review of the mechanical effects of plant roots on concentrated flow erosion rates. Earth-Sci. Rev. 2015, 150, 666–678. [Google Scholar] [CrossRef] [Green Version]
- Doran, J.W.; Zeiss, M.R. Soil health and sustainability: Managing the biotic component of soil quality. Appl. Soil Ecol. 2000, 15, 3–11. [Google Scholar] [CrossRef] [Green Version]
- Nielsen, M.N.; Winding, A.; Binnerup, S.; Hansen, B.M.; Hendricksen, N.; Kroer, R. Microorganisms as Indicators of Soil Health; Ministry of the Environment, National Environmental Research Institute: Roskilde, Denmark, 2002; p. 84. [Google Scholar]
- Frąc, M.; Hannula, S.E.; Bełka, M.; Jędryczka, M. Fungal Biodiversity and Their Role in Soil Health. Front. Microbiol. 2018, 9, 707. [Google Scholar] [CrossRef] [PubMed] [Green Version]
- Wagg, C.; Bender, S.F.; Widmer, F.; van der Heijden, M.G.A. Soil biodiversity and soil community composition determine ecosystem multifunctionality. Proc. Natl. Acad. Sci. USA 2014, 111, 5266. [Google Scholar] [CrossRef] [Green Version]
- Wagg, C.; Schlaeppi, K.; Banerjee, S.; Kuramae, E.E.; van der Heijden, M.G.A. Fungal-bacterial diversity and microbiome complexity predict ecosystem functioning. Nat. Commun. 2019, 10, 4841. [Google Scholar] [CrossRef]
- Wagg, C.; Hautier, Y.; Pellkofer, S.; Banerjee, S.; Schmid, B.; van der Heijden, M.G. Diversity and asynchrony in soil microbial communities stabilizes ecosystem functioning. eLife 2021, 10, e62813. [Google Scholar] [CrossRef] [PubMed]
- Maestre, F.T.; Quero, J.L.; Gotelli, N.J.; Escudero, A.; Ochoa, V.; Delgado-Baquerizo, M.; García-Gómez, M.; Bowker, M.A.; Soliveres, S.; Escolar, C.; et al. Plant Species Richness and Ecosystem Multifunctionality in Global Drylands. Science 2012, 335, 214. [Google Scholar] [CrossRef] [PubMed] [Green Version]
- Byrnes, J.E.K.; Gamfeldt, L.; Isbell, F.; Lefcheck, J.S.; Griffin, J.N.; Hector, A.; Cardinale, B.J.; Hooper, D.U.; Dee, L.E.; Emmett Duffy, J. Investigating the relationship between biodiversity and ecosystem multifunctionality: Challenges and solutions. Methods Ecol. Evol. 2014, 5, 111–124. [Google Scholar] [CrossRef] [Green Version]
- Schneider, K.D.; Thiagarajan, A.; Cade-Menun, B.J.; McConkey, B.G.; Wilson, H.F. Nitrogen loss in snowmelt runoff from non-point agricultural sources on the Canadian Prairies. In Soil Nitrogen Uses and Environmental Impacts, 1st ed.; CRC Press: New York, NY, USA, 2018; p. 22. [Google Scholar]
- Liu, J.; Baulch, H.M.; Macrae, M.L.; Wilson, H.F.; Elliott, J.A.; Bergström, L.; Glenn, A.J.; Vadas, P.A. Agricultural Water Quality in Cold Climates: Processes, Drivers, Management Options, and Research Needs. J. Environ. Qual. 2019, 48, 792–802. [Google Scholar] [CrossRef] [Green Version]
- Wang, Z.-H.; Li, S.-X. Nitrate N loss by leaching and surface runoff in agricultural land: A global issue (a review). Adv. Agron. 2019, 156, 159–217. [Google Scholar]
- Casper, B.B.; Jackson, R.B. Plant Competition Underground. Annu. Rev. Ecol. Syst. 1997, 28, 545–570. [Google Scholar] [CrossRef] [Green Version]
- Kropff, M.J.; Spitters, C.J.T. A simple model of crop loss by weed competition from early observations on relative leaf area of the weeds. Weed Res. 1991, 31, 97–105. [Google Scholar] [CrossRef]
- Seavers, G.P.; Wright, K.J. Crop canopy development and structure influence weed suppression. Weed Res. 1999, 39, 319–328. [Google Scholar] [CrossRef]
- Smith, R.G.; Warren, N.D.; Cordeau, S. Are cover crop mixtures better at suppressing weeds than cover crop monocultures? Weed Sci. 2020, 68, 186–194. [Google Scholar] [CrossRef] [Green Version]
- Smith, R.G.; Atwood, L.W.; Pollnac, F.W.; Warren, N.D. Cover-Crop Species as Distinct Biotic Filters in Weed Community Assembly. Weed Sci. 2015, 63, 282–295. [Google Scholar] [CrossRef]
- Matano, T.; Ujihara, A. Current Advances in Buckwheat Research: Proceedings of the 6th International Symposium on Buckwheat in Shinshu, 24–29 August 1995; Shinshu University Press: Shinshu, Japan, 1995. [Google Scholar]
- Zahida, I.; Syuntaro, H.; Akio, N.; Sei-ichi, I.; Yoshiharu, F. Allelopathic Activity of Buckwheat: Isolation and Characterization of Phenolics. Weed Sci. 2003, 51, 657–662. [Google Scholar]
- Bulan, M.T.S.; Stoltenberg, D.E.; Posner, J.L. Buckwheat Species as Summer Cover Crops for Weed Suppression in No-Tillage Vegetable Cropping Systems. Weed Sci. 2015, 63, 690–702. [Google Scholar] [CrossRef]
- Charles, K.S.; Ngouajio, M.; Warncke, D.D.; Poff, K.L.; Hausbeck, M.K. Integration of cover crops and fertilizer rates for weed management in celery. Weed Sci. 2006, 54, 326–334. [Google Scholar] [CrossRef]
- Lawley, Y.E.; Teasdale, J.R.; Weil, R.R. The Mechanism for Weed Suppression by a Forage Radish Cover Crop. Agron. J. 2012, 104, 205–214. [Google Scholar] [CrossRef] [Green Version]
- Hall, J.; Bhattarai, S.P.; Midmore, D.J. Effect of industrial hemp (Cannabis sativa L.) planting density on weed suppression, crop growth, physiological responses, and fibre yield in the subtropics. Renew. Bioresour. 2014, 2, 1. [Google Scholar] [CrossRef]
- Meng, L.; Zhang, A.; Wang, F.; Han, X.; Wang, D.; Li, S. Arbuscular mycorrhizal fungi and rhizobium facilitate nitrogen uptake and transfer in soybean/maize intercropping system. Front. Plant Sci. 2015, 6, 339. [Google Scholar] [CrossRef] [PubMed] [Green Version]
- Püschel, D.; Janoušková, M.; Voříšková, A.; Gryndlerová, H.; Vosátka, M.; Jansa, J. Arbuscular Mycorrhiza Stimulates Biological Nitrogen Fixation in Two Medicago spp. through Improved Phosphorus Acquisition. Front. Plant Sci. 2017, 8, 390. [Google Scholar] [CrossRef] [PubMed] [Green Version]
- Becker, M.; Ladha, J.K.; Ali, M. Green manure technology: Potential, usage and limitations. A case study for lowland rice. In Management of Biological Nitrogen Fixation for the Development of More Productive and Sustainable Agricultural Systems; Ladha, J.K., Peoples, M.B., Eds.; Springer: Dordrecht, The Netherlands, 1995; Volume 65. [Google Scholar]
- Biederbeck, V.O.; Bouman, O.T.; Campbell, C.A.; Bailey, L.D.; Winkleman, G.E. Nitrogen benefits from four green-manure legumes in drylands cropping systems. Can. J. Plant Sci. 1995, 76, 307–315. [Google Scholar] [CrossRef] [Green Version]
- Bolger, T.P.; Pate, J.S.; Unkovich, M.J.; Turner, N.C. Estimates of seasonal nitrogen fixation of annual subterranean clover-based pastures using the15N natural abundance technique. Plant Soil 1995, 175, 57–66. [Google Scholar] [CrossRef]
- Raza, A.; Zahra, N.; Hafeez, M.B.; Ahmad, M.; Iqbal, S.; Shaukat, K.; Ahmad, G. Nitrogen Fixation of Legumes: Biology and Physiology. In The Plant Family Fabaceae: Biology and Physiological Responses to Environmental Stresses; Hasanuzzaman, M., Araújo, S., Gill, S.S., Eds.; Springer: Singapore, 2020; pp. 43–74. [Google Scholar] [CrossRef]
- Ros, G.H.; Hanegraaf, M.C.; Hoffland, E.; van Riemsdijk, W.H. Predicting soil N mineralization: Relevance of organic matter fractions and soil properties. Soil Biol. Biochem. 2011, 43, 1714–1722. [Google Scholar] [CrossRef]
- Zeller, B.; Dambrine, E. Coarse particulate organic matter is the primary source of mineral N in the topsoil of three beech forests. Soil Biol. Biochem. 2011, 43, 542–550. [Google Scholar] [CrossRef]
- Cookson, W.R.; Abaye, D.A.; Marschner, P.; Murphy, D.V.; Stockdale, E.A.; Goulding, K.W.T. The contribution of soil organic matter fractions to carbon and nitrogen mineralization and microbial community size and structure. Soil Biol. Biochem. 2005, 37, 1726–1737. [Google Scholar] [CrossRef]
- De Deyn, G.B.; Quirk, H.; Oakley, S.; Ostle, N.; Bardgett, R.D. Rapid transfer of photosynthetic carbon through the plant-soil system in differently managed species-rich grasslands. Biogeosciences 2011, 8, 1131–1139. [Google Scholar] [CrossRef] [Green Version]
- De Deyn, G.B.; Cornelissen, J.H.C.; Bardgett, R.D. Plant functional traits and soil carbon sequestration in contrasting biomes. Ecol. Lett. 2008, 11, 516–531. [Google Scholar] [CrossRef]
- Baumert, V.L.; Vasilyeva, N.A.; Vladimirov, A.A.; Meier, I.C.; Kögel-Knabner, I.; Mueller, C.W. Root Exudates Induce Soil Macroaggregation Facilitated by Fungi in Subsoil. Front. Environ. Sci. 2018, 6, 140. [Google Scholar] [CrossRef]
- Kantola, I.B.; Masters, M.D.; DeLucia, E.H. Soil particulate organic matter increases under perennial bioenergy crop agriculture. Soil Biol. Biochem. 2017, 113, 184–191. [Google Scholar] [CrossRef]
- Dong, Y.; Lei, T.; Li, S.; Yuan, C.; Zhou, S.; Yang, X. Effects of rye grass coverage on soil loss from loess slopes. Int. Soil Water Conserv. Res. 2015, 3, 170–182. [Google Scholar] [CrossRef] [Green Version]
- Angus, J.F.; Gardner, P.A.; Kirkegaard, J.A.; Desmarchelier, J.M. Biofumigation: Isothiocyanates released frombrassica roots inhibit growth of the take-all fungus. Plant Soil 1994, 162, 107–112. [Google Scholar] [CrossRef]
- Smolinska, U.; Morra, M.J.; Knudsen, G.R.; James, R.L. Isothiocyanates Produced by Brassicaceae Species as Inhibitors of Fusarium oxysporum. Plant Dis. 2003, 87, 407–412. [Google Scholar] [CrossRef] [PubMed] [Green Version]
- Fayzalla, E.A.; El-Barougy, E.; El-Rayes, M.M. Control of soil-borne pathogenic fungi of soybean by biofumigation with mustard seed meal. J. Appl. Sci. 2009, 9, 2272–2279. [Google Scholar] [CrossRef] [Green Version]
- Zhang, Q.; Zhang, J.; Yang, L.; Zhang, L.; Jiang, D.; Chen, W.; Li, G. Diversity and biocontrol potential of endophytic fungi in Brassica napus. Biol. Control. 2014, 72, 98–108. [Google Scholar] [CrossRef]
- Kirkegaard, J.A.; Sarwar, M. Biofumigation potential of brassicas. Plant Soil 1998, 201, 71–89. [Google Scholar] [CrossRef]
- Neubauer, C.; Heitmann, B.; Müller, C. Biofumigation potential of Brassicaceae cultivars to Verticillium dahliae. Eur. J. Plant Pathol. 2014, 140, 341–352. [Google Scholar] [CrossRef]
- Vandicke, J.; De Visschere, K.; Deconinck, S.; Leenknecht, D.; Vermeir, P.; Audenaert, K.; Haesaert, G. Uncovering the biofumigant capacity of allyl isothiocyanate from several Brassicaceae crops against Fusarium pathogens in maize. J. Sci. Food Agric. 2020, 100, 5476–5486. [Google Scholar] [CrossRef] [PubMed]
- Brennan, R.J.B.; Glaze-Corcoran, S.; Wick, R.; Hashemi, M. Biofumigation: An alternative strategy for the control of plant parasitic nematodes. J. Integr. Agric. 2020, 19, 1680–1690. [Google Scholar] [CrossRef]
- Abdallah, I.; Yehia, R.; Kandil, M.A.-H. Biofumigation potential of Indian mustard (Brassica juncea) to manage Rhizoctonia solani. Egypt. J. Biol. Pest Control 2020, 30, 99. [Google Scholar] [CrossRef]
- Schreiner, R.P.; Koide, R.T. Mustards, mustard oils and Mycorrhizas. New Phytol. 1993, 123, 107–113. [Google Scholar] [CrossRef]
- Callaway, R.M.; Cipollini, D.; Barto, K.; Thelen, G.C.; Hallett, S.G.; Prati, D.; Stinson, K.; Klironomos, J. Novel weapons: Invasive plant suppresses fungal mutualists in America but not in its native Europe. Ecology 2008, 89, 1043–1055. [Google Scholar] [CrossRef] [Green Version]
- Bardgett, R.D.; Mommer, L.; De Vries, F.T. Going underground: Root traits as drivers of ecosystem processes. Trends Ecol. Evol. 2014, 29, 692–699. [Google Scholar] [CrossRef]
- Sweeney, C.J.; de Vries, F.T.; van Dongen, B.E.; Bardgett, R.D. Root traits explain rhizosphere fungal community composition among temperate grassland plant species. New Phytol. 2021, 229, 1492–1507. [Google Scholar] [CrossRef]
- Merino-Martín, L.; Griffiths, R.I.; Gweon, H.S.; Furget-Bretagnon, C.; Oliver, A.; Mao, Z.; Le Bissonnais, Y.; Stokes, A. Rhizosphere bacteria are more strongly related to plant root traits than fungi in temperate montane forests: Insights from closed and open forest patches along an elevational gradient. Plant Soil 2020, 450, 183–200. [Google Scholar] [CrossRef]
- Di Rauso Simeone, G.; Müller, M.; Felgentreu, C.; Glaser, B. Soil microbial biomass and community composition as affected by cover crop diversity in a short-term field experiment on a podzolized Stagnosol-Cambisol. J. Plant Nutr. Soil Sci. 2020, 183, 539–549. [Google Scholar] [CrossRef]
- Pearse, I.S.; Bastow, J.L.; Tsang, A. Radish introduction affects soil biota and has a positive impact on the growth of a native plant. Oecologia 2014, 174, 471–478. [Google Scholar] [CrossRef] [PubMed]
- Cameron, D.D. Arbuscular mycorrhizal fungi as (agro)ecosystem engineers. Plant Soil 2010, 333, 1–5. [Google Scholar] [CrossRef]
- Brundrett, M.C.; Tedersoo, L. Evolutionary history of mycorrhizal symbioses and global host plant diversity. New Phytol. 2018, 220, 1108–1115. [Google Scholar] [CrossRef] [PubMed]
- Chen, M.; Arato, M.; Borghi, L.; Nouri, E.; Reinhardt, D. Beneficial Services of Arbuscular Mycorrhizal Fungi—From Ecology to Application. Front. Plant Sci. 2018, 9, 1270. [Google Scholar] [CrossRef] [PubMed]
- Kiers, E.T.; Duhamel, M.; Beesetty, Y.; Mensah, J.A.; Franken, O.; Verbruggen, E.; Fellbaum, C.R.; Kowalchuk, G.A.; Hart, M.M.; Bago, A.; et al. Reciprocal Rewards Stabilize Cooperation in the Mycorrhizal Symbiosis. Science 2011, 333, 880. [Google Scholar] [CrossRef] [Green Version]
- Wagg, C.; Veiga, R.; van der Heijden, M.G.A. Facilitation and Antagonism in Mycorrhizal Networks. In Mycorrhizal Networks; Horton, T.R., Ed.; Springer: Dordrecht, The Netherlands, 2015; pp. 203–226. [Google Scholar] [CrossRef]
- Walder, F.; Niemann, H.; Natarajan, M.; Lehmann, M.F.; Boller, T.; Wiemken, A. Mycorrhizal networks: Common goods of plants shared under unequal terms of trade. Plant Physiol. 2012, 159, 789–797. [Google Scholar] [CrossRef] [Green Version]
- Argüello, A.; O’Brien, M.J.; van der Heijden, M.G.A.; Wiemken, A.; Schmid, B.; Niklaus, P.A. Options of partners improve carbon for phosphorus trade in the arbuscular mycorrhizal mutualism. Ecol. Lett. 2016, 19, 648–656. [Google Scholar] [CrossRef] [Green Version]
- Veiga, R.S.; Jansa, J.; Frossard, E.; van der Heijden, M.G. Can arbuscular mycorrhizal fungi reduce the growth of agricultural weeds? PLoS ONE 2011, 6, e27825. [Google Scholar] [CrossRef]
- Rinaudo, V.; Bàrberi, P.; Giovannetti, M.; van der Heijden, M.G.A. Mycorrhizal fungi suppress aggressive agricultural weeds. Plant Soil 2010, 333, 7–20. [Google Scholar] [CrossRef] [Green Version]
- Harley, J.L.; Harley, E.L. A check-list of mycorrhiza in the British flora. New Phytol. 1987, 105, 1–102. [Google Scholar] [CrossRef]
- Hättenschwiler, S.; Tiunov, A.V.; Scheu, S. Biodiversity and Litter Decomposition in Terrestrial Ecosystems. Annu. Rev. Ecol. Evol. Syst. 2005, 36, 191–218. [Google Scholar] [CrossRef]
- McGuire, K.L.; Bent, E.; Borneman, J.; Majumder, A.; Allison, S.D.; Treseder, K.K. Functional diversity in resource use by fungi. Ecology 2010, 91, 2324–2332. [Google Scholar] [CrossRef]
- Bender, S.F.; Plantenga, F.; Neftel, A.; Jocher, M.; Oberholzer, H.-R.; Köhl, L.; Giles, M.; Daniell, T.J.; van der Heijden, M.G.A. Symbiotic relationships between soil fungi and plants reduce N2O emissions from soil. ISME J. 2014, 8, 1336–1345. [Google Scholar] [CrossRef]
- Bender, S.F.; van der Heijden, M.G.A. Soil biota enhance agricultural sustainability by improving crop yield, nutrient uptake and reducing nitrogen leaching losses. J. Appl. Ecol. 2015, 52, 228–239. [Google Scholar] [CrossRef] [Green Version]
- Carvalhais, L.C.; Rincon-Florez, V.A.; Brewer, P.B.; Beveridge, C.A.; Dennis, P.G.; Schenk, P.M. The ability of plants to produce strigolactones affects rhizosphere community composition of fungi but not bacteria. Rhizosphere 2019, 9, 18–26. [Google Scholar] [CrossRef] [Green Version]
- Rochange, S.; Goormachtig, S.; Lopez-Raez, J.A.; Gutjahr, C. The Role of Strigolactones in Plant–Microbe Interactions. In Strigolactones—Biology and Applications; Koltai, H., Prandi, C., Eds.; Springer International Publishing: Cham, Switzerland, 2019; pp. 121–142. [Google Scholar] [CrossRef]
- Niu, Y.; Bainard, L.D.; May, W.E.; Hossain, Z.; Hamel, C.; Gan, Y. Intensified Pulse Rotations Buildup Pea Rhizosphere Pathogens in Cereal and Pulse Based Cropping Systems. Front. Microbiol. 2018, 9, 1909. [Google Scholar] [CrossRef]
- Borrell, A.N.; Shi, Y.; Gan, Y.; Bainard, L.D.; Germida, J.J.; Hamel, C. Fungal diversity associated with pulses and its influence on the subsequent wheat crop in the Canadian prairies. Plant Soil 2017, 414, 13–31. [Google Scholar] [CrossRef]
- Fujimura, M.; Minami, Y.; Watanabe, K.; Tadera, K. Purification, Characterization, and Sequencing of a Novel Type of Antimicrobial Peptides, Fa-AMP1 and Fa-AMP2, from Seeds of Buckwheat (Fagopyrum esculentum Moench.). Biosci. Biotechnol. Biochem. 2003, 67, 1636–1642. [Google Scholar] [CrossRef]
- Hofer, U. Getting to the bottom of Cyanobacteria. Nat. Rev. Microbiol. 2013, 11, 818–819. [Google Scholar] [CrossRef]
- Alvarez, R.; Alvarez, C.R. Soil Organic Matter Pools and Their Associations with Carbon Mineralization Kinetics. Soil Sci. Soc. Am. J. 2000, 64, 184–189. [Google Scholar] [CrossRef]
- Bastida, F.; Eldridge, D.J.; García, C.; Kenny Png, G.; Bardgett, R.D.; Delgado-Baquerizo, M. Soil microbial diversity–biomass relationships are driven by soil carbon content across global biomes. ISME J. 2021, 15, 2081–2091. [Google Scholar] [CrossRef] [PubMed]


| Species | Common Name | Variety | FG | Rate |
|---|---|---|---|---|
| Brassica juncea | Brown mustard | Centennial | Brassica | 6 |
| Raphanus sativus | Oilseed radish | Brassica | 10 | |
| Raphanus sativus | Tillage radish | Nitro | Brassica | 8 |
| Cannabis sativa | Hemp | Ferimon | Forb | 26 |
| Cannabis sativa | Hemp | Anka | Forb | 26 |
| Fagopyrum esculentum | Buckwheat | Mancan | Forb | 50 |
| Helianthus annuus | Sunflower | EMB-64-335 | Forb | 4 |
| Phacelia tanacetifolia | Phacelia | Forb | 10 | |
| Avena sativa | Oat | Haymaker | Grass | 100 |
| Eragrostis tef | Teff | Coated corvallis | Grass | 10 |
| Lolium multiflorum | Annual ryegrass | Lemtal | Grass | 20 |
| Pennisetum glaucum | Pearl millet | Common #1 | Grass | 25 |
| Phleum pretense | Timothy | Climax | Grass | 10 |
| Sorghum × drummondi | Sorghum-Sudan grass | CFSH-30 | Grass | 40 |
| Pisum sativum | Field pea | Limerick | Legume | 180 |
| Galega officinalis | Galaga | Legume | 10 | |
| Medicago sativa | Alfalfa | Trueman | Legume | 20 |
| Trifolium incarnatum | Crimson clover | Common #1 | Legume | 15 |
| Trifolium pretense | Red clover | Sante fe | Legume | 10 |
| Trifolium reptans | White clover | Alice | Legume | 10 |
| Vicia faba | Faba bean | Athena | Legume | 40 |
| Vicia villosa | Hairy vetch | Common #1 | Legume | 20 |
| Functional Group | Crop Identity | ||||||
|---|---|---|---|---|---|---|---|
| Productivity | Units | DF | F | p | DF | F | p |
| Crop biomass | kg ha−1 | 3, 83 | 5.88 | 0.001 | 21, 65 | 8.18 | <0.001 |
| Functional traits | |||||||
| Maximum canopy height | cm | 3, 83 | 17.44 | <0.001 | 21, 65 | 14.77 | <0.001 |
| Spring RGR | cm cm−1 day−1 | 3, 83 | 13.48 | <0.001 | 21, 65 | 30.54 | <0.001 |
| Leaf area | cm3 | 3, 83 | 6.85 | <0.001 | 21, 65 | 2.78 | <0.001 |
| Leaf mass per area (LMA) | mg cm−3 | 3, 78 | 12.29 | <0.001 | 21, 60 | 4.10 | <0.001 |
| Nutrient capture | 3, 67 | 1.77 | 0.161 | 19, 51 | 3.30 | <0.001 | |
| Standing crop N | kg ha−1 | 3, 72 | 1.81 | 0.153 | 21, 54 | 8.58 | <0.001 |
| Standing crop P | kg ha−1 | 3, 67 | 1.42 | 0.244 | 19, 51 | 4.70 | <0.001 |
| † Soil ammonium (NH4) | ppm | 3, 83 | 0.02 | 0.996 | 21, 65 | 1.02 | 0.450 |
| † Soil nitrate (NO3) | ppm | 3, 83 | 6.35 | <0.001 | 21, 65 | 2.60 | 0.002 |
| Weed suppression | 2, 82 | 10.70 | <0.001 | 21, 64 | 7.28 | <0.001 | |
| † Weed cover | % | 3, 83 | 7.58 | <0.001 | 21, 65 | 5.05 | <0.001 |
| † Weed biomass | kg ha−1 | 3, 82 | 5.21 | 0.002 | 21, 64 | 4.15 | <0.001 |
| Erosion control | 3, 82 | 3.48 | 0.20 | 21, 64 | 4.45 | <0.001 | |
| Crop cover | % | 3, 82 | 7.07 | <0.001 | 21, 64 | 4.12 | <0.001 |
| Winter cover | % | 3, 83 | 3.00 | 0.035 | 21, 65 | 8.50 | <0.001 |
| Rooting density | mg cm−3 | 3, 83 | 6.30 | <0.001 | 21, 65 | 3.48 | <0.001 |
| Soil building | 3, 83 | 0.93 | 0.430 | 21, 65 | 0.86 | 0.643 | |
| Particulate organic C (POM-C) | g kg−1 | 3, 83 | 0.91 | 0.439 | 21, 65 | 0.99 | 0.489 |
| Active carbon (POX-C) | g kg−1 | 3, 83 | 0.80 | 0.495 | 21, 65 | 1.50 | 0.108 |
| Particulate organic N (POM-N) | g kg−1 | 3, 83 | 0.82 | 0.487 | 21, 65 | 0.84 | 0.660 |
| Aggregate stability | % | 3, 83 | 0.35 | 0.787 | 21, 65 | 3.82 | <0.001 |
| Soil health | 3, 74 | 3.00 | 0.036 | 21, 56 | 1.25 | 0.252 | |
| Bacterial richness | ASV count | 3, 83 | 3.71 | 0.015 | 21, 65 | 0.95 | 0.536 |
| Bacterial evenness | Pielou J’ | 3, 83 | 8.15 | <0.001 | 21, 65 | 3.78 | <0.001 |
| Rhizobia | Read count | 3, 83 | 2.74 | 0.048 | 21, 65 | 1.94 | 0.022 |
| Cyanobacteria | Read count | 3, 83 | 1.28 | 0.287 | 21, 65 | 0.87 | 0.631 |
| Nitrifying bacteria | Read count | 3, 83 | 5.90 | 0.001 | 21, 65 | 1.44 | 0.135 |
| Fungal richness | ASV count | 3, 74 | 1.27 | 0.290 | 21, 56 | 0.98 | 0.495 |
| Fungal evenness | Pielou J’ | 3, 74 | 0.97 | 0.412 | 21, 56 | 0.86 | 0.633 |
| Arbuscular mycorrhiza | Read count | 3, 74 | 0.35 | 0.793 | 21, 56 | 1.37 | 0.174 |
| † Plant fungal pathogens | Read count | 3, 74 | 4.29 | 0.008 | 21, 56 | 1.37 | 0.172 |
| Fungal saprotrophs | Read count | 3, 74 | 9.31 | <0.001 | 21, 56 | 2.10 | 0.014 |
| Crop Trait | LA | LMA | Max Height | Spring RGR | Rooting Density |
|---|---|---|---|---|---|
| Fungal richness | −0.055 | −0.005 | 0.120 | * 0.245 | 0.149 |
| Fungal evenness | −0.130 | −0.149 | −0.086 | −0.050 | 0.076 |
| AMF | 0.029 | 0.017 | −0.064 | −0.018 | 0.148 |
| Plant pathogen | −0.056 | −0.056 | −0.139 | 0.071 | −0.125 |
| Saprotroph | −0.208 | * −0.266 | * −0.272 | 0.085 | −0.032 |
| Bacterial richness | −0.120 | 0.119 | −0.156 | 0.128 | 0.298 |
| Bacterial evenness | 0.062 | *** 0.388 | 0.001 | 0.120 | 0.246 |
| Rhizobia | −0.151 | −0.202 | −0.074 | 0.134 | 0.009 |
| Nitrifying bacteria | −0.065 | 0.077 | −0.158 | 0.020 | −0.019 |
| Cyanobacteria | −0.087 | 0.124 | −0.137 | 0.018 | ** 0.277 |
| Soil health | −0.098 | −0.063 | −0.148 | *** 0.108 | 0.160 |
| Ecosystem Service | Soil Building | Nutrient Capture | Weed Suppression | Erosion Control | Crop Biomass |
| Fungal richness | 0.045 | † 0.214 | * 0.231 | 0.145 | 0.100 |
| Fungal evenness | † −0.204 | −0.008 | ** −0.319 | † −0.210 | ** −0.291 |
| AMF | *** −0.393 | −0.192 | ** −0.301 | † −0.202 | * −0.235 |
| Plant pathogen | −0.019 | 0.125 | −0.006 | −0.116 | −0.008 |
| Saprotroph | *** −0.326 | −0.031 | −0.137 | † −0.190 | * −0.229 |
| Bacterial richness | *** −0.596 | 0.063 | * −0.214 | −0.070 | † −0.178 |
| Bacterial evenness | −0.141 | −0.089 | 0.026 | −0.048 | −0.157 |
| Rhizobia | * −0.271 | 0.176 | 0.024 | 0.055 | 0.078 |
| Nitrifying bacteria | *** −0.560 | 0.087 | * −0.260 | † −0.183 | † −0.189 |
| Cyanobacteria | * −0.240 | −0.079 | −0.021 | −0.164 | † −0.195 |
Publisher’s Note: MDPI stays neutral with regard to jurisdictional claims in published maps and institutional affiliations. |
© 2021 by the Her Majesty the Queen in Right of Canada as represented by the Minister of Agriculture and Agri-Food Canada. Licensee MDPI, Basel, Switzerland. This article is an open access article distributed under the terms and conditions of the Creative Commons Attribution (CC BY) license (https://creativecommons.org/licenses/by/4.0/).
Share and Cite
Wagg, C.; van Erk, A.; Fava, E.; Comeau, L.-P.; Mitterboeck, T.F.; Goyer, C.; Li, S.; McKenzie-Gopsill, A.; Mills, A. Full-Season Cover Crops and Their Traits That Promote Agroecosystem Services. Agriculture 2021, 11, 830. https://0-doi-org.brum.beds.ac.uk/10.3390/agriculture11090830
Wagg C, van Erk A, Fava E, Comeau L-P, Mitterboeck TF, Goyer C, Li S, McKenzie-Gopsill A, Mills A. Full-Season Cover Crops and Their Traits That Promote Agroecosystem Services. Agriculture. 2021; 11(9):830. https://0-doi-org.brum.beds.ac.uk/10.3390/agriculture11090830
Chicago/Turabian StyleWagg, Cameron, Aafke van Erk, Erica Fava, Louis-Pierre Comeau, T. Fatima Mitterboeck, Claudia Goyer, Sheng Li, Andrew McKenzie-Gopsill, and Aaron Mills. 2021. "Full-Season Cover Crops and Their Traits That Promote Agroecosystem Services" Agriculture 11, no. 9: 830. https://0-doi-org.brum.beds.ac.uk/10.3390/agriculture11090830