Article

Impact of Lameness on Attributes of Feeding Registered with Noseband Sensor in Fresh Dairy Cows

by
Ramūnas Antanaitis
1,*,
Vida Juozaitienė
2,
Gediminas Urbonavičius
3,
Dovilė Malašauskienė
1,
Mindaugas Televičius
1,
Mingaudas Urbutis
1 and
Walter Baumgartner
4
1
Large Animal Clinic, Veterinary Academy, Lithuanian University of Health Sciences, Tilžės str 18, LT-47181 Kaunas, Lithuania
2
Department of Biology, Faculty of Natural Sciences, Vytautas Magnus University, K. Donelaičio 58, LT-44248 Kaunas, Lithuania
3
Department of Animal Breeding, Veterinary Academy, Lithuanian University of Health Sciences, Tilžės str 18, LT-47181 Kaunas, Lithuania
4
University Clinic for Ruminants, University of Veterinary Medicine, Veterinaerplatz 1, A-1210 Vienna, Austria
*
Author to whom correspondence should be addressed.
Submission received: 19 July 2021 / Revised: 3 September 2021 / Accepted: 4 September 2021 / Published: 6 September 2021
(This article belongs to the Special Issue Digital Innovations in Agriculture)

Abstract

:
We hypothesized that lameness in fresh dairy cows (1–30 days after calving) has an impact on attributes of feeding registered with a noseband sensor. The aim of this study was to investigate the impact of lameness in fresh dairy cows on attributes of feeding (registered with the RumiWatch noseband sensor): rumination time (RT), drinking time (DT), eating time (ET), rumination chews (RC), eating chews (EC), chews per minute (CM), drinking gulps (DG), bolus count (B), and chews per bolus (CB). The measurement registration was started at the first day after calving and continued until 30 days after calving. There were 20 Lithuanian black and white breed cows selected. Lameness diagnosis was performed by trained staff based on a locomotion score system and it was diagnosed on average on the 15th day after calving. The causes of lameness were categorized as sole ulcer, abscess and foot rot. Special attention was paid to attributes of feeding registered 14 days before and 13 days after diagnosis. The 10 lame cows (LG) used in this experiment had a lameness score of 3–4 presented with severe lameness: they were reluctant to move and unwilling to complete weight transfer off the affected limb. The 10 healthy cows (HG) were given a lameness score of 1. We found that lameness of fresh dairy cows has an impact on inline registered ingestive behaviors biomarkers—the mean RT of HG cows was as much as 2.19 times higher than that of LG cows on the day of diagnosis of lameness, later this difference between the groups decreased to the sixth day of treatment, then increased again and decreased at the end of the experiment. The lowest eating time was found on diagnosis day and the highest on the ninth day before determination of lameness. Drinking time was higher in the HG group, with the exception of 10 and 9 days prior to clinical signs of disease in LG cows. A downward trend in rumination chews was observed in LG cows from day 7 until the onset of clinical symptoms. The bolus count decreased from day 3 before diagnosis to day 1 after diagnosis in LG cows. The largest difference in this indicator between groups was found on day of diagnosis. Analysing the pattern of CM values in the LG group, we found a decrease from 10 days before to 2 days after diagnosis. The CB value was almost the same in both groups of cows at the end of the experiment, but largest difference between the groups was found on day 7 after clinical sings of lameness.

1. Introduction

In dairy farming, lameness is one of the major welfare and health problems [1]. Traditionally, the detection of lameness has relied on visual inspection to detect animals with abnormal gait [2]. The early detection of health disorders is an important point in dairy cattle farming, since early detection of the disease has a major influence on the severity of diseases, the animal welfare and the economics of dairy production [1]. Identification of healthy and lame cows was entirely based on the herd health reports of the farm. The accuracy of these herd health reports depended on the correct identification of lameness by the herdsman, the amount of reported cases of lameness and the expertise of the veterinarian [3]. The monitoring of physiological parameters may allow to detect changes before the appearance of clinical signs and earlier diagnosis would greatly benefit cows by preventing disease progression [4]. Sensors have become an integral part of modern dairy farming, which allows for continuous monitoring of the individual in the herd [3]. Accelerometer sensors are used in lame animal detection in livestock industries [2]. The automation of lameness detection or gait scoring is an important topic in research and several different approaches have been developed [3]. Studies focusing on ground reaction forces, pressure sensitive walkways and accelerometers measured the asymmetry of the gait when walking, other studies used computer vision to analyze the gait automatically. In these studies, the main focus was put on gait parameters-step overlap, hoof release angle and back arch curvature [5,6,7]. Raw data of Benaissa et al. (2019) [8]. illustrate that the widely used collar-mounted accelerometer classifies ruminating and feeding behaviors with accuracy closely comparable to the RumiWatch noseband sensor [8]. In our past studies, we found that cows with subclinical ketosis had shorter rumination and drinking times and lesser rumination chews, chews per minute, boluses, and chews per bolus [9]. Van Hertem et al. (2013) reported that for the automated detection of lameness a combination of farm data on the milk yield, rumination time and neck activity can be used [3]. During the nighttime, a significantly lower rumination time and milk yield were registered in lame animals. Lame animals showed a higher night to day ratio of neck activity. In a 10-fold cross-validation procedure, a logistic regression model for automated clinical lameness detection according to behavioral and performance data achieved a correct classification rate of 0.86, a specificity of 0.85, and a sensitivity of 0.89. An ear-tag sensor, a type of on-animal sensor, was used to precisely detect walking, standing, grazing, and lame walking activities [3]. Furthermore, strong correlations with lameness are suggested with unique animal-based parameters—such as leg hygiene, body condition scoring (BCS), and hock condition—that have been used in animal welfare determination practices [10]. With more research and use, this classification algorithm could be integrated into an automatic livestock monitoring system to provide real time information on an individual’s health status, that is problematic under current extensive livestock production systems [2]. A tri-axial accelerometer fitted in the ear-tag can successfully differentiate lame walking activity from normal walking, standing and grazing behaviors. In one research paper, it was noted that the leg and collar deployed accelerometers failed to successfully classify both normal and lame walking activity. However, this could have been affected by sensor placement and the simulation not being a true representation of lameness [2]. Miguel-Pacheco et al. (2014) stated that further studies are needed in order to expand the use and benefits of the technologies available as a tool to measure and monitor the health status of cows [11].
The RumiWatch Sensor (RWS) built into the cow nose-halter, uses data gathered by a pressure sensor in combination with data gathered by a triaxial accelerometer to detect specific behavioral characteristics in dairy cows [12]. The RWS is able to record and store individual animal behavior over several days with high precision [13,14]. The RWS is a useful tool for research as it records bolus counts, number of rumination chews, total number of eating chews, and the time spent ruminating for grazing cows and supplemented grazing cows [12].
We hypothesized that lameness of fresh dairy cows (1–30 days after calving) has an impact on the attributes of feeding registered by the noseband sensor. The aim of this study was to investigate the impact of lameness on attributes of feeding registered with the RumiWatch noseband sensor: rumination time, drinking time, eating time, rumination chews, eating chews, drinking gulps, bolus count, chews per minute, and chews per bolus before and after diagnosis of lameness fresh dairy cows.

2. Materials and Methods

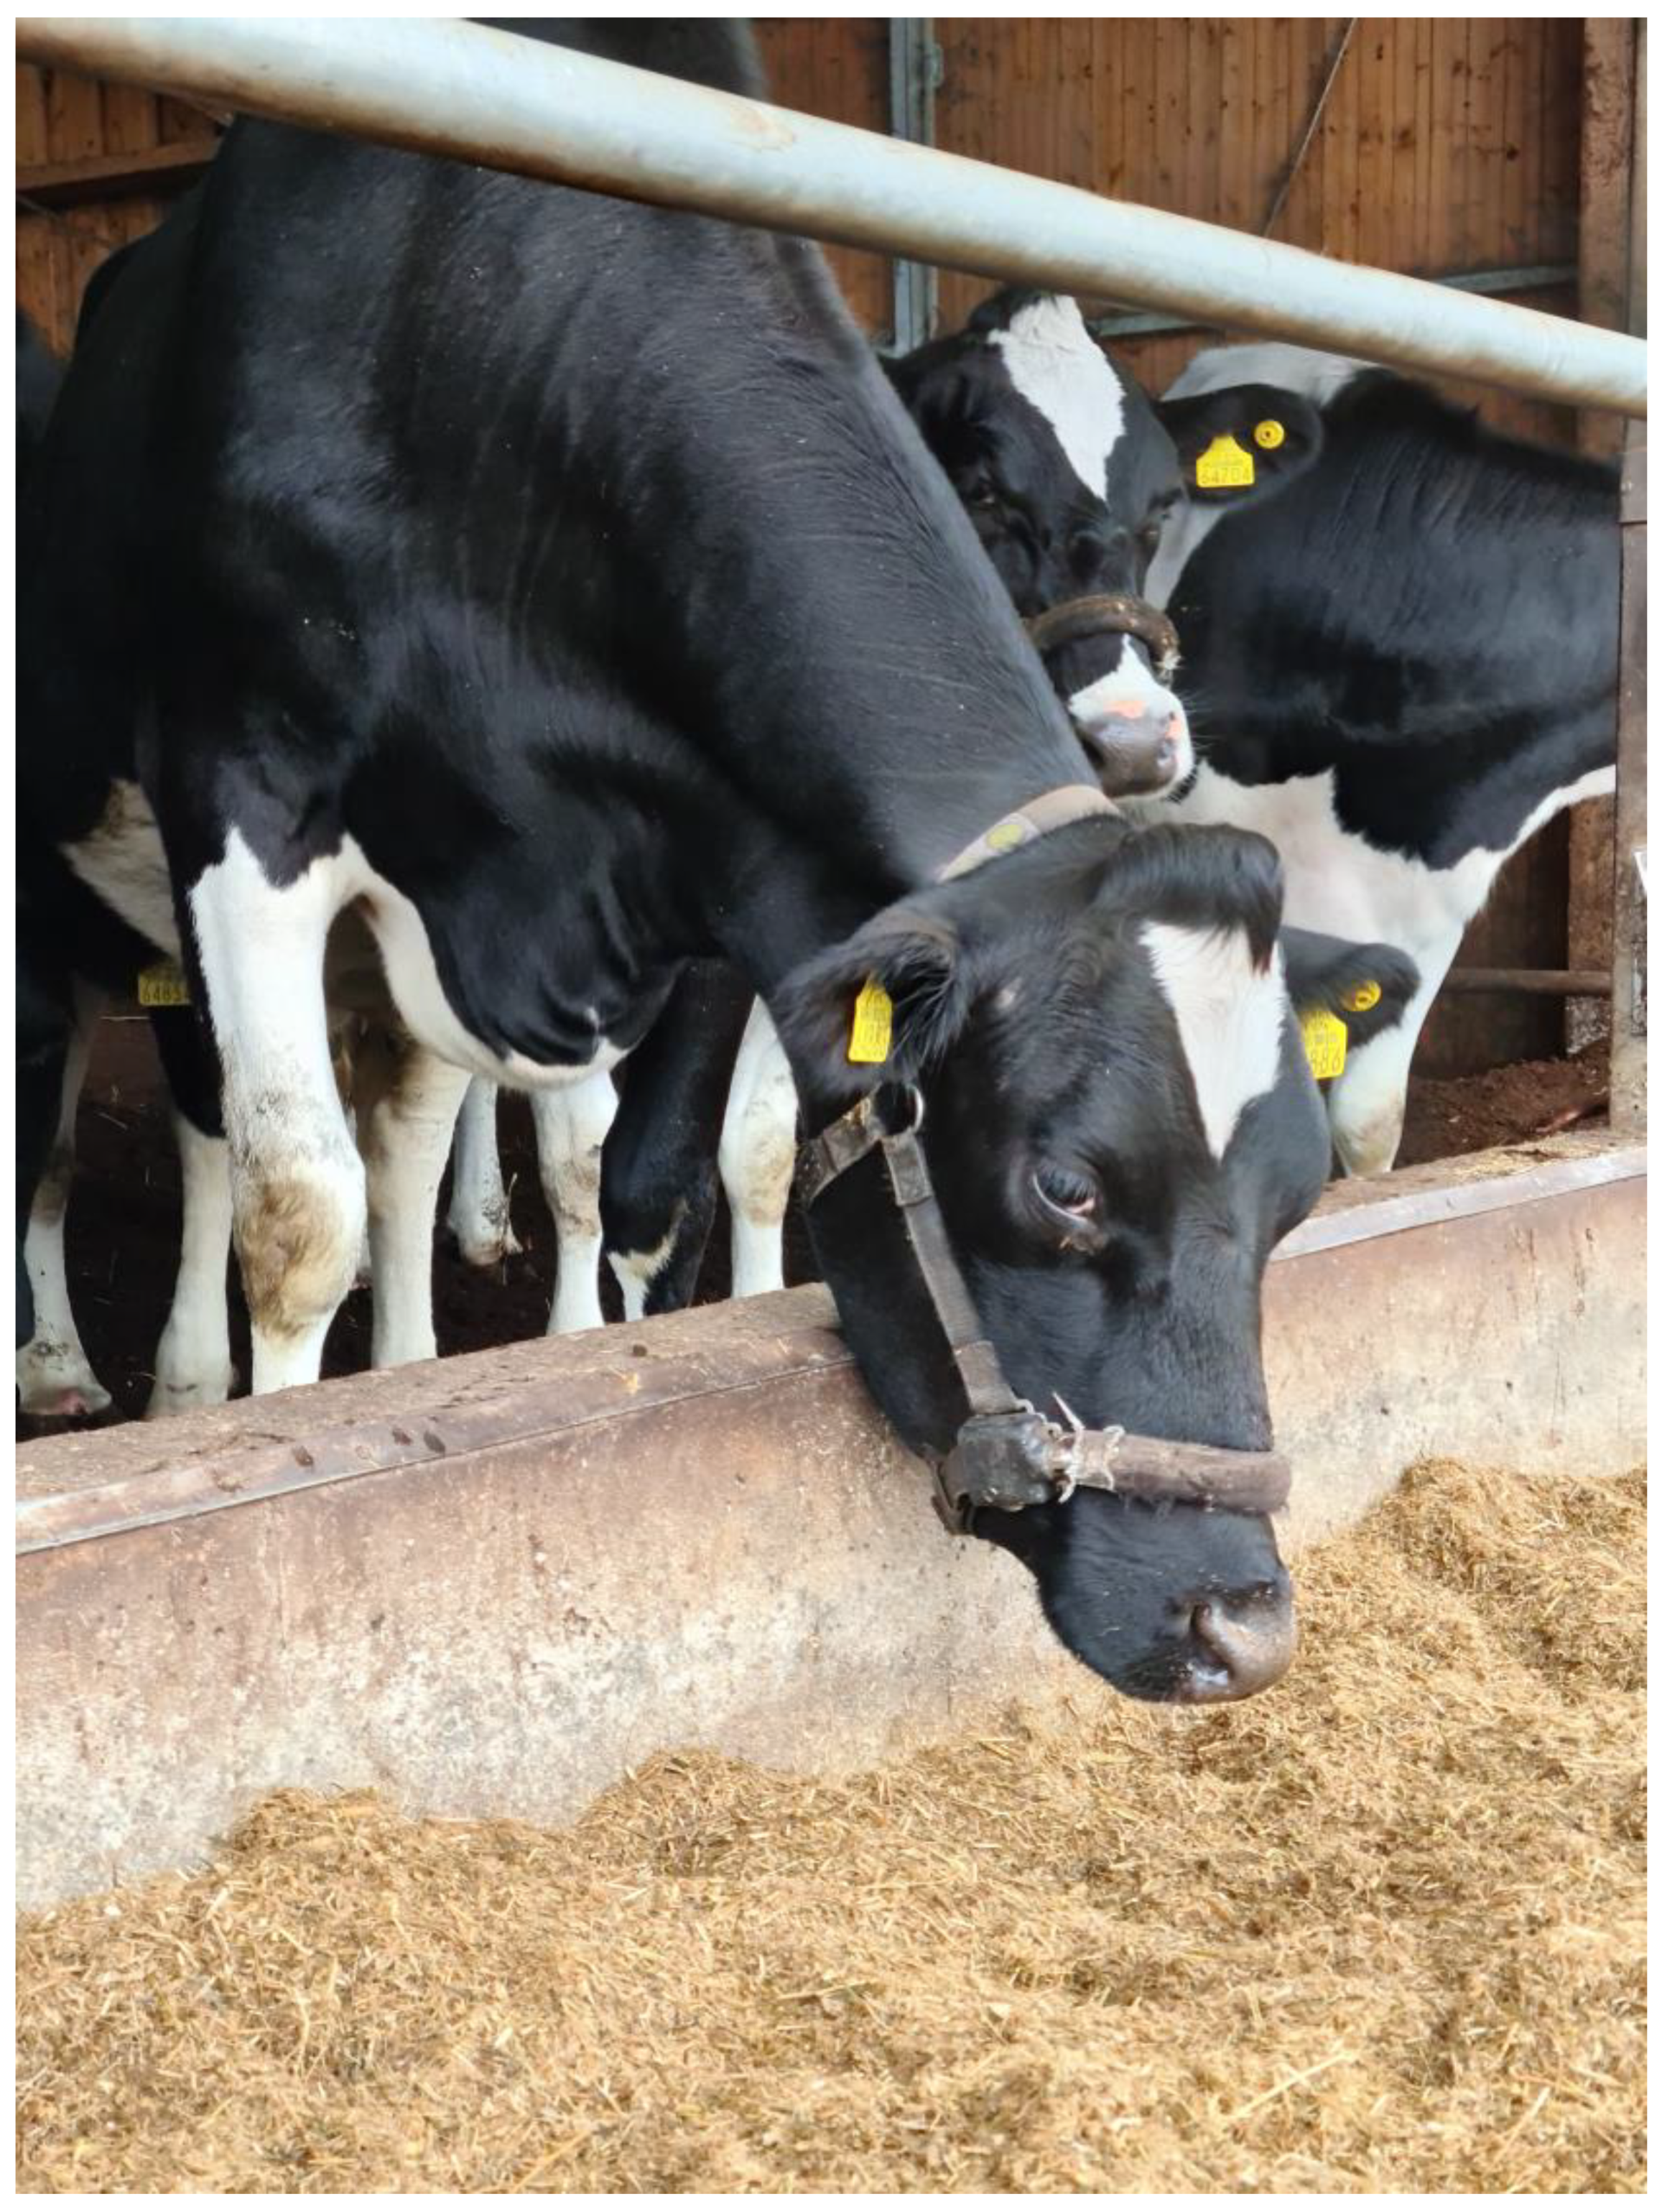
2.1. Animals, Location, and Experimental Design

This study was conducted at the Lithuanian University of health sciences, and one commercial dairy farm (54.9754° N, 23.7684° E) during 1 July 2020–15 December 2020. All animal experimental procedures were approved, approval number is PK016965. During investigation time, the total incidence of lameness in the herd was about 10%. Fifty from 1550 Lithuanian Black and White breed multiparous dairy cows coming up to parturition were selected (on average 5 years of age), which were being kept in a loose-housing system. The recording of the feeding behavioral data was started at the first day after calving and continued until 30 days after calving by applying the RumiWatch noseband halter.
The selected cows were monitored daily for signs of lameness. Lameness diagnosis was performed by trained staff according to the standard procedure described by Sprecher et al. [15]: 1 = normal; 2 = presence of a slightly asymmetric gait; 3 = the cow clearly favored one or more limbs (moderately lame); 4 = severely lame; and 5 = extremely lame (non-weight-bearing lame). Of cows monitored in this experiment, 10 out of 50 had a lameness score of 3–4, represented by severe lameness and they were diagnosed on average on the 15th day post partum. They were reluctant to move and unwilling to complete weight transfer off the affected limb. The 10 lame cows comprised the lame group (LG) and were examined by a claw health professional to determine the cause of lameness. Six of the cows were diagnosed with sole ulcers, three with abscess, and one with foot rot. These results match the findings of Warnick et al. [16], where the causes for lameness in a herd were categorized as sole ulcer (60%), abscess (20%), and foot rot (20%). According Warnick et al. [16], sole ulcer was defined as degenerative or necrotic defects in the sole near the sole–heel junction. Abscess was defined as a pus-filled cavity of the white line or sole of the foot. Foot rot was swelling of the soft tissues of the foot resulting in symmetrical swelling above the coronary band and spreading of the toes, in some cases with necrosis of the tissue between the claws.
Immediately after identification of lameness, all lame cows had their claws treated and received subcutaneous administrations of Naxcel (100 mg/mL; Zoetis, Kirkland, QC, Canada), at the dosage of 2.2 mg/kg of body weight. Treatment was repeated at 24-h intervals for a total of three consecutive days and a subcutaneous injection of Rimadyl Cattle® (50 mg/mL) solution (Zoetis, Belgium) at a dose of 1.4 mg per 1 kg body weight once. After treatment lameness was identified by the same trained staff according to the standard procedure described by Sprecher et al. [15]. After treatment, the lameness score of the cows improved.
Based on the principle of analogues (Table 1), 10 healthy cows (HG) were selected- same breed, same production, and lactation number. Cows in the healthy group had maintained a lameness score of 1 throughout the study period. Data from the RumiWatch noseband halter from 14 days before and 13 days after the diagnosis of lameness was used to compare with non-lame cow data during the same period. The healthy cows were monitored during the same days as the lame cows.
Cows were provided with a total mix ration (TMR) consisting of 20% corn silage, 5% grass hay, 20% grass silage, 50% grain concentrate mash, and 5% of mineral mixture. TMR was formulated accordingly to meet or exceed the requirements of a 550 kg Holstein cow producing 40 kg/d of milk. Diet was delivered every day at 05.00 and 17.00 h. Composition of ration are presented in Table 2. Cows were milked with DeLaval milking robot (DeLaval Inc., Tumba, Sweden).

2.2. Measurements

Experimental days from ‘−14’ to ‘−1’ denote the period before the onset of clinical signs of lameness (day ‘0’) in the LG (lame) group of cows and days ‘1’ through ‘13’ indicate the period from the start of lameness treatment and recovery period.
Throughout the investigation time, the RumiWatch Sensor (RWS; Itin + Hoch GmbH, Liestal, Switzerland), for the measure of the ruminative behavior, was used on the 50 cows selected for the study (Figure 1). The RWS is comprised of a noseband halter that has a built-in pressure detector and a liquid-filled pressure tube.
The pressure sensor and the tube are placed in a belt on the nose bridge of the cow. The triaxial accelerometer, the data logger, and a secure digital memory card are located on the right belt ring, mounted in a waterproof plastic box. In another box on the left belt ring, the batteries are incorporated. Data collected by the pressure sensor and the triaxial accelerometer were recorded with a frequency of 10 Hz and saved on the secure digital memory card. To ensure the best possible detection of the jaw movements by the pressure sensor, the belt around the nose and the lower jaw left 3 to 5 cm of movement space to the nose bridge and was located between 11 and 16 cm behind the nasal tip. The recorded data were read out by the RumiWatch Manager (version 2.1.0.0, Itin and Hoch GmbH) and processed through the evaluation software, called the RumiWatch Converter (C2, version 0.7.3.2, Itin and Hoch GmbH).
With the help of RWS the following attributes of feeding were registered: Drinking time (DT)—time spent for drinking, including interruptions between drinking gulps up to 5 s.; Rumination time (RT)—time spent for rumination chews including chewing interruptions up to 5 s.; Eating time (ET)—time spent for eating chews, including interruptions between eating chews up to 5 s.; Rumination chews (RC)—number of chews during rumination for breakdown of the regurgitated materials into smaller particles using the molars; Eating chews (EC)—total number of prehension bites and breakdown chews while eating; Drinking gulps (DG)—total number of drinking gulps while drinking; Bolus (B)—number of boluses during rumination; Chews per minute during rumination (CM)—chews for one minute; Chews per bolus (CB)—chews performed during rumination between the regurgitation and swallowing of one bolus.

2.3. Data Analysis and Statistics

The statistical analysis of RumiWatch data was performed with the SPSS 25.0 (SPSS Inc., Chicago, IL, USA) program package. The normal distribution of variables was assessed using the Kolmogorov–Smirnov test. After that, we used the general linear repeated measures model and Fisher’s standard deviation criterion to compare the indicators between the study (healthy and lame) groups.
The results of RumiWatch indicators were given as least square means (LSM) and standard deviation (SD). A linear regression was applied to determine the change in the estimated RumiWatch variables during the two experiment periods: (1) period until the onset of clinical signs (days from ‘−14’ to ‘−1’) and (2) treatment period (days from ‘0’ to ‘13’). A probability of less than 0.05 was considered significant (p < 0.05).

3. Results

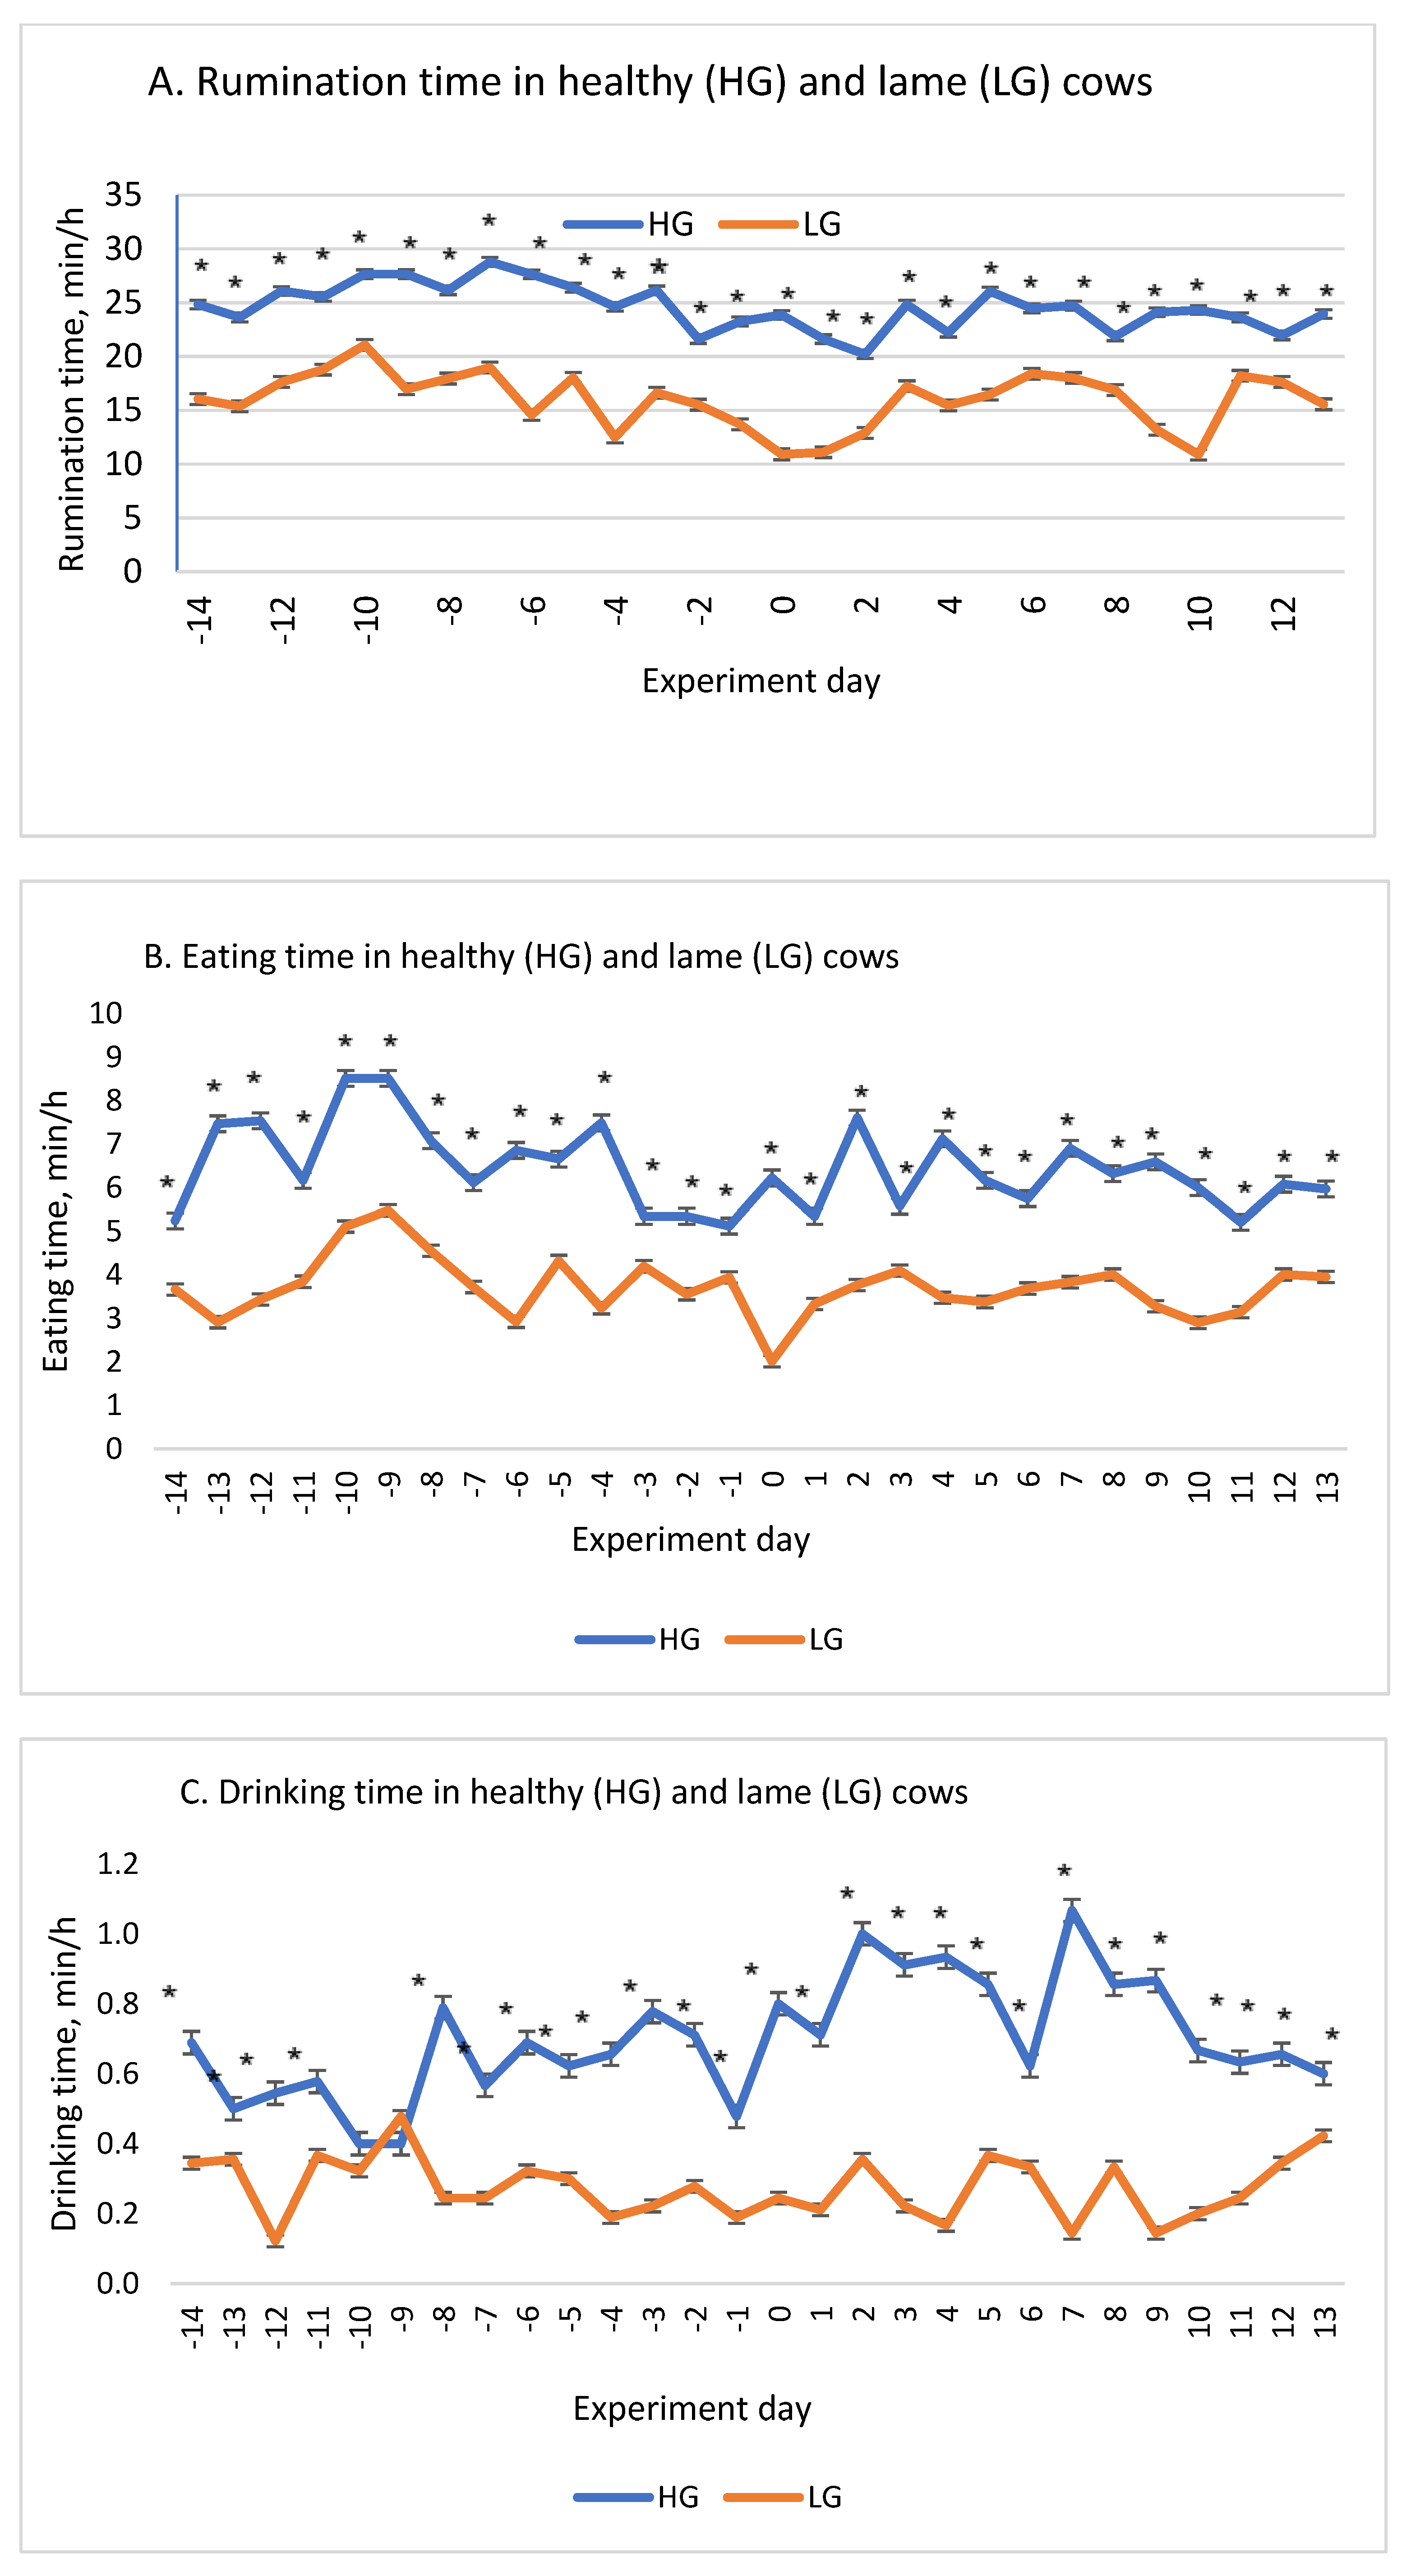
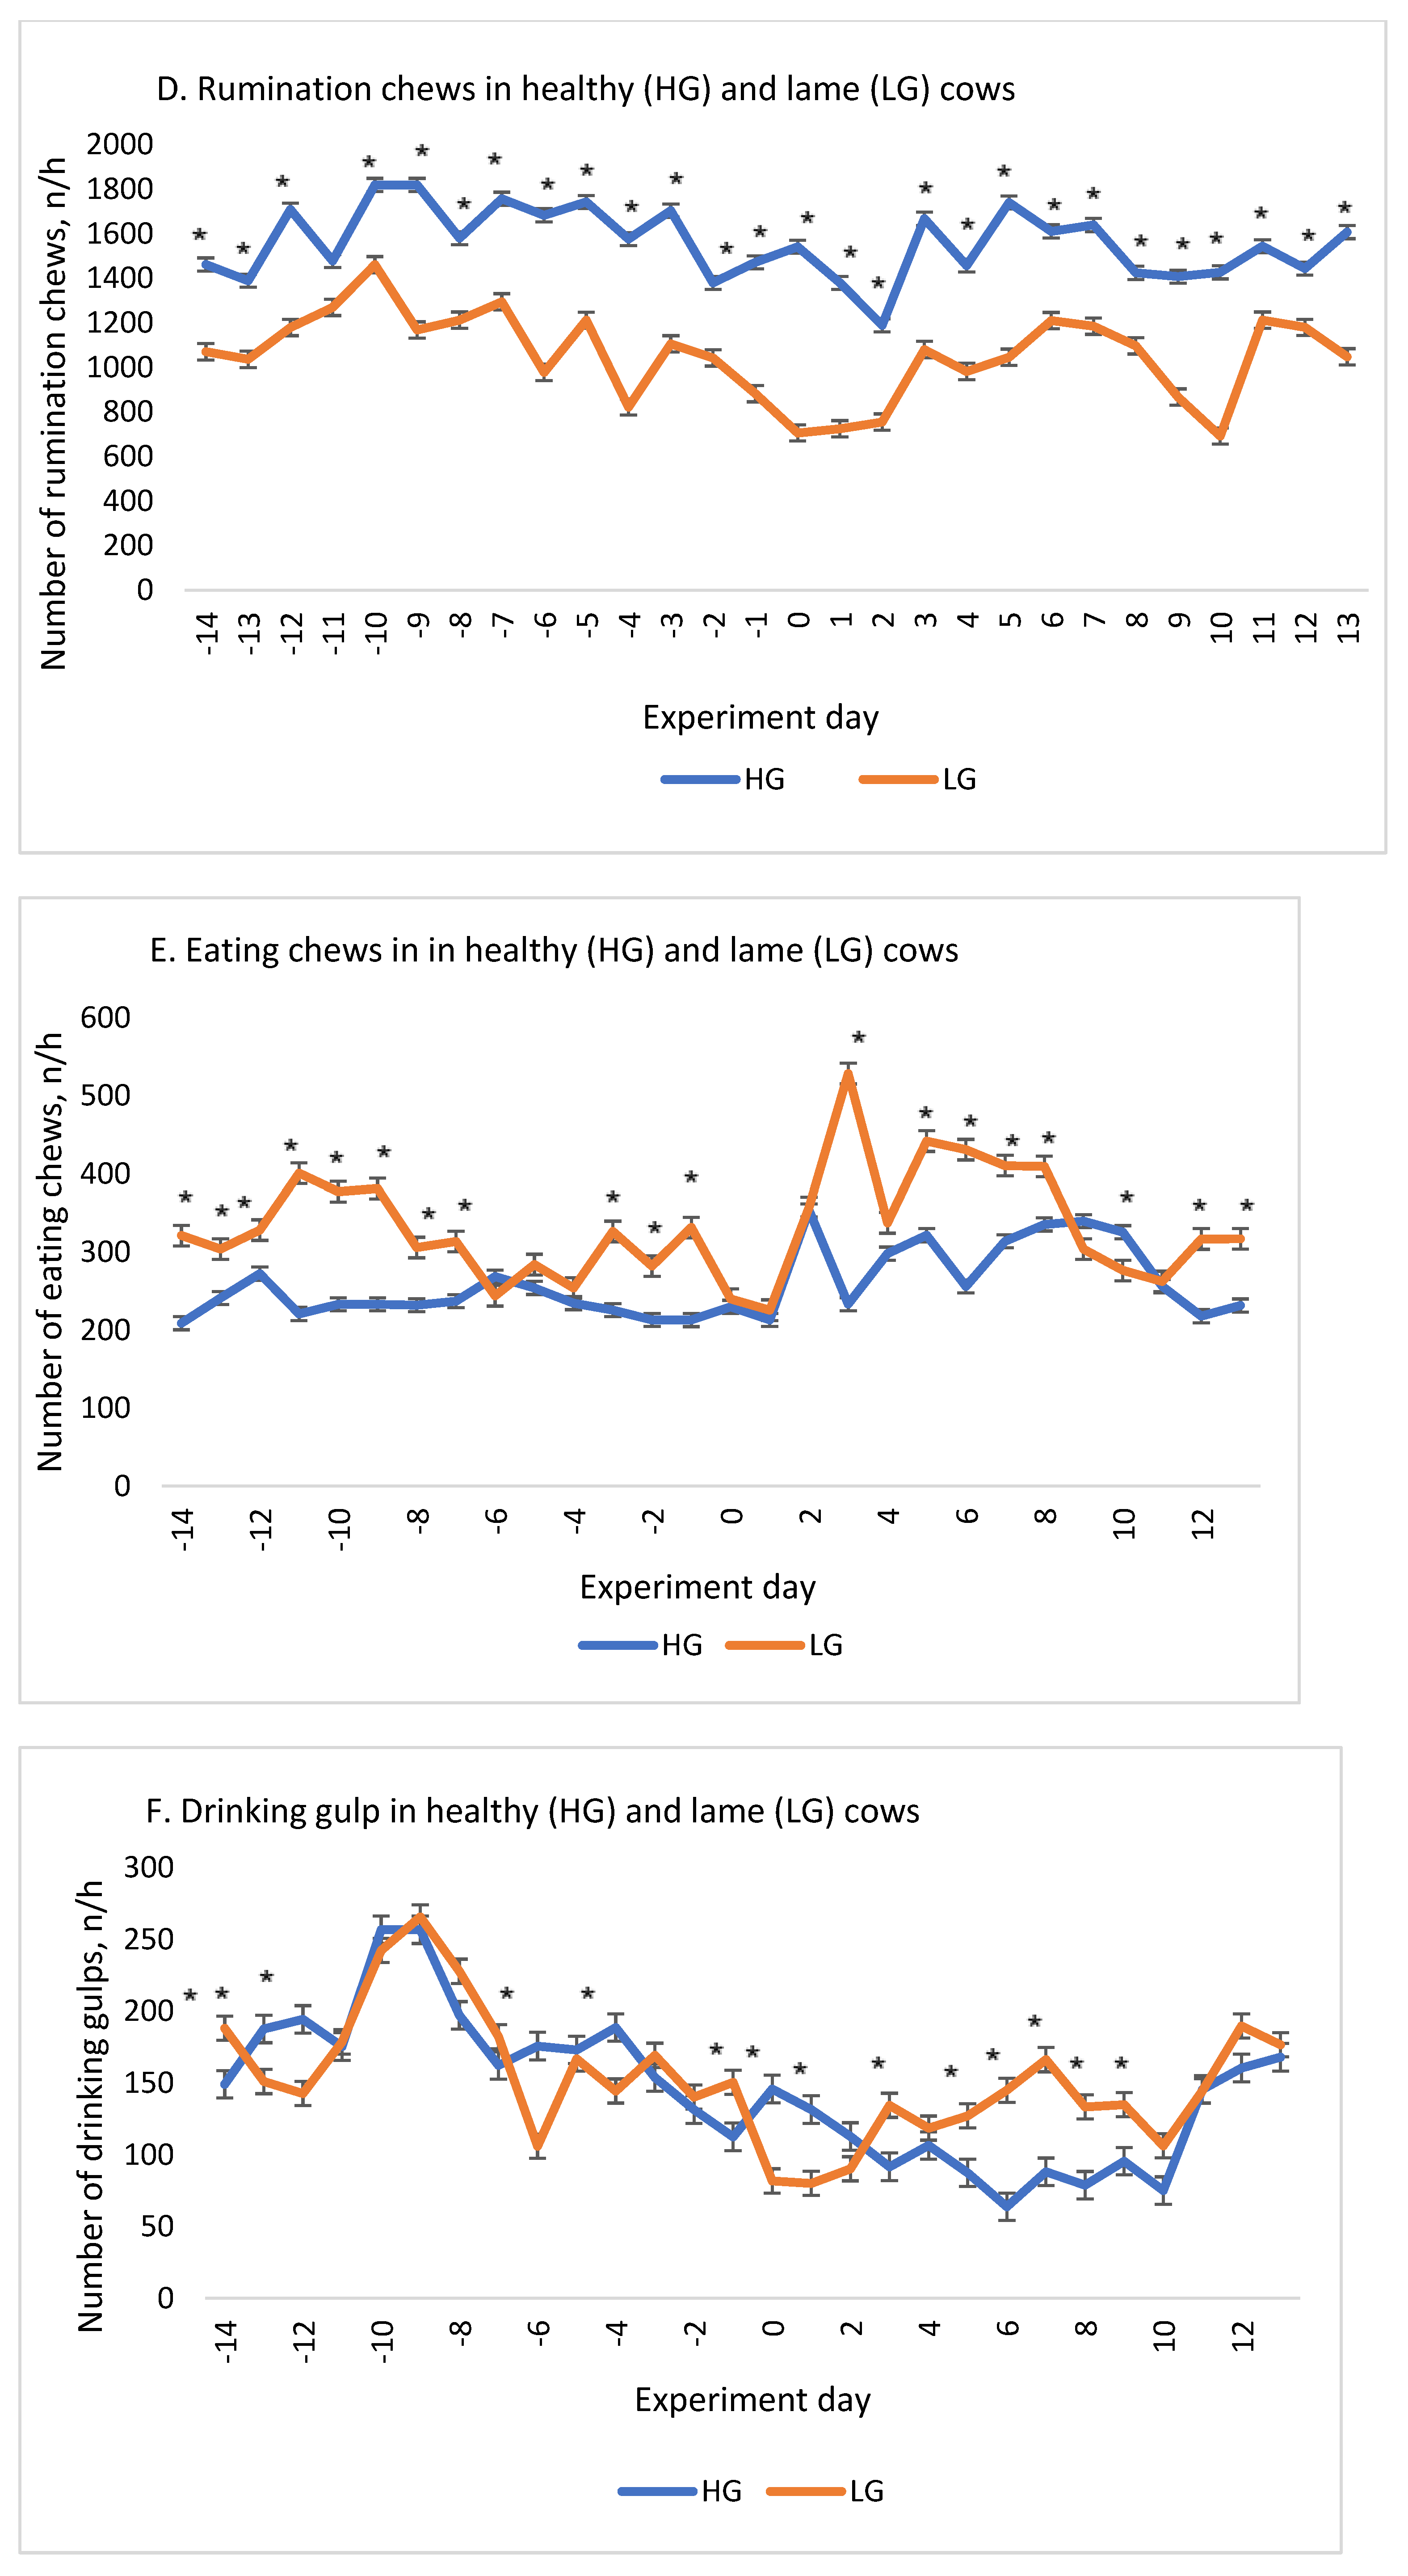
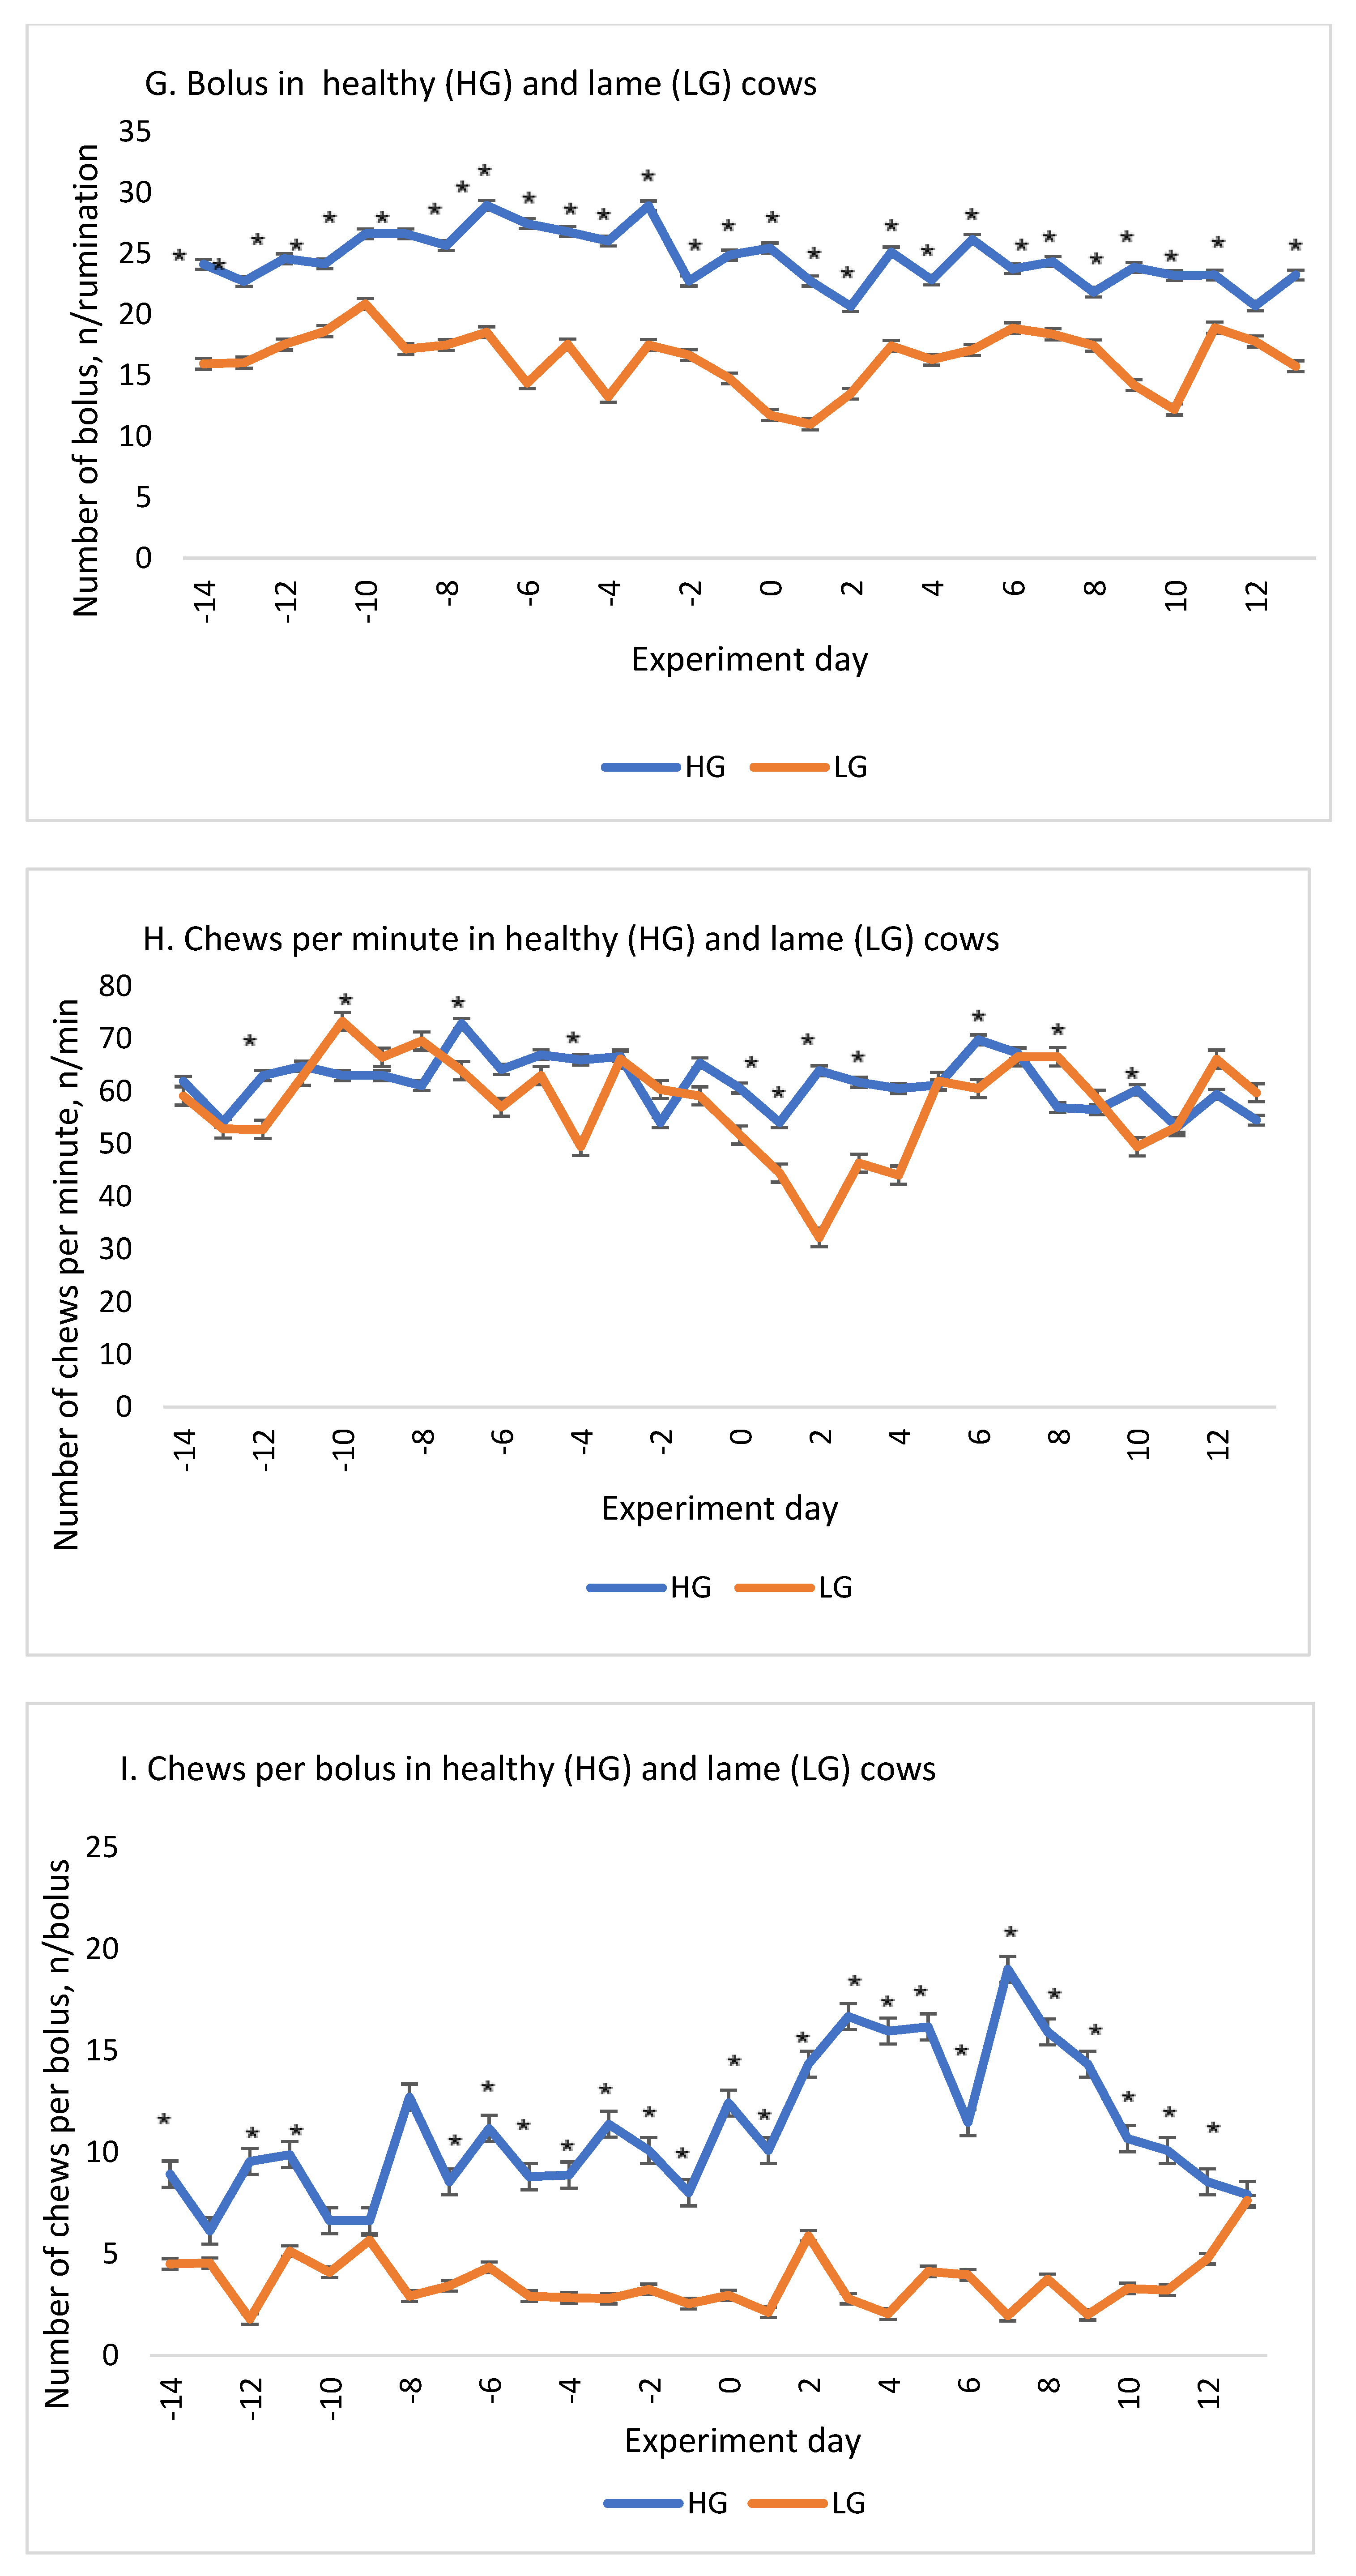
3.1. Impact of Fresh Dairy Cows Lameness on Ingestive Behaviors Registered with RumiWatch Noseband Sensor

As can be seen from the data in in the Table 3, the average values of all indicators recorded by the RumiWatch sensor were significantly higher in healthy cows. The average indicators of HG cows were higher than the average indicators of lame cows from 1.1 times (p ≤ 0.05; drinking gulps and chews per minute) to 3.1 times (p < 0.001; chews per bolus).

3.2. Changes in Ingestive Behaviors Registered with RumiWatch Noseband Sensor in Lame and Non-Lame Cows during the Experiment

The rumination time, eating time, rumination chews and bolus count indicators in healthy cows were higher (p < 0.001) than in lame cows throughout the experiment (Figure 1).
In the lame group, there was a linear trend towards a decrease in rumination time (R2 = 0.30), rumination chews (R2 = 0.31), and bolus (R2 = 0.25) indicators from the beginning of the experiment to lameness identification day. In the healthy group, a similar trend was observed only for drinking gulps values (R2 = 0.26). For lame cows, an increase in drinking gulps (R² = 0.54) and chews per minute (R² = 0.37) was observed from the start of lameness treatment to the end of the experiment. Other indicators changed less (Table 4).
The mean rumination time of healthy cows was as much as 2.19 times higher (p < 0.001) than that of lame cows on the lameness identification day, later this difference between the groups decreased to the sixth day of treatment, then increased again and decreased at the end of the experiment (Figure 2A). The changes in rumination time of lame cows could be described by linear regression, showing a downward trend in this indicator from the beginning to the end of the experiment. In the healthy group, a decreasing trend of this indicator was also observed during the experiment, but the value of R2 was small (Table 2).
The lowest eating time (2.01 ± 0.1) was found on lameness identification day and the highest (2.72 times higher, p < 0.001) on day ‘−9’ before the onset of clinical signs of the disease (Figure 2B).
Drinking time was significantly (p < 0.001) higher in the healthy group, with the exception of ‘−10’ and ‘−9’ days prior to clinical signs of disease in lame cows. The largest difference between groups (7.38-fold) was found on day 7 of treatment (Figure 2C).
A downward trend in rumination chews (Figure 2D) was observed in lame cows from day 7 before until the identification of lameness. During the mentioned period, the value of the indicator decreased 2.07 times (p < 0.001). On the last day of the experiment, the mean rumination chews differed between the groups 1.53-fold (p < 0.001).
The mean eating chews value of lame cows decreased 1.50 times from the beginning of the experiment to lameness identification day (p < 0.001), while in the healthy group, on the contrary, it increased 1.13 times. Eating chews was 1.55-fold higher in the healthy cow group (p < 0.001) on the last day of the experiment compared to the lame group (Figure 2E).
Eating chews (Figure 2E) in the healthy group during the experiment increased (R² = 0.4718) from the second day to the end of the experiment (1.45 times, p < 0.001). The highest eating chews value were found in lame cows on the third day after identification of lameness, and the lowest (2.19 times lower) on the first day after identification of lameness (p < 0.001).
During the experimental period, drinking gulps decreased in the healthy group (y = −4.0578x + 203.98, R² = 0.434) (Table 2). In lame cows, the lowest drinking gulps (176.00 ± 4.351) (total number of drinking gulps while drinking) was set on lameness identification day, and the highest value (1.59 times higher, p < 0.001) was on the 12th day after identification of lameness (Figure 2F).
The value of indicator bolus (Figure 2G) decreased (1.59 times p < 0.001) from day ‘−3’ to day ‘+1’ in lame cows. The largest difference in this indicator between groups was found on day ‘0’ (2.17 times, p < 0.001). Twelve days after the identification of lameness, the difference between the groups decreased.
Analyzing the change in chews per minute (Figure 2H) in the lame group, we found a decrease (2.27 times, p < 0.001) in this indicator from ‘−10’ to ‘2’ days of the experiment. After that, we noticed an increase up to day ‘+8’. Chews per minute values in the healthy group fluctuated less during the experimental period.
The chews per bolus value were almost the same in both groups of cows at the end of the experiment, but the largest difference between the groups (9.70 times) was found on day 7 (Figure 2I).

4. Discussion

Lameness has a large impact on dairy farming industry development [17]. Therefore, in the past few years a growing number of electronic techniques have been incorporated into the dairy industry with the aim to detect lameness quicker and more accurate [7]. Automated lameness detection could provide useful cow- and herd-level information to address an information gap, particularly regarding mild and moderately lame cows [18]. The indirect methods mainly used an accelerometer to detect the behavior and activity of cows [19]. In this study, we investigated the impact of lameness on attributes of feeding registered with the RumiWatch noseband sensor: rumination time, drinking time, eating time, rumination chews, eating chews, drinking gulps, bolus count, chews per minute, and chews per bolus before and after diagnosis of lameness fresh dairy cows. According to our results, lame cows demonstrated a reduction in the rumination time (on average 8.62 min/h less), eating time (on average 2.73 min/h less), rumination chews (on average 504.67 n/h less), drinking time (on average 0.42 min/h) and bolus count (on average 8.23 n/rumination) less that non lame cow throughout the experiment).
Monitoring of rumination time alone, or when combined with other variables, has been described as a means of detecting illness in dairy cattle and it was closely associated with subclinical and clinical health disorders [20].
Past studies found that lameness has affected a number of rumination behavior characteristics, in terms of decreased daily feed intake, feeding time [21,22,23], rumination time [21,23], and increased feeding rate [21,22]. However, none of these studies investigated lameness, rumination, and feeding behavior at the same time [24]. According to Thorup et al. [25] when compared to not lame cows, lame cows are likely to exhibit a different feeding behavior such as increased feeding rate and decreased feeding time, whereas rumination time seems much less affected by lameness. Thorup et al. [25] found that lameness problems would require measurement of feeding as well as rumination to be registered automatically. Using a combination of two or more feeding behaviors is likely to increase the accuracy of detecting problems. Also, Soriani et al. [26] found that cows with a shorter rumination time had a greater incidence of clinical disease (including ketosis and lameness).
Rumination can also be affected by the social hierarchy of cows, where a lower rank implies less eating and therefore less ruminating, less lying, and more standing, which in turn leads to an increased chance of lameness [3].
Also, the lowest eating time (2.01 ± 0.1 min/h) was found on lameness identification day for lame cows). According literature, lame cows may compensate for the reduction in total feeding time by increasing their feed intake rate [22]. Alternatively, the change in feeding behavior observed in lame animals may adversely affect rumen function—e.g., consuming the total daily dry matter intake over fewer meals, at an increased rate—may decrease rumination. Finally, the discomfort or stress associated with lameness may directly affect rumen function via central depression of the centers controlling rumination. A previous work has demonstrated that rumination is negatively associated with higher levels of cortisol [26]. The time dairy cattle spend eating varies greatly when combined across experimental conditions and there are signs of a compensatory mechanism between ruminating and eating time [27]. According to our results, the highest eating chews value was found in lame cows on the third day after identification of lameness, and the lowest (2.19 times lower) on the first day after identification of lameness According to literature, eating duration and the number of eating chews decreased in moderately lame cows [28]. Lame cows spent less time eating to reduce the time spent standing on painful feet or limbs [29]. Bareille et al. [30] state that lame cows have reduced total feed intake than non-lame cows. Thorup et al. found weaker eating behavior but similar rumination behavior in lame cows compared with non-lame cows [25]. According to the measurement of reduced eating time and number of eating chews, we can assume that moderately lame cows in our study potentially had a poorer comminution of feed [28]. Weigele et al. [29] found that the number of boluses, ruminating time, number of ruminating chews, and average ruminating speed, however, were not affected by moderate lameness. Lameness reduced feeding frequency by 44% [24]. Constrained feeding time forces cows to eat faster, and in this respect, lameness may be viewed as a feeding time constraint by cows [30].
The lowest number of drinking gulps was found on lameness identification day for lame cows (176 ± 4.35 n/h) and the highest (1.59 times higher) was found on the 12 day after identification of lameness). Many factors can put a strain on water consumption: dry matter of the diets, changes in ambient temperatures, increased loss of water due to increased milk production, amount of feed ingested, consumption of sodium and potassium, not to mention physiological factors and diseases [31].
To our knowledge, the present study is the first study to investigate impact of lameness in fresh dairy cows on attributes of feeding registered with on-line sensors (such as rumination time, drinking time, eating time, rumination chews, eating chews, drinking gulps, bolus count, chews per minute, chews per bolus before, and after diagnosis of lameness fresh dairy cows). This study showed that the attributes of feeding registered with on-line sensors could also be used for an automatic detection of lameness.

5. Conclusions

In conclusion, lameness seemed to impair attributes of feeding registered with noseband sensor in fresh dairy cows and confirming our hypothesis, results of the present study could be integrated for early identification of lameness in fresh dairy cows. According to our results, we found that lameness of fresh dairy cows affects the inline registered ingestive behaviors biomarkers. In addition, reduction in the rumination time, eating time, rumination chews, drinking time and bolus count in lame group on lameness identification day, may serve as lameness indicators. Also, eating behavior changes as early as 10 days before the visual identification of lameness.
For practicians, we recommend the use of the following biomarkers for the early diagnosis of lameness in fresh dairy cows such as rumination time, eating time, rumination chews, drinking time and bolus count.
Further studies are required for the early automatic detection of lameness, combining the parameters from current study with other in-line biomarkers (such as reticulorumen pH, temperature and etc.), also, with including also the social hierarchy of cows.

Author Contributions

R.A.: overall research study process including literature search, carrying out research experiments, and compiling the final manuscript. The entire process was revised by the co-authors. V.J.: Assisted in designing and setting up field data collection activities and developed the software and algorithm for data analysis. G.U.: sampling of the experimental animals; D.M. and M.T.: aided in fieldwork set up, data collection, and sampling of the experimental animals. M.U.: literature search. W.B.: major support in processing of data in the study. All authors have read and agreed to the published version of the manuscript.

Funding

This research received no external funding.

Institutional Review Board Statement

The study was conducted according to the guidelines of the Declaration of Helsinki, and ap-proved by Ethics Committee (The study approval number is PK016965, 6 June 2017).

Informed Consent Statement

Not applicable.

Data Availability Statement

The data presented in this study are available within the article.

Conflicts of Interest

The authors declare no conflict of interest.

References

  1. Bruijnis, M.; Beerda, B.; Hogeveen, H.; Stassen, E.N. Assessing the welfare impact of foot disorders in dairy cattle by a modeling approach. Animal 2012, 6, 962–970. [Google Scholar] [CrossRef] [PubMed] [Green Version]
  2. Barwick, J.; Lamb, D.; Dobos, R.; Schneider, D.; Welch, M.; Trotter, M. Predicting lameness in sheep activity using tri-axial acceleration signals. Animals 2018, 8, 12. [Google Scholar] [CrossRef] [Green Version]
  3. Van Hertem, T.; Maltz, E.; Antler, A.; Romanini, C.; Viazzi, S.; Bahr, C.; Schlageter-Tello, A.; Lokhorst, C.; Berckmans, D.; Halachmi, I. Lameness detection based on multivariate continuous sensing of milk yield, rumination, and neck activity. J. Dairy Sci. 2013, 96, 4286–4298. [Google Scholar] [CrossRef] [PubMed] [Green Version]
  4. Stangaferro, M.L.; Wijma, R.; Caixeta, L.S.; Al-Abri, M.A.; Giordano, J.O. Use of rumination and activity monitoring for the identification of dairy cows with health disorders: Part III. Metritis. J. Dairy Sci. 2016, 99, 7422–7433. [Google Scholar] [CrossRef] [Green Version]
  5. Poursaberi, A.; Bahr, C.; Pluk, A.; Van Nuffel, A.; Berckmans, D. Real-time automatic lameness detection based on back posture extraction in dairy cattle: Shape analysis of cow with image processing techniques. Comput. Electron. Agric. 2010, 74, 110–119. [Google Scholar] [CrossRef]
  6. Pluk, A.; Bahr, C.; Leroy, T.; Poursaberi, A.; Song, X.; Vranken, E.; Maertens, W.; Van Nuffel, A.; Berckmans, D. Evaluation of step overlap as an automatic measure in dairy cow locomotion. Trans. ASABE 2010, 53, 1305–1312. [Google Scholar] [CrossRef]
  7. Pluk, A.; Bahr, C.; Poursaberi, A.; Maertens, W.; Van Nuffel, A.; Berckmans, D. Automatic measurement of touch and release angles of the fetlock joint for lameness detection in dairy cattle using vision techniques. J. Dairy Sci. 2012, 95, 1738–1748. [Google Scholar] [CrossRef] [Green Version]
  8. Benaissa, S.; Tuyttens, F.A.; Plets, D.; Cattrysse, H.; Martens, L.; Vandaele, L.; Joseph, W.; Sonck, B. Classification of ingestive-related cow behaviours using RumiWatch halter and neck-mounted accelerometers. Appl. Anim. Behav. Sci. 2019, 211, 9–16. [Google Scholar] [CrossRef] [Green Version]
  9. Antanaitis, R.; Juozaitienė, V.; Televičius, M.; Malašauskienė, D.; Urbutis, M.; Baumgartner, W. Influence of Subclinical Ketosis in Dairy Cows on Ingestive-Related Behaviours Registered with a Real-Time System. Animals 2020, 10, 2288. [Google Scholar] [CrossRef]
  10. Sadiq, M.B.; Ramanoon, S.Z.; Shaik Mossadeq, W.M.; Mansor, R.; Syed-Hussain, S.S. Association between Lameness and Indicators of Dairy Cow Welfare Based on Locomotion Scoring, Body and Hock Condition, Leg Hygiene and Lying Behavior. Animals 2017, 7, 79. [Google Scholar] [CrossRef] [Green Version]
  11. Miguel-Pacheco, G.G.; Kaler, J.; Remnant, J.; Cheyne, L.; Abbott, C.; French, A.P.; Pridmore, T.P.; Huxley, J.N. Behavioural changes in dairy cows with lameness in an automatic milking system. Appl. Anim. Behav. Sci. 2014, 150, 1–8. [Google Scholar] [CrossRef]
  12. Rombach, M.; Münger, A.; Niederhauser, J.; Südekum, K.; Schori, F. Evaluation and validation of an automatic jaw movement recorder (RumiWatch) for ingestive and rumination behaviors of dairy cows during grazing and supplementation. J. Dairy Sci. 2018, 101, 2463–2475. [Google Scholar] [CrossRef]
  13. Büchel, S. Sensor-Based Control of Chewing and Rumination Behavior of Dairy Cows. Ph.D. Thesis, University of Kassel, Kassel, Germany, 2014. [Google Scholar]
  14. Zehner, N.; Huerlimann, M.; Hoch, M. User Guide RumiWatch Converter Version 0.7. 3.2 and higher. In User Guide; CIGR-AgEng: Bennwil, Switzerland, 2014. [Google Scholar]
  15. Sprecher, D.E.A.; Hostetler, D.E.; Kaneene, J.B. A lameness scoring system that uses posture and gait to predict dairy cattle reproductive performance. Theriogenology 1997, 47, 1179–1187. [Google Scholar] [CrossRef]
  16. Warnick, L.D.; Janssen, D.; Guard, C.L.; Gröhn, Y.T. The effect of lameness on milk production in dairy cows. J. Dairy Sci. 2001, 84, 1988–1997. [Google Scholar] [CrossRef]
  17. Van Nuffel, A.; Zwertvaegher, I.; Pluym, L.; Van Weyenberg, S.; Thorup, V.M.; Pastell, M.; Sonck, B.; Saeys, W. Lameness detection in dairy cows: Part 1. How to distinguish between non-lame and lame cows based on differences in locomotion or behavior. Animals 2015, 5, 838–860. [Google Scholar] [CrossRef] [Green Version]
  18. O’Leary, N.W.; Byrne, D.T.; O’Connor, A.H.; Shalloo, L. Invited review: Cattle lameness detection with accelerometers. J. Dairy Sci. 2020, 103, 3895–3911. [Google Scholar] [CrossRef] [PubMed] [Green Version]
  19. Alsaaod, M.; Fadul, M.; Steiner, A. Automatic lameness detection in cattle. Vet. J. 2019, 246, 35–44. [Google Scholar] [CrossRef] [PubMed]
  20. Liboreiro, D.N.; Machado, K.S.; Silva, P.R.; Maturana, M.M.; Nishimura, T.K.; Brandão, A.P.; Endres, M.I.; Chebel, R.C. Characterization of peripartum rumination and activity of cows diagnosed with metabolic and uterine diseases. J. Dairy Sci. 2015, 98, 6812–6827. [Google Scholar] [CrossRef] [PubMed] [Green Version]
  21. Almeida, P.E.; Weber, P.S.D.; Burton, J.L.; Zanella, A.J. Depressed DHEA and increased sickness response behaviors in lame dairy cows with inflammatory foot lesions. Domest. Anim. Endocrinol. 2008, 34, 89–99. [Google Scholar] [CrossRef]
  22. Gonzàlez, L.A.; Tolkamp, B.J.; Coffey, M.P.; Ferret, A.; Kyriazakis, I. Changes in feeding behavior as possible indicators for the automatic monitoring of health disorders in dairy cows. J. Dairy Sci. 2008, 91, 1017–1028. [Google Scholar] [CrossRef] [Green Version]
  23. Norring, M.; Häggman, J.; Simojoki, H.; Tamminen, P.; Winckler, C.; Pastell, M. Short communication: Lameness impairs feeding behavior of dairy cows. J. Dairy Sci. 2014, 97, 4317–4321. [Google Scholar] [CrossRef] [PubMed]
  24. Thorup, V.M.; Nielsen, B.L.; Robert, P.; Giger-Reverdin, S.; Konka, J.; Michie, C.; Friggens, N.C. Lameness affects cow feeding but not rumination behavior as characterized from sensor data. Front. Vet. Sci. 2016, 3, 37. [Google Scholar] [CrossRef] [PubMed] [Green Version]
  25. Soriani, N.; Trevisi, E.; Calamari, L. Relationships between rumination time, metabolic conditions, and health status in dairy cows during the transition period. J. Anim. Sci. 2012, 90, 4544–4554. [Google Scholar] [CrossRef] [PubMed]
  26. Bristow, D.J.; Holmes, D.S. Cortisol levels and anxiety-related behaviors in cattle. Physiol. Behav. 2007, 90, 626–628. [Google Scholar] [CrossRef] [PubMed]
  27. White, R.R.; Hall, M.B.; Firkins, J.L.; Kononoff, P.J. Physically adjusted neutral detergent fiber system for lactating dairy cow rations. I: Deriving equations that identify factors that influence effectiveness of fiber. J. Dairy Sci. 2017, 100, 9551–9568. [Google Scholar] [CrossRef] [PubMed]
  28. Weigele, H.C.; Gygax, L.; Steiner, A.; Wechsler, B.; Burla, J. Moderate lameness leads to marked behavioral changes in dairy cows. J. Dairy Sci. 2018, 101, 2370–2382. [Google Scholar] [CrossRef] [Green Version]
  29. Bareille, N.; Beaudeau, F.; Billon, S.; Robert, A.; Faverdin, P. Effects of health disorders on feed intake and milk production in dairy cows. Livest. Prod. Sci. 2003, 83, 53–62. [Google Scholar] [CrossRef]
  30. Munksgaard, L.; Jensen, M.B.; Pedersen, L.J.; Hansen, S.W.; Matthews, L. Quantifying behavioural priorities—Effects of time constraints on behaviour of dairy cows, Bos taurus. Appl. Anim. Behav. Sci. 2005, 92, 3–14. [Google Scholar] [CrossRef]
  31. Brandstetter, V.; Neubauer, V.; Humer, E.; Kröger, I.; Zebeli, Q. Chewing and drinking activity during transition period and lactation in dairy cows fed partial mixed rations. Animals 2019, 9, 1088. [Google Scholar] [CrossRef] [Green Version]
Figure 1. Cow with the RumiWatch Sensor.
Agriculture 11 00851 g001
Figure 2. Changes in ingestive-related behaviors parameters by day of the experiment. * shows that the values of the HG and LG groups differ significantly at p < 0.05. RT—Rumination time (time in minutes spent for rumination chews); ET—Eating time (time in minutes spent for eating chews); DT—Drinking time (time in minutes spent for drinking); RC—Rumination chews (chews during rumination for mechanical breakdown of the regurgitated materials); EC—Eating chews (number of prehension bites); DG—Drinking gulp (total number of drinking gulps while drinking); B—number of boluses per rumination) CM—Chews per minute (chews for one minute); CB—Chews per bolus (chews performed during rumination). LG—lame cows’ group, HG—healthy group. Days ‘−14’ to ‘−1’ denote the experimental period before the onset of clinical signs of lameness (day ‘0’) in the LG group, and days ‘1’ to ‘13’—the period after the start of treatment.
Agriculture 11 00851 g002aAgriculture 11 00851 g002bAgriculture 11 00851 g002c
Table 1. Characteristics of experimental groups.
GroupBreedAverage of DIMAverage of Milk Yield of Past Lactation (kg/Year)Partulation Average of Number of Lactation
HGLithuanian Black and White1512500 (±500)Multiparous3
LGLithuanian Black and White1512100 (±350)Multiparous3
HG—healthy cows; LG—lame group; DIM—days in milk; kg/year—kilograms per year.
Table 2. Composition of ration.
ParametersValuesUnits
Dry matter (DM)49%
Neutral detergent fiber28% of DM
Acid detergent fiber20% of DM
Non-fiber carbohydrates39% of DM
Crude protein16% of DM
Net energy for lactation1.7Mcal/kg
DM—dry matter; % of DM—percent of dry matter; Mcal/kg—megacalorie per kilogram.
Table 3. Results of RumiWatch noseband sensor data of dairy cows that were eventually diagnosed with subclinical lameness and cows that remained healthy. Least square means (LSM) and standard deviation (SD) by groups of cows.
IndicatorHealthyLamep
RT (min/h)24.56 ± 0.4415.94 ± 0.43<0.001
ET (min/h)6.44 ± 0.23.71 ± 0.12<0.001
DT (min/h)0.70 ± 0.030.28 ± 0.03<0.001
RC (n/h)1558.57 ± 33.121053.9 ± 34.88<0.001
EC (n/h)430.96 ± 13.25242.69 ± 13.35<0.001
DG (n/h)152.96 ± 5135.61 ± 4.210.048
B (n/rumination)24.55 ± 0.5216.32 ± 0.54<0.001
CM (n/min)61.66 ± 1.156.75 ± 1.020.050
CB (n/rumination)11.10 ± 0.43.61 ± 0.42<0.001
RT—Rumination time (time in minutes spent for rumination chews); ET—Eating time (time in minutes spent for eating chews); DT—Drinking time (time in minutes spent for drinking); RC—Rumination chews (chews during rumination for mechanical breakdown of the regurgitated materials); EC—Eating chews (number of prehension bites); DG—Drinking gulp (total number of drinking gulps while drinking); B—number of boluses per rumination) CM—Chews per minute (chews for one minute); CB—Chews per bolus (chews performed during rumination).
Table 4. Evaluation of changes in ingestive-related behaviors Indicators by period of the experiment.
IndicatorPeriod until the Onset of Clinical SignsTreatment Period
HealthyLameHealthyLame
RTy = −0.14x + 24.61,
R² = 0.1,
p = 0.75
y = −0.33x + 13.99,
R² = 0.3,
p < 0.001
y = 0.1x + 22.69,
R² = 0.05,
p = 0.45
y = 0.18x + 14.28,
R² = 0.07,
p = 0.39
ETy = −0.1x + 5.93,
R² = 0.16,
p = 0.16
y = −0.05x + 3.47,
R² = 0.05,
p = 0.39
y = −0.04x + 6.48,
R² = 0.05,
p = 0.41
y = −0.002x + 3.62,
R² = 0.0007,
p = 0.89
DTy = 0.01x + 0.69,
R² = 0.17,
p = 0.15
y = −0.008x + 0.22,
R² = 0.15,
p = 0.18
y = −0.02x + 0.95,
R² = 0.3,
p < 0.001
y = 0.005x + 0.23,
R² = 0.05,
p = 0.5
RCy = −1.68x + 1595.3,
R² = 0.002,
p = 0.67
y = −24.56x + 923.8
R² = 0.31,
p < 0.001
y = 3.67x + 1470,
R² = 0.007,
p = 0.73
y = 20.85x + 866.65,
R² = 0.15,
p = 0.17
EC y = −8.83x + 382.05,
R² = 0.22,
p = 0.082
y = −4.43x + 225.11,
R² = 0.11,
p = 0.18
y = −0.49x + 419.57,
R² = 0.001,
p = 0.86
y = 2.94x + 206.64,
R² = 0.11,
p = 0.19
Dy = −4.52x + 145.63,
R² = 0.25,
p = 0.049
y = −5.04x + 133.83,
R² = 0.21,
p = 0.083
y = 3.34x + 84.59,
R² = 0.15,
p = 0.163
y = 5.95x + 92.65,
R² = 0.53,
p < 0.001
By = 0.11x + 26.53,
R² = 0.07,
p = 0.32
y = −0.25x + 14.75,
R² = 0.24,
p = 0.05
y = 3.34x + 84.59,
R² = 0.15,
p = 0.16
y = 0.2x + 14.65,
R² = 0.09,
p = 0.22
CMy = 0.14x + 64.18,
R² = 0.01,
p = 0.62
y = −0.19x + 59.14,
R² = 0.01,
p = 0.68
y = −0.42x + 62.89,
R² = 0.10,
p = 0.27
y = 1.67x + 42.88,
R² = 0.37,
p < 0.001
CBy = 0.19x + 10.66,
R² = 0.18,
p = 0.09
y = −0.11x + 2.76,
R² = 0.23,
p = 0.06
y = −0.45x + 16.37,
R² = 0.25,
p = 0.05
y = 0.15x + 2.56,
R² = 0.13,
p = 0.22
RT—Rumination time (time in minutes spent for rumination chews); ET—Eating time (time in minutes spent for eating chews); DT—Drinking time (time in minutes spent for drinking); RC—Rumination chews (chews during rumination for mechanical breakdown of the regurgitated materials); EC—Eating chews (number of prehension bites); DG—Drinking gulp (total number of drinking gulps while drinking); B—number of boluses per rumination); CM—Chews per minute (chews for one minute); CB—Chews per bolus (chews performed during rumination).
Publisher’s Note: MDPI stays neutral with regard to jurisdictional claims in published maps and institutional affiliations.

