
Potato Surface Defect Detection Based on Deep Transfer Learning


1
School of Electronic Information and Electrical Engineering, Huizhou University, Huizhou 516007, China
2
School of Engineering, Penn State Erie, The Behrend College, Erie, PA 16563, USA
*
Author to whom correspondence should be addressed.
Agriculture 2021, 11(9), 863; https://0-doi-org.brum.beds.ac.uk/10.3390/agriculture11090863
Submission received: 27 July 2021
/
Revised: 6 September 2021
/
Accepted: 7 September 2021
/
Published: 10 September 2021
(This article belongs to the Special Issue Image Analysis Techniques in Agriculture)
Abstract
:Food defect detection is crucial for the automation of food production and processing. Potato surface defect detection remains challenging due to the irregular shape of potato individuals and various types of defects. This paper employs deep convolutional neural network (DCNN) models for potato surface defect detection. In particular, we applied transfer learning by fine-tuning a base model through three DCNN models—SSD Inception V2, RFCN ResNet101, and Faster RCNN ResNet101—on a self-developed dataset, and achieved an accuracy of 92.5%, 95.6%, and 98.7%, respectively. RFCN ResNet101 presented the best overall performance in detection speed and accuracy. It was selected as the final model for out-of-sample testing, further demonstrating the model’s ability to generalize.
1. Introduction
As one of the most significant crops, potatoes are planted on more than 18.9 million hectares of farms in the world [1]. In 2015, potatoes were promoted as a staple food in China, with a target of 30% of the total potatoes consumed as a staple food by 2020 [2], which drives potatoes to become the World’s fourth-largest food product after wheat, rice, and corn. After harvest, the potato surface is often subject to sprouting and mechanical damage due to human or other external factors [3]. Therefore, grading based on surface quality is crucial to classify products into different categories, which can greatly improve packing, storage, transportation, and other post-harvest operations. Traditional defect detection methods rely on manual inspection [4], which is highly subjective, slow, error prone, and difficult to achieve uniform standards [5].
As a non-intrusive technique, computer vision systems have been adopted to build automated grading systems during post-harvesting [6,7,8,9]. A variety of devices, such as CCD camera, ultraviolet camera, hyperspectral camera, and X-ray CT, have been utilized and demonstrated their efficacy in capturing essential features of potato surface quality [10]. Sensory images generated by these devices can be used to build estimators to detect a potato’s physical size and internal and external defects [3,11]. However, early automated grading systems have extensively utilized image processing algorithms and relied on manually defined image features to build classifiers [12,13,14,15], limiting the robustness and generalization [16] of detection performance due to the variance of potato types, appearances, and damage defects [17]. These machine vision systems form the basis of optical sorters used for potato grading and quality inspection [18,19,20]. For example, Noordam et al. develop a high-speed sorter to grade potatoes on on size, shape, and color based on several image processing and classification algorithms: Linear Discriminant Analysis combined with a Mahalanobis distance classifier for color segmentation; a Fourier-based estimator for shape classification; and features such as central moments, area, and eccentricity are used to discriminate between similar colored defects [20]. To build such an optical sorter, extensive domain knowledge is required to identify a set of features to represent a potato sample in an image. Compared to the feature-based conventional learning algorithms, deep learning can learn features automatically during training and demonstrate superior performance in a wide spectrum of computer vision tasks, including image classification and object detection [21,22]. Recent years have witnessed the development of deep learning-based optical sorters [23,24], which have been proven to be more efficient and effective than traditional machine vision-based systems [25].
The rise of deep learning has created explosive impact in every industry [26]. Deep convolutional neural networks (DCNNs), a revolutionary neural architecture, can eliminate the tedious feature engineering step and learn features automatically during training, pushing numerous computer vision tasks to the state of the art [22]. Specifically, a DCNN consists of multiple convolutional layers that can extract and represent features at different levels. The network parameters, or weights, are optimized during training in a ways that the critical patterns can be captured, leading to activated signals on the output feature maps, which jointly determine the prediction result.
DCNN-based models have also been developed for surface quality assessment of agricultural products [27,28,29]. We investigate a collection of relevant studies published in the last five years and present a subset of them in Table 1, from which we identify the commonly studied products, e.g., apples, carrots, mangosteens, tomatoes, and potatoes. In addition, we compare these efforts in terms of the number of classes, the learning task, the use of transfer learning and out-of-sample (OOS) testing. We highlight the differences between our work and the ones in the literature as follows.
- # classes. Half of the listed studies classify the target samples into two categories: healthy and defective. One study, by Hasan et al. [39], considered a fine-grained classification problem with twenty categories, which describe the different types of potato diseases. Our study considers three potato classes: normal, scratch, and sprout. Based on an experiment conducted by Al-Dosary et al. [40], 2–3% of potato tubers are superficially or deeply scratched, accounting for over 70% of the total damaged potatoes during harvesting. Our review reveals that the scratched type is rarely considered in surface defect detection models by prior efforts. Furthermore, sprouted potatoes can be toxic to human being due to the higher level of glycoalkaloids [41]. The two defective types we consider are crucial and meaningful, as they represent the major defects caused during and post-harvesting.
- Learning task. We have seen both classification [42] and object detection [43] used in the literature to build a detection model. The former takes an input image and outputs a predicted class, meaning that there is only one object in the image. On the other hand, the latter allows an input image to contain objects of different classes and outputs bounding boxes and classes of the predicted objects. Apparently, object detection is a more powerful model with more practical value, suitable for large-scale and real-time detection systems [44]. Our investigation shows that classification is mainly adopted by most existing studies, and we develop detection models based on object detection algorithms in this study.
- Transfer learning. Training a robust DCNN model requires a large amount of data, which is usually not available for the surface defect detection task. Transfer learning [45] addresses the low-resource issue by transferring knowledge from a source domain, where a base model can be trained with sufficient data, to a target domain. We find that most existing studies have adopted transfer learning, i.e., a pretrained DCNN model is only fine tuned on the target dataset for surface defect detection.
- OOS testing. OOS testing is essential to evaluate how robust a model is by testing it on a different batch of sample and potentially in a different environment [46]. A grading system can be installed and utilized in various scenarios. It is thus crucial to simulate the image variance caused by environment change via an OOS test set gathered in a different scenario than the one where the original dataset is developed. We did not find another related study using an OOS test set.
The contributions of this paper are as follows.
- We develop a dataset for potato surface defect detection with three categories and a total of 2770 images. Compared to the existing studies, we treat the potato surface defect task as an object detection problem and consider the scratched and sprouted potatoes, which are rarely seen in prior efforts.
- Three pretrained DCNN models—SSD Inception V2, Faster RCNN ResNet101, and RFCN ResNet101—have been fine-tuned on our dataset and achieved an accruacy of 92.5%, 95.6%, and 98.7%, respectively. In addition, we develop an OOS test set to evaluate the best model, namely, RFCN ResNet101, in three scenarios. Results show that the RFCN ResNet101 model demonstrates robust performance with moderate inference speed. To our best knowledge, this is the first time DCNN-based transfer learning is employed for potato surface detect detection, with three object detection algorithms evaluated on both original and OOS test sets. Our work can serve as a credible baseline for future research.
2. Material and Methods
2.1. Potato Surface Defect
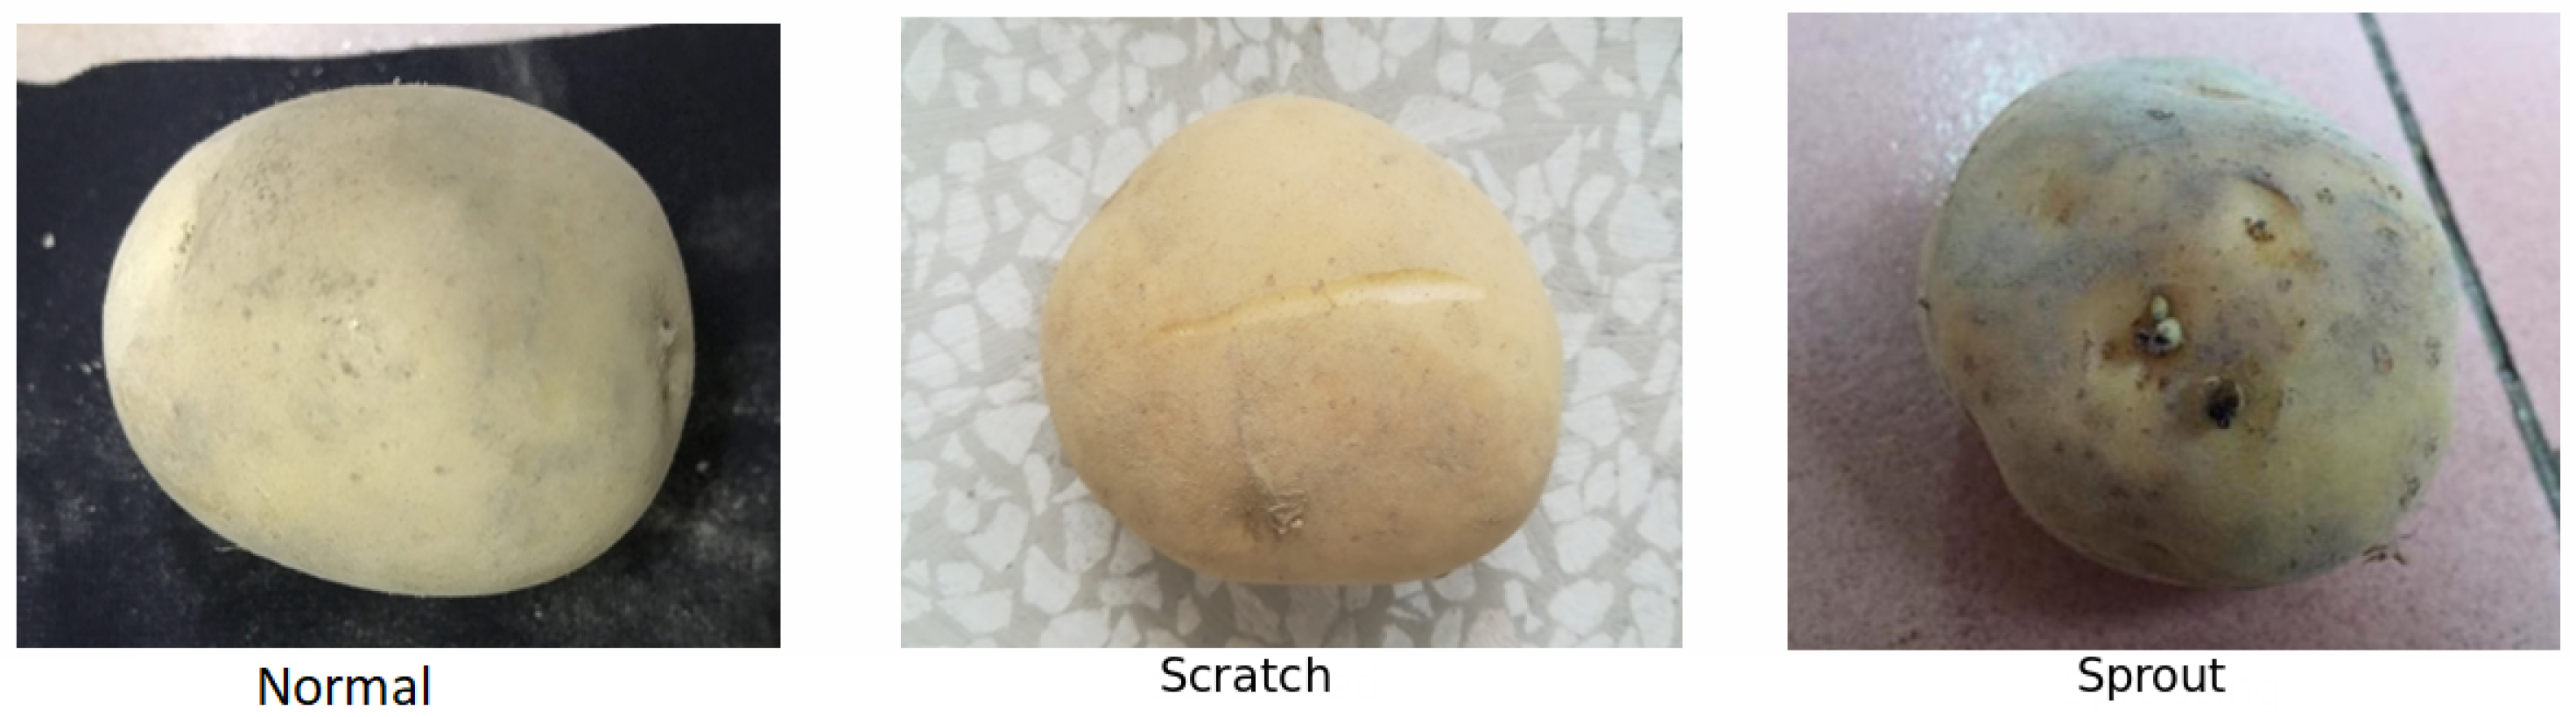
Surface defect refers to the external characteristics of potatoes, including sprouting, greening, insect eyes, rotting, disease spots, damage, etc. In this paper, we focus on three specific categories: normal, scratch, and sprout. Figure 1 shows a sample image for each category.
- Normal: Potatoes that are yellow without sprouts, damage, scratch, rot, etc. and are ready for everyday human consumption.
- Scratch: The potatoes were artificially scratched to simulate damage at the time of harvesting. In our experiment, we keep the number of scratches to one to three.
- Sprout: Potatoes germinate in the temperature range of 15 to 20 °C. Below 10 °C, germination is slow; above 25 °C, germination is rapid, but the shoot roots are small. Therefore, potatoes are placed in a room with a room temperature of 18 to 25 °C and high humidity.
2.2. Dataset
2.2.1. Potato Samples Acquisition
A total of 642 normal and edible potatoes were taken from a local vegetable market in Huizhou, a southern city in China. The acquired potatoes belong to the Favorita variety [47]. We took photos on the same day of purchase for these normal potatoes to create an image set for the normal category. After that, the 642 normal potatoes were divided into two groups in a ratio of 1:2. The 214 potatoes in the first group were manually and intentionally scratched. The 428 potato samples in the second group were then placed in a relatively humid environment at 18–25 °C and left to germinate. We eventually collected a total of 428 sprouted potatoes. The sample size of sprouted potatoes is twice as large as that of scratched potatoes for two reasons: first, there are more uncontrollable factors when making samples of sprouted potatoes, which may cause undesirable results such as rotting [48], and second, the sprouted potatoes have relatively small bud-eye characteristics [49], and more samples are beneficial to training a better DCNN model.
2.2.2. Image Data Collection
To increase the quality and diversity of potato images, we utilized an industrial camera (model Basler Scout scA1390-17fc made by Basler AG at Ahrensburg, Germany). The camera has a SONY ICX285 CCD sensor and operates at 17 frames per second (FPS) with global shutter, generating JPEG images with a resolution of 1392 × 1040. Images were taken at different sites with different angles. Figure 2 displays some images from the dataset. It is noted that the images have different backgrounds, which increases the diversity of the dataset and allows deep learning models to learn more patterns to locate and classify potatoes. Photos of the normal potatoes were taken on the same day of purchase. We then created a group of scratched potatoes and took photos on the second day of purchase. Last, the photos for the sprouted potatoes were taken after 20 days since purchase.
Training a DCNN model from scratch requires a large amount of annotated data. We took advantage of transfer learning, which takes a pretrained model on the COCO object detection dataset [50] and fine-tunes the model on the target dataset. As the pretrained model can capture numerous generic object features such as shape, color, and texture, we can further train it on our dataset to feed it with more domain-specific features. Transfer learning performs exceptionally well on a small and medium-sized dataset. To this end, we created a small dataset and trained a well-performing DCNN model. In all, we gathered a total of 2770 images, which were divided into training and test sets in the ratio of 3:1. Table 2 displays the basic information of the dataset.
2.2.3. Out-of-Sample Test Set
To further validate the robustness and generalization ability of the DCNN models, we created an OOS test set using a total of 642 potato samples purchased from a different local food market. We followed the steps similar to the ones used for the first dataset and eventually obtained 214 samples per category. We set up a real test environment to validate the models in three scenarios. For each scenario, we used an industrial camera to take images that were sent to the model for real-time detection.
- Scenario one. We took one image per sample at different sites within the campus, with the camera directly facing down to the potato sample, creating 214 sample images per category.
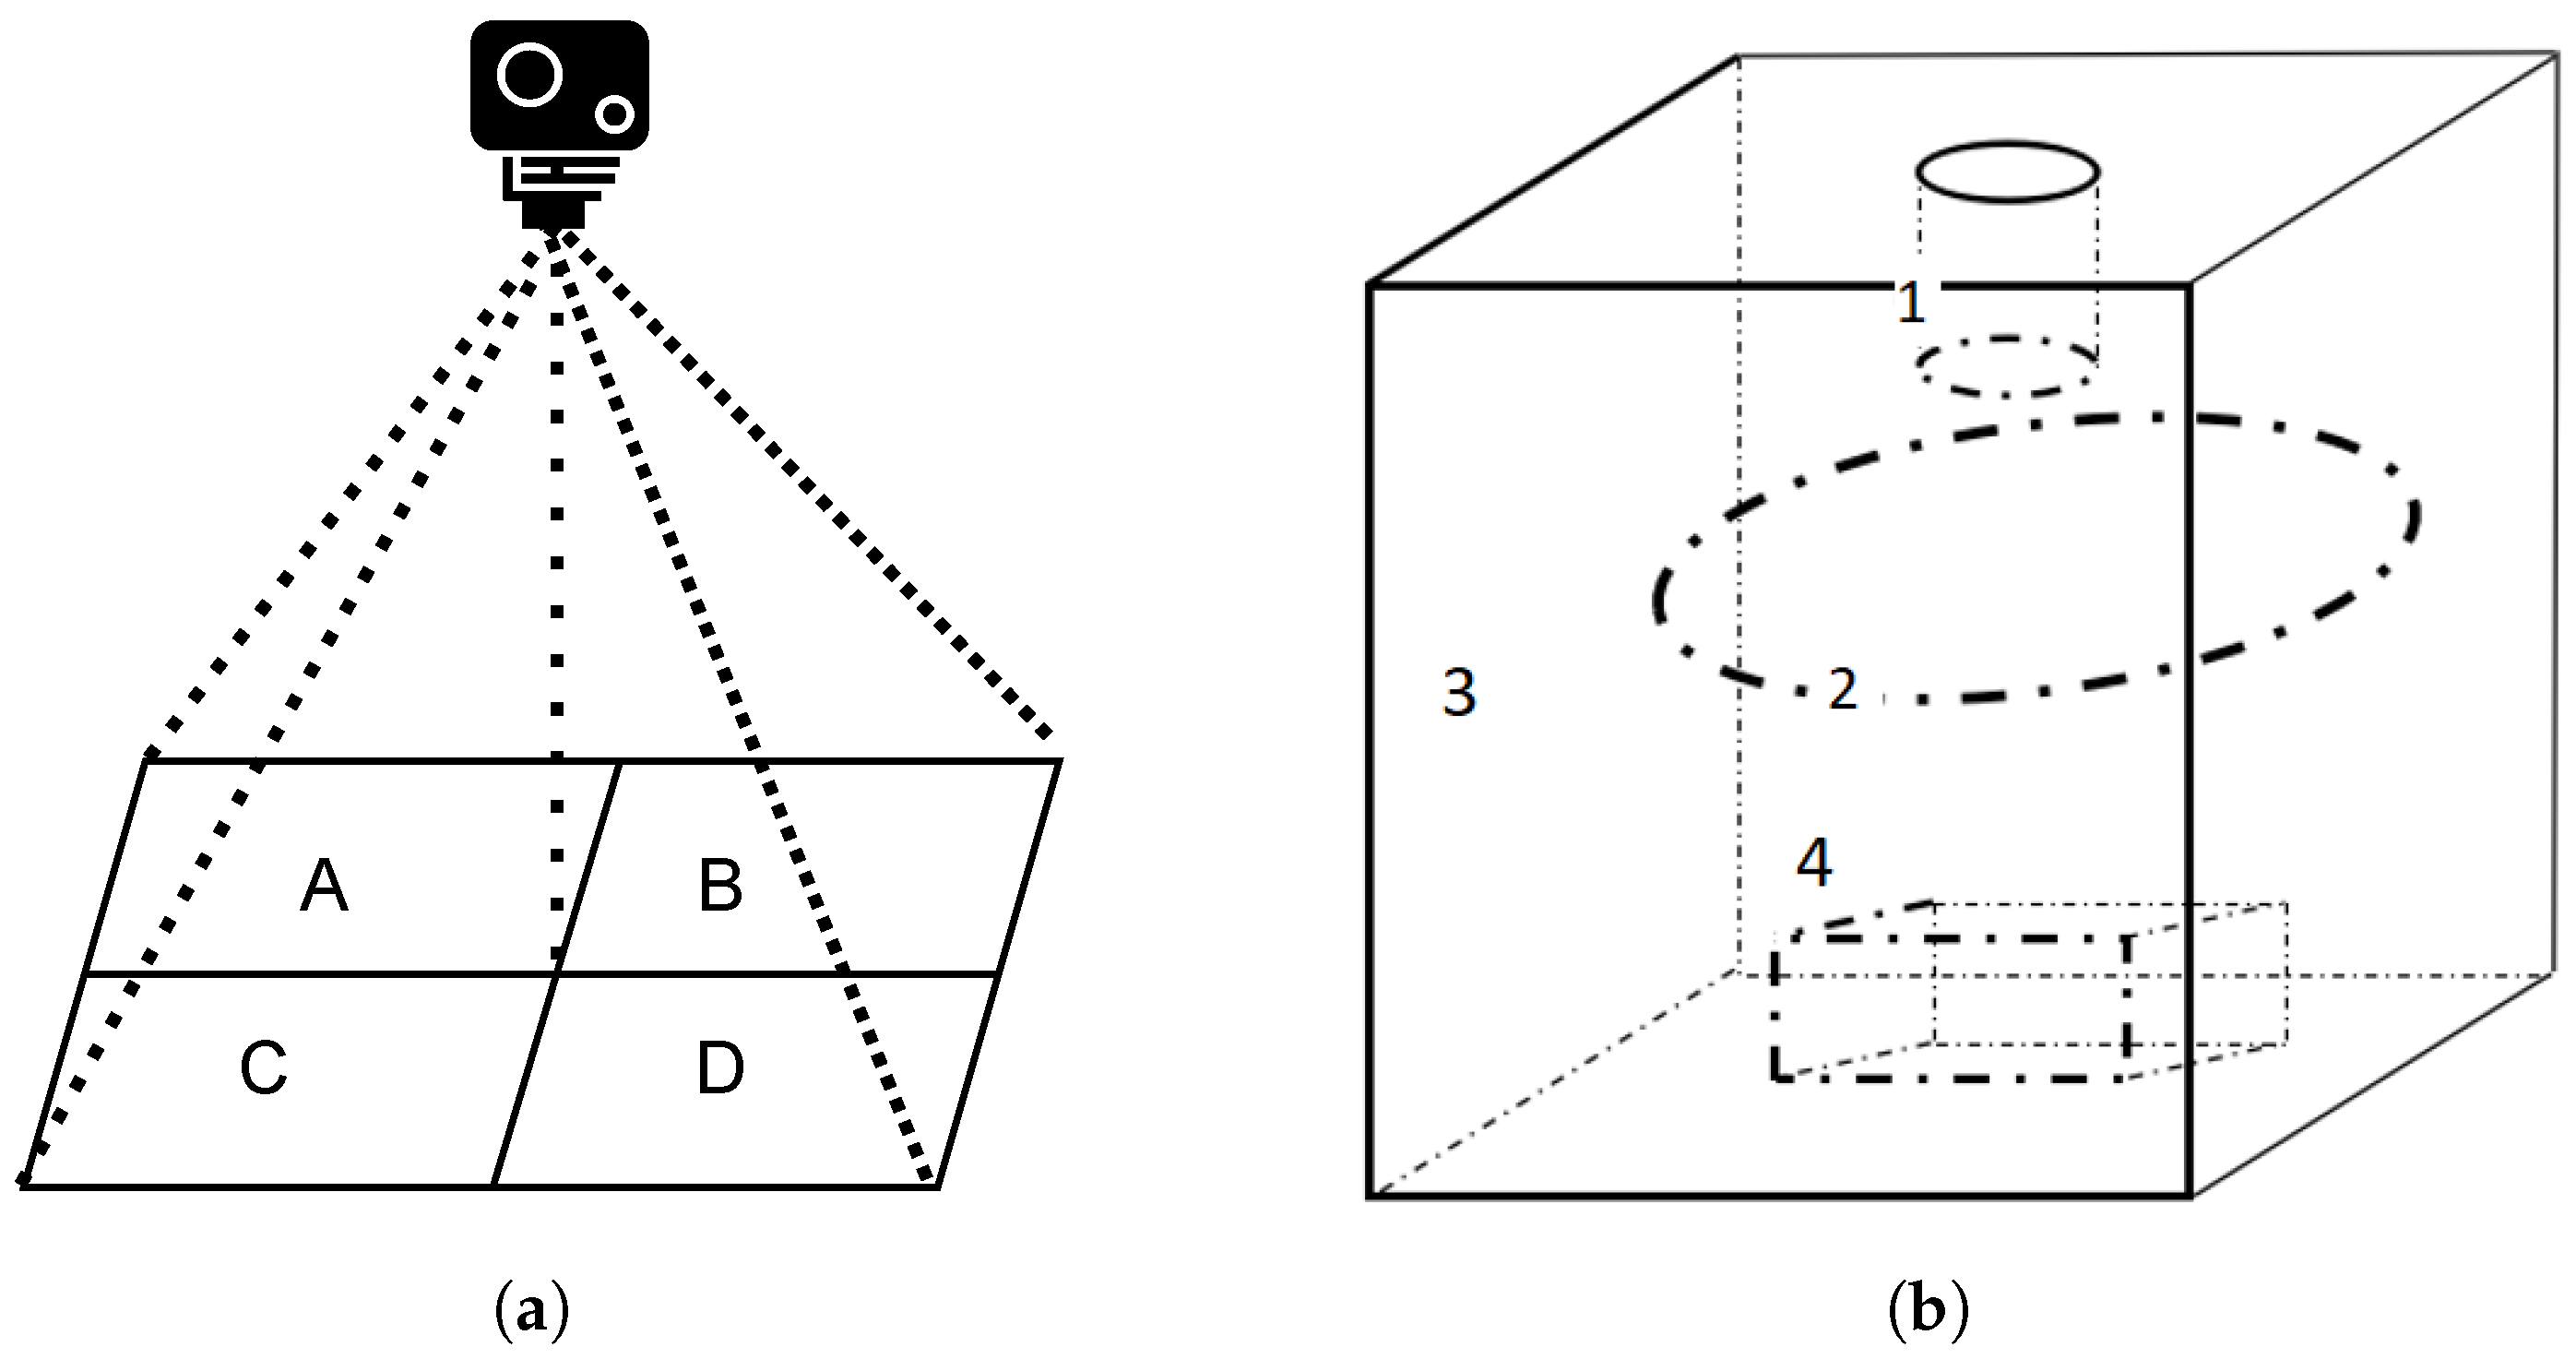
- Scenario two. This experiment was conducted indoor. We set up a clean desktop. The camera was placed 30 cm above the desktop. Taking the point where the camera was facing the desktop as the center position, we divided the shooting range equally into four areas A, B, C, and D, as shown in Figure 3a. The potatoes were put into A, B, C, and D areas in turn for testing. Scenario two also created 214 × 4 sample images per category.
- Scenario three. Our last experiment aims to study the impact of different light intensities on model performance. We moved the test platform into a closed dark box, within which the light intensity can be changed by a ring-shaped adjustable light source, as shown in Figure 3b. The adjustable light source has four levels of brightness. At each brightness level, we placed a potato sample on the platform with the feature parts (if any) of the potato facing up to the camera. We obtained 214 × 4 images for each category.
2.2.4. Data Labeling
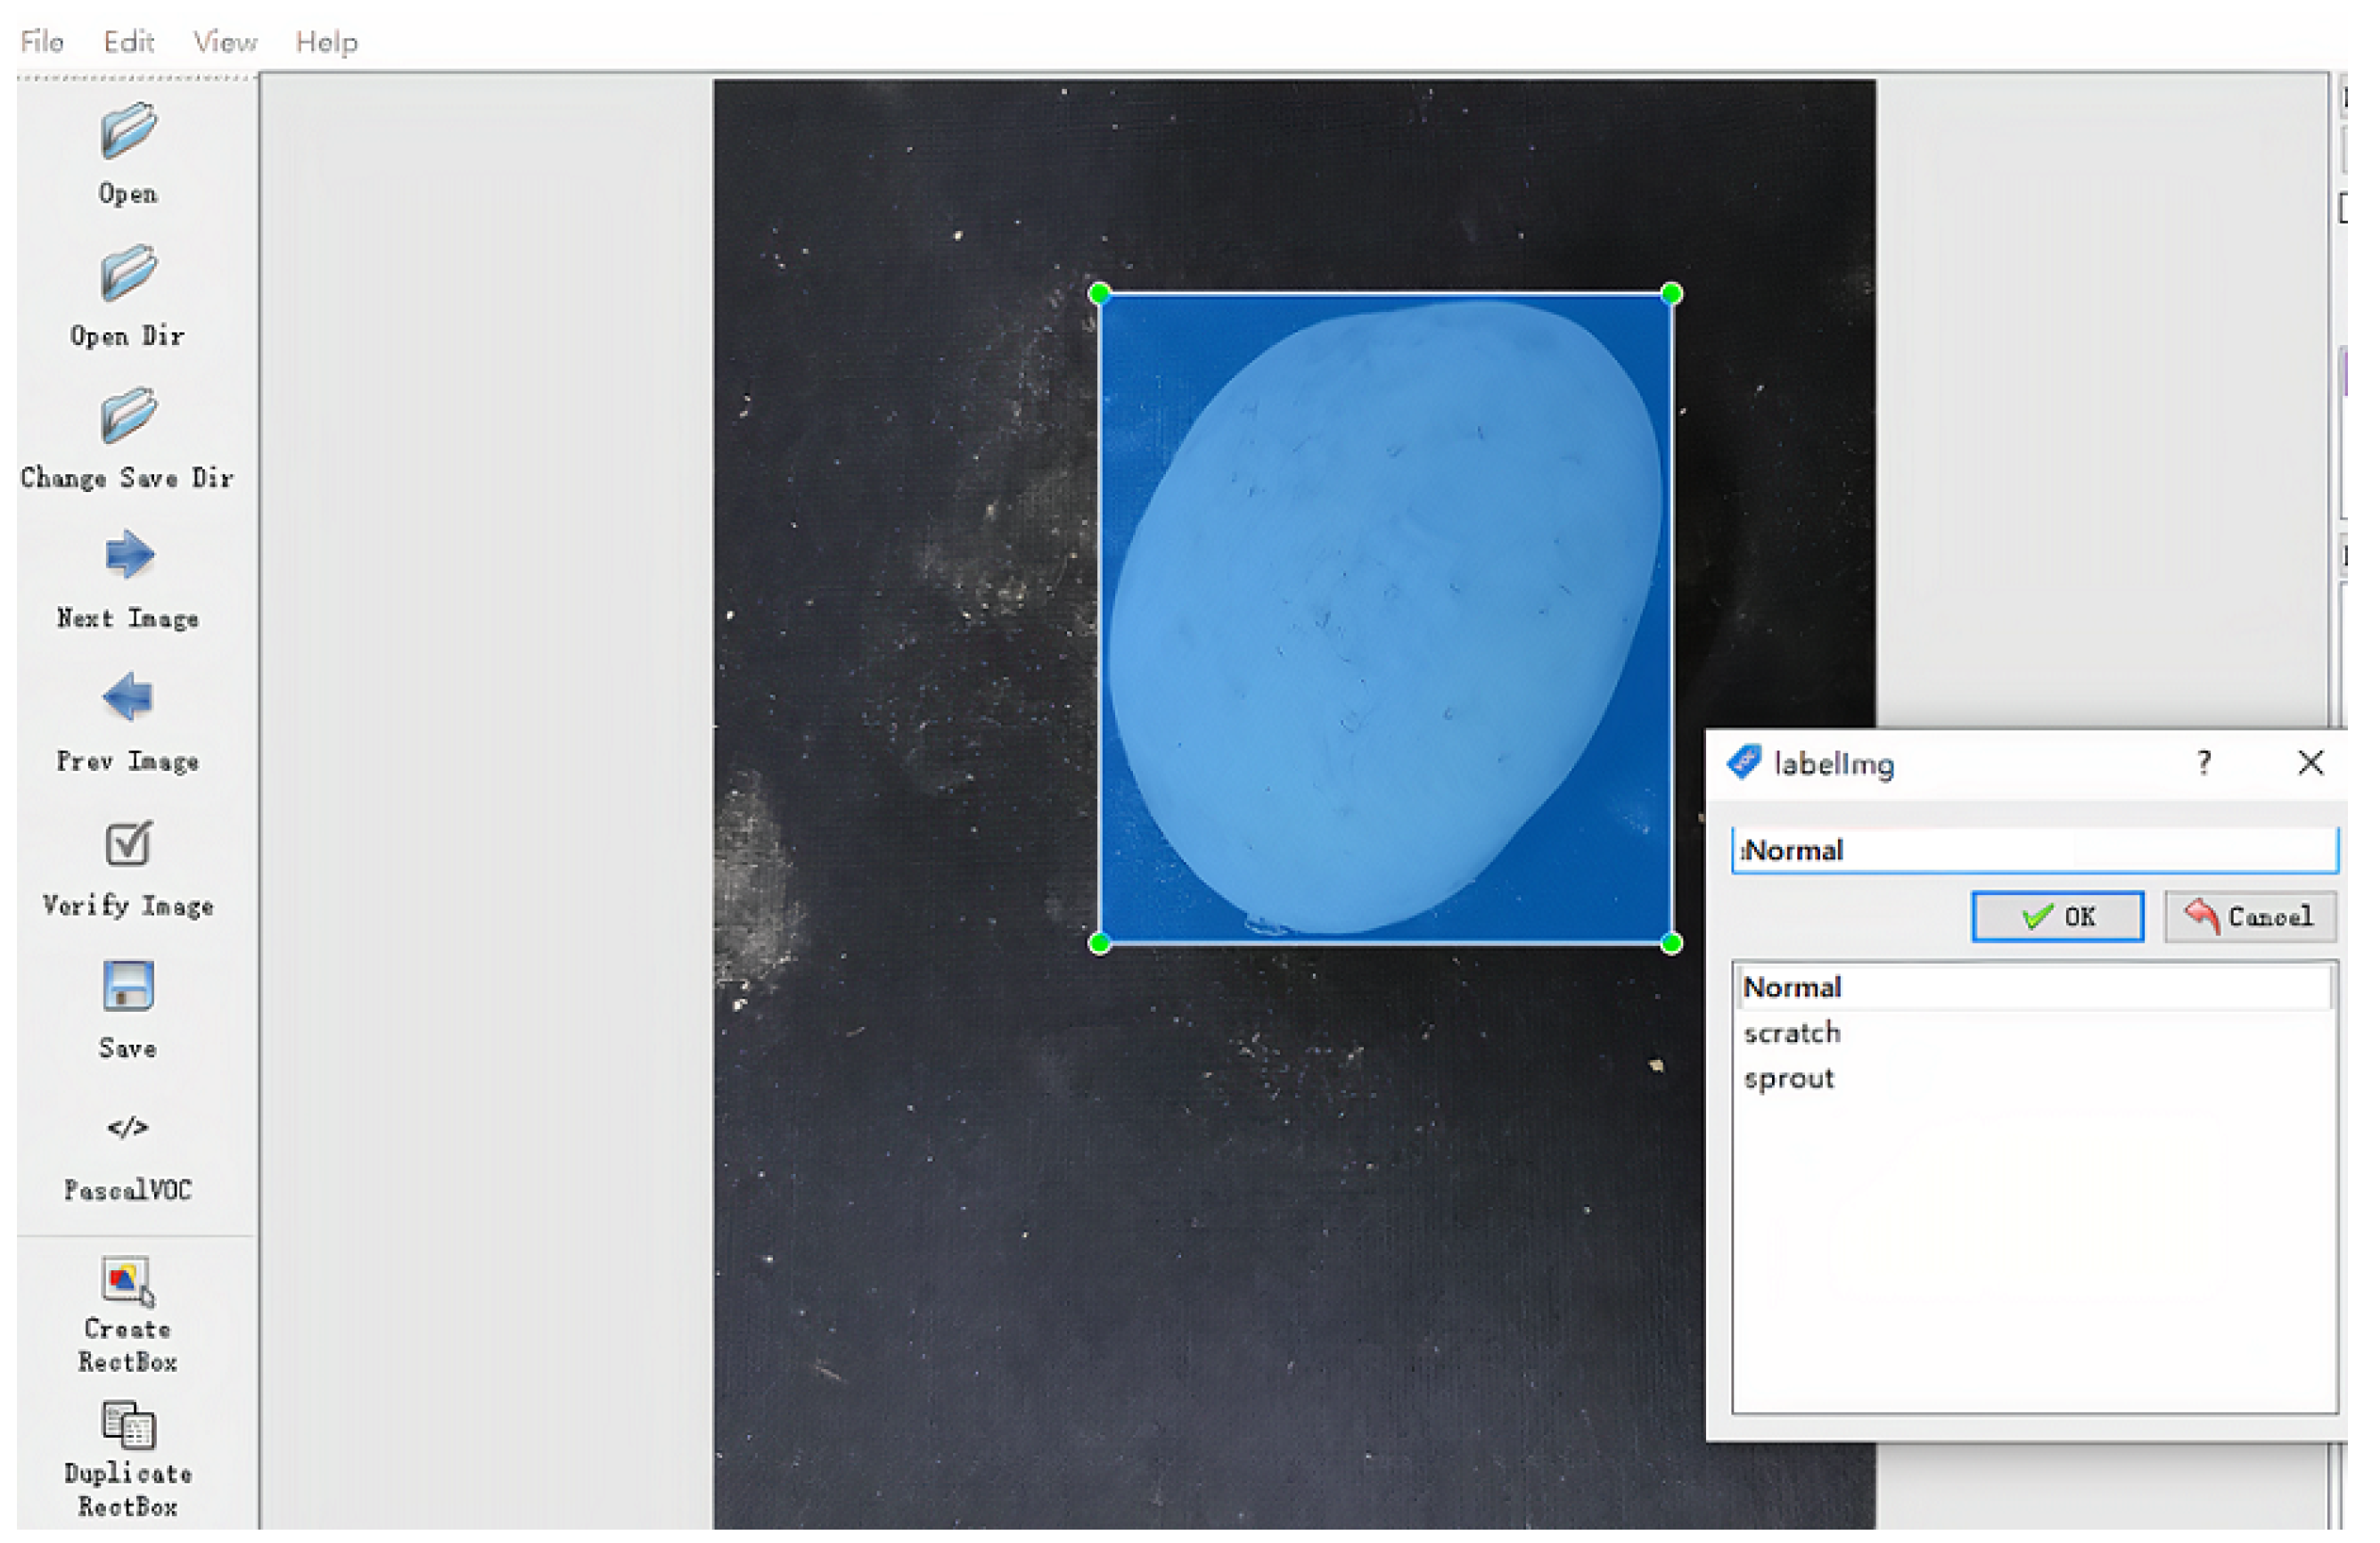
To train a supervised DCNN model, we need to first manually label each image in the dataset to indicate its category. In particular, we employed a tool called LabelImg, which allows one to draw a bounding box around a potato object in an image and mark its category. As shown in Figure 4, the blue rectangle is the bounding box enclosing a normal potato object. After the labeling, each image comes with a file that stores the coordinates of the bounding box and the potato’s category.
2.3. DCNN Models for Object Detection
2.3.1. Model 1: SSD Inception V2
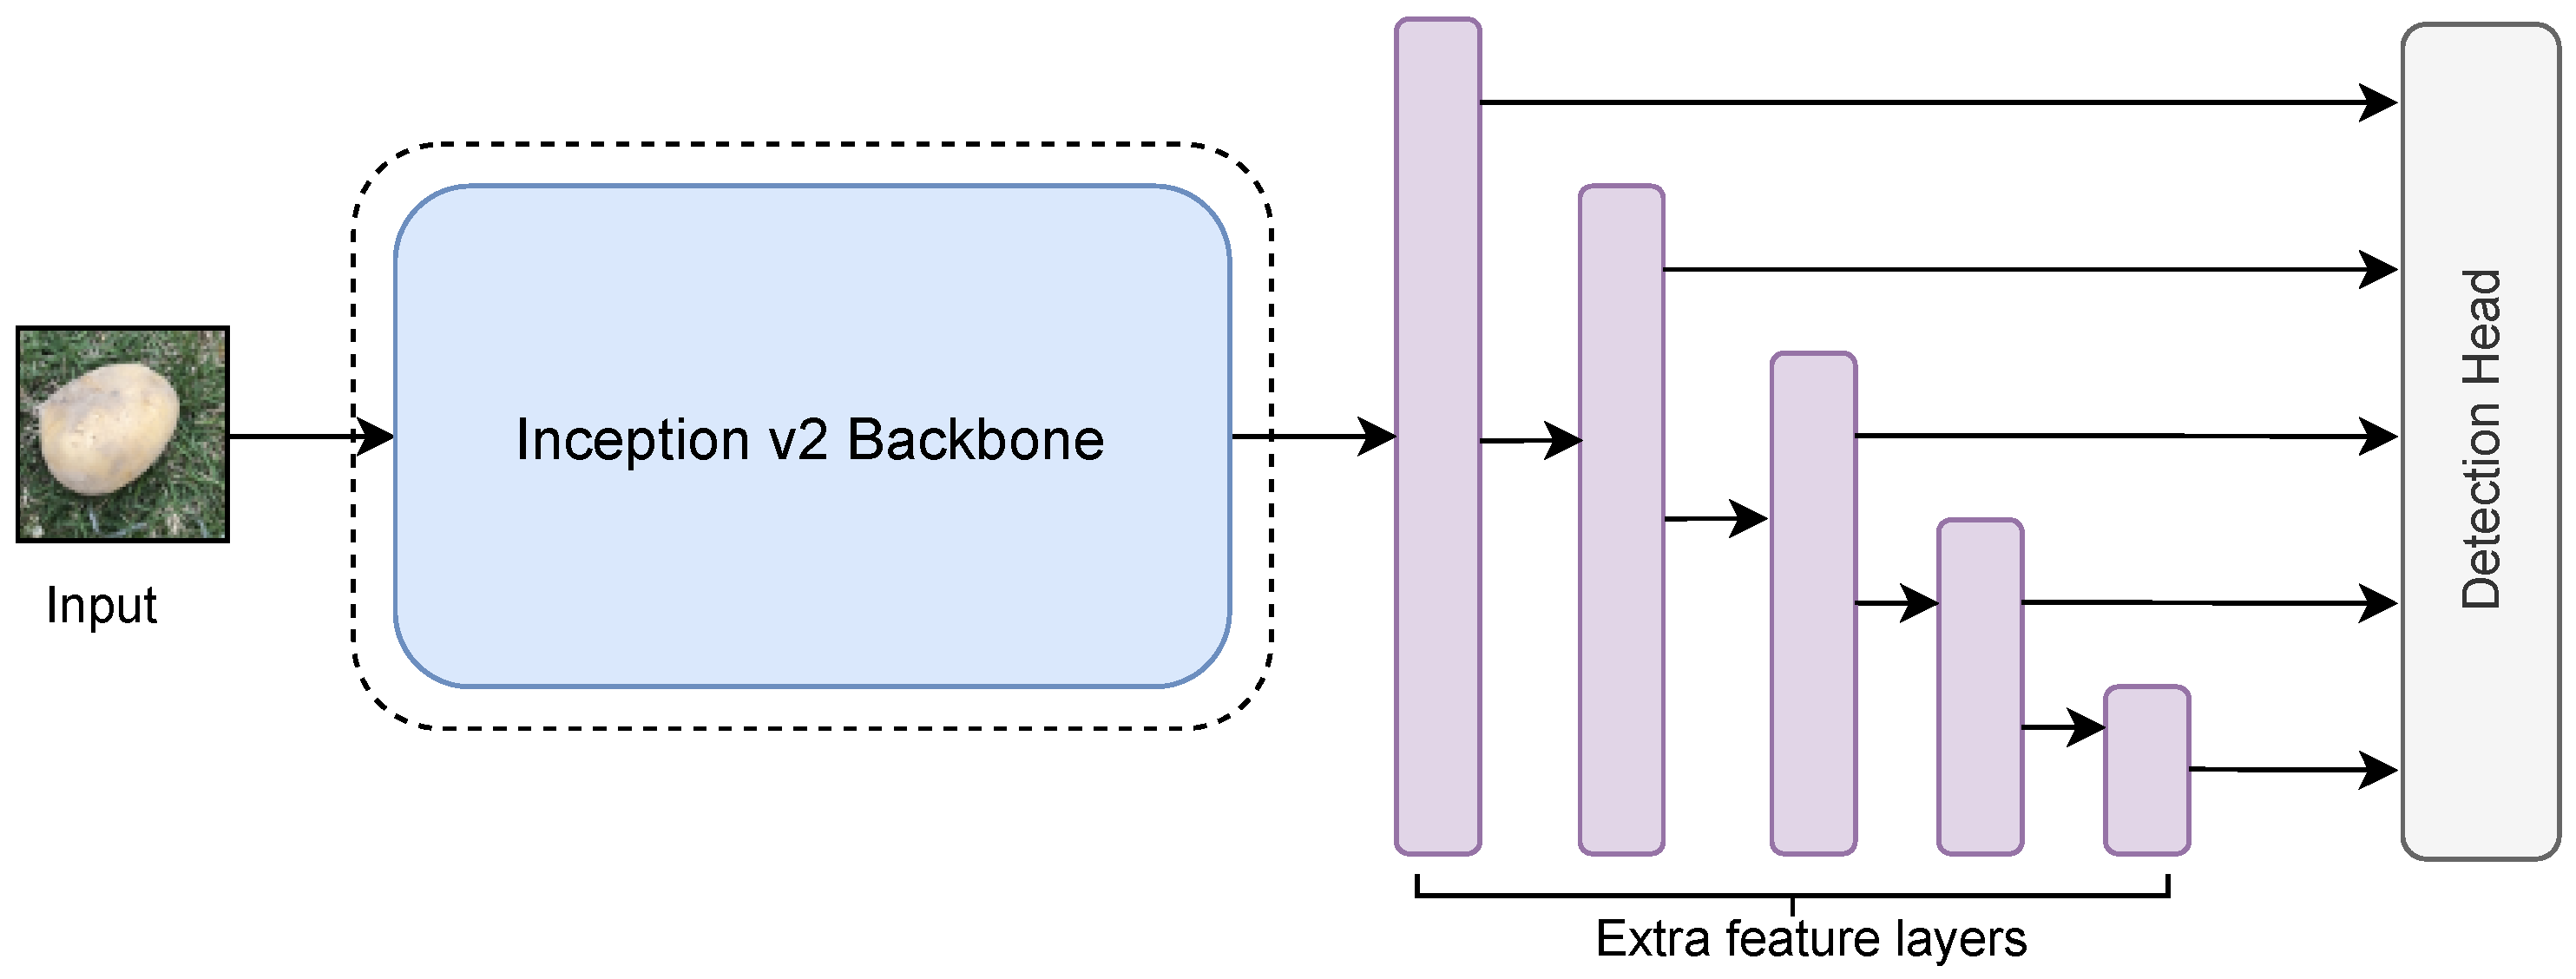
Figure 5 shows a simplified neural architecture of SSD Inception V2. The SSD algorithm is a single-stage detection model that allows object localization and classification to be done in a single forward pass of the neural network. The vanilla architecture of SSD uses VGG-16 [51] as the backbone network to extract features, with a set of convolutional layers added after the backbone to perform feature extraction at multiple scales, which enables the model to discover more distinguishable patterns at different granularities. Moreover, to ensure the speed and accuracy of target detection, the output space of the bounding box is discretized into a series of default boxes with different aspect ratios, and the boxes can be adjusted during training to better match the size and shape of the ground truth object, while the prediction results on multiple feature maps of different resolutions are combined to extract feature maps of different scales for better detection.
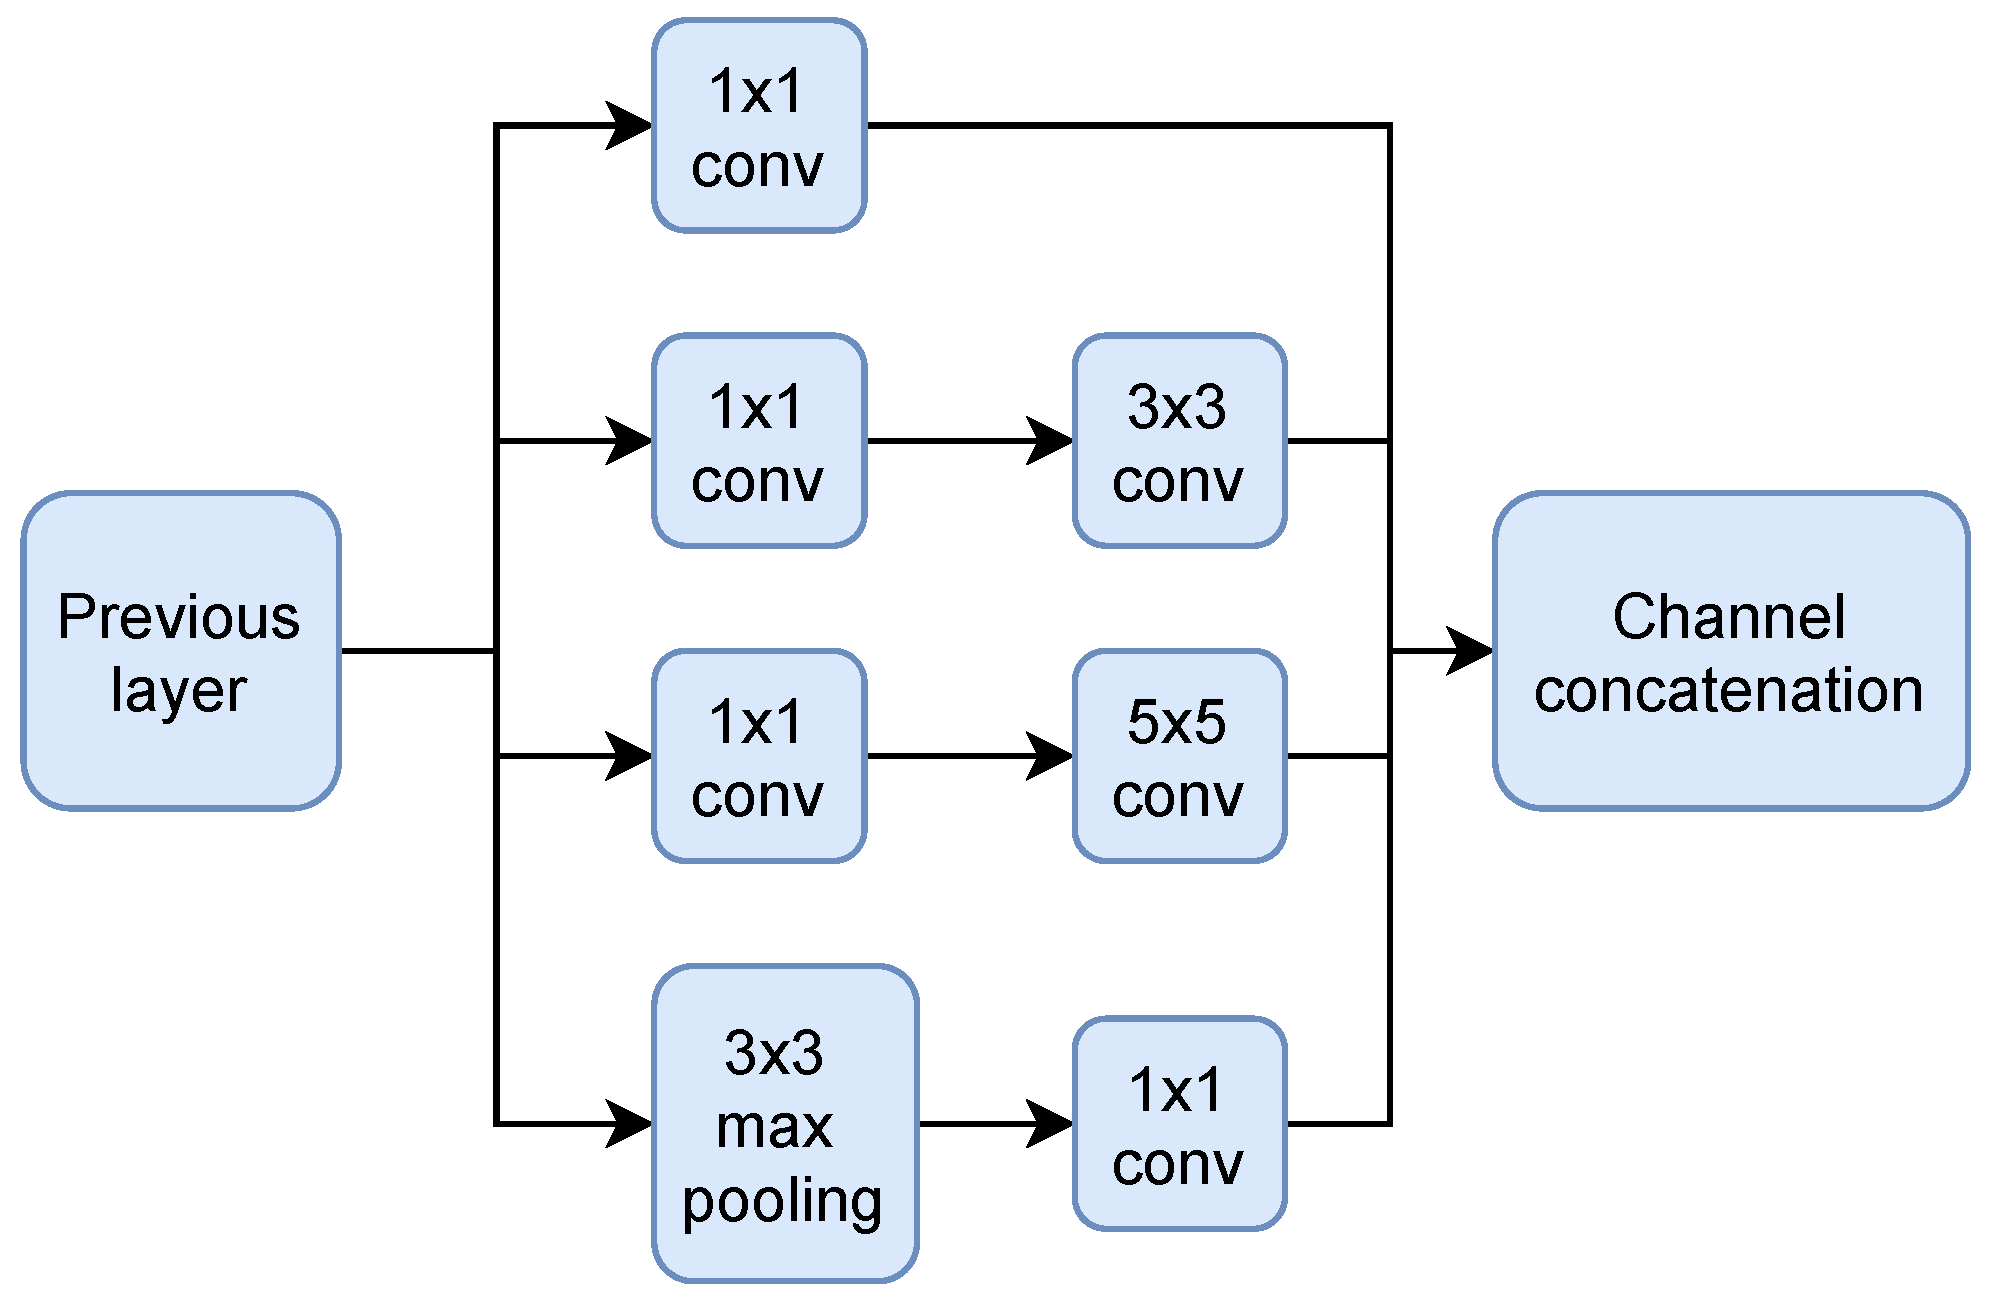
Our study utilized the SSD Inception V2 model, which replaces VGG16 with the Inception V2 neural structure [52] that splits the large convolutional kernel into several small convolutional kernels, and introduces asymmetric convolution to reduce the number of parameters and mitigate overfitting. As shown in Figure 6, an inception module performs multiple convolutional or pooling operations on the input image in parallel and stitches all the results into a deep feature map. It uses different filters to perform convolution operations on the input to obtain different information about the input image. Processing these operations in parallel and combining all the feature maps would result in a better image representation. Inception V2 also uses batch normalization to speed up training while removing dropout and mitigating L2 regularization.
2.3.2. Model 2: Faster RCNN ResNet101
Regions with CNN features (RCNN), proposed by Girshick et al. [53], work by performing a selective search that extracts 2000 regions, i.e., region proposals (RP), from an image. Each RP is then warped and passed through a CNN to produce a feature vector, which acts as input of a support vector machine (SVM) for the final classification. Despite its inspiring idea, RCNN is not practical for real-time systems due to its low detection speed, mainly caused by the CNN operations individually done on the 2000 image patches. To speed up RCNN, Fast RCNN, proposed by the same group [54], works by passing an entire image through a CNN to generate a feature map, from which RPs are located and warped to make a feature vector. Fast RCNN greatly reduces the time consumed by the CNN as only one image passes through it, rather than 2000 patches.
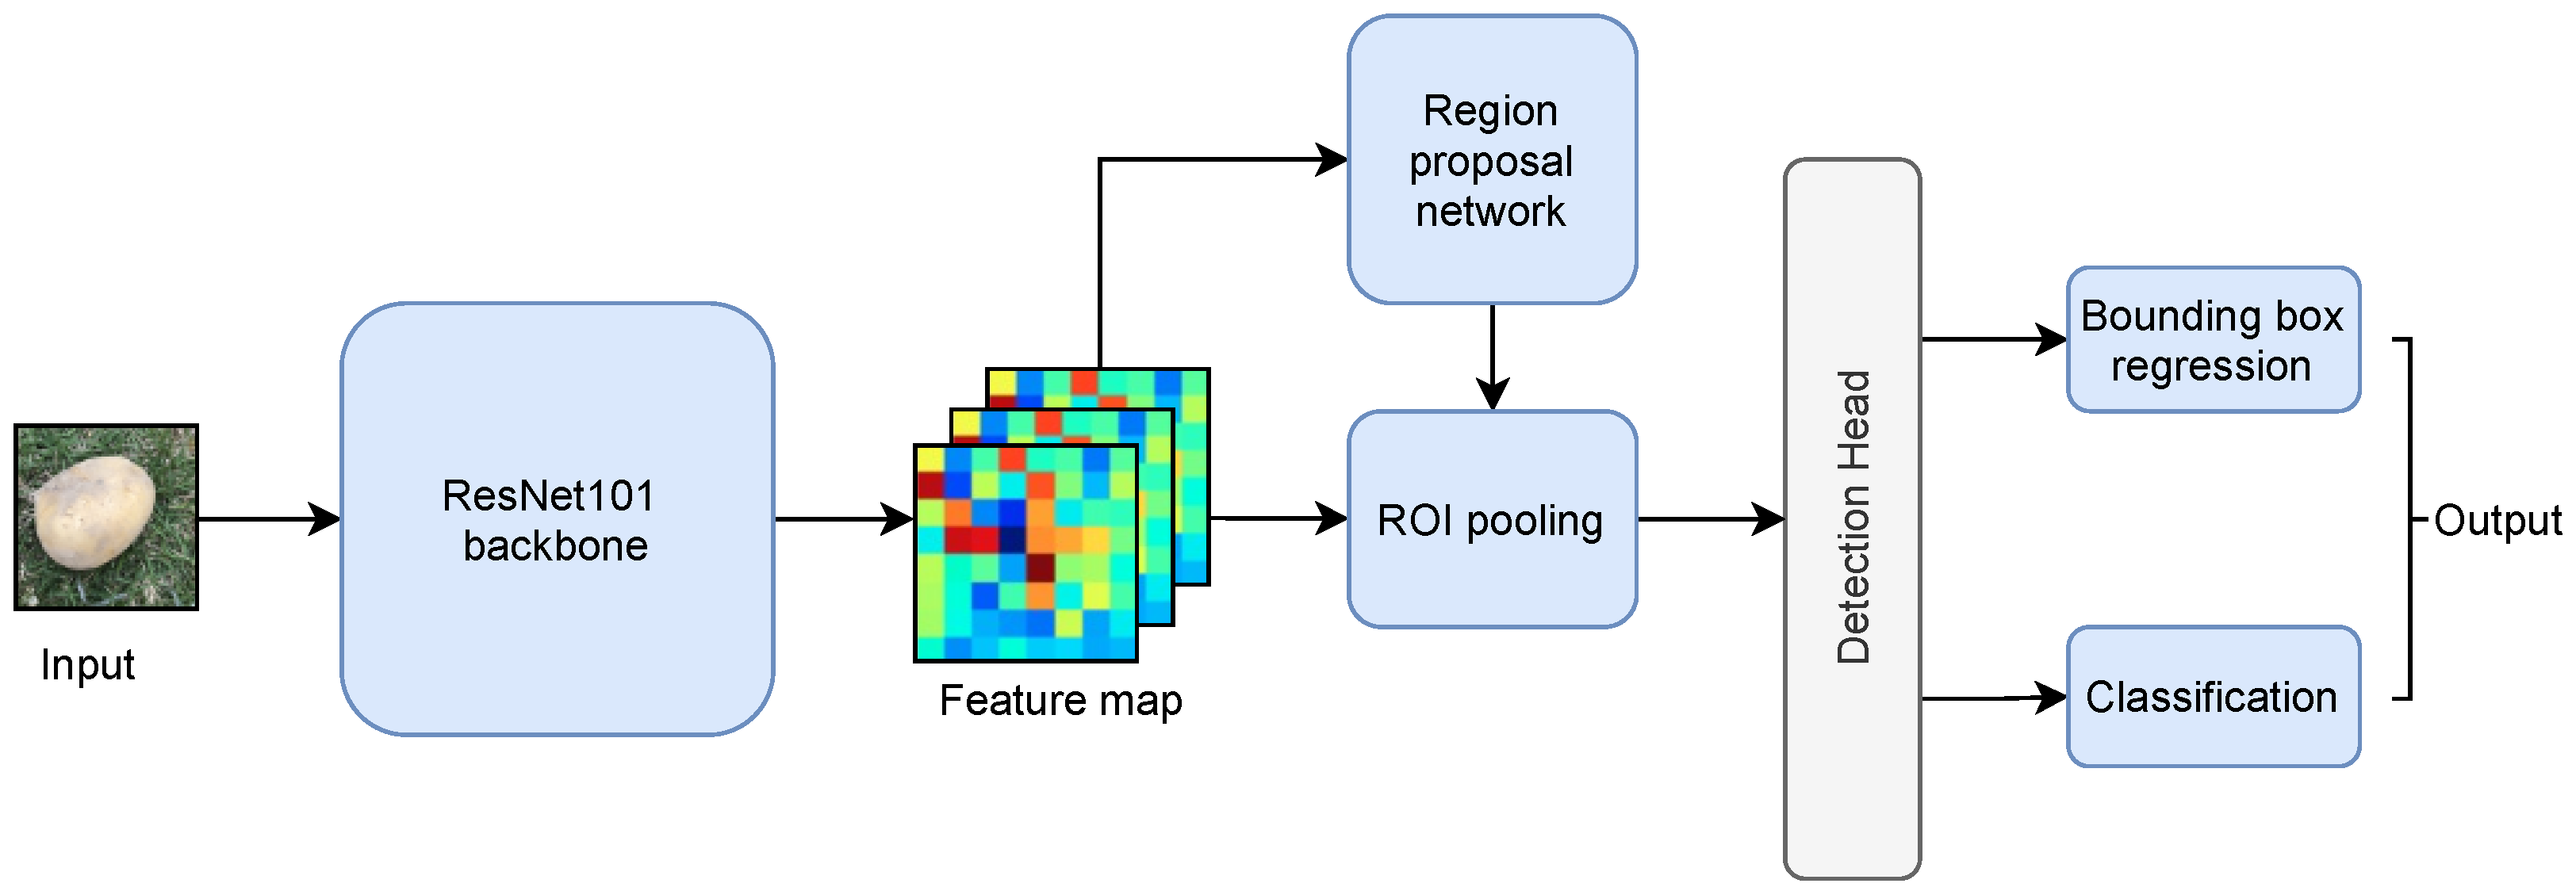
Despite the improvement brought by Fast RCNN, it still adopts a selective search process to identify RPs, which is inefficient. Ren et al. [55] develop Faster RCNN that adopts a Region Proposal Network (RPN), which can learn where and how to place RPs through training. Specifically, the input of RPN is an image, and the output is a collection of anchor boxes, also known as object proposals, each assigned a an objectness score. The top-N scored anchor boxes are sent to a region of interests (ROI) pooling layer to produce a feature map with proposals, which is fed into the detection head for bounding box regression and object classification.
Our study employed the Faster RCNN ResNet101 model, as shown in Figure 7, which adopts ResNet101 as the backbone network for feature extraction. In deep learning, as the network deepens, accuracy drops due to gradient dispersion. This issue is well addressed by a residual network (ResNet) [56], which allows the network to deepen as much as possible without causing gradient dispersion. A ResNet adds an identity mapping (constant mapping) that transfers the current output directly to the next layer of the network, taking a shortcut and skipping the current layer of operations. During backward propagation, the gradients of a layer are passed directly to the upper layer of the network. ResNet101 is a variant of ResNet that is 101 layers deep.
2.3.3. Model 3: RFCN ResNet101
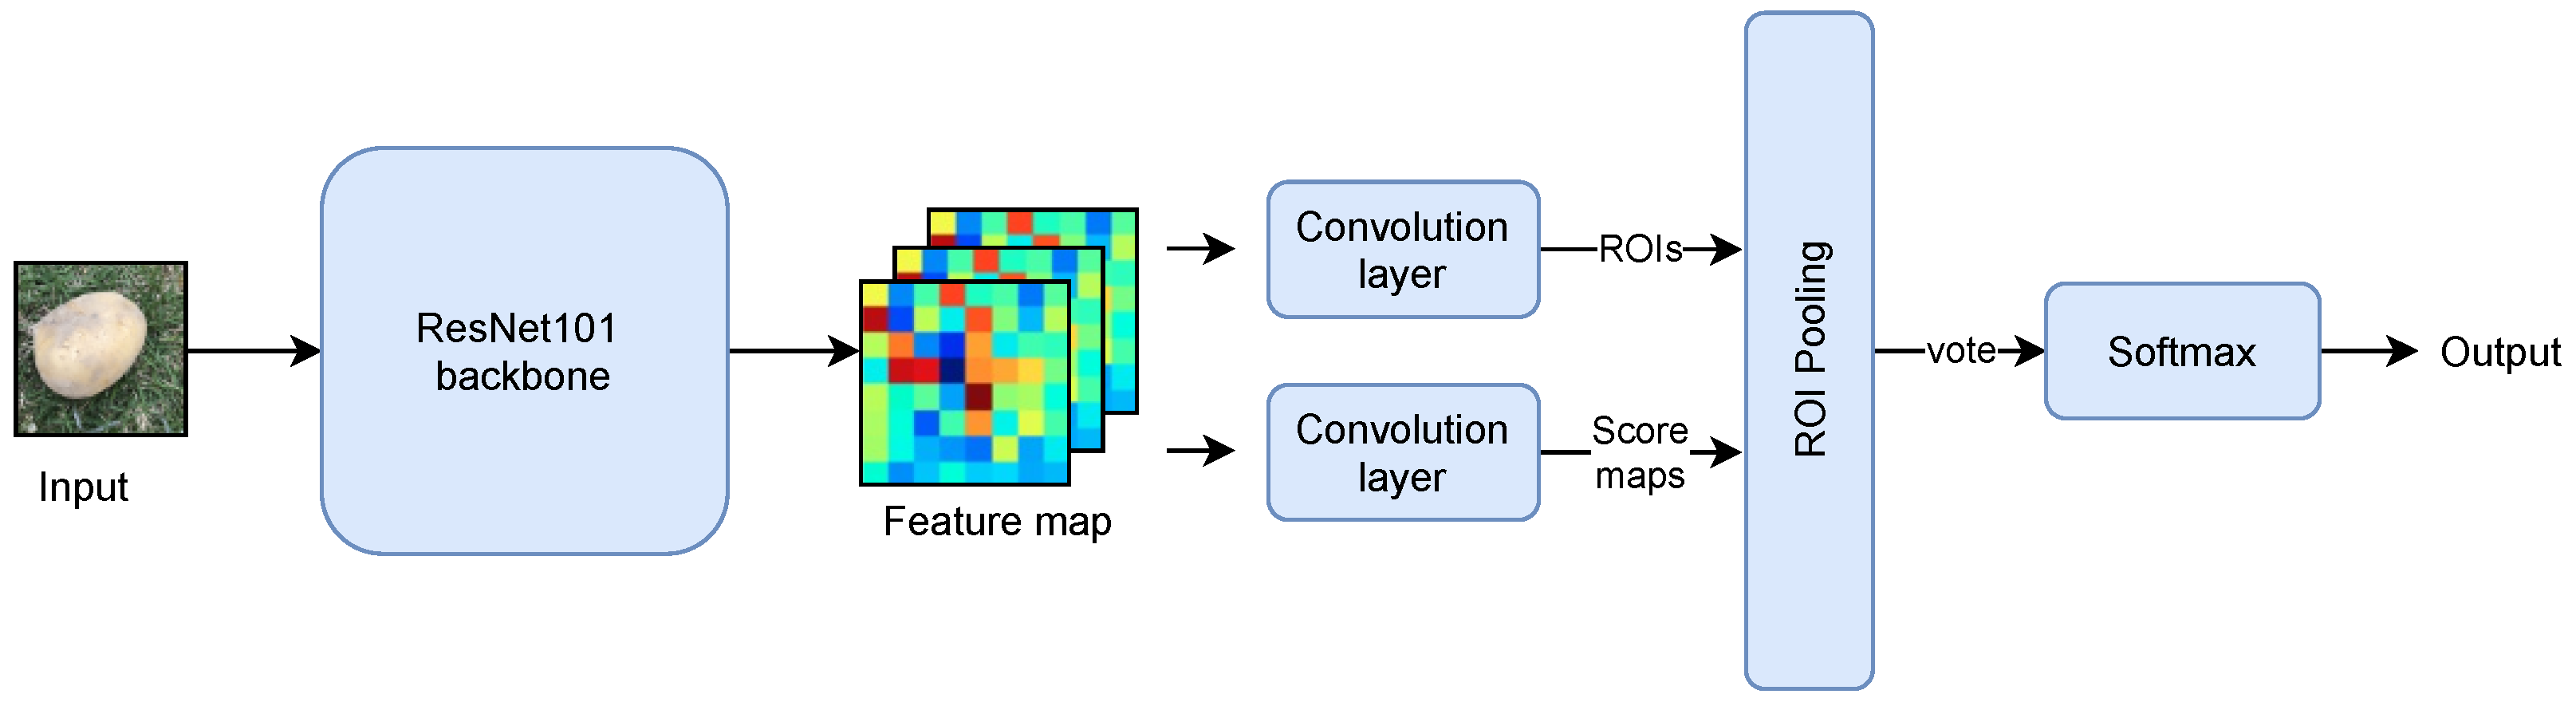
Another notable target detection model is the RFCN algorithm, which adopts the same neural structure as Faster RCNN. RFCN generates proposals through an RPN that shares previous feature maps with the detection layer. Our work utilized RFCN ResNet101 with a convolutional layer of ResNet101 as the base network structure, immediately followed by a convolutional layer to downscale and a position-sensitive convolutional layer capable of generating score maps. The following is a position-sensitive ROI pooling layer with a softmax layer to determine the type of ROI. The RFCN model framework is shown in Figure 8.
The ResNet101 used in Faster RCNN is shared in the first 91 layers, then inserted into ROI pooling, and the last ten layers are computed separately for each ROI. In contrast, RFCN ResNet101 puts all 101 layers in the front shared subnetwork, and the final convolution used for prediction is only one layer, and then ROI pooling is performed. This dramatically reduces the amount of computation. The location information is lost in ROI pooling, so the location information is added before pooling based on the concept of position-sensitive score maps, i.e., different score maps are specified to be responsible for detecting different locations of the target. After pooling, the score maps obtained from different locations can be combined to reproduce the original location information, which further improves the accuracy of RFCN in detecting targets.
2.4. Transfer Learning for Potato Surface Defect Detection
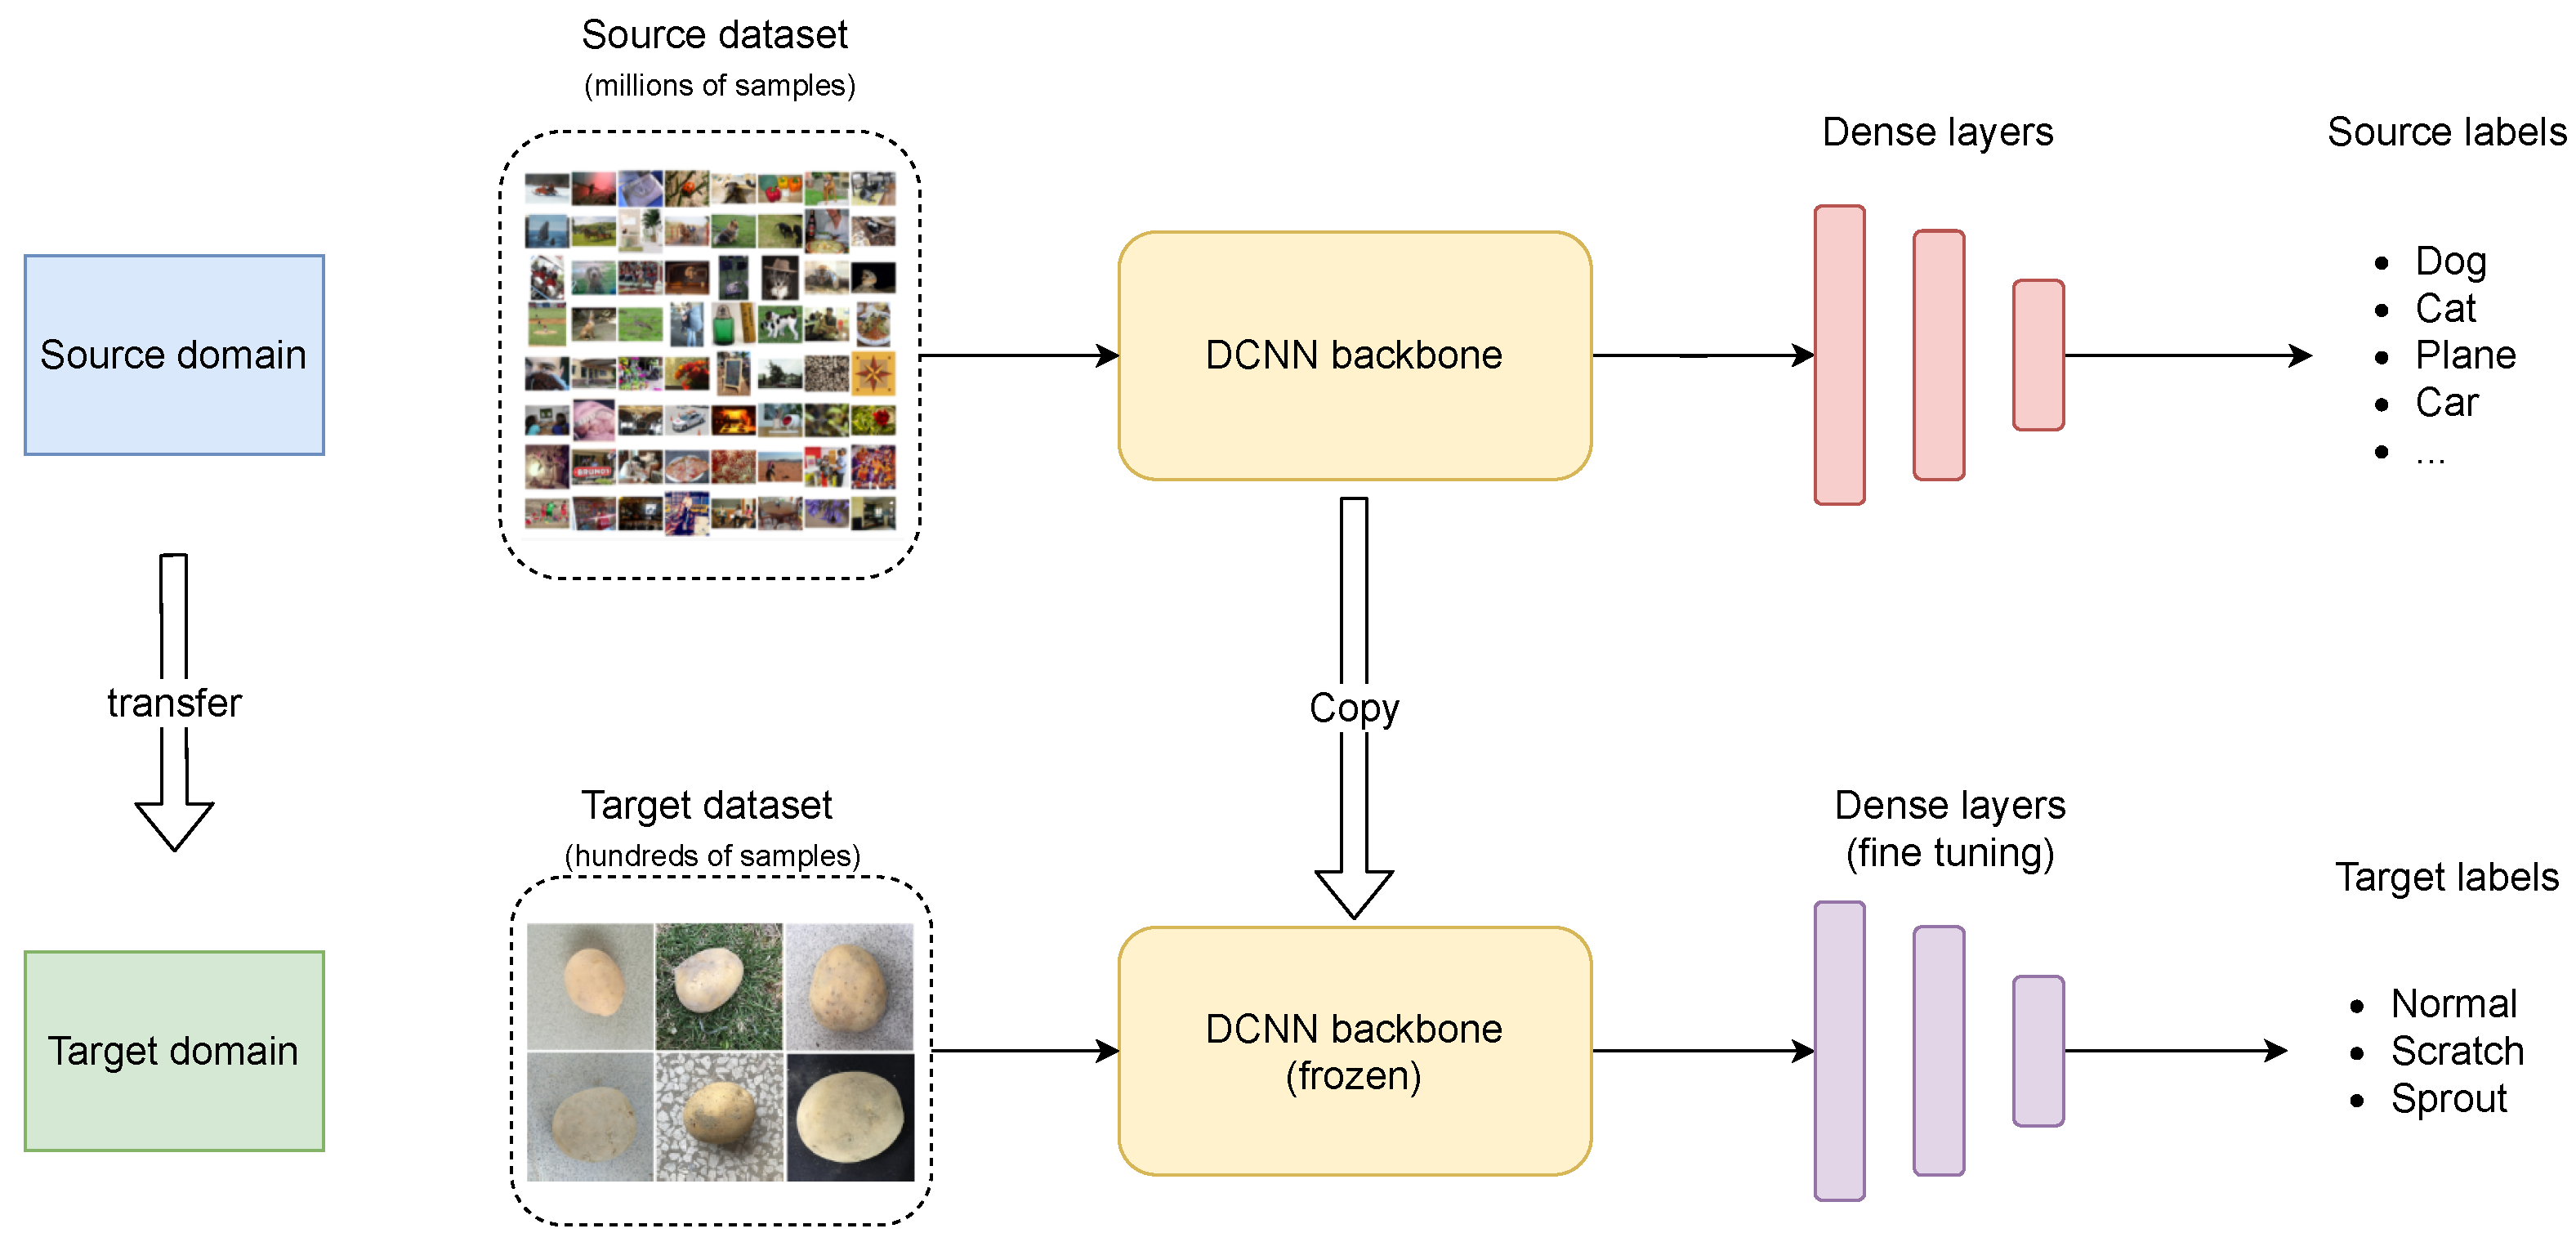
Transfer learning refers to a machine learning method where a model trained on a source dataset is reused as the starting point to train another model on a target dataset [21]. For our task, we adopt the COCO object detection dataset [50], which consists of 330 K images, 1.5 million object instances, and 80 object categories, as the source dataset. As shown in Figure 9, the trained DCNN backbone network, namely, the parameters or weights, are directly utilized for our task. As the backbone network is thoroughly trained on a large dataset, it has learned extract general object features, such as color, shape, texture, and edge [45]. To fit our objective, we choose to freeze the first T layers of the pretrained backbone, and only fine-tune the remaining layers on our dataset. This strategy is fast and effective, as demonstrated in Section 3.
2.5. Performance Metrics
To gain a comprehensive understanding of the model performance, we employed five metrics: accuracy (Acc), precision (Pre), Recall (Rec), Specificity (Spe), and the F1 score. Intuitively, Acc measures the ratio of correct predictions over the total number of predictions (see Equation (1)), Pre is the fraction of true positives (TP) among the detected positives (see Equation (2)), Rec is the fraction of TP among the correct predictions (see Equation (3)), Spe measures the fraction of negatives that are misclassified as positives (see Equation (4)), and F1 is the harmonic mean of precision and recall (see Equation (5)). As our task is a multi-class classification problem with three categories, we can use the following equations to calculate the five metrics per category and perform a micro average to obtain the overall performance.
3. Results
3.1. Experimental Setting
We conducted the experiments on a workstation equipped with an Intel Core i7-8700 CPU, a 16 GB RAM, and an Nvidia GeForce RTX 2070 GPU. To implement and train the DCNN models, we adopted Python 3.6.7 and TensorFlow r2.1.
3.2. Implementation Details
The model implementation details are provided as follows.
- SSD Inception V2. The loss function of SSD is a weighted combination of localization and confidence loss. The former is defined as the smooth L1 loss with the offset from the predicted bounding box to the ground truth bounding box, and the latter is calculated as the softmax over the confidences of multiple classes. We adopt a learning rate of 0.001, 0.9 momentum, 0.0005 weight decay, and batch size 32. The model is trained using a stochastic gradient decent (SGD) optimizer. The used model in this study is offered by supervise.ly at https://supervise.ly/explore/models/ssd-inception-v-2-coco-1861/overview (accessed on 6 February 2021).
- RFCN ResNet101. The loss function of RFCN on each RoI is the sum of cross-entropy loss and the box regression loss, which correspond to the confidence and localization loss defined in SSD, respectively. We adopt a learning rate of 0.001, a weight decay of 0.0005, and a momentum of 0.9, with an Adam optimizer, also used by the original authors of RFCN in [57]. In addition, the batch size is 32. The released model used in this study is at https://supervise.ly/explore/models/rfcn-res-net-101-coco-1862/overview (accessed on 6 February 2021).
- Faster RCNN ResNet101. Faster RCNN uses the same loss function as SSD and RFCN. For training, we adopt similar settings as [55], with a learning rate of 0.003, a batch size of 16, a momentum of 0.9, a weight decay of 0.0005, and an optimizer of SGD. We used the released model at https://supervise.ly/explore/models/faster-r-cnn-res-net-101-coco-1866/overview (accessed on 6 February 2021) for our experiment.
3.3. Model Evaluation and Selection
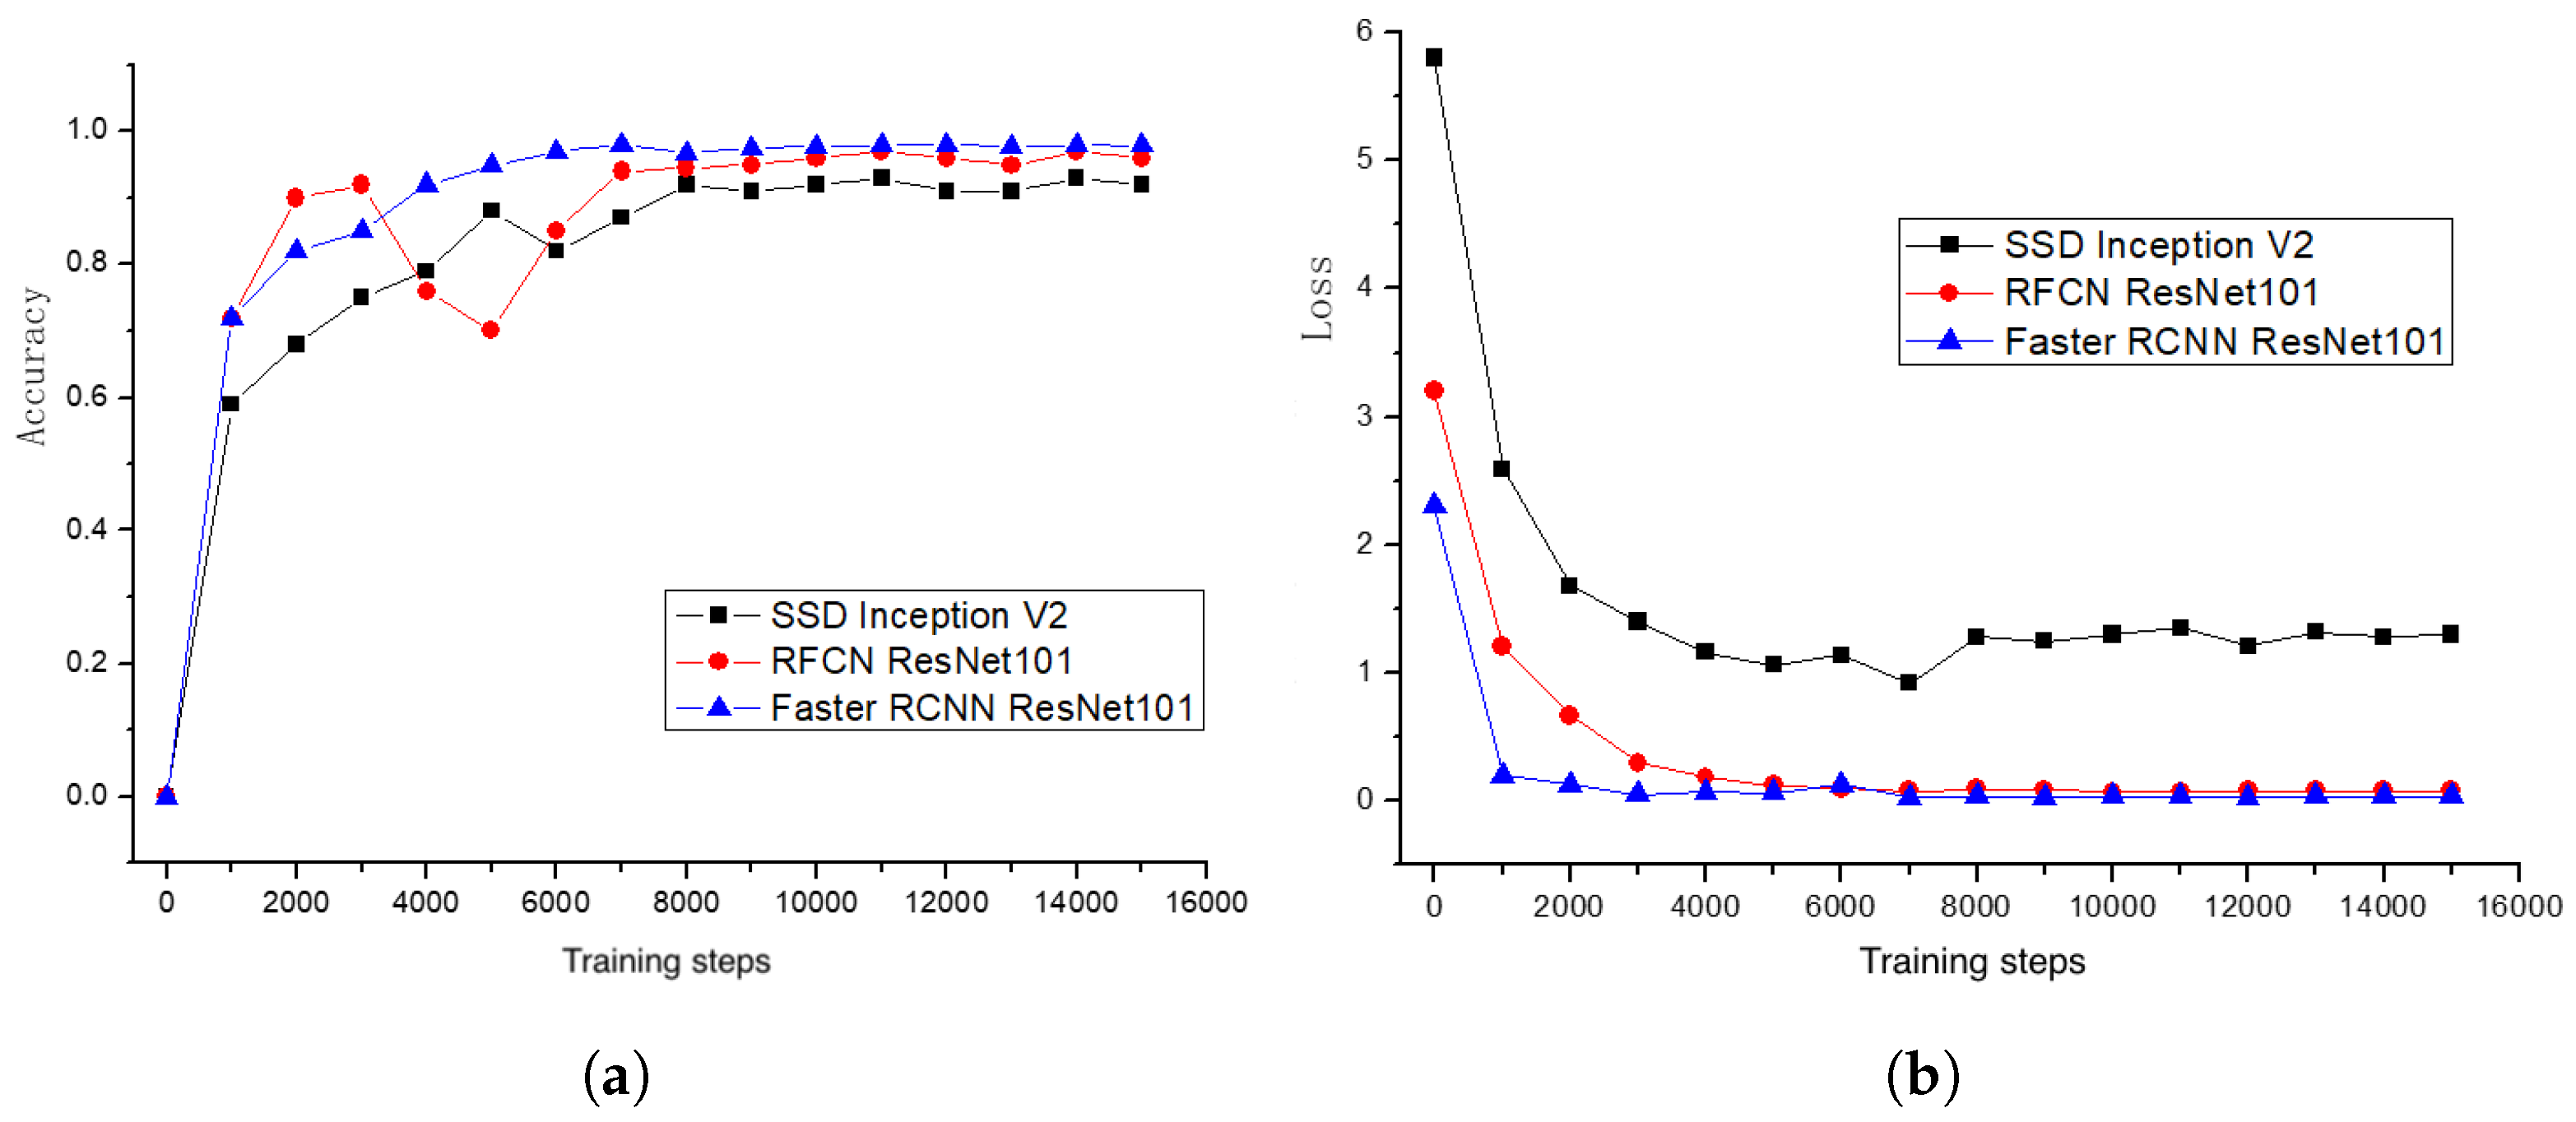
The primary performance metric used in this study is Acc, which is adequate because the three categories in our dataset are relatively balanced. In addition, we used the model loss to monitor the training progress as it serves an effective indicator of model convergence.
Figure 10 shows the results that plot accuracy vs. training steps and loss vs. training steps. In Figure 10b, we observe that the loss gradually drops and eventually converges as the step number increases and reaches 15,000. All three models present a quick convergence with a low loss, indicating the models’ ability to learn rich features to distinguish potatoes of categories. In particular, both RFCN ResNet101 and Faster RCNN ResNet101 outperform SSD Inception V2 with a loss close to zero. Performance-wise, as the number of steps increased, the test accuracy of all three models reached more than 90%, and the final accuracy of SSD Inception V2, RFCN ResNet101, and Faster RCNN ResNet101 network models was 92.5%, 95.6%, and 98.7%, respectively.
We plot the confusion matrices of the three models in Figure 11, from which we obtain a better understanding about the correct predictions and misclassifications. Taking SSD Inception V2 (the left matrix) as an example, 188 out of 203 normal samples were correctly predicted, nine were misclassified as scratch, and six were misclassified as sprout. After checking, we found that these errors are caused by the mud, spot, or sprout eyes on the potato surface, which confused the model. Furthermore, 195 out of 210 scratch samples were correctly predicted, nine were predicted as normal, and six were predicted as sprout; an error analysis reveals that the potatoes with superficial scratches might be predicted as normal, and the ones with deep and large scratches could be predicted as sprout. As for the sprouted samples, 257 were correctly predicted, eight were misclassified as normal, and fourteen were predicted as scratch; our error analysis shows that the model tends to predict the potatoes with small sprouts or the ones with large but hidden sprouts due to camera shooting anger. RFCN ResNet101 presented the best performance, also reflected in the confusion matrix, in which only nine out of 693 potatoes were misclassified.
In addition, we report the Acc, Pre, Rec, Spe, and F1 in Table 3. It is observed that the variance across metrics is small for all three models, meaning that (1) classes in the dataset are relatively balanced so that models can gain about equal amount of knowledge from each category during training, and (2) the hard cases were not many. Furthermore, the inter-class variance is slightly larger. Taking SSD Inception V2 as an example, the Pre for the three categories were 91.7%, 89.4%, and 95.5%, respectively. As a higher Pre indicates less false alarms, and vice versa, we find that the false alarm rate for the scratch samples is the highest among the three classes, and that the false alarm rate for the sprouted samples is the lowest.
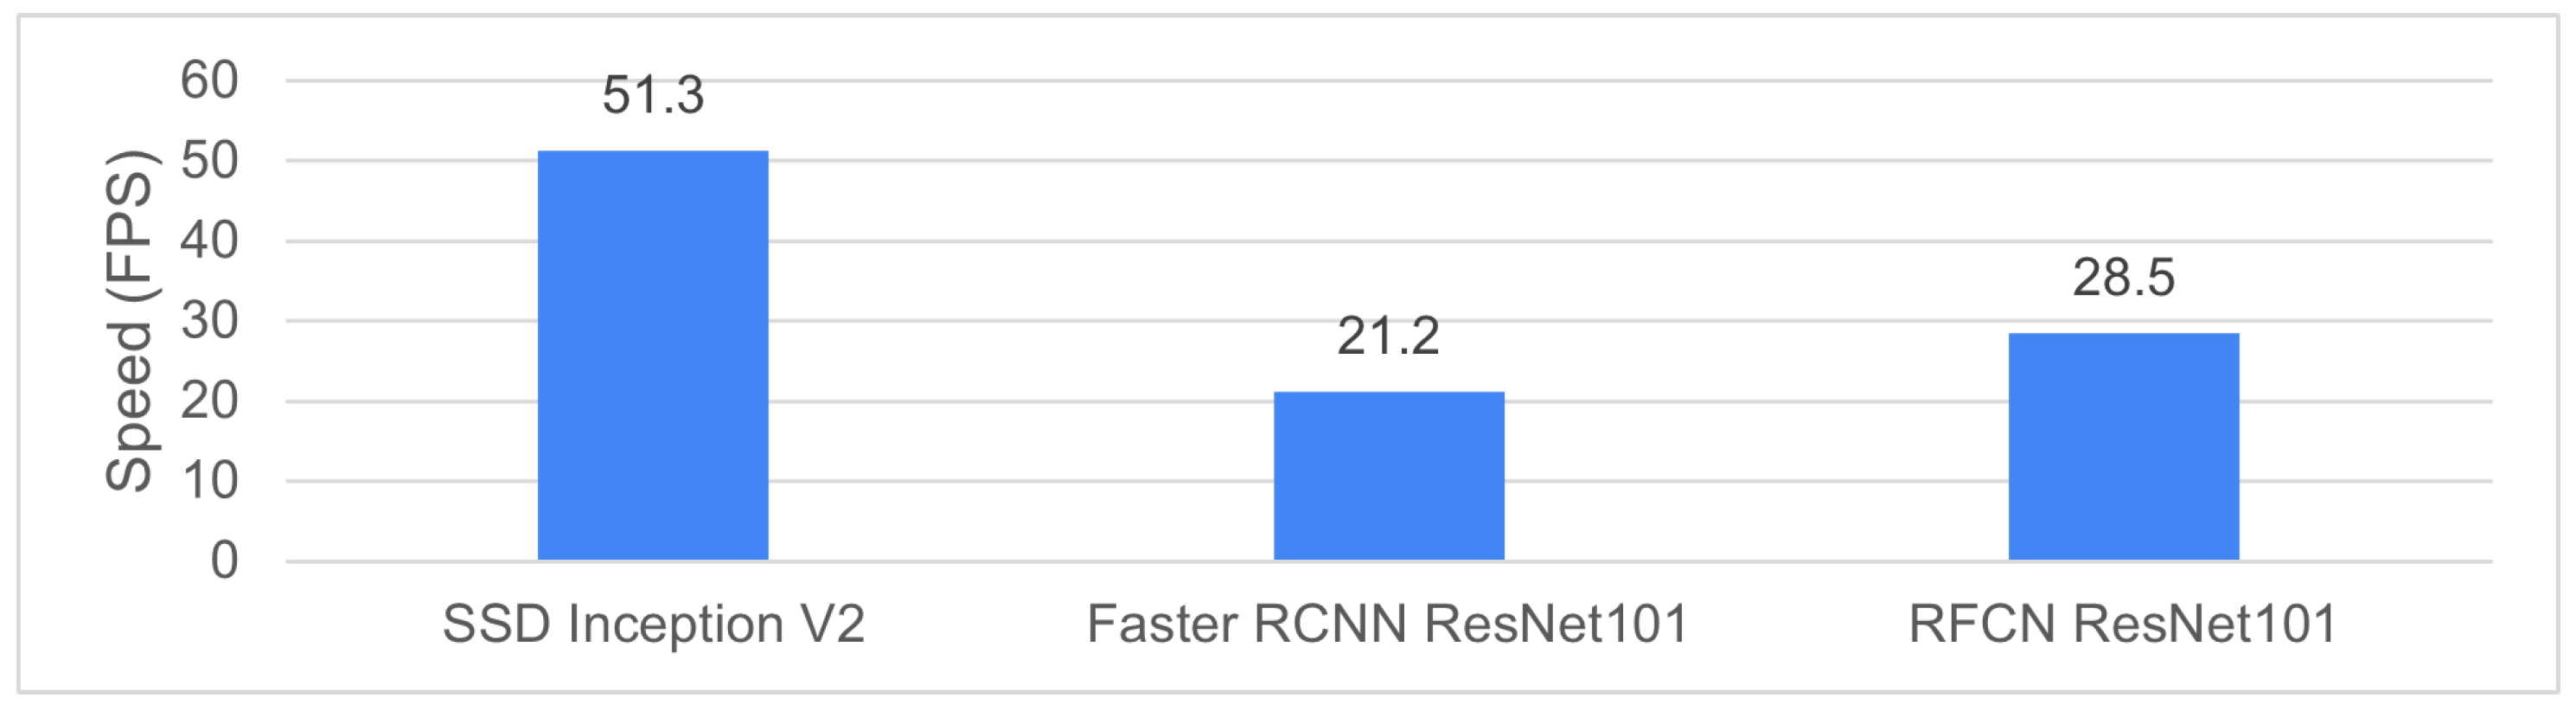
Figure 12 shows the average inference speed of the three models. SSD Inception V2 is the fastest (51.3 FPS) because it is a single-stage object detector. Both Faster RCNN (21.2 FPS) and RFCN (28.5 FPS) are two-stage detectors. All three models can meet the requirement of real-time inference in practice with an FPS obove 20 [58,59,60]. Furthermore, as RFCN ResNet101 achieves a good balance between accuracy and speed, we select it as the best one among the three and further evaluate it on the OOS test set.
3.4. Out-of-Sample Testing
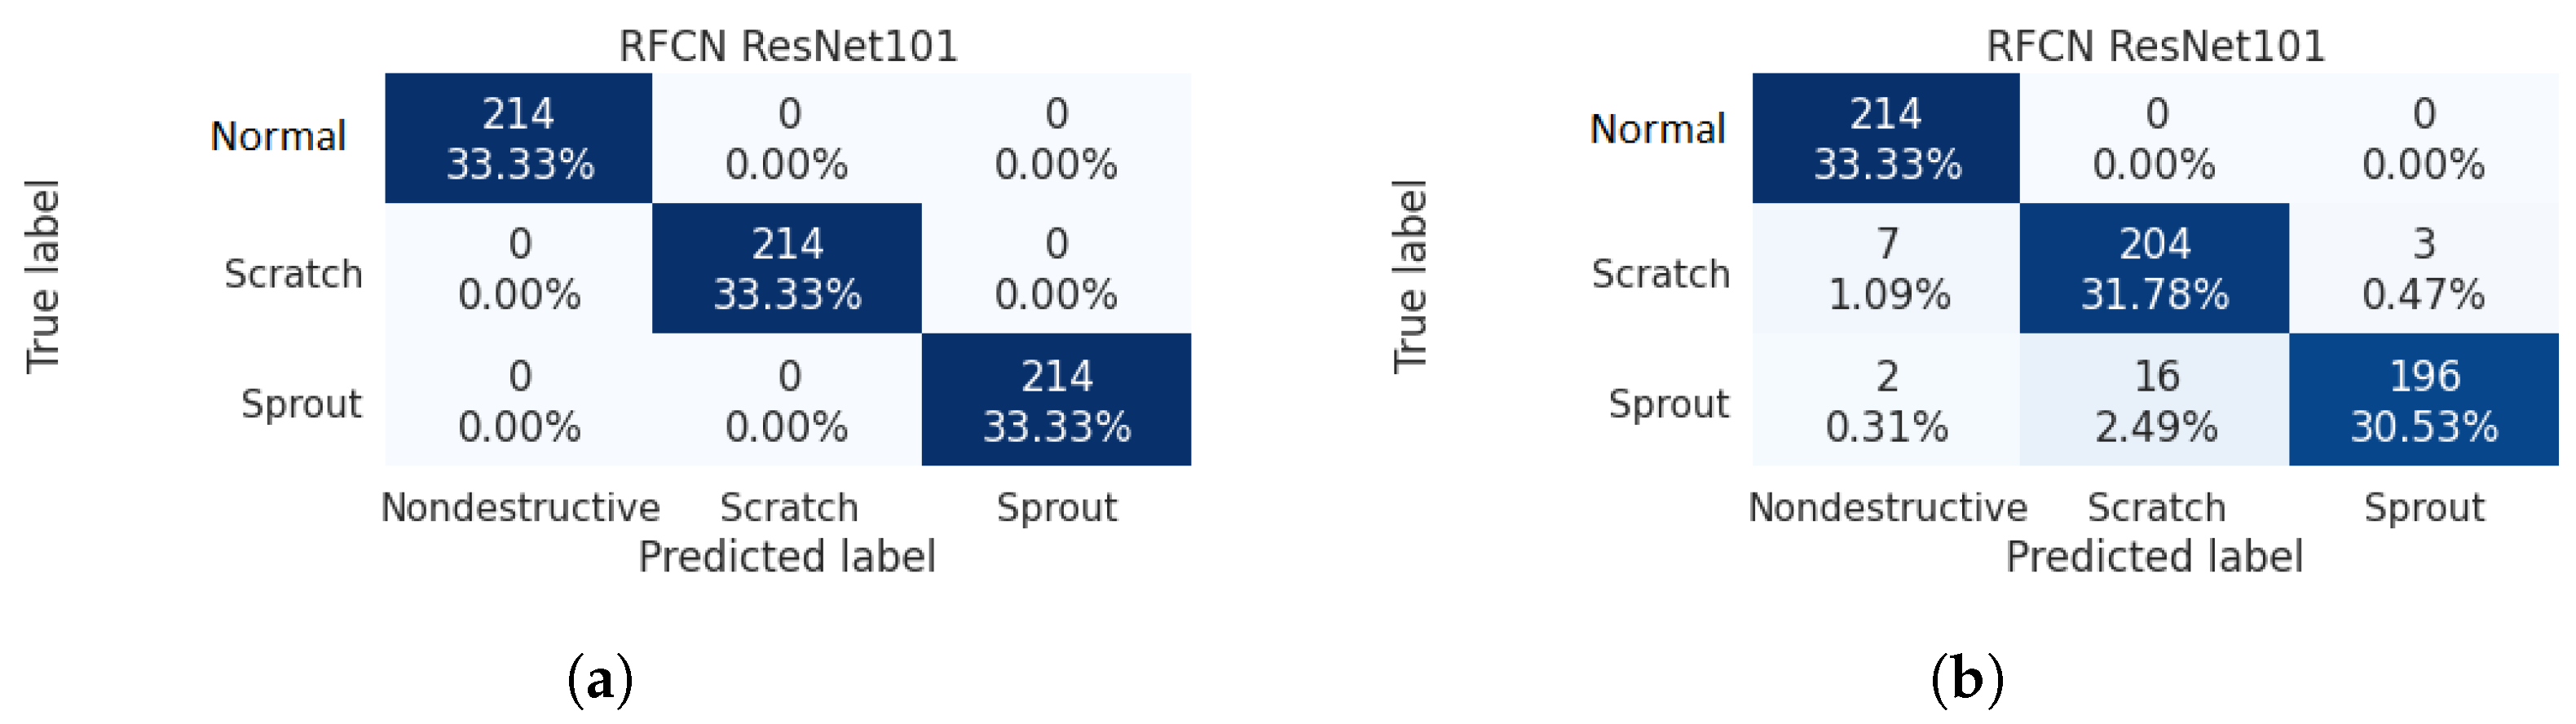
3.4.1. Scenario One: Effect of Different Batches
The results are shown in Figure 13a. The model performed exceptionally well with an Acc of 100% for all three categories. After checking, we find that scenario one represent an ideal situation where the camera was facing down pointing to the potato sample so that the image can capture the most informative features, which can be easily distinguished by our model.
3.4.2. Scenario Two: Effect of Different Detection Regions
Figure 13b and Table 4 show the model performance in scenario two. It is observed that a number of scratched and sprouting potatoes were predicted as normal. After error analysis, we found that for those misclassified samples, the characteristic parts of the surface, i.e., scratches and sprouts, happened to locate in the blind area of the camera shooting, leading to misclassification due to the lack of enough predictive features. This finding shows that it is crucial to capture sample images from multiple angles to prevent key surface features from being missed.
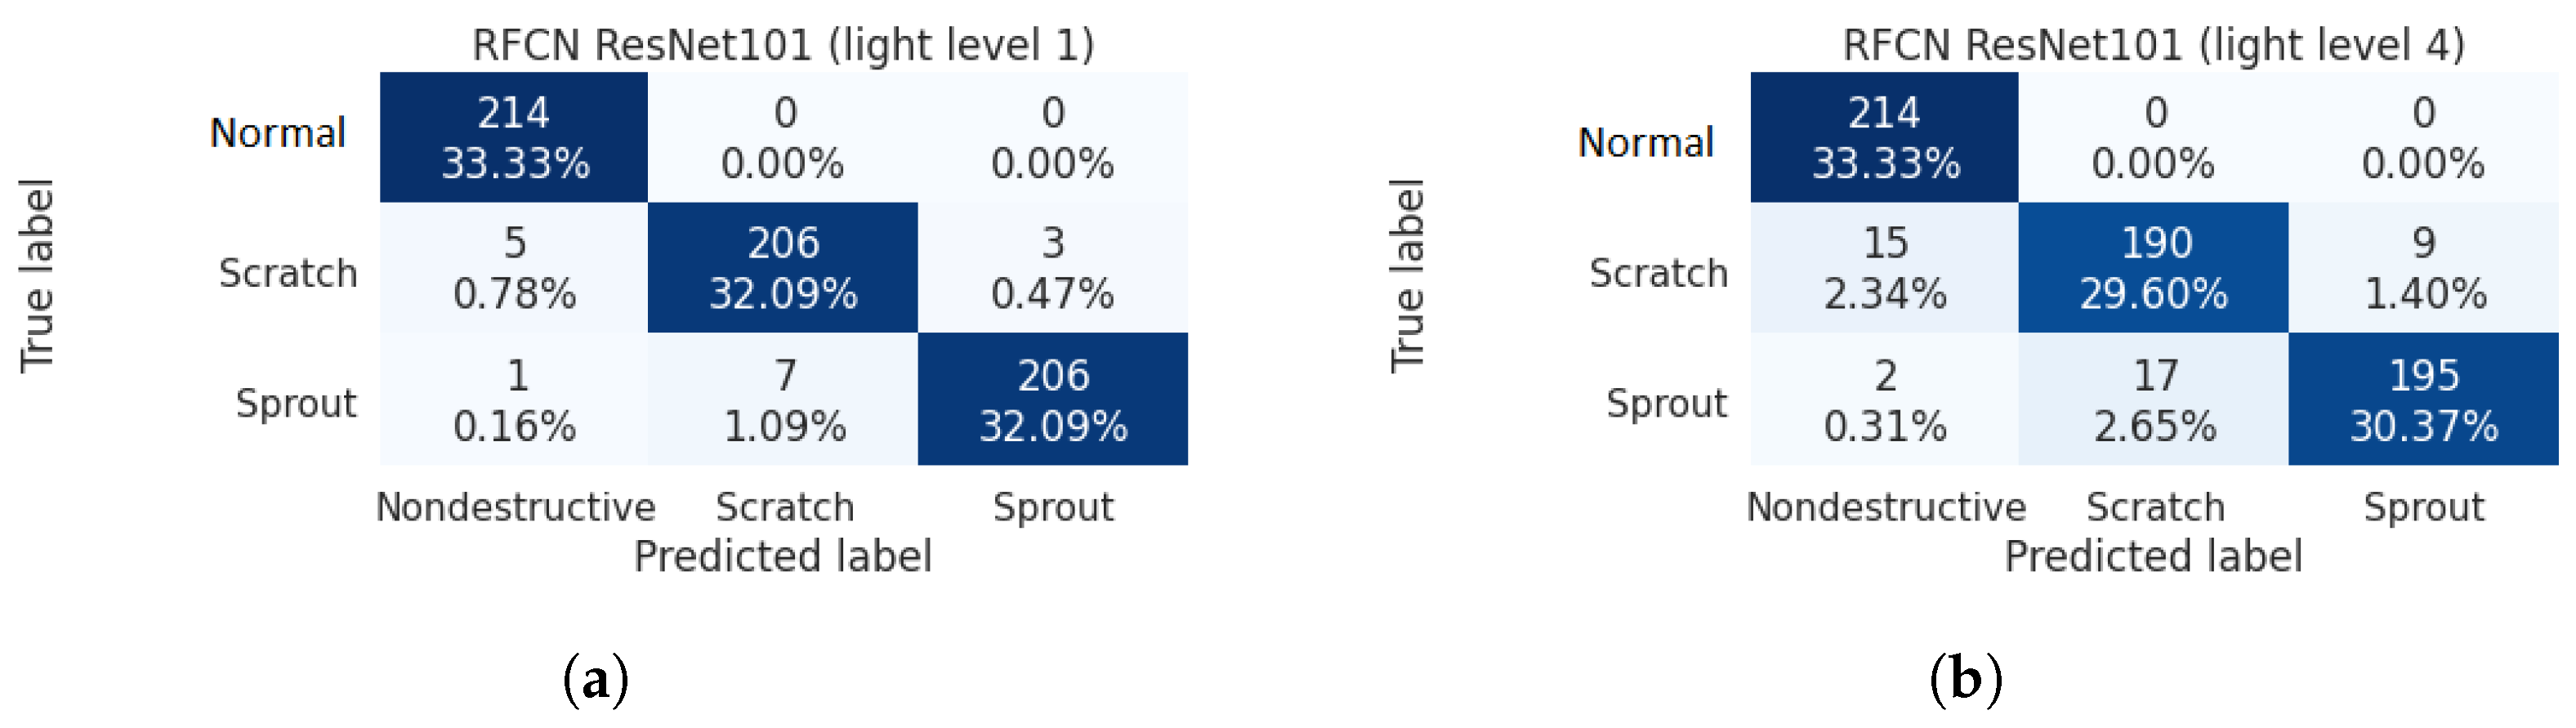
3.4.3. Scenario Three: Effect of Different Light Intensities
In scenario three, four brightness levels were offered during test. We find that for light levels two and three, the RFCN ResNet101 presented an Acc of 100% for all categories, which is reasonable as with moderate brightness and in a closed and controlled space (even better than scenario one), the model should behave consistently well. As shown in Figure 14 and Table 5, for level one, which is the case with the lowest light, RFCN ResNet100 showed an Acc of 97.5%, with a total of sixteen errors out of 642 samples; for level four, the case with the highest light, RFCN ResNet100 showed a decreased Acc of 93.3%. An error analysis on level one tells us that a darker image did affect the model’s ability to discover patterns, which were of low quality given insufficient light. Furthermore, for level four, stronger light resulted in light reflection on the potato surface, which also lowered the image quality since certain informative areas were covered by reflection.
Despite the performance degradation, RFCN ResNet101 can still achieve satisfying performance in this OOS testing. Results demonstrated that this model is in line with the requirements for industrial-level applications.
4. Discussion
Detecting defective surface for potatoes is a crucial task in post-harvest quality control during potato production. In this study, we consider two typical defective types, including sprouting and scratches caused by mechanical damage in harvest. Sprouted potatoes are toxic to human beings owing to the high level of glycoalkaloids, while scratched potatoes account for over 70% of damaged potatoes during harvesting. The surface patterns of these two damages carry rich imagery information that can be exploited to build automated and intelligent grading systems for potatoes. Such a system can tremendously improve the efficiency and efficacy of the quality control process and reduce the cost of post-harvest operations.
In the past two decades, computer vision-based grading systems have been developed and applied to sort potatoes and other food products by size, shape, and external defects. The early sorting systems have extensively applied image processing algorithms to extract a set of hand-crafted image features from the potato images to build a classifier. As the features, such as central moments, area, and eccentricity, are manually defined, extensive domain knowledge is required. In addition, these feature-based learning models do not generalize well, leading to performance degradation in OOS testing. The recent advances of deep learning is proven to be effective to address the weaknesses of traditional feature-based models. In computer vision, DCNN models have refreshed numerous performance records in a wide spectrum of tasks, such as image classification, object detection, and semantic segmentation. In the food industry, DCNN models have been adopted to build intelligent quality control systems. However, the use of DCNN models for potato surface defect detection has not been sufficiently explored. To our best knowledge, this study is the first to consider both sprouted and scratched potato damages and treat the detection problem as a transfer learning-based object detection task.
To validate the DCNN models, we developed an annotated dataset with a total of 2770 images, consisting of 813 normal potato images, 841 scratched ones, and 1116 sprouted ones. To further evaluate a model’s robustness, a total of 642 potatoes were used to build an OOS test set with three test scenarios. We investigated the effectiveness of three DCNN models, including SSD Inception V2, RFCN ResNet101, and Faster RCNN ResNet101, using the self-developed dataset. After a thorough comparison, the RFCN ResNet101 model outperformed the other two and was selected as the final model for out-of-sample testing. We conducted an error analysis on the misclassified samples, which were mainly caused by avoidable factors like hidden areas of scratches or sprouts and light reflection. Our findings lay the foundation of automated systems for potato surface defect inspection.
This work is subject to the following limitations that can be addressed in future work. First, this study on considered the three most important categories, while there are other categories and/or potato properties, such as broken, shape, size, and color that are also desired in a grading system. Second, gathering samples is time-consuming and costly, we plan to investigate data augmentation techniques to enhance the diversity and the size of the training set, which has been validated by other applications as an effective performance booster [61]. Third, recent advances in attention mechanisms have offered us another direction. Attention in computer vision tasks allow a DCNN to learn what and where to focus on in the input image, which would also benefit the surface defect detection task.
Author Contributions
Conceptualization and methodology, C.W. and Z.X.; software, validation, and original draft preparation, C.W.; review and editing, supervision, Z.X. All authors have read and agreed to the published version of the manuscript.
Funding
This research received no external funding.
Institutional Review Board Statement
Not applicable.
Informed Consent Statement
Not applicable.
Data Availability Statement
Interested readers can reach out to the authors at [email protected] to request a copy of the dataset.
Conflicts of Interest
The authors declare no conflict of interest.
References
- FAO. Food and Agriculture Organization Statistics; FAO: Rome, Italy, 2013. [Google Scholar]
- Gao, B.; Huang, W.; Xue, X.; Hu, Y.; Huang, Y.; Wang, L.; Ding, S.; Cui, S. Comprehensive environmental assessment of potato as staple food policy in China. Int. J. Environ. Res. Public Health 2019, 16, 2700. [Google Scholar] [CrossRef] [PubMed] [Green Version]
- Su, Q.; Kondo, N.; Al Riza, D.F.; Habaragamuwa, H. Potato Quality Grading Based on Depth Imaging and Convolutional Neural Network. J. Food Qual. 2020, 2020, 8815896. [Google Scholar] [CrossRef]
- ElMasry, G.; Cubero, S.; Moltó, E.; Blasco, J. In-line sorting of irregular potatoes by using automated computer-based machine vision system. J. Food Eng. 2012, 112, 60–68. [Google Scholar] [CrossRef]
- Narvankar, D.S.; Jha, S.; Singh, A. Development of rotating screen grader for selected orchard crops. J. Agric. Eng. 2005, 42, 60–64. [Google Scholar]
- Razmjooy, N.; Mousavi, B.S.; Soleymani, F. A real-time mathematical computer method for potato inspection using machine vision. Comput. Math. Appl. 2012, 63, 268–279. [Google Scholar] [CrossRef] [Green Version]
- Zhou, Z.; Huang, Y.; Li, X.; Wen, D.; Wang, C.; Tao, H. Automatic detecting and grading method of potatoes based on machine vision. Trans. Chin. Soc. Agric. Eng. 2012, 28, 178–183. [Google Scholar]
- Wang, C.; Li, X.; Wu, Z.; Zhou, Z.; Feng, Y. Machine vision detecting potato mechanical damage based on manifold learning algorithm. Trans. Chin. Soc. Agric. Eng. 2014, 30, 245–252. [Google Scholar]
- Yao, L.; Lu, L.; Zheng, R. Study on Detection Method of External Defects of Potato Image in Visible Light Environment. In Proceedings of the 2017 10th International Conference on Intelligent Computation Technology and Automation (ICICTA), Changsha, China, 9–10 October 2017; pp. 118–122. [Google Scholar]
- Moallem, P.; Razmjooy, N.; Ashourian, M. Computer vision-based potato defect detection using neural networks and support vector machine. Int. J. Robot. Autom. 2013, 28, 137–145. [Google Scholar] [CrossRef]
- Wang, Z.; Hu, M.; Zhai, G. Application of deep learning architectures for accurate and rapid detection of internal mechanical damage of blueberry using hyperspectral transmittance data. Sensors 2018, 18, 1126. [Google Scholar] [CrossRef] [Green Version]
- Suykens, J.A. Support vector machines: A nonlinear modelling and control perspective. Eur. J. Control 2001, 7, 311–327. [Google Scholar] [CrossRef]
- Duarte-Carvajalino, J.M.; Yu, G.; Carin, L.; Sapiro, G. Task-driven adaptive statistical compressive sensing of Gaussian mixture models. IEEE Trans. Signal Process. 2012, 61, 585–600. [Google Scholar] [CrossRef] [Green Version]
- Kleinbaum, D.G.; Dietz, K.; Gail, M.; Klein, M.; Klein, M. Logistic Regression; Springer: Berlin/Heidelberg, Germany, 2002. [Google Scholar]
- Yang, L.; Chen, L.; Tian, F.; Li, S.; Liu, X.; Tan, Y. Automatic Recognition of Potato Germ Based on AdaBoost Algorithm. In Proceedings of the 2019 ASABE Annual International Meeting, Boston, MA, USA, 7–10 July 2019. [Google Scholar]
- Xu, H.; Mannor, S. Robustness and generalization. Mach. Learn. 2012, 86, 391–423. [Google Scholar] [CrossRef] [Green Version]
- Brown, C.R. The contribution of traditional potato breeding to scientific potato improvement. Potato Res. 2011, 54, 287–300. [Google Scholar] [CrossRef]
- Heinemann, P.H.; Pathare, N.P.; Morrow, C.T. An automated inspection station for machine-vision grading of potatoes. Mach. Vis. Appl. 1996, 9, 14–19. [Google Scholar] [CrossRef]
- Zhou, L.; Chalana, V.; Kim, Y. PC-based machine vision system for real-time computer-aided potato inspection. Int. J. Imaging Syst. Technol. 1998, 9, 423–433. [Google Scholar] [CrossRef]
- Noordam, J.C.; Otten, G.W.; Timmermans, T.J.; van Zwol, B.H. High-speed potato grading and quality inspection based on a color vision system. In Proceedings of the Machine Vision Applications in Industrial Inspection VIII, San Jose, CA, USA, 24–26 January 2000; Volume 3966, pp. 206–217. [Google Scholar]
- Krizhevsky, A.; Sutskever, I.; Hinton, G.E. Imagenet classification with deep convolutional neural networks. Adv. Neural Inf. Process. Syst. 2012, 25, 1097–1105. [Google Scholar] [CrossRef]
- Khan, A.; Sohail, A.; Zahoora, U.; Qureshi, A.S. A survey of the recent architectures of deep convolutional neural networks. Artif. Intell. Rev. 2020, 53, 5455–5516. [Google Scholar] [CrossRef] [Green Version]
- Zhu, L.; Spachos, P.; Pensini, E.; Plataniotis, K.N. Deep learning and machine vision for food processing: A survey. Curr. Res. Food Sci. 2021, 4, 233–249. [Google Scholar] [CrossRef]
- Biswas, S.; Barma, S. A large-scale optical microscopy image dataset of potato tuber for deep learning based plant cell assessment. Sci. Data 2020, 7, 1–11. [Google Scholar] [CrossRef] [PubMed]
- Pandey, N.; Kumar, S.; Pandey, R. Grading and Defect Detection in Potatoes Using Deep Learning. In Proceedings of the International Conference on Communication, Networks and Computing, Gwalior, India, 22–24 March 2018; pp. 329–339. [Google Scholar]
- Pouyanfar, S.; Sadiq, S.; Yan, Y.; Tian, H.; Tao, Y.; Reyes, M.P.; Shyu, M.L.; Chen, S.C.; Iyengar, S. A survey on deep learning: Algorithms, techniques, and applications. ACM Comput. Surv. (CSUR) 2018, 51, 1–36. [Google Scholar] [CrossRef]
- Siddiqi, R. Automated apple defect detection using state-of-the-art object detection techniques. SN Appl. Sci. 2019, 1, 1–12. [Google Scholar] [CrossRef] [Green Version]
- Kayaalp, K.; Metlek, S. Classification of robust and rotten apples by deep learning algorithm. Sak. Univ. J. Comput. Inf. Sci. 2020, 3, 112–120. [Google Scholar] [CrossRef]
- Alam, M.N.; Saugat, S.; Santosh, D.; Sarkar, M.I.; Al-Absi, A.A. Apple Defect Detection Based on Deep Convolutional Neural Network. In International Conference on Smart Computing and Cyber Security: Strategic Foresight, Security Challenges and Innovation; Springer: Berlin/Heidelberg, Germany, 2020; pp. 215–223. [Google Scholar]
- Fan, S.; Li, J.; Zhang, Y.; Tian, X.; Wang, Q.; He, X.; Zhang, C.; Huang, W. On line detection of defective apples using computer vision system combined with deep learning methods. J. Food Eng. 2020, 286, 110102. [Google Scholar] [CrossRef]
- Valdez, P. Apple defect detection using deep learning based object detection for better post harvest handling. arXiv 2020, arXiv:2005.06089. [Google Scholar]
- Xie, W.; Wei, S.; Zheng, Z.; Yang, D. A CNN-based lightweight ensemble model for detecting defective carrots. Biosyst. Eng. 2021, 208, 287–299. [Google Scholar] [CrossRef]
- Deng, L.; Li, J.; Han, Z. Online defect detection and automatic grading of carrots using computer vision combined with deep learning methods. LWT 2021, 149, 111832. [Google Scholar] [CrossRef]
- Azizah, L.M.; Umayah, S.F.; Riyadi, S.; Damarjati, C.; Utama, N.A. Deep learning implementation using convolutional neural network in mangosteen surface defect detection. In Proceedings of the 2017 7th IEEE International Conference on Control System, Computing and Engineering (ICCSCE), Penang, Malaysia, 24–26 November 2017; pp. 242–246. [Google Scholar]
- Shi, X.; Wu, X. Tomato processing defect detection using deep learning. In Proceedings of the 2019 2nd World Conference on Mechanical Engineering and Intelligent Manufacturing (WCMEIM), Shanghai, China, 22–24 November 2019; pp. 728–732. [Google Scholar]
- Da Costa, A.Z.; Figueroa, H.E.; Fracarolli, J.A. Computer vision based detection of external defects on tomatoes using deep learning. Biosyst. Eng. 2020, 190, 131–144. [Google Scholar] [CrossRef]
- Turaev, S.; Abd Almisreb, A.; Saleh, M.A. Application of Transfer Learning for Fruits and Vegetable Quality Assessment. In Proceedings of the 2020 14th International Conference on Innovations in Information Technology (IIT), Al Ain, United Arab Emirates, 17–18 November 2020; pp. 7–12. [Google Scholar]
- Casaño, C.D.L.C.; Sánchez, M.C.; Chavez, F.R.; Ramos, W.V. Defect Detection on Andean Potatoes using Deep Learning and Adaptive Learning. In Proceedings of the 2020 IEEE Engineering International Research Conference (EIRCON), Lima, Peru, 21–23 October 2020; pp. 1–4. [Google Scholar]
- Hasan, M.Z.; Zahan, N.; Zeba, N.; Khatun, A.; Haque, M.R. A Deep Learning-Based Approach for Potato Disease Classification. In Computer Vision and Machine Learning in Agriculture; Springer: Berlin/Heidelberg, Germany, 2021; pp. 113–126. [Google Scholar]
- Al-Dosary, N.M.N. Potato harvester performance on tuber damage at the eastern of Saudi Arabia. Agric. Eng. Int. CIGR J. 2016, 18, 32–42. [Google Scholar]
- Friedman, M.; McDonald, G.M.; Filadelfi-Keszi, M. Potato glycoalkaloids: Chemistry, analysis, safety, and plant physiology. Crit. Rev. Plant Sci. 1997, 16, 55–132. [Google Scholar] [CrossRef]
- Wang, W.; Yang, Y.; Wang, X.; Wang, W.; Li, J. Development of convolutional neural network and its application in image classification: A survey. Opt. Eng. 2019, 58, 040901. [Google Scholar] [CrossRef] [Green Version]
- Liu, L.; Ouyang, W.; Wang, X.; Fieguth, P.; Chen, J.; Liu, X.; Pietikäinen, M. Deep learning for generic object detection: A survey. Int. J. Comput. Vis. 2020, 128, 261–318. [Google Scholar] [CrossRef] [Green Version]
- Liu, W.; Anguelov, D.; Erhan, D.; Szegedy, C.; Reed, S.; Fu, C.Y.; Berg, A.C. Ssd: Single shot multibox detector. In European Conference on Computer Vision; Springer: Berlin/Heidelberg, Germany, 2016; pp. 21–37. [Google Scholar]
- Tan, C.; Sun, F.; Kong, T.; Zhang, W.; Yang, C.; Liu, C. A survey on deep transfer learning. In International Conference on Artificial Neural Networks; Springer: Berlin/Heidelberg, Germany, 2018; pp. 270–279. [Google Scholar]
- Fang, J.; Jacobsen, B.; Qin, Y. Predictability of the simple technical trading rules: An out-of-sample test. Rev. Financ. Econ. 2014, 23, 30–45. [Google Scholar] [CrossRef] [Green Version]
- Jiang, L.; Wang, Z.; Jin, G.; Lu, D.; Li, X. Responses of Favorita Potato Plantlets Cultured in Vitro under Fluorescent and Light-Emitting Diode (LED) Light Sources. Am. J. Potato Res. 2019, 96, 396–402. [Google Scholar] [CrossRef]
- Aksenova, N.; Sergeeva, L.; Konstantinova, T.; Golyanovskaya, S.; Kolachevskaya, O.; Romanov, G. Regulation of potato tuber dormancy and sprouting. Russ. J. Plant Physiol. 2013, 60, 301–312. [Google Scholar] [CrossRef]
- Turnbull, C.; Hanke, D. The control of bud dormancy in potato tubers. Planta 1985, 165, 359–365. [Google Scholar] [CrossRef] [PubMed]
- Lin, T.Y.; Maire, M.; Belongie, S.; Hays, J.; Perona, P.; Ramanan, D.; Dollár, P.; Zitnick, C.L. Microsoft coco: Common objects in context. In European Conference on Computer Vision; Springer: Berlin/Heidelberg, Germany, 2014; pp. 740–755. [Google Scholar]
- Simonyan, K.; Zisserman, A. Very deep convolutional networks for large-scale image recognition. arXiv 2014, arXiv:1409.1556. [Google Scholar]
- Szegedy, C.; Vanhoucke, V.; Ioffe, S.; Shlens, J.; Wojna, Z. Rethinking the inception architecture for computer vision. In Proceedings of the IEEE Conference on Computer Vision and Pattern Recognition, Las Vegas, NV, USA, 27–30 June 2016; pp. 2818–2826. [Google Scholar]
- Girshick, R.; Donahue, J.; Darrell, T.; Malik, J. Rich feature hierarchies for accurate object detection and semantic segmentation. In Proceedings of the IEEE Conference on Computer Vision and Pattern Recognition, Columbus, OH, USA, 23–28 June 2014; pp. 580–587. [Google Scholar]
- Girshick, R. Fast r-cnn. In Proceedings of the IEEE International Conference on Computer Vision, Santiago, Chile, 7–13 December 2015; pp. 1440–1448. [Google Scholar]
- Ren, S.; He, K.; Girshick, R.; Sun, J. Faster R-CNN: Towards real-time object detection with region proposal networks. IEEE Trans. Pattern Anal. Mach. Intell. 2016, 39, 1137–1149. [Google Scholar] [CrossRef] [PubMed] [Green Version]
- He, K.; Zhang, X.; Ren, S.; Sun, J. Deep residual learning for image recognition. In Proceedings of the IEEE Conference on Computer Vision and Pattern Recognition, Las Vegas, NV, USA, 27–30 June 2016; pp. 770–778. [Google Scholar]
- Dai, J.; Li, Y.; He, K.; Sun, J. R-FCN: Object detection via region-based fully convolutional networks. In Proceedings of the 30th International Conference on Neural Information Processing Systems, Barcelona, Spain, 5–10 December 2016; pp. 379–387. [Google Scholar]
- Guo, J.; Chen, P.; Jiang, Y.; Yokoi, H.; Togo, S. Real-time Object Detection with Deep Learning for Robot Vision on Mixed Reality Device. In Proceedings of the 2021 IEEE 3rd Global Conference on Life Sciences and Technologies (LifeTech), Nara, Japan, 9–11 March 2021; pp. 82–83. [Google Scholar]
- Cheng, Y.; Liu, W.; Xing, W. Weighted feature fusion and attention mechanism for object detection. J. Electron. Imaging 2021, 30, 023015. [Google Scholar] [CrossRef]
- Liu, Z.; Zheng, T.; Xu, G.; Yang, Z.; Liu, H.; Cai, D. TTFNeXt for real-time object detection. Neurocomputing 2021, 433, 59–70. [Google Scholar] [CrossRef]
- Huang, S.W.; Lin, C.T.; Chen, S.P.; Wu, Y.Y.; Hsu, P.H.; Lai, S.H. Auggan: Cross domain adaptation with gan-based data augmentation. In Proceedings of the European Conference on Computer Vision (ECCV), Munich, Germany, 8–14 September 2018; pp. 718–731. [Google Scholar]
Figure 1.
Potato samples.

Figure 2.
The potato images are taken at different locations of the campus of Huizhou University with different angles, creating a diverse dataset of images.
Figure 2.
The potato images are taken at different locations of the campus of Huizhou University with different angles, creating a diverse dataset of images.

Figure 3.
(a) Shooting configuration. (b) Diagram of a dimmable test platform with an industrial camera at 1, a ring dimmable light at 2, a placing platform at 3, and a closed black box (i.e., 4).
Figure 3.
(a) Shooting configuration. (b) Diagram of a dimmable test platform with an industrial camera at 1, a ring dimmable light at 2, a placing platform at 3, and a closed black box (i.e., 4).

Figure 4.
We adopt LabelImg to annotate each potato object in an image by marking a rectangle (i.e., a bounding box) that encompasses the potato object. The coordinates of the bounding box’s four corners specify the location of the marked potato and are used as labels in training.
Figure 4.
We adopt LabelImg to annotate each potato object in an image by marking a rectangle (i.e., a bounding box) that encompasses the potato object. The coordinates of the bounding box’s four corners specify the location of the marked potato and are used as labels in training.

Figure 5.
The SSD Inception V2 model.

Figure 6.
The Inception module.

Figure 7.
The Faster RCNN RseNet101.

Figure 8.
The RFCN ResNet101 model.

Figure 9.
Transfer learning.

Figure 10.
Results on the test set: (a) Accuracy vs. training steps. (b) Loss vs. training steps.

Figure 11.
Confusion matrices for models evaluated on the test set.

Figure 12.
Inference speed.

Figure 13.
Confusion matrices for the OOS test set: (a) scenario one (b) scenario two.

Figure 14.
Confusion matrix of scenario three for the OOS test set: (a) light level 1 (b) light level 4.
Figure 14.
Confusion matrix of scenario three for the OOS test set: (a) light level 1 (b) light level 4.


Table 1.
Literature in DCNN-based surface defect detection for agricultural products. Abbreviation: T.L. = Transfer Learning; OOS T. = Out-of-sample testing; Cls. = Classification; O.D. = Object Detection.
Table 1.
Literature in DCNN-based surface defect detection for agricultural products. Abbreviation: T.L. = Transfer Learning; OOS T. = Out-of-sample testing; Cls. = Classification; O.D. = Object Detection.
| Ref | Product | # Classes | Task | T.L. | OOS T. |
|---|---|---|---|---|---|
| Fan et al. (2020) [30] | Apple | Two | Cls. | ✗ | ✗ |
| Valdez et al. (2020) [31] | Apple | Two | O.D. | ✓ | ✗ |
| Xie et al. (2021) [32] | Carrot | Six | Cls. | ✓ | ✗ |
| Deng et al. (2021) [33] | Carrot | Six | Cls. | ✓ | ✗ |
| Azizah et al. (2017) [34] | Mangosteen | Two | Cls. | ✗ | ✗ |
| Shi et al. (2019) [35] | Tomato | Two | O.D. | ✓ | ✗ |
| da Costa et al. (2020) [36] | Tomato | Two | Cls. | ✓ | ✗ |
| Turaev et al. (2020) [37] | 12 types | Five | Cls. | ✓ | ✗ |
| Casano et al. (2020) [38] | Potato | Two | Cls. | ✗ | ✗ |
| Su et al. (2020) [3] | Potato | Six | Cls. | ✗ | ✗ |
| Hasan et al. (2021) [39] | Potato | Twenty | Cls. | ✓ | ✗ |
| Ours | Potato | Three | O.D. | ✓ | ✓ |
Table 2.
Basic information of the potato surface defect dataset.
| Category | Samples | Images | Percentage | Training | Test |
|---|---|---|---|---|---|
| Normal | 428 | 813 | 29.4% | 610 | 203 |
| Scratch | 214 | 841 | 30.4% | 631 | 210 |
| Sprout | 428 | 1116 | 40.2% | 837 | 279 |
| Total | 1070 | 2770 | 100% | 2078 | 693 |
Table 3.
Model performance on the test set. Abbreviations: S.I.V2 = SSD Inception V2; F.R.R.N.101 = Faster RCNN ResNet101; R.R.N.101 = RFCN ResNet101.
Table 3.
Model performance on the test set. Abbreviations: S.I.V2 = SSD Inception V2; F.R.R.N.101 = Faster RCNN ResNet101; R.R.N.101 = RFCN ResNet101.
| Model | Category | Acc | Pre | Rec | Spe | F1 |
|---|---|---|---|---|---|---|
| S.I.V2 | Normal | 92.5% | 91.7% | 92.6% | 92.4% | 92.2% |
| Scratch | 92.5% | 89.4% | 92.9% | 92.3% | 91.1% | |
| Sprout | 92.5% | 95.5% | 92.1% | 92.7% | 93.8% | |
| Macro avg. | 92.5% | 92.2% | 92.5% | 92.5% | 92.4% | |
| F.R.R.N.101 | Normal | 95.7% | 95.1% | 96.1% | 95.5% | 95.6% |
| Scratch | 95.7% | 93.9% | 94.8% | 96.1% | 94.3% | |
| Sprout | 95.7% | 97.5% | 96.1% | 95.4% | 96.8% | |
| Macro avg. | 95.7% | 95.5% | 95.6% | 95.7% | 95.6% | |
| R.R.N.101 | Normal | 98.7% | 99.0% | 98.5% | 98.8% | 98.8% |
| Scratch | 98.7% | 98.1% | 99.0% | 98.5% | 98.6% | |
| Sprout | 98.7% | 98.9% | 98.6% | 98.8% | 98.7% | |
| Macro avg. | 98.7% | 98.7% | 98.7% | 98.7% | 98.7% |
Table 4.
Effect of different detection regions on model performance for the OOS test set.
| Category | Acc | Pre | Rec | Spe | F1 |
|---|---|---|---|---|---|
| Normal | 95.60% | 96.00% | 100.00% | 93.50% | 97.90% |
| Scratch | 95.60% | 92.70% | 95.30% | 95.80% | 94.00% |
| Sprout | 95.60% | 98.50% | 91.60% | 97.70% | 94.90% |
| Macro avg. | 95.60% | 95.70% | 95.60% | 95.60% | 95.70% |
Table 5.
Effect of light intensities on model performance for the OOS test set.
| Light Level | Category | Acc | Pre | Rec | Spe | F1 |
|---|---|---|---|---|---|---|
| One | Normal | 97.50% | 97.30% | 100.00% | 96.30% | 98.60% |
| Scratch | 97.50% | 96.70% | 96.30% | 98.10% | 96.50% | |
| Sprout | 97.50% | 98.60% | 96.30% | 98.10% | 97.40% | |
| Macro avg. | 97.50% | 97.50% | 97.50% | 97.50% | 97.50% | |
| Four | Normal | 93.30% | 93.00% | 100.00% | 90.00% | 96.40% |
| Scratch | 93.30% | 91.30% | 88.80% | 95.60% | 90.00% | |
| Sprout | 93.30% | 95.60% | 91.10% | 94.40% | 93.30% | |
| Macro avg. | 93.30% | 93.30% | 93.30% | 93.30% | 93.30% |
Publisher’s Note: MDPI stays neutral with regard to jurisdictional claims in published maps and institutional affiliations. |
© 2021 by the authors. Licensee MDPI, Basel, Switzerland. This article is an open access article distributed under the terms and conditions of the Creative Commons Attribution (CC BY) license (https://creativecommons.org/licenses/by/4.0/).
Share and Cite
MDPI and ACS Style
Wang, C.; Xiao, Z. Potato Surface Defect Detection Based on Deep Transfer Learning. Agriculture 2021, 11, 863. https://0-doi-org.brum.beds.ac.uk/10.3390/agriculture11090863
AMA Style
Wang C, Xiao Z. Potato Surface Defect Detection Based on Deep Transfer Learning. Agriculture. 2021; 11(9):863. https://0-doi-org.brum.beds.ac.uk/10.3390/agriculture11090863
Chicago/Turabian StyleWang, Chenglong, and Zhifeng Xiao. 2021. "Potato Surface Defect Detection Based on Deep Transfer Learning" Agriculture 11, no. 9: 863. https://0-doi-org.brum.beds.ac.uk/10.3390/agriculture11090863
Note that from the first issue of 2016, this journal uses article numbers instead of page numbers. See further details here.