
Lettuce Growth Pattern Analysis Using U-Net Pre-Trained with Arabidopsis


1
Radiation Breeding Research Team, Advanced Radiation Technology Institute (ARTI), Korea Atomic Energy Research Institute (KAERI), 29 Geumgu-gil, Jeongeup-si 56212, Jeollabuk-do, Korea
2
Smart Farm Research Center, Korea Institute of Science and Technology (KIST), 679 Saimdang-ro, Gangneung 210-340, Gangwon-do, Korea
*
Author to whom correspondence should be addressed.
Agriculture 2021, 11(9), 890; https://0-doi-org.brum.beds.ac.uk/10.3390/agriculture11090890
Submission received: 16 August 2021
/
Revised: 13 September 2021
/
Accepted: 13 September 2021
/
Published: 16 September 2021
(This article belongs to the Special Issue Digital Innovations in Agriculture)
Abstract
:To overcome the challenges related to food security, digital farming has been proposed, wherein the status of a plant using various sensors could be determined in real time. The high-throughput phenotyping platform (HTPP) and analysis with deep learning (DL) are increasingly being used but require a lot of resources. For botanists who have no prior knowledge of DL, the image analysis method is relatively easy to use. Hence, we aimed to explore a pre-trained Arabidopsis DL model to extract the projected area (PA) for lettuce growth pattern analysis. The accuracies of the extract PA of the lettuce cultivar “Nul-chung” with a pre-trained model was measured using the Jaccard Index, and the median value was 0.88 and 0.87 in two environments. Moreover, the growth pattern of green lettuce showed reproducible results in the same environment (p < 0.05). The pre-trained model successfully extracted the time-series PA of lettuce under two lighting conditions (p < 0.05), showing the potential application of a pre-trained DL model of target species in the study of traits in non-target species under various environmental conditions. Botanists and farmers would benefit from fewer challenges when applying up-to-date DL in crop analysis when few resources are available for image analysis of a target crop.
1. Introduction
Food security is a big challenge for many geographic areas, and present agricultural production practices could not support the present food demand worldwide [1]. To overcome this problem, agricultural data are utilized, which is called digital agriculture, to more effectively cultivate plants in real time [2]. Phenotyping data is a key process in digital agriculture as it can reveal the status of plant extracts from image-based data [3].
The amount of phenomics data extracted from a high-throughput phenotyping platform (HTPP) has been increasing, and more diverse image-based sensor data are expected from the platform [4]. However, extracting features of interesting traits from an image is challenging because there are currently no general analysis tools available. Projected area (PA), defined as the measured whole plant area based on images, is considered as the most utilized feature in plants. The semantic segmentation of plants based on legacy methods such as adjusting the contrast with the region of interest (ROI) was applied, but the result was not successful because the legacy method is very sensitive to lighting conditions. Machine learning (ML)-based image analysis has shown superior performance over the legacy method [5,6]. Deep learning (DL)-based image analysis methods even further reduced the error rates [7,8,9]. A previous study indicated that U-Net showed superior performance in the semantic segmentation of Arabidopsis [8]. In this study, U-Net successfully distinguished the subtle differences among plants exposed to various types of gamma radiation [8].
The extraction of target phenotypes in target plant species using image analysis showed a very effective process with DL [10,11]. However, DL training for crop segmentation requires a large amount of resources and time, as shown in lettuce [12]. The main reason was due to labeling images that include plant and background information usually generated by manual laborers [13]. In addition, trained label images for the DL model need to be embedded in various steps for the pre-and post-processing of the original images. As a result, the built image analysis pipeline for a crop requires time and collaboration with other scientists such as an image scientist [14]. The Arabidopsis pre-trained model already has the necessary information for separate plant areas over the background area that was defined as PA, but this has not been explored in other plant species. Investigating the possibility of utilizing a pre-trained model has a notable advantage over building a new model for a target plant. In addition to the minimal effort needed for building a new model, the manually intense annotation of a large number of plant images and training DL is not necessary. Moreover, botanists could utilize the pre-trained model with little knowledge of DL models for a target plant. A previous study on plant disease detection suggested that the pre-training of VGG-16 that was used for various general tasks could be applied in plant disease detection [15]. However, there has been no report that utilizes a model pre-trained in a model plant for different species in a growth pattern analysis.
In this study, we aimed to explore the application of a pre-trained Arabidopsis DL model called U-Net for the segmentation of green lettuce cultivars under the same and different environmental conditions.
2. Materials and Methods
2.1. Plant Growth Condition, Image Acquisition, and Analysis
Green lettuce cultivars (Danong seeds, Andong, Kangwon, Korea) were placed in a soil mixture (Hueng-nong Bio, Pyeontaek-Si, Republic of Korea) and covered with a translucent plastic dome in an environmentally controlled room. Two plant-to-sensor type HTPPs were utilized, and each HTPP had different lighting conditions. In HTPP one, the environmental conditions were identical to those of the pre-trained DL model in Arabidopsis. In HTPP two, all environmental conditions were identical to those of the platform, except that the lighting intensity was 400 µmol ms−1 s−1, which was two-fold higher than that of platform one (200 umol ms−1 s−1). In each platform, two trays were randomly placed for technical replication. After 3 days of planting, the plastic dome was removed, and images were obtained with HTTP [8] every hour from 7:00 to 20:00 for 23 days. In HTPP two, a black plastic dome was placed around the camera to remove excessive lighting.
A schematic of the image analysis pipeline was available [8] and the image process was executed with a 4 × 2 image cropping Python line option within the pipeline.
2.2. Evalution of Image Analysis Result
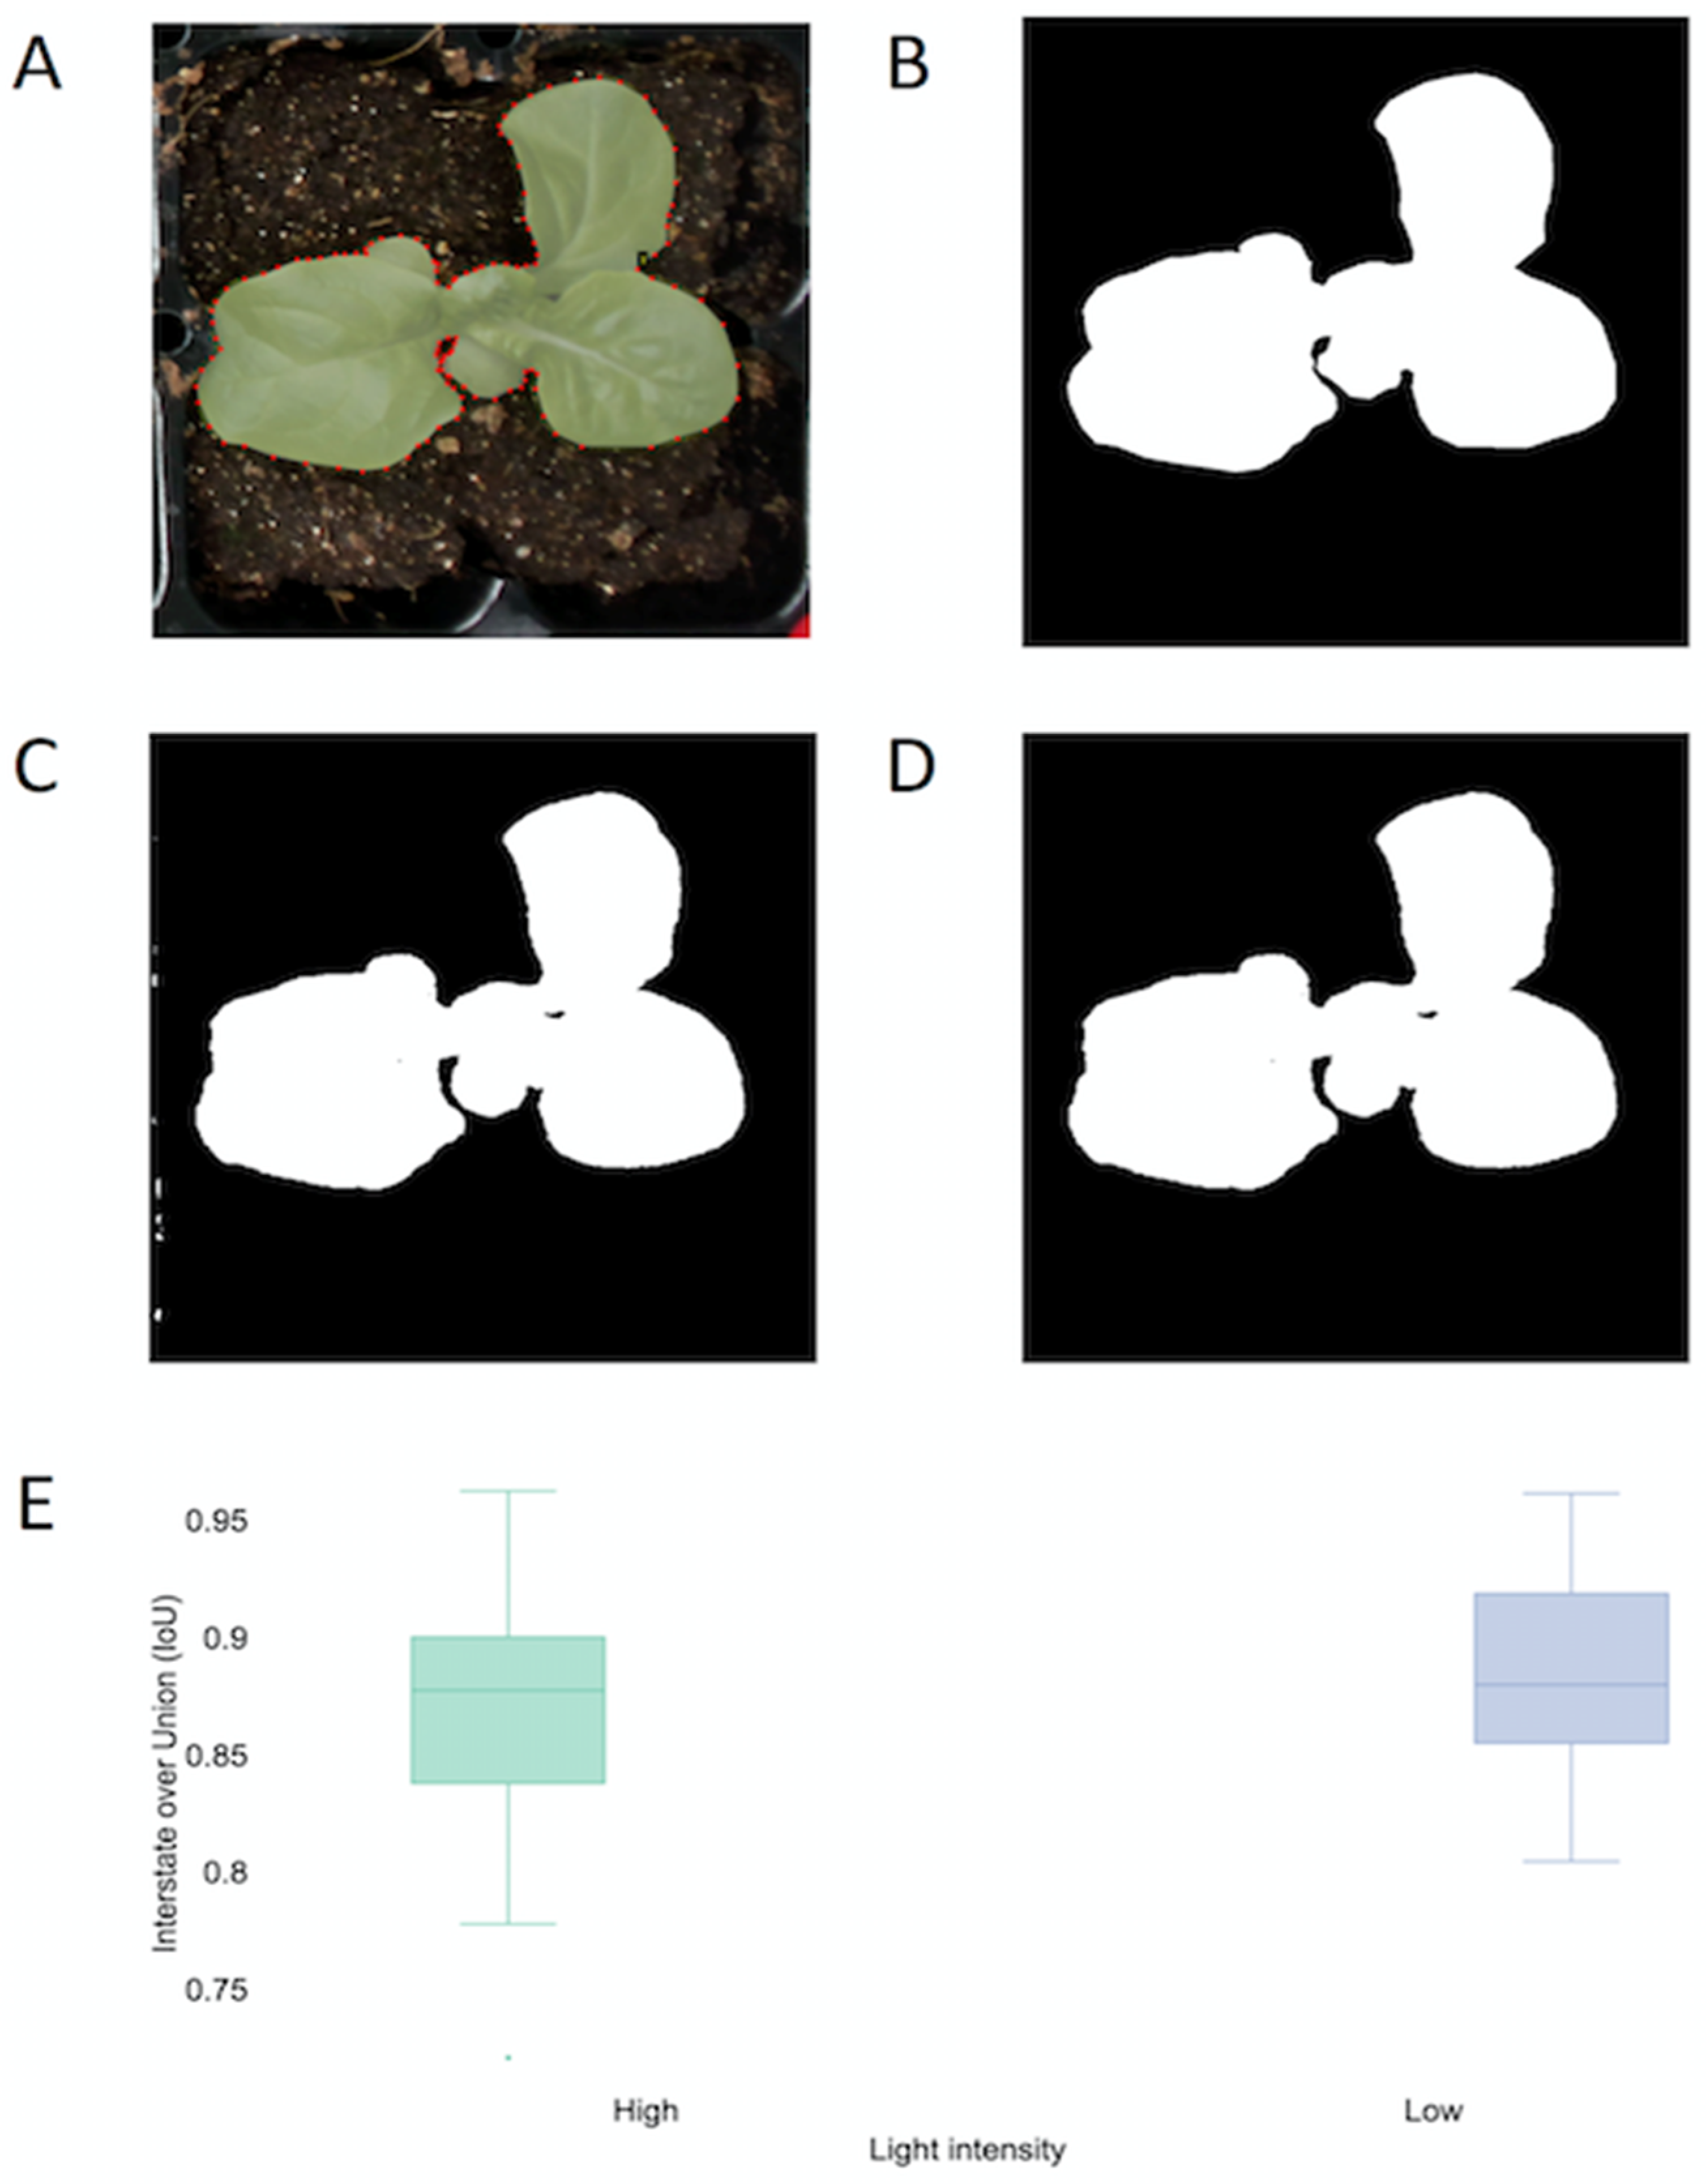
Thirty-five images of lettuce were randomly selected in HTPP one in various plants and growth stages. In addition, the same number of images were selected at HTPP two. Seventy images that were selected from the HTTP one and two were manually annotated (Figure 1A) with an annotation tool [8]. Binary transformation was applied on the annotated images using a polygon drawing function in the Python image library (PIL), and this binary image was defined as ground truth (GT) data for further analysis. Errors at the edge of the binary images from the pre-trained DL model were removed (Figure 1C,D) with post-processing. Figure 1B shows the comparison of the GT image and post-processed pre-trained image (Figure 1D) with intersection over union evaluation (IoU) in lettuce [16]. The IoU is known as the Jaccard index and is utilized for segmentation of images [17] and plant images [18]. The IoU scores for HTPPs one and two were calculated.
2.3. Growth Analysis and Statistical Analysis
The average PA with standard deviation was calculated using the native function in R (R Foundation for statically computing, Vienna, Austria) [19] and eight samples per 14 time-steps per day were visualized with Plotly [20]. For technical replication in the same environment, two randomly placed trays were compared. We then compared lettuce growth under different lighting conditions using the daily changes graph in Plotly (Plotly Technologies Inc., Montréal, QC, Canada) [20].
Statistical analyses were performed using R [19] for the selected time, 13:00, on 9, 12, and 18 days after sowing (DAS) to determine whether there were differences between the technical replications using t-test. The entire process was repeated for the effect of environmental variation for different lighting intensities at the same time on 14, 18, and 21 DAS using Duncan’s multiple range test, based on a significance level of p < 0.05.
3. Results
3.1. Evaluation of PA Extraction in Green Lettuce
In a previous study, the U-Net DL model accurately extracted the PA for Arabidopsis growth patterns [8]. This DL model was built for Arabidopsis, and in this model, the accuracies in the lettuce PA were needed to be checked before further analysis. The evaluation matrix had an IoU score that ranged from 0.8 to 0.97, with a median value of 0.88 in the HTPP one (Figure 1E). In a previous study, a crop segmentation study using an ML model obtained a yield of approximately 0.85 [21]. Therefore, although no lettuce image was used for the DL model, we obtained results that were comparable to those of the previous crop segmentation study. This showed the possibility of detecting seedling and mature lettuce even when pre-trained in different plant species. Furthermore, these results indicate that the extraction of the growth pattern of green lettuce in the time-series data was possible.
3.2. Lettuce Growth Analysis
The growth pattern analyzed with PA showed different growth rates on different dates in green lettuce (Figure 2). Previous lettuce studies suggested that initial growth was relatively slow, followed by a very rapid growth phase in various studies, including exposure to different lighting sources [22] and carbon dioxide levels [23]. In these studies, the PA or biomass of lettuce was measured days apart and showed very similar growth patterns. In this study, the growth patterns in hourly intervals and a previous study were compared [24]. In a previous study, a rapid growth phase 12 days after emergence (DAE) was found as well as a rapid growth phase 16 DAS or 13 DAE (Figure 2). The slight differences might be due to the different cultivars used in each study. Overall, our results indicate that image analysis using a pre-trained DL model is suitable for analyzing the growth pattern of lettuce in an environmentally controlled setting. This information is helpful for investigating interesting traits in lettuce given that it could detect drastic growth phases and changes in hours rather than days. The technical replication study showed reproducible results (p < 0.05) in lettuce placed in a slightly different location in HTPP one (Table 1).
3.3. Lettuce Growth at Differernt Lighting Intensities
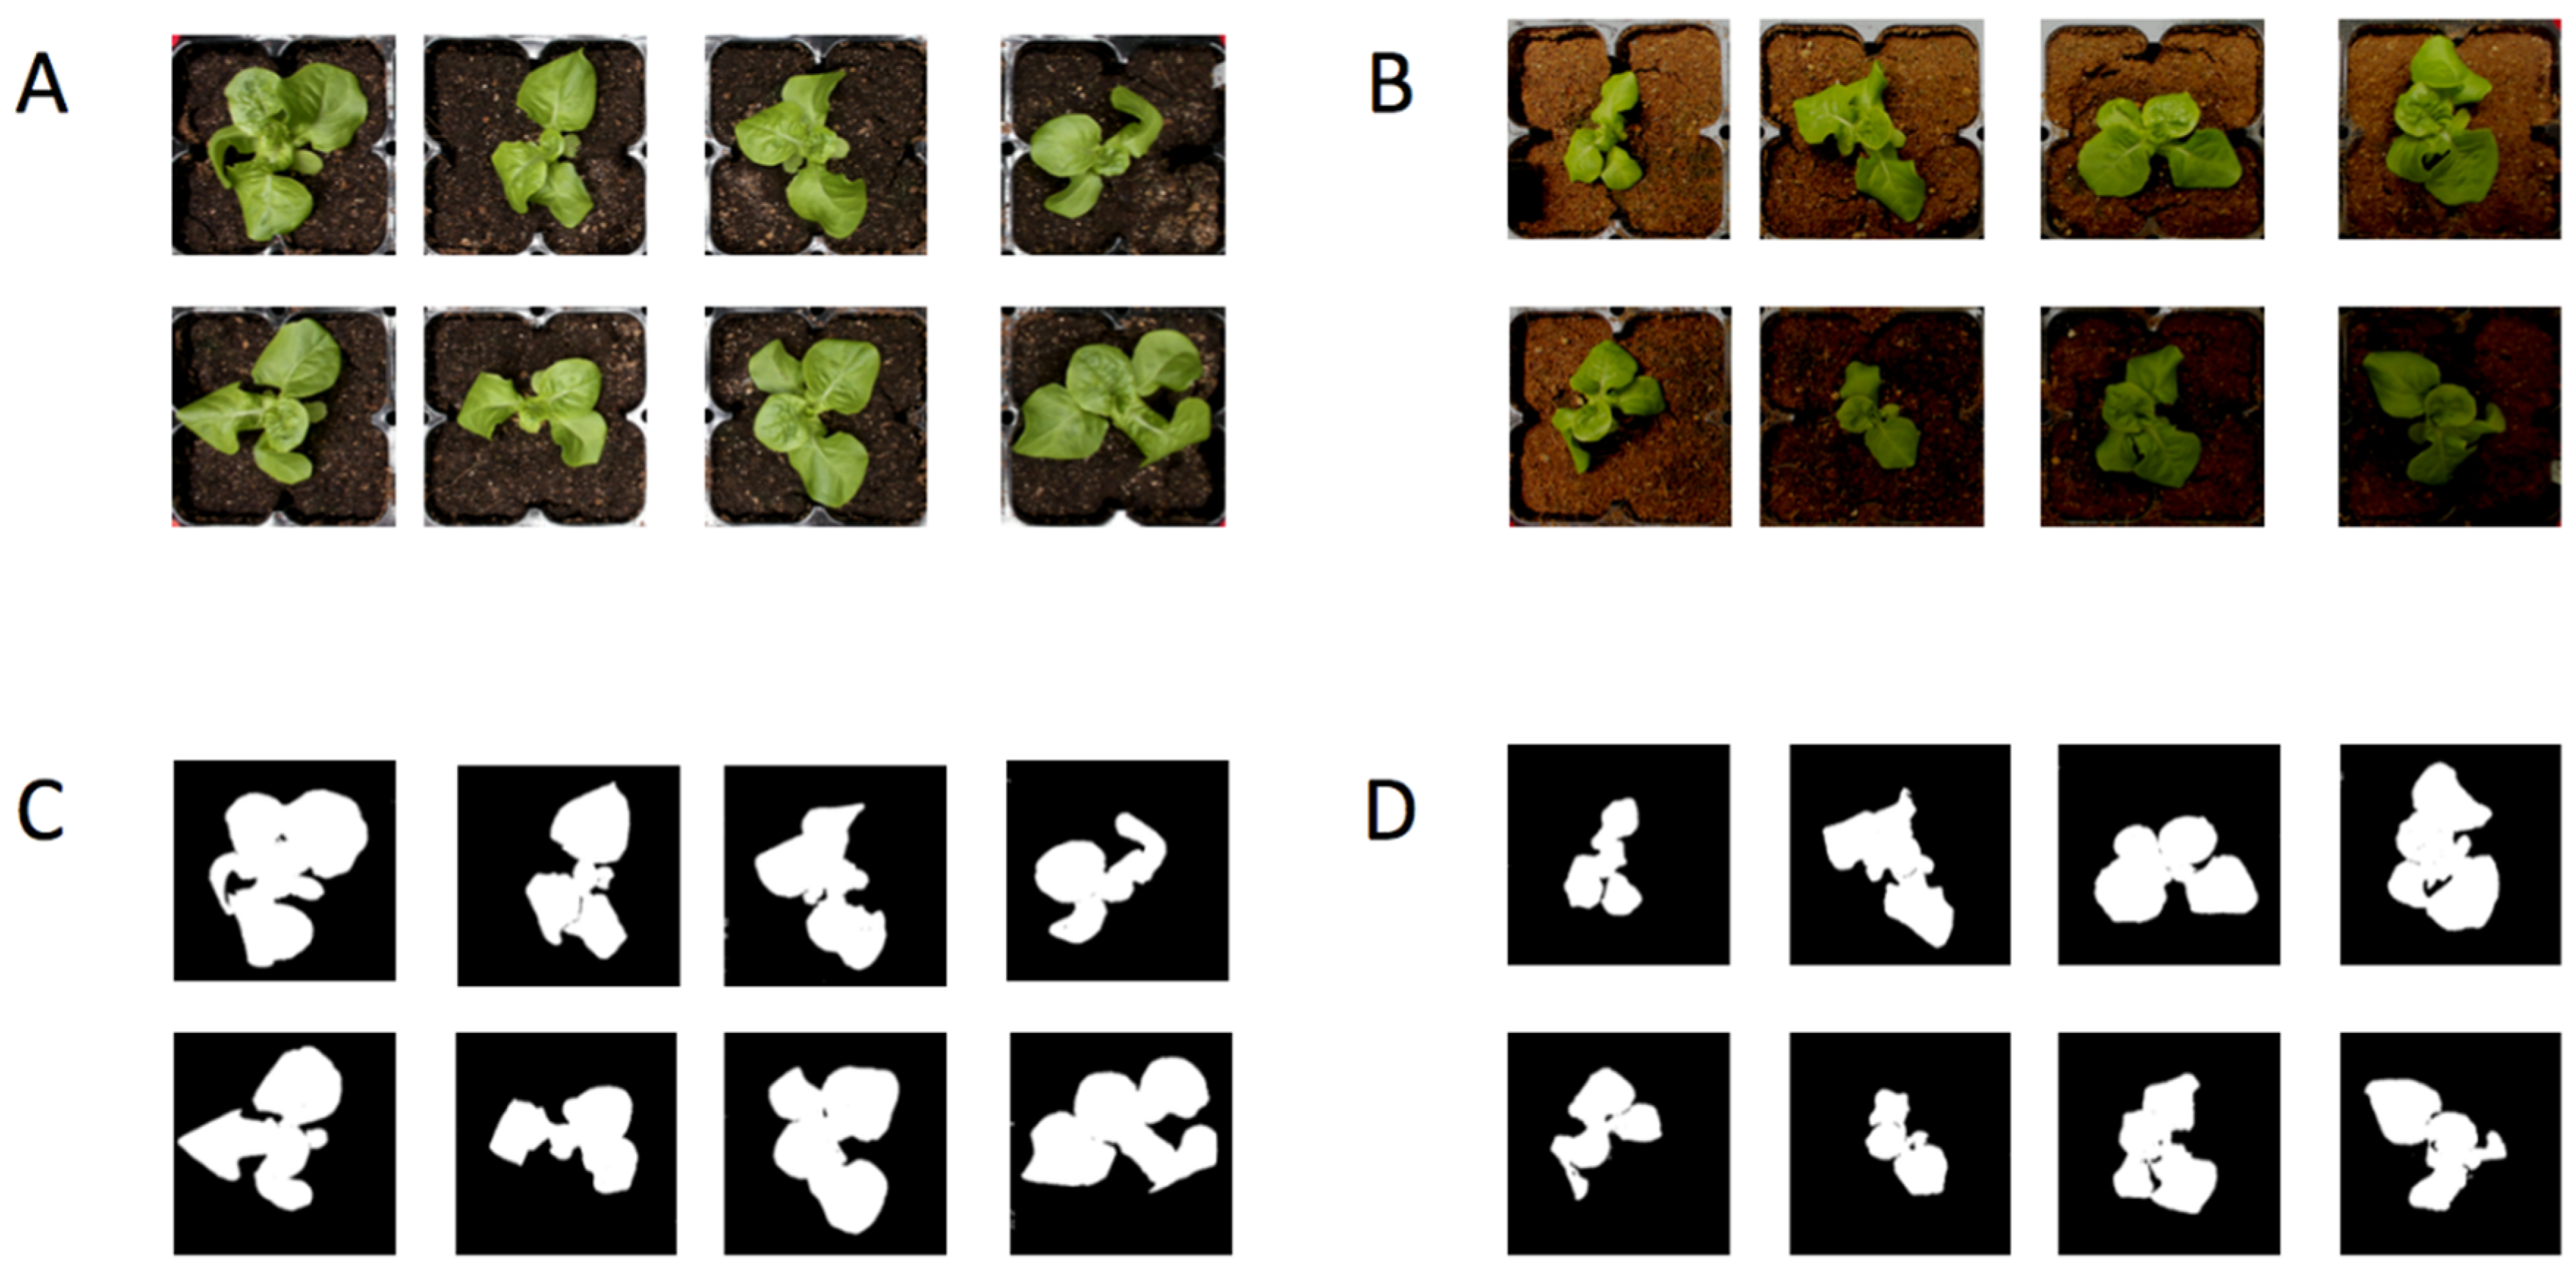
The HTPP one, which had the same lighting conditions as the pre-trained model, produced very uniform images of lettuce (Figure 3A) and accurate image analysis results (Figure 3C). At HTPP two, a black plastic dome was placed over the camera to remove excess light, and it showed lettuce images with various backgrounds (Figure 3B). Surprisingly, the pre-trained model accurately extracted the PA, even in various background images (Figure 3D).
In summary, the technical replication study showed that green cultivars grown in different trays did not differ from each other (Table 2) at 14, 18, and 21 DAS (p < 0.05). In addition, drastic changes were observed under different lighting conditions with technical replication in each environment (Supplementary Figure S1 and Table S2). The results indicate that the pre-trained DL model could be applied for the comparison of a large number of samples from different environments.
4. Discussion
Digital agriculture requires a lot of data for cultivation to maximize yield and select the optimal harvest time [2]. Even though the conventional practice utilized a large amount of data, only a small fraction of the data was quantified. The main reason for this is that a farmer accesses the current status of a plant with experience and intuition, but little plant data are recorded. The emerging inexpensive image sensors [4] lead to the acquisition of more quantitative data for each crop in different environments. In addition, more uniform data acquired from the HTPP is expected [25]. This would enable the accumulation of image data to study agronomical traits in the future [26].
The quality of image processed output for agriculture data has improved significantly since the process is utilized using ML and DL [9]. Machine learning- and DL-based methods have been applied in various crops and model plants, and they demonstrated the effectiveness of the process [9]. However, DL models constructed for crops require significant amounts of time and resources [12], given that each model requires training data, and the data is generated by manual labeling of individual images for specific traits [27]. In addition, the pre-and post-processing steps to acquire quality data require effort. Thus, the construction of an entire image analysis pipeline might not be achievable for a small research group to analyze images [14]. Therefore, it is necessary for small researchers to utilize pre-trained DL models in non-target species for interesting traits in their target species.
A pre-trained general DL model called the VGG-16 model was applied for plant disease detection studies [28] but the VGG-16 model was not built for a plant. A previous study utilized generally built pre-trained DL for disease detection, and there have been no known studies for the agronomical traits in crops. To the best of our knowledge, this is the first study to utilize pre-trained DL for target plants in non-target plants. Arabidopsis and lettuce are completely different species but share a similar genetic leaf shape controlling mechanism; thus, the leaf shape characteristics are similar. The lettuce seedlings and mature plants were accurately detected with the Arabidopsis pre-trained model (Figure 1E). In addition, this study showed that a very fine-scale growth pattern analysis was possible with reproducible results. The U-Net could have analyzed the leaf shape information in order to separate it from the soil or background information, even though it is almost impossible to understand learned information (features) from a pre-trained DL model. Future research on whether learned information from a pre-trained DL model transfer information into a new DL model [27], also known as “transfer learning”, for interesting traits in different plant species could be performed. The method significantly reduced the efforts needed to train and utilize the DL model for agronomical traits because relatively little information is needed to construct new DL models [27]. The phenotypic effect of lighting in lettuce has been well documented in multiple studies [22,29]. However, time-series responses in different lighting conditions are difficult to find, given that the image analysis pipeline utilized limited images in a few environment settings. As a result, the image analysis pipeline performed very well in a specific dataset. Even in DL-based models, limited annotated images perform very well in a specific environment [15]. Recently, fully documented time-series data have been available [12] but they were tested in two growing seasons in a greenhouse for various environmental factors, including lighting. At this point, fully documented time-series data on the effects of lighting are not available.
The increased volume of images that require up-to-date image analysis tools [9] and DL models [12] could provide solutions future applications. This study showed the possibility of applying pre-trained DL to study interesting traits in different species with less effort. This could be a very cost-effective process when groups of botanists and image scientists develop generalized tools for botanists who have little or no prior knowledge of ML or DL models.
5. Conclusions
The pre-trained model showed accurate results, expressed as an IoU score as high as 0.97, in extracting lettuce growth patterns under the same environmental conditions as Arabidopsis. The reproducible result confirmed by statistical test (t-test) between replication measurement on 9, 12, and 18 DAS. Moreover, lettuce grown under the two lighting conditions showed significant separation on 14, 18 and 21 DAS between the two environments (p < 0.05). This study clearly indicates the feasibility of applying a pre-trained DL model to analyze the growth patterns of another crop under various environmental conditions.
Supplementary Materials
The following are available online at https://0-www-mdpi-com.brum.beds.ac.uk/article/10.3390/agriculture11090890/s1, Figure S1: Comparing the growth pattern of a green lettuce between the two lighting conditions. The results are presented as the mean of eight samples for each tray at different conditions. Each tray had a lighting condition of 200 μmol ms−1 s−1 (A1) with replication (A2) and a lighting condition at 400 μmol L ms−1 s−1 (B1) with replication (B2).
Author Contributions
Conceptualization, S.C. and J.-B.K.; methodology, S.C.; software, U.L.; validation, S.C.; formal analysis, S.C.; investigation, S.C., M.J.H. and J.-B.K.; data curation, S.C. and U.L.; writing—original draft preparation, S.C., U.L., M.J.H., Y.D.J. and J.-B.K.; writing—review and editing, S.C., M.J.H., Y.D.J. and J.-B.K.; supervision, J.-B.K.; project administration, J.-B.K.; funding acquisition, J.-B.K. All authors have read and agreed to the published version of the manuscript.
Funding
This work was supported by grants from the Nuclear R & D programs of the Ministry of Science and ICT (MSIT) and the research program of KAERI, Republic of Korea.
Data Availability Statement
Data available upon request.
Conflicts of Interest
The authors declare no conflict of interest.
References
- Godfray, H.C.J.; Beddington, J.R.; Crute, I.R.; Haddad, L.; Lawrence, D.; Muir, J.F.; Pretty, J.; Robinson, S.; Thomas, S.M.; Toulmin, C. Food security: The challenge of feeding 9 billion people. Science 2010, 327, 812. [Google Scholar] [CrossRef] [Green Version]
- Klerkx, L.; Jakku, E.; Labarthe, P. A review of social science on digital agriculture, smart farming and agriculture 4.0: New contributions and a future research agenda. NJAS-Wagening. J. Life Sci. 2019, 90–91, 100315. [Google Scholar] [CrossRef]
- Furbank, R.T.; Tester, M. Phenomics—Technologies to relieve the phenotyping bottleneck. Trends Plant Sci. 2011, 16, 635–644. [Google Scholar] [CrossRef]
- Pieruschka, R.; Schurr, U. Plant phenotyping: Past, present, and future. Plant Phenomics 2019, 26, 7507131. [Google Scholar] [CrossRef]
- Lee, U.; Chang, S.; Putra, G.A.; Kim, H.; Kim, D.H. An automated, high-throughput plant phenotyping system using machine learning-based plant segmentation and image analysis. PLoS ONE 2018, 13, e0196615. [Google Scholar] [CrossRef] [PubMed] [Green Version]
- Nagano, S.; Moriyuki, S.; Wakamori, K.; Mineno, H.; Fukuda, H. Leaf-movement-based growth prediction model using optical flow analysis and machine learning in plant factory. Front. Plant Sci. 2019, 10, 227. [Google Scholar] [CrossRef] [PubMed]
- Jiang, H. The analysis of plants image recognition based on deep learning and artificial neural network. IEEE Access 2020, 8, 68828–68841. [Google Scholar]
- Chang, S.; Lee, U.; Hong, M.J.; Jo, Y.D.; Kim, J.-B. High-throughput phenotyping (htp) data reveal dosage effect at growth stages in arabidopsis thaliana irradiated by gamma rays. Plants 2020, 9, 557. [Google Scholar] [CrossRef]
- Jiang, Y.; Li, C. Convolutional neural networks for image-based high-throughput plant phenotyping: A review. Plant Phenomics 2020, 9, 4152816. [Google Scholar] [CrossRef] [PubMed] [Green Version]
- Toda, Y.; Okura, F.; Ito, J.; Okada, S.; Kinoshita, T.; Tsuji, H.; Saisho, D. Training instance segmentation neural network with synthetic datasets for crop seed phenotyping. Commun. Biol. 2020, 3, 173. [Google Scholar] [CrossRef] [Green Version]
- Gao, J.; French, A.P.; Pound, M.P.; He, Y.; Pridmore, T.P.; Pieters, J.G. Deep convolutional neural networks for image-based convolvulus sepium detection in sugar beet fields. Plant Methods 2020, 16, 29. [Google Scholar] [CrossRef] [Green Version]
- Zhang, L.; Xu, Z.; Xu, D.; Ma, J.; Chen, Y.; Fu, Z. Growth monitoring of greenhouse lettuce based on a convolutional neural network. Hortic. Res. 2020, 7, 124. [Google Scholar] [CrossRef]
- Ronneberger, O.; Fischer, P.; Brox, T. U-net: Convolutional networks for biomedical image segmentation. In International Conference on Medical Image Computing and Computer-Assisted Intervention; Springer: Cham, Switzerland, 2015; pp. 234–241. [Google Scholar]
- Gehan, M.A.; Fahlgren, N.; Abbasi, A.; Berry, J.C.; Callen, S.T.; Chavez, L.; Doust, A.N.; Feldman, M.J.; Gilbert, K.B.; Hodge, J.G.; et al. Plantcv v2: Image analysis software for high-throughput plant phenotyping. PeerJ 2017, 5, e4088. [Google Scholar] [CrossRef]
- Sladojevic, S.; Arsenovic, M.; Anderla, A.; Culibrk, D.; Stefanovic, D. Deep neural networks based recognition of plant diseases by leaf image classification. Comput. Intell. Neurosci. 2016, 2016, 3289801. [Google Scholar] [CrossRef] [PubMed] [Green Version]
- Du, J.; Lu, X.; Fan, J.; Qin, Y.; Yang, X.; Guo, X. Image-based high-throughput detection and phenotype evaluation method for multiple lettuce varieties. Front. Plant Sci. 2020, 11, 56386. [Google Scholar] [CrossRef] [PubMed]
- Everingham, M.; Van Gool, L.; Williams, C.K.I.; Winn, J.; Zisserman, A. The pascal visual object classes (voc) challenge. Int. J. Comput. Vis. 2010, 88, 303–338. [Google Scholar] [CrossRef] [Green Version]
- Feng, X.; Zhan, Y.; Wang, Q.; Yang, X.; Yu, C.; Wang, H.; Tang, Z.; Jiang, D.; Peng, C.; He, Y. Hyperspectral imaging combined with machine learning as a tool to obtain high-throughput plant salt-stress phenotyping. Plant J. 2020, 101, 1448–1461. [Google Scholar] [CrossRef]
- R Core Team. R: A Language and Environment for Statistical Computing, Version 3.2.2; R Foundation for Statistical Computing: Vienna, Austria, 2019. [Google Scholar]
- Plotly Technologies. Collaborative Data Science; Plotly Technologies Inc.: Montréal, QC, Canada, 2015. [Google Scholar]
- Haug, S.; Ostermann, J. A crop/weed field image dataset for the evaluation of computer vision based precision agriculture tasks. In European Conference on Computer Vision; Springer: Cham, Switzerland, 2014; pp. 105–116. [Google Scholar]
- Han, T.; Vaganov, V.; Cao, S.; Li, Q.; Ling, L.; Cheng, X.; Peng, L.; Zhang, C.; Yakovlev, A.N.; Zhong, Y.; et al. Improving “color rendering” of led lighting for the growth of lettuce. Sci. Rep. 2017, 7, 45944. [Google Scholar] [CrossRef]
- Jung, D.; Kim, D.; Yoon, H.; Moon, T.; Park, K.; Son, J. Modeling the canopy photosynthetic rate of romaine lettuce (Lactuca sativa L.) grown in a plant factory at varying CO2 concentrations and growth stages. Hortic. Environ. Biotechnol. 2016, 57, 487–492. [Google Scholar] [CrossRef]
- Klassen, S.; Ritchie, G.; Frantz, J.; Pinnock, D.; Bugbee, B. Real-time imaging of ground cover: Relationships with radiation capture, canopy photosynthesis, and daily growth rate. Digit. Imaging Spectr. Tech. Appl. Precis. Agric. Crop. Physiol. 2004, 66, 1–14. [Google Scholar] [CrossRef] [Green Version]
- Tardieu, F.; Cabrera-Bosquet, L.; Pridmore, T.; Bennett, M. Plant phenomics, from sensors to knowledge. Curr. Biol. 2017, 27, R770–R783. [Google Scholar] [CrossRef] [PubMed]
- Weersink, A.; Fraser, E.; Pannell, D.; Duncan, E.; Rotz, S. Opportunities and challenges for big data in agricultural and environmental analysis. Annu. Rev. Resour. Econ. 2018, 10, 19–37. [Google Scholar] [CrossRef]
- Yuan, Y.; Fang, S.; Chen, L. Crop disease image classification based on transfer learning with dcnns. In Chinese Conference on Pattern Recognition and Computer Vision (PRCV); Springer: Cham, Switzerland, 2018; pp. 457–468. [Google Scholar]
- Krishnaswamy Rangarajan, A.; Purushothaman, R. Disease classification in eggplant using pre-trained vgg16 and msvm. Sci. Rep. 2020, 10, 2322. [Google Scholar] [CrossRef] [PubMed] [Green Version]
- Van Henten, E.J. Validation of a dynamic lettuce growth model for greenhouse climate control. Agric. Syst. 1994, 45, 55–72. [Google Scholar] [CrossRef]
Figure 1.
Summary of extract projected area (PA) between ground truth (GT) and U-Net model at two lighting intensities. Thirty-five images were selected at various plant and growth stages in a random manner. (A) Manual labeling of the leaf area of a selected lettuce image. (B) Binary transformation (PA) of GT for the lettuce image. (C) Binary transformation (PA) of the selected image with U-Net. (D) Binary transformation (PA) with U-Net using the error correction method. (E) Comparing accuracies of extract PA between the GT and U-Net models using the Jaccard index.

Figure 2.
Comparing the growth pattern of the green lettuce cultivar between technical replications. Images were acquired between 07:00 to 20:00 in a 1-h interval. The results are presented as the mean of each time point from replication one (n = 8) and replication two (n = 8).
Figure 2.
Comparing the growth pattern of the green lettuce cultivar between technical replications. Images were acquired between 07:00 to 20:00 in a 1-h interval. The results are presented as the mean of each time point from replication one (n = 8) and replication two (n = 8).

Figure 3.
Visualized of cropped and processed images of green lettuce at 19 days after sowing (DAS). (A) Cropped individual lettuce images at 200 μmol ms−1 s−1. (B) Cropped individual lettuce images at 400 μmol ms−1 s−1. (C) Visualized image analysis result of lettuce at 200 μmol ms−1 s−1. (D) Visualized image analysis result of lettuce at 200 μmol ms−1 s−1.


Table 1.
Comparing projected area (PA) of green lettuce at fixed lighting condition (200 μmol ms−1 s−1) on multiple days after sowing (DAS) and time. Values in the same column followed by an asterix are significantly different (p < 0.05).
Table 1.
Comparing projected area (PA) of green lettuce at fixed lighting condition (200 μmol ms−1 s−1) on multiple days after sowing (DAS) and time. Values in the same column followed by an asterix are significantly different (p < 0.05).
| DAS | Time (24 h) | Replication | PA (cm2) |
|---|---|---|---|
| 9 | 13:00 | One | 1.8394 |
| 13:00 | Two | 2.2356 | |
| 12 | 13:00 | One | 3.9754 |
| 13:00 | Two | 4.6765 | |
| 18 | 13:00 | One | 32.3245 |
| 13:00 | Two | 30.7201 |
Table 2.
Comparing projected area (PA) of green lettuce at two lighting conditions on multiple days after sowing (DAS). Values in the same column followed by a different letter are significantly different (p < 0.05).
Table 2.
Comparing projected area (PA) of green lettuce at two lighting conditions on multiple days after sowing (DAS). Values in the same column followed by a different letter are significantly different (p < 0.05).
| DAS | Light Condition | Replication | PA (cm2) |
|---|---|---|---|
| 14 | 200 μmol ms−1 s−1 | One | 7.8281a |
| 200 μmol ms−1 s−1 | Two | 8.6423a | |
| 400 μmol ms−1 s−1 | One | 6.3605b | |
| 400 μmol ms−1 s−1 | Two | 5.5361b | |
| 18 | 200 μmol ms−1 s−1 | One | 33.1341a |
| 200 μmol ms−1 s−1 | Two | 31.8327a | |
| 400 μmol ms−1 s−1 | One | 21.4811b | |
| 400 μmol ms−1 s−1 | Two | 19.9635b | |
| 21 | 200 μmol ms−1 s−1 | One | 74.2587a |
| 200 μmol ms−1 s−1 | Two | 69.8884a | |
| 400 μmol ms−1 s−1 | One | 45.7692b | |
| 400 μmol ms−1 s−1 | Two | 46.1067b |
Publisher’s Note: MDPI stays neutral with regard to jurisdictional claims in published maps and institutional affiliations. |
© 2021 by the authors. Licensee MDPI, Basel, Switzerland. This article is an open access article distributed under the terms and conditions of the Creative Commons Attribution (CC BY) license (https://creativecommons.org/licenses/by/4.0/).
Share and Cite
MDPI and ACS Style
Chang, S.; Lee, U.; Hong, M.J.; Jo, Y.D.; Kim, J.-B. Lettuce Growth Pattern Analysis Using U-Net Pre-Trained with Arabidopsis. Agriculture 2021, 11, 890. https://0-doi-org.brum.beds.ac.uk/10.3390/agriculture11090890
AMA Style
Chang S, Lee U, Hong MJ, Jo YD, Kim J-B. Lettuce Growth Pattern Analysis Using U-Net Pre-Trained with Arabidopsis. Agriculture. 2021; 11(9):890. https://0-doi-org.brum.beds.ac.uk/10.3390/agriculture11090890
Chicago/Turabian StyleChang, Sungyul, Unseok Lee, Min Jeong Hong, Yeong Deuk Jo, and Jin-Baek Kim. 2021. "Lettuce Growth Pattern Analysis Using U-Net Pre-Trained with Arabidopsis" Agriculture 11, no. 9: 890. https://0-doi-org.brum.beds.ac.uk/10.3390/agriculture11090890
Note that from the first issue of 2016, this journal uses article numbers instead of page numbers. See further details here.