
Feminization of Agriculture: Do Female Farmers Have Higher Expectations for the Value of Their Farmland?—Empirical Evidence from China


Abstract
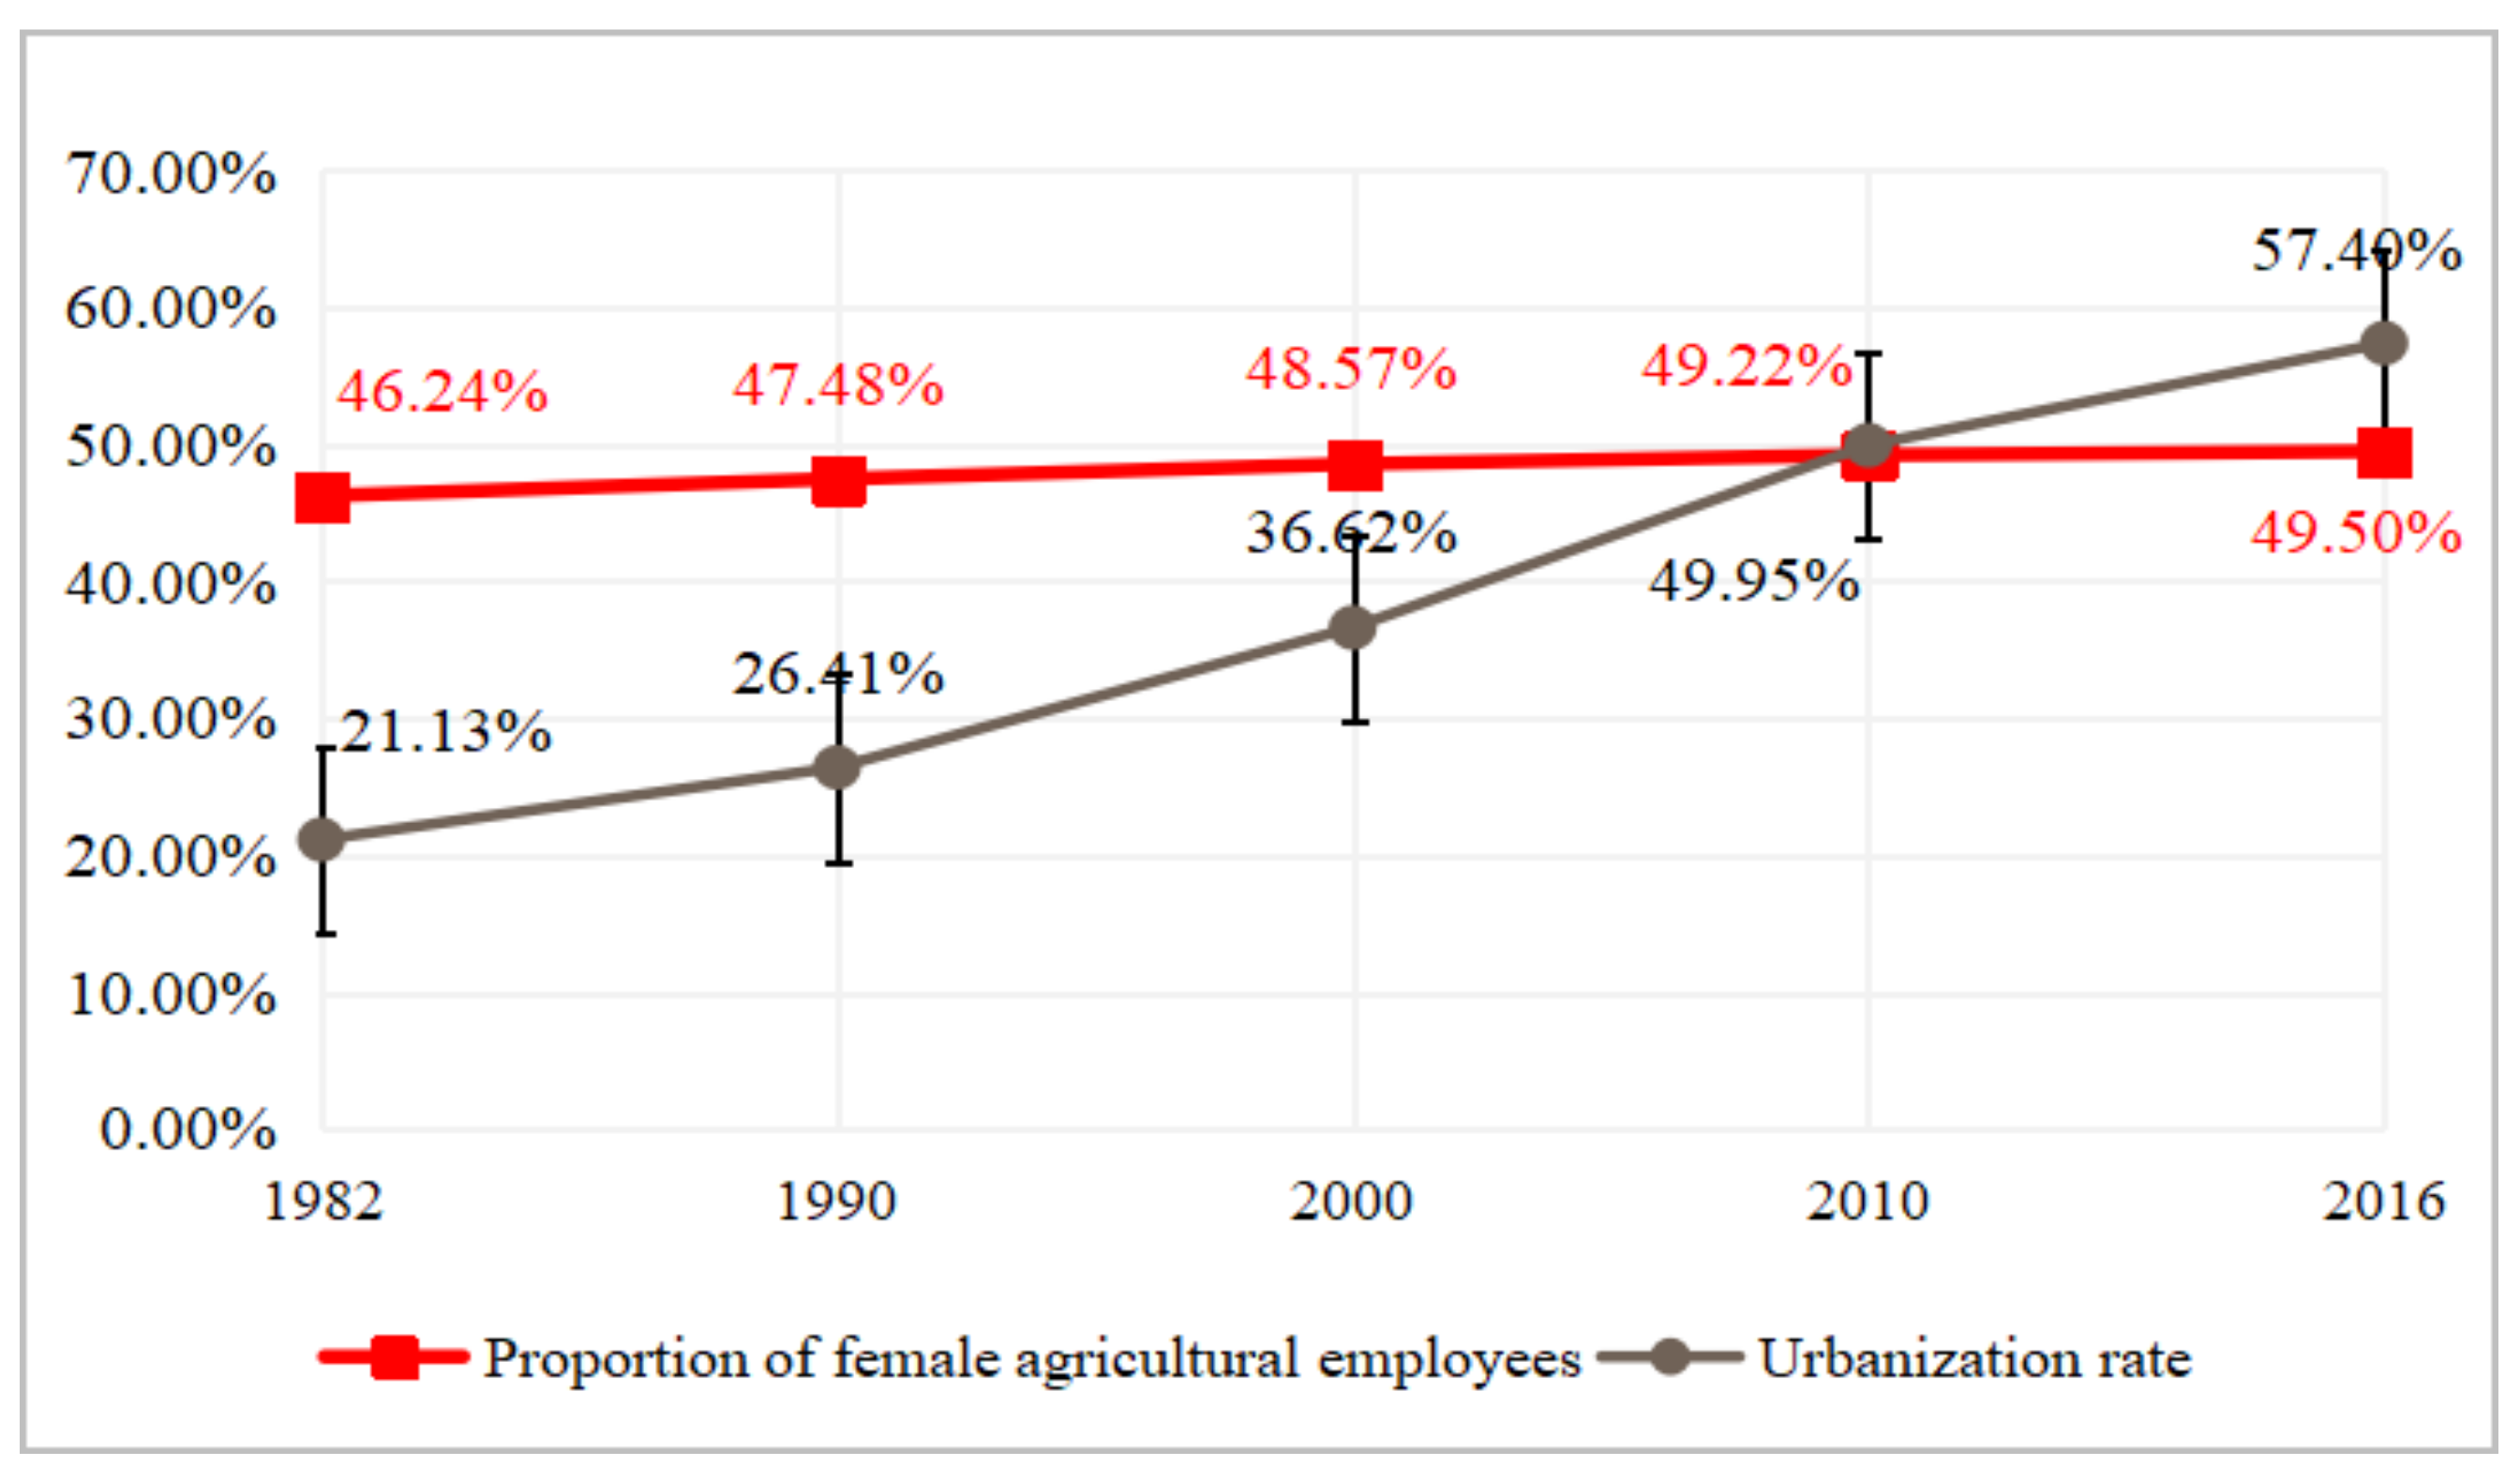
:1. Introduction
2. Theoretical Analysis Framework and Research Hypothesis
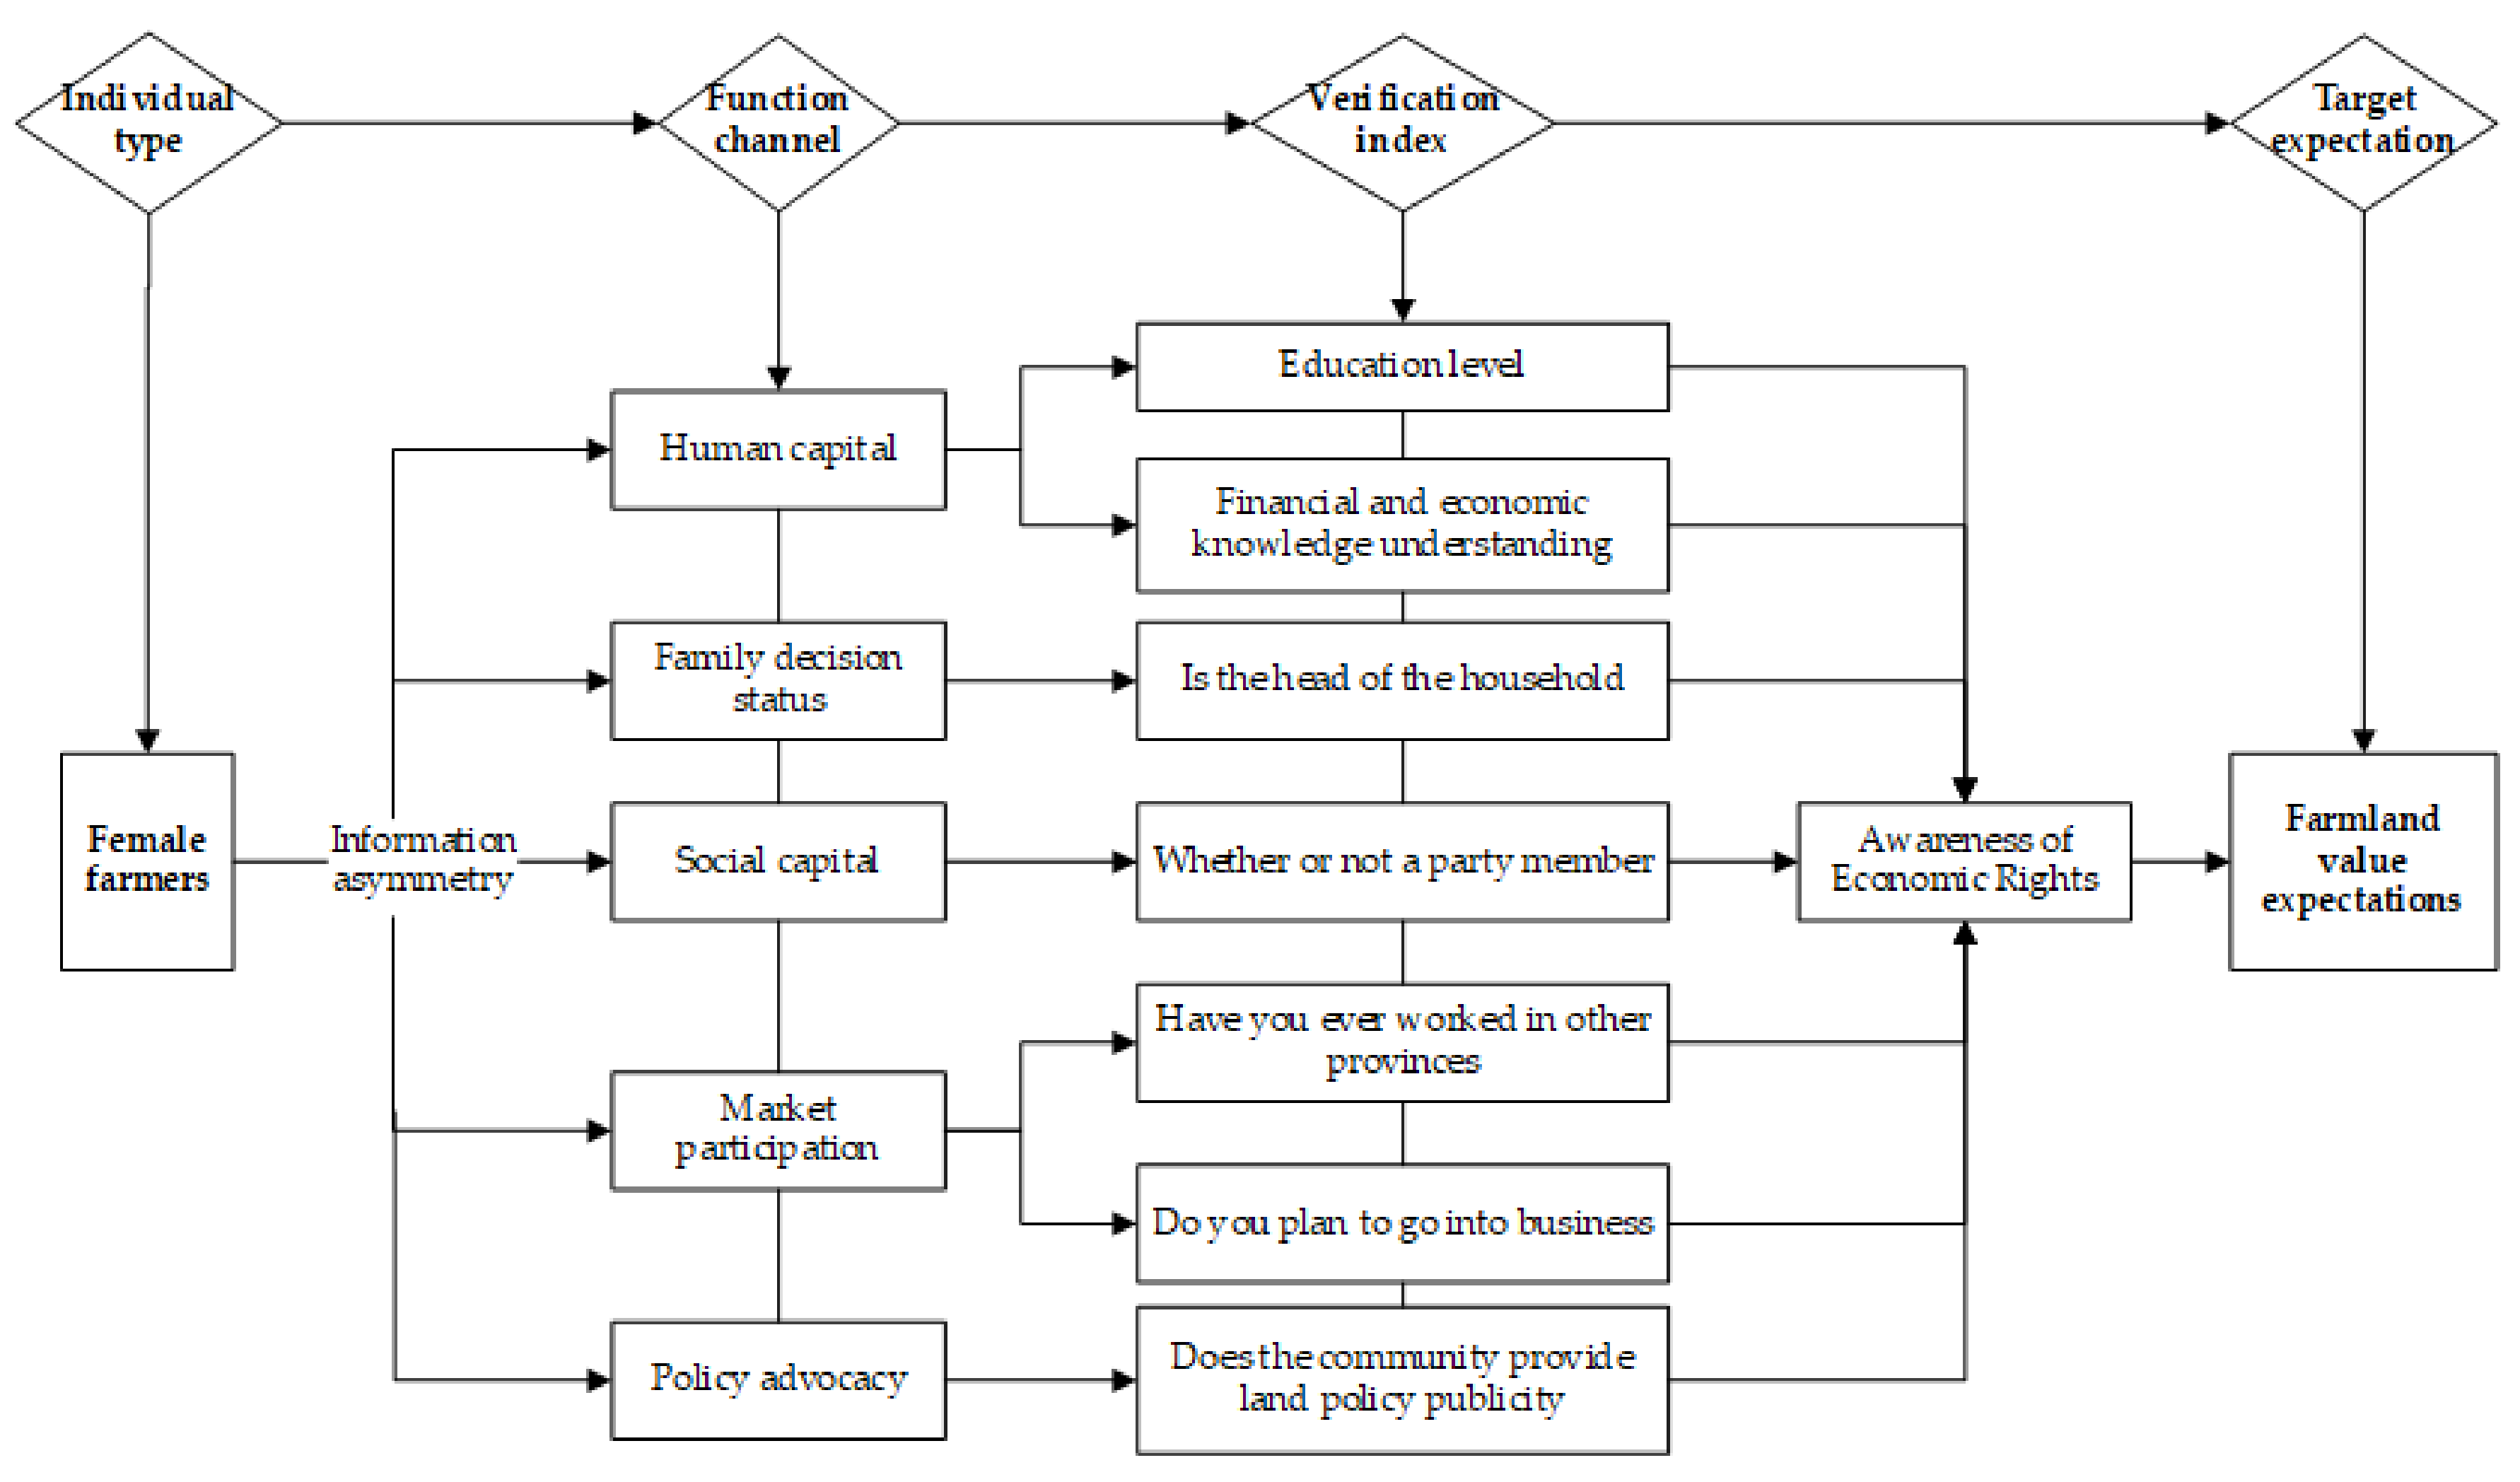
2.1. Theoretical Analysis Framework
2.2. Research Hypothesis
3. Data, Variables, and Method
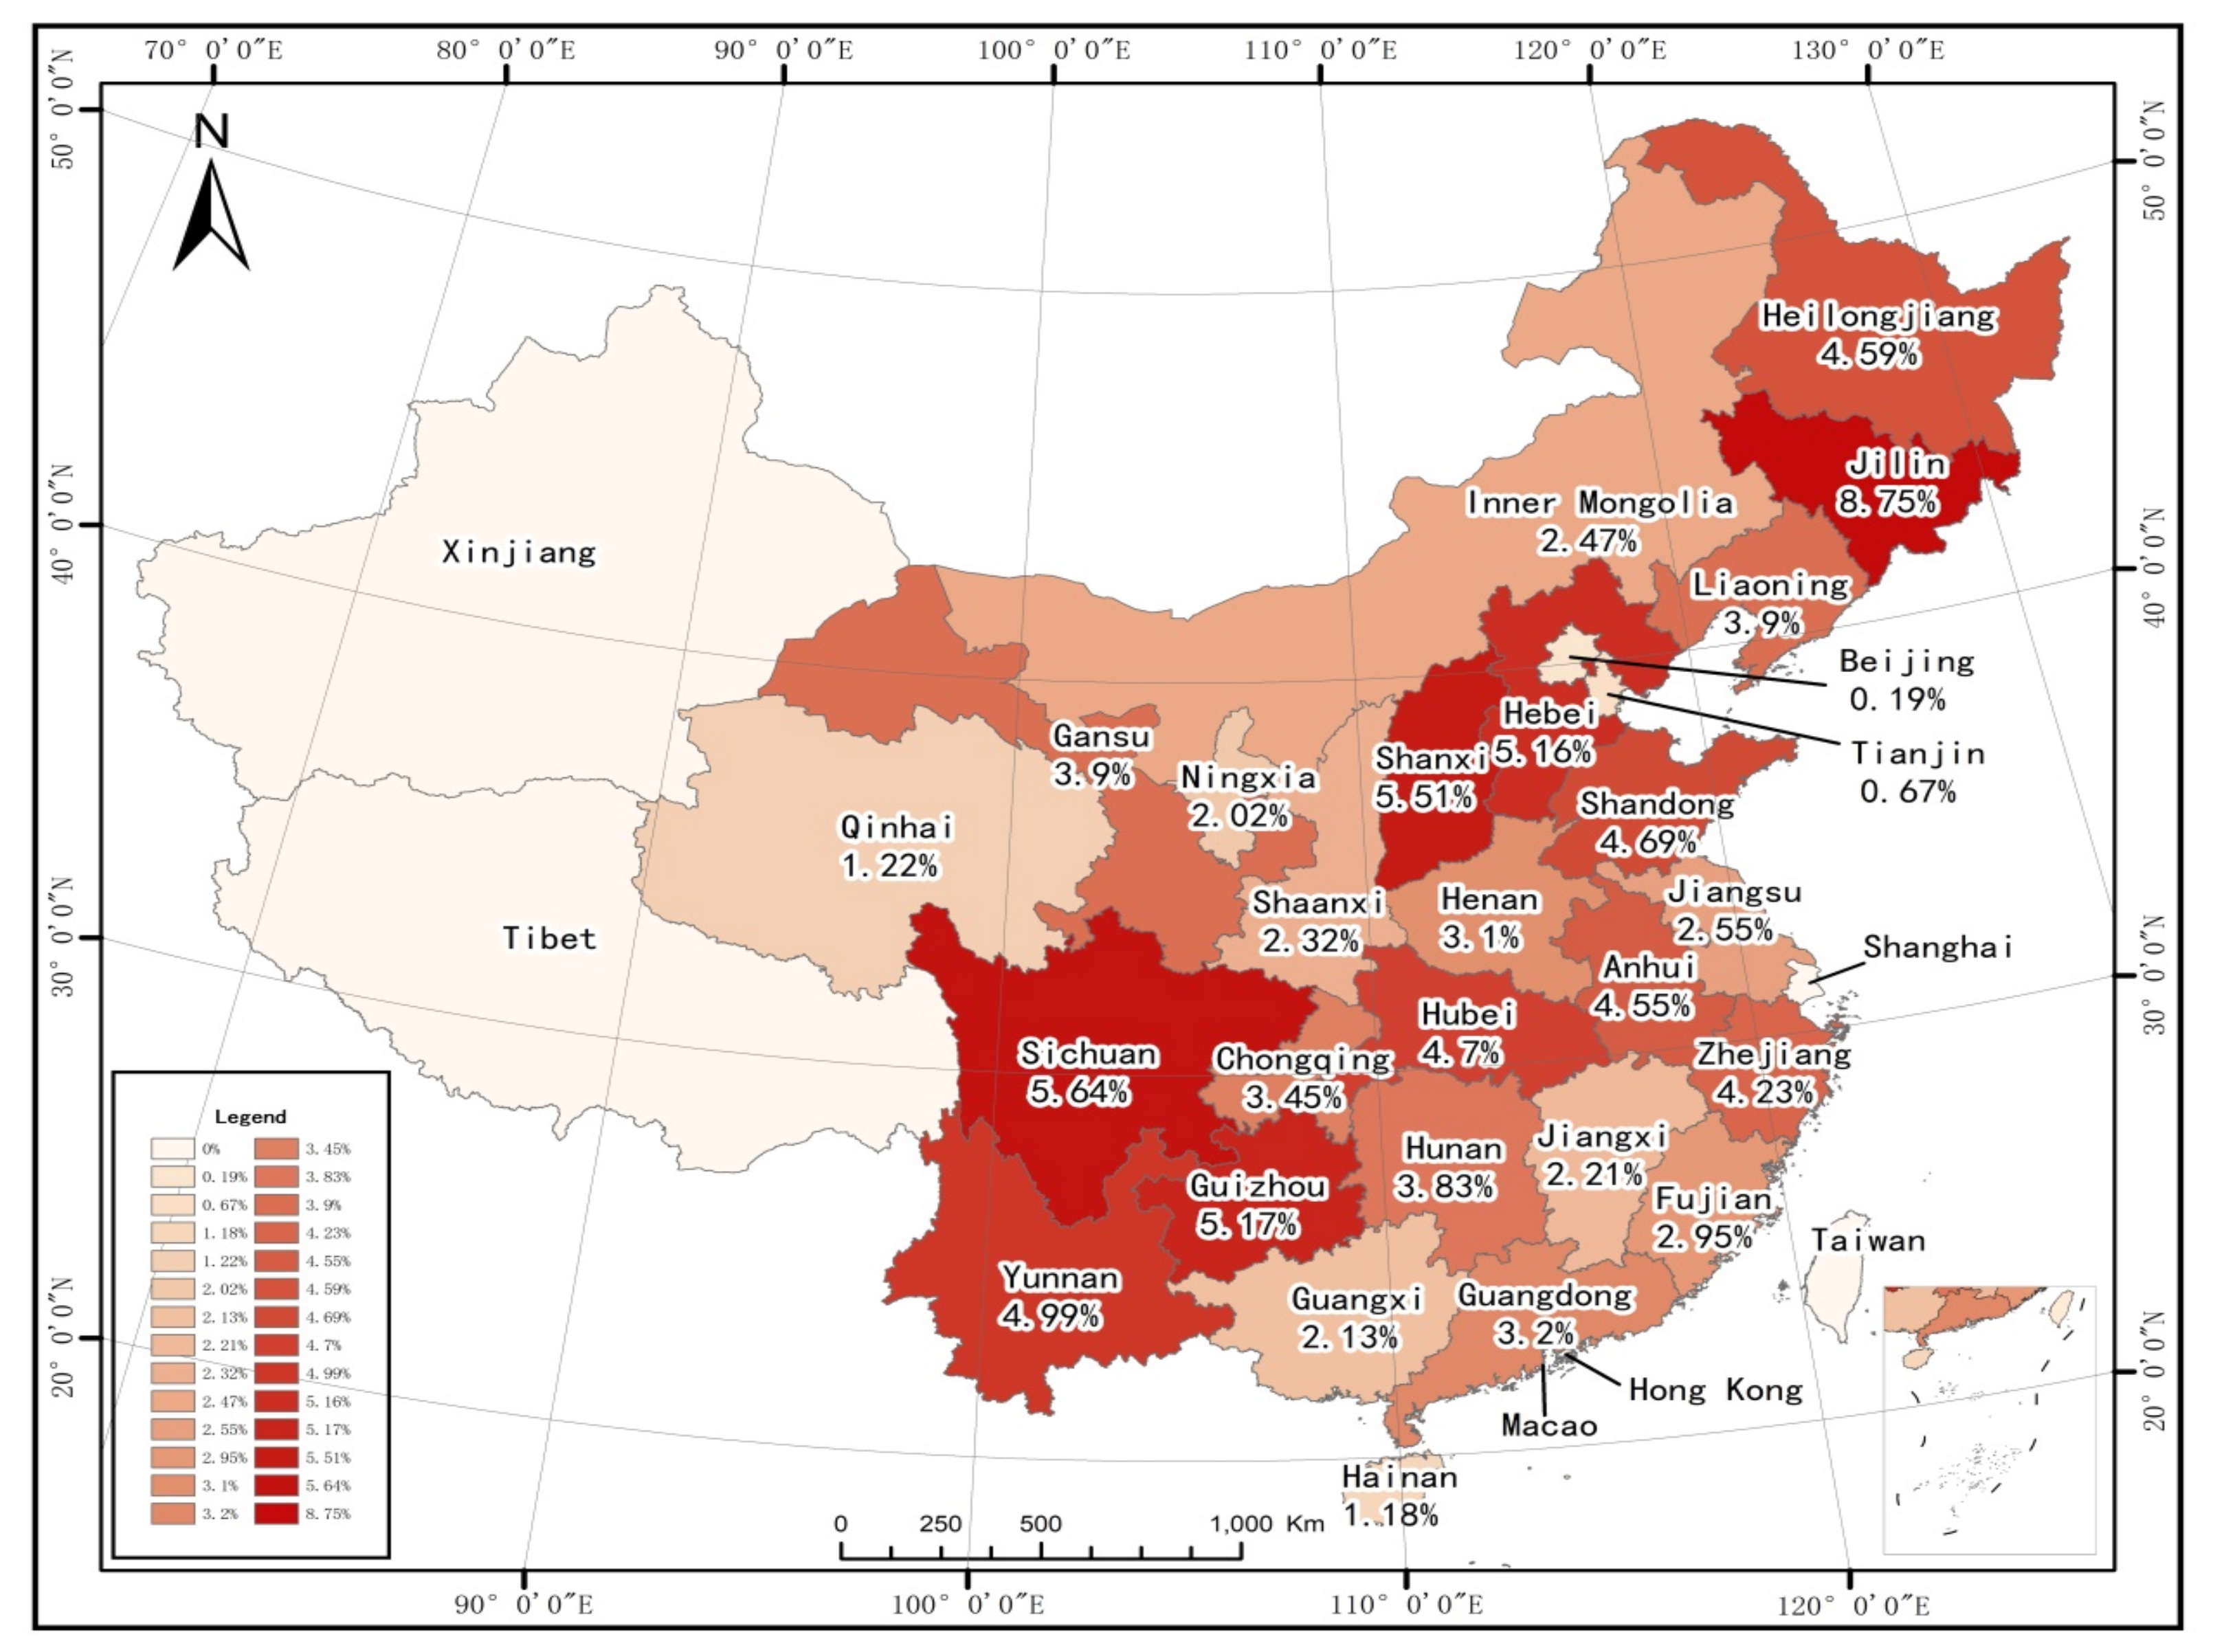
3.1. Data
3.2. Variables
3.2.1. The Explained Variable
3.2.2. The Core Explanatory Variables
3.2.3. The Control Variables
3.3. Methods
4. Results
4.1. Descriptive Statistical Analysis
4.2. Empirical Results and Explanations
4.2.1. Basic Linear Regression Results
4.2.2. Heterogeneity Analysis
4.2.3. Analysis of the Underlying Mechanisms
5. Discussion, Conclusions and Enlightenment
5.1. Discussion
5.2. Conclusions
- (a)
- In the context of the feminization of agriculture, female farmers less attentive to policy and have a more urgent need to transfer to nonagricultural work, leading them to have significantly lower expectations for the value of their farmland than male farmers;
- (b)
- Among female farmers, those who are located in areas with higher levels of economic and social development and who have a higher level of educational attainment have higher expectations for the value of their farmland;
- (c)
- The confirmation and certification of farmland rights, per capita household income levels, experience with land sales, educational attainment, and willingness to engage in business all have significant positive effects on expectations for agricultural land values. Farmers with more experience with land sales, higher educational attainment, and a greater willingness to engage in business have higher expectations for the value of their farmland;
- (d)
- The extent to which farmers are dependent on their farmland for income, their age, and the per capita area of farmland owned by their household (the scarcity of farmland) have significantly negative impacts on their expectations for the value of their farmland. Farmers who are more dependent on their farmland for income and who have less farmland per capita have higher expectations for the value of their farmland, while older households have lower expectations. For rural households, farmland may act as a “warehouse” for family wealth accumulation; that is, it may become a way to allocate diversified assets [61] or the source of capital for a transition to nonagricultural work. This shows that farmland is no longer limited to supplying welfare to rural household or securing their livelihoods [62,63,64].
5.3. Enlightenment
Author Contributions
Funding
Institutional Review Board Statement
Informed Consent Statement
Data Availability Statement
Conflicts of Interest
Appendix A

| Numbering | Notes and Reference Source |
|---|---|
| 1.1 | 2017 Migrant Workers Monitoring Report [EB/OL].18-o4-27] http://www.stats.gov.cn/tjsj/zxfb/201804/t20180427_1596389.html, accessed on 25 February 2021 |
| 1.2 | Data Sources::http://www.stats.gov.cn/tjsj/tjgb/nypcgb/, accessed on 16 March 2021 |
| Variables | (1) | (2) | (3) | (4) | (5) | (6) | (7) | (8) | (9) | (10) | (11) | (12) | (13) | (14) | (15) | (16) | (17) |
|---|---|---|---|---|---|---|---|---|---|---|---|---|---|---|---|---|---|
| (1) Logarithm of the expected value of farmland value | 1.000 | ||||||||||||||||
| (2) Gender | 0.061 | 1.000 | |||||||||||||||
| (3) Whether to confirm the right to issue a certificate | 0.006 | 0.046 | 1.000 | ||||||||||||||
| (4) Family social security coverage rate | 0.054 | 0.018 | 0.010 | 1.000 | |||||||||||||
| (5) Degree of food dependence on farmland | −0.046 | 0.034 | 0.063 | 0.003 | 1.000 | ||||||||||||
| (6) Farmland income dependence | −0.089 | 0.074 | 0.003 | 0.022 | 0.082 | 1.000 | |||||||||||
| (7) Farmland area per household | −0.126 | 0.008 | −0.026 | −0.012 | −0.007 | 0.087 | 1.000 | ||||||||||
| (8) Does the family have public officials | 0.032 | 0.042 | −0.008 | 0.063 | 0.041 | 0.042 | 0.007 | 1.000 | |||||||||
| (9) Annual income per capita of the family | 0.047 | 0.011 | 0.001 | −0.019 | −0.041 | 0.135 | 0.123 | 0.023 | 1.000 | ||||||||
| (10) Household debt level | −0.026 | −0.019 | −0.018 | −0.041 | −0.010 | 0.098 | 0.015 | 0.010 | −0.032 | 1.000 | |||||||
| (11) Whether there is a dummy variable of land acquisition experience since 2000 | 0.113 | 0.008 | 0.010 | 0.012 | −0.025 | −0.011 | −0.022 | 0.012 | 0.017 | 0.027 | 1.000 | ||||||
| (12) Age | −0.079 | 0.146 | 0.032 | 0.051 | 0.044 | −0.101 | −0.026 | −0.007 | −0.092 | −0.093 | −0.016 | 0.146 | 1.000 | ||||
| (13) Education | 0.110 | 0.197 | 0.018 | 0.066 | −0.069 | 0.083 | 0.049 | 0.096 | 0.131 | −0.010 | 0.048 | 0.197 | −0.301 | 1.000 | |||
| (15) Willingness to do business | 0.037 | 0.035 | 0.000 | −0.021 | −0.018 | 0.015 | 0.000 | 0.044 | 0.040 | 0.042 | 0.056 | 0.035 | −0.209 | 0.067 | 1.000 | ||
| (16) Whether the community provides policy services | 0.045 | 0.057 | 0.024 | 0.043 | 0.024 | −0.012 | −0.020 | 0.071 | 0.001 | −0.006 | 0.010 | 0.057 | 0.028 | 0.040 | −0.007 | 1.000 | |
| (17) Organizational level | −0.032 | −0.035 | 0.018 | 0.019 | 0.004 | −0.068 | −0.023 | −0.067 | −0.054 | −0.079 | 0.001 | −0.035 | 0.042 | −0.036 | −0.011 | −0.046 | 1.000 |
References
- Chant, S. Re-thinking the “feminization of poverty” in relation to aggregate gender indices. J. Hum. Dev. 2006, 7, 201–220. [Google Scholar] [CrossRef]
- Bieri, S. New ruralities—old gender dynamics? A reflection on high-value crop agriculture in the light of the feminisation debates. Geogr. Helv. 2014, 69, 281–290. [Google Scholar] [CrossRef] [Green Version]
- Gaddis, I.; Klasen, S. Economic development, structural change, and women’s labor force participation: A reexamination of the feminization U hypothesis. J. Popul. Econ.-Ics 2014, 27, 639–681. [Google Scholar] [CrossRef]
- Gao, X.X. Contemporary China’s rural labor transfer and agricultural feminization trend. Sociol. Res. 1994, 2, 83–90. [Google Scholar] [CrossRef]
- Tan, S. Gender differences in rural labor mobility. Sociol. Res. 1997, 1, 42–47. [Google Scholar] [CrossRef]
- Ramamurthy, P. Why are men doing floral sex work? Gender, cultural reproduction and the feminization of agriculture. Signs 2010, 35, 397–424. [Google Scholar] [CrossRef]
- Gartaula, H.N.; Niehof, A.; Visser, L.E. Feminisation of agriculture as an effect of male out-migration: Unexpected outcomes from Jhapa District. East. Nepal. Int. J. Interdiscip. Soc. Sci. 2010, 5, 565–578. [Google Scholar] [CrossRef]
- Oseni, G.; Corral, P.; Goldstein, M.; Winters, P. Explaining gender differentials in agricultural production in Nigeria. Agric. Econ. 2015, 46, 285–310. [Google Scholar] [CrossRef] [Green Version]
- SLavchevska, V. Gender differences in agricultural productivity: The case of Tanzania. Agric. Econ. 2015, 46, 335–355. [Google Scholar] [CrossRef]
- Cai, H.; Huang, L. What is “Agricultural Feminization”: Discussion and Reflection. J. Agric. For. Econ. Manag. 2017, 16, 652–659. [Google Scholar] [CrossRef]
- Pattnaik, I.; Lahiridutt, K.; Lockie, S.; Pritchard, B. The feminization of agriculture or the feminization of agrarian distress? Tracking the trajectory of women in agriculture in India. J. Asia Pac. Econ. 2018, 23, 138–155. [Google Scholar] [CrossRef]
- Terri, R.; Anríquez, G.; Croppenstedt, A.; Gerosa, S.; Lowder, S.K.; Matuschke, I.; Skoet, J. The Role of Women in Agriculture; ESA: Noordwijk, The Netherlands, 2011; Volume 3, p. 2. [Google Scholar] [CrossRef]
- Onyalo, P.O. Women and agriculture in rural Kenya: Role in agricultural production. Int. J. Humanit. Soc. Sci. 2019, 4, 1–10. [Google Scholar]
- World Bank. Levelling the Field: Improving Opportunities for Women Farmers in Africa; World Bank: Washington, DC, USA, 2014. [Google Scholar]
- Ngomane, T.S.; Sebola, M.P. Women in Agricultural Co-Operatives for Poverty Alleviation in Mpumalanga Province: Challenges, Strategies and Opportunities. In Proceedings of the 4th Annual International Conference on Public Administration and Development Alternatives, Johannesburg, South Africa, 3–5 July 2019; Available online: http://ulspace.ul.ac.za/bitstream/handle/10386/2713/ngomane_women_2019.pdf?sequence=1 (accessed on 18 April 2021).
- FAO. The State of Food and Agriculture 2010–2011: Women in Agriculture—Closing the Gender Gap for Development; United Nations: New York, UK, USA, 2011. [Google Scholar] [CrossRef]
- Inhetveen, H.; Schmitt, M. Feminization Trends in Agriculture: Theoretical Remarks and Empirical Findings from Germany; Women in the European Countryside; Routledge: London, UK, 2017; pp. 83–102. [Google Scholar]
- Eapen, L.M.; Nair, S.R. Rarian performance and food price inflation in India. Econ. Polit. Wkly. 2015, 50, 49–60. [Google Scholar] [CrossRef]
- Mao, X.F.; Liu, J. Is agricultural land “feminized” or “aging”? Popul. Res. 2009, 2, 69–80. [Google Scholar]
- Agrawal, T.; Chandrasekhar, S.; Gandhi, I. Short-term migrants in India: Characteristics, Wages and Work transition. Work Pap. no. 2015. Available online: http://oii.igidr.ac.in:8080/xmlui/handle/2275/355 (accessed on 17 April 2021).
- Wei, J.Q.A. Study on the Feminization of Agriculture from the Perspective of Population Security. Northwestern Popul. 2016, 37, 03:84–88, 93. [Google Scholar] [CrossRef]
- Ma, H.F.; Guo, P.A. Summary of the Research on Left-behind Women in Rural my country in the Past Ten Years. J. Inn. Mong. Agric. Univ. 2020, 22, 7–12. [Google Scholar] [CrossRef]
- Pattnaik, I.; Lahiri-Dutt, K. What determines women’s agricultural participation? A comparative study of landholding households in rural India. J. Rural. Stud. 2020, 76, 25–29. [Google Scholar] [CrossRef]
- Ji, Y.Q.; Wang, X.Q.; Lu, W.Y.; Liu, Y.Z. The characteristics of agricultural labor force, land fragmentation and agricultural machinery socialization service. Res. Agric. Mod. 2016, 37, 910–916. [Google Scholar] [CrossRef]
- Peng, D.Y.; Wen, L. Does the aging and feminization of rural labor force reduce the efficiency of food production? A comparative analysis of North and South based on stochastic frontiers. Agric. Technol. Econ. 2016, 2, 32–44. [Google Scholar] [CrossRef]
- Xiang, Y.; Qi, C.J.; Hu, X.Y. The impact of aging, part-time employment, and feminization on the input of household production factors: An empirical analysis based on data from fixed observation points in rural areas across the country. Stat. Inf. Forum 2018, 33, 109–115. [Google Scholar]
- Wang, W.; Wang, J.M. Analysis of the impact of aging and feminization of farmers on the production efficiency of planting industry: Based on 824 survey samples in Heilongjiang Province. Agric. Econ. 2019, 3, 68–70. [Google Scholar]
- Li, M.; Zhao, L.G. The “feminization” of agricultural labor force and its impact on agricultural production—Based on the empirical analysis of Liaoning Province. China Rural. Econ. 2009, 5, 61–69. [Google Scholar]
- He, J.; Li, Q.; Zhang, S.C. Gender division of labor and feminization of agriculture: An empirical analysis based on 408 sample families in Jiangsu. J. Nanjing Agric. Univ. 2010, 10, 50–56. [Google Scholar]
- Zhang, W.W. Research on the imbalance of China’s urban and rural labor market. Ph.D. Thesis, Shandong Agricultural University, Taian, China, 2011. [Google Scholar]
- Cai, H.; Chen, S.; Huang, L. A Study on the Life Satisfaction of Farming Women under “Male Workers and Women Farming”—Based on the Analysis of 1367 Female Samples in Anhui Province. J. Agric. For. Econ. Manag. 2018, 18, 244–254. [Google Scholar] [CrossRef]
- de Brauw, A.; Rozelle, S. The Consistency of Return to Education for Non-agricultural Employment in Rural China. China Labor Econ. 2009, 5, 3–18. [Google Scholar]
- Quisumbing, A.R. Male-female Differences in Agricultural Productivity: Methodological Issues and Empirical Evidence. World Dev. 1996, 24, 1579–1595. [Google Scholar] [CrossRef]
- Zhang, L.; Brauw, A.D.; Rozelle, S. China’s rural labor market development and its gender implications. China Econ. Rev. 2004, 15, 230–247. [Google Scholar] [CrossRef]
- Brauw, A.D.; Qiang, L.; Liu, C.; Rozelle, S.; Zhang, L. Feminization of agriculture in China? Myths surrounding women’s participation infarming. China, Q. 2008, 194, 327–348. [Google Scholar] [CrossRef]
- Brauw, A.D. The feminisation of agriculture with Chinese characteristics. J. Dev. Stud. 2013, 49, 689–704. [Google Scholar] [CrossRef]
- Su, W.; Eriksson, T.; Zhang, L.; Bai, Y. Off-farm employment and time allocation in on-farm work in rural China from gender perspective. China Econ. Rev. 2016, 41, 34–45. [Google Scholar] [CrossRef] [Green Version]
- Peng, D.Y.; Wu, X. Research on China’s Agricultural Technical Efficiency and Total Factor Productivity—Based on the Perspective of Rural Labor Structure Changes. Economist 2013, 9, 68–76. [Google Scholar] [CrossRef]
- Peng, D.Y.; Wen, L. The change of rural labor structure and the technical efficiency of food production. J. South China Agric. Univ. 2015, 14, 92–104. [Google Scholar]
- Guan, A.P.; Dong, F. Analysis of Feminization of Agriculture, Feminization of Agriculture and the Impact on Poverty—Based on the Survey Data of Farmers in 14 Poor Villages in Gansu Province. Popul. Dev. 2018, 24, 54–64. [Google Scholar]
- Huang, D.D. The Legislative Choice of Fair Compensation: Questioning the Market Price Standard of Agricultural Land Compensation. China Land Sci. 2013, 27, 36–41. [Google Scholar] [CrossRef]
- Wang, P. The dilemma of my country’s rural land expropriation and its solution—Based on the perspective of food security and choice value. Theor. Mon. 2013, 7, 176–180. [Google Scholar] [CrossRef]
- Liu, X.H. Discussion on the Essence of Compensation Standards for Land Expropriation—Also on the Method of Measuring and Calculating Compensation Prices for Market-based Land Expropriation. Product. Res. 2014, 9, 103–106. [Google Scholar] [CrossRef]
- Xu, J.Y.; Huang, T.Z. Agricultural land market value evaluation model and its application in my country’s land acquisition compensation. J. South China Agric. Univ. 2014, 13, 62–69. [Google Scholar]
- Codosero Rodas, J.M.; Naranjo Gómez, J.M.; Alexandre Castanho, R.; Cabezas, J. Land Valuation Sustainable Model of Urban Planning Development: A Case Study in Badajoz, Spain. Sustainability 2018, 10, 5. [Google Scholar] [CrossRef] [Green Version]
- Atkinson, J.W. Motivational determinants of risk-taking behavio. Psychol. Rev. 1957, 64, 359–372. [Google Scholar] [CrossRef]
- Ajzen, I. The theory of planned behavior. Organ. Behav. Hum. Decis. Processes 1991, 50, 179–211. [Google Scholar] [CrossRef]
- Aichian, A.A. The Collective Works of Armen A, Michigan: Edwards Brothers. Inc. 1994. Available online: https://xs2.dailyheadlines.cc/scholar?q=The+Collective+Works+of+Armen+A%2C+Michigan%3A+Edwards+Brothers (accessed on 18 April 2021).
- Yan, Z.C.; Wei, F.; Deng, X.; Chuan, L.; Qi, Y.B. Does Land Expropriation Experience Increase Farmers’ Farmland Value Expectations? Empirical Evidence from the People’s Republic of China. Land 2021, 10, 646. [Google Scholar] [CrossRef]
- He, X.; Jiang, T.; Guo, L.Y.; Gan, L. Development of China’s Agricultural Land Circulation Market and Research on Farmland Circulation Behavior of Farmers—Based on the Survey Data of Farmers in 29 Provinces from 2013 to 2015. Manag. World 2016, 6, 79–89. [Google Scholar] [CrossRef]
- Wang, C.W.; Gu, H.Y. Urban housing, agricultural land dependence and the withdrawal of rural households’ contract rights. Manag. World 2016, 9, 55–69, 187–188. [Google Scholar] [CrossRef]
- Shi, C.G.; Zhan, P.; Zhu, J.F. Land circulation, factor allocation and improvement of agricultural production efficiency. China Land Sci. 2020, 34, 49–57. [Google Scholar]
- Zou, X.Q.; Zhong, X.Y. Study on the influencing factors of psychological perception in the formation of conflict willingness of land-lost farmers. Resour. Sci. 2013, 35, 2418–2425. [Google Scholar]
- Bao, H.J.; Fang, Y.; Lei, P. Land expropriation conflict of interest: The behavioral selection mechanism of local government and land-lost farmers and its empirical evidence. China Land Sci. 2016, 30, 21–27, 37. [Google Scholar]
- AnderWeele, T.J. Mediation Analysis: A Practitioner’s Guide. Annu. Rev Public Health 2016, 37, 17–32. [Google Scholar] [CrossRef] [Green Version]
- Qiu, T.W.; Luo, B.L.; He, Q.Y. The Transformation of Agricultural Land Circulation Market: Theory and Evidence: Based on the Analysis of the Relationship between Agricultural Land Circulation Objects and Agricultural Land Rent. China Rural. Obs. 2019, 4, 128–144. [Google Scholar]
- Wen, Z.L.; Hou, J.T.; Zhang, L. The Comparison and Application of Moderating Effect and Mediating Effect. Acta Psychol. 2005, 2, 268–274. [Google Scholar]
- Cai, H.; Jiao, F.F.; Huang, L. Comparison of Differences in Farming Willingness and Its Influencing Factors from the Perspective of Gender—Based on 2073 Samples of Anhui Province. J. Shanxi Agric. Univ. 2019, 18, 30–40. [Google Scholar] [CrossRef]
- Cai, H. Research on the Feminization of Agriculture: Retrospect and Prospect. J. Shandong Agric. Univ. 2019, 21, 153–159. [Google Scholar]
- Xiang, D. The issue of rural women’s land rights under the background of agricultural feminization: A gender legal analysis based on the concept of free development. Hebei Sci. Law 2014, 32, 84–91. [Google Scholar]
- Zhang, W.C. Economic Interpretation; CITIC Publishing House: Beijing, China, 2019; p. 10. [Google Scholar]
- Wen, T.J. Reinterpretation of my country’s Rural System Change. China Natl. Cond. Power 2000, 4, 35–36. [Google Scholar] [CrossRef]
- Luo, B.L. System Reform under the Condition of Farmland Security and Withdrawal: Welfare Function Transferring Property Function. Reform 2013, 1, 66–75. [Google Scholar]
- Li, S.P.; Luo, B.L. Analysis of the internal mechanism and influencing factors of agricultural land adjustment. China Rural. Econ. 2015, 3, 18–33. [Google Scholar]


| Variable Type | Variable Name | Variable Definitions | Unit |
|---|---|---|---|
| Explained Variable | Logarithm of the expected value of farmland value (Y) | The expected value of farmland value per unit area takes the logarithm | |
| Core Explanatory Variable | Gender | 1 = Male; 0 = Female | |
| Other individual characteristic variables | Age | Actual age | Year |
| Education | 1 = illiterate; 2 = primary school; 3 = junior high school; 4 = high school; 5 = secondary school; 6 = junior college; 7 = undergraduate; 8 = master’s degree; 9 = doctoral degree | ||
| Willingness to do business | 1 = Yes; 0 = No | ||
| Property rights system | Whether to confirm the right to issue a certificate | 1 = Yes; 0 = No | |
| Family characteristics | Annual income per capita of the family | Total income/total population ($) | $/Year/person |
| Family social security coverage rate | Number of people purchasing social insurance/total household population | % | |
| Degree of food dependence on farmland | Value of self-produced food/total value of household food consumption | % | |
| Farmland income dependence | Source of income from farmland (agricultural subsidy)/total household income | % | |
| Does the family have village officials or party members | 1 = Yes; 0 = No | ||
| Overall family health | Health status is good/relatively good and average as a percentage of the household population | % | |
| Farmland area per household | Total farmland area/total population | km2 | |
| Household debt level | Total current debt / annual household income | % | |
| Farmland quality | Farmland quality grade | 1 = very good; 2 = good; 3 = fair; 4 = bad; 5 = very bad | |
| community service | Whether the community provides policy services | 1 = Yes; 0 = No | |
| Organizational characteristics | Organizational level | 1 = Enterprise; 2 = Cooperative; 3 = Family farm; 4 = Large household; 5 = Ordinary farmer | |
| Security perception | Social security perception | 1 = very safe; 2 = relatively safe; 3 = normal; 4 = not very safe; 5 = very unsafe | |
| Trust in the government for the elderly | 1 = completely unbelief; 2 = relatively unreliable 3 = average; 4 = relatively believe; 5 = completely trust | ||
| Area type variable | Area type | East = 1; Central = 2; West = 3 |
| Variable Name | Sample Size | Mean | Standard Deviation | Minimum | Maximum |
|---|---|---|---|---|---|
| Y (USD) | 5245 | 23,650.2 | 32,328.64 | 229.2 | 91,709.4 |
| Female dummy variable | 5245 | 0.3534795 | 0.4780955 | 0 | 1 |
| Whether to confirm the right to issue a certificate | 5245 | 0.464 | 0.499 | 0 | 1 |
| Family social security coverage rate | 5245 | 76.755 | 31.733 | 0 | 100 |
| Degree of food dependence on farmland | 5245 | 0.326 | 0.516 | 0 | 2.083 |
| Farmland income dependence | 5245 | 0.242 | 0.365 | 0 | 1 |
| Farmland area per household (km2) | 5245 | 0.19 | 0.677 | 0.0006 | 33.33 |
| Does the family have village officials or party members | 5245 | 0.057 | 0.232 | 0 | 1 |
| Annual income per capita of the family (USD) | 5245 | 1212.29 | 3169.49 | 0 | 152,849.1 |
| Household debt level | 5245 | 5.14 | 28.58 | 0 | 238.71 |
| Whether there is a dummy variable of land acquisition experience since 2000 | 5245 | 0.08 | 0.271 | 0 | 1 |
| Age | 5136 | 58.767 | 12.656 | 9 | 97 |
| Education | 5114 | 2.474 | 1.023 | 1 | 7 |
| Willingness to do business | 5244 | 0.103 | 0.304 | 0 | 1 |
| Whether the community provides policy services | 5245 | 0.133 | 0.34 | 0 | 1 |
| Farmland quality grade | 5242 | 2.659 | 0.993 | 1 | 5 |
| Organizational level | 5245 | 4.984 | 0.185 | 1 | 5 |
| Social security perception | 2943 | 2.215 | 0.903 | 1 | 5 |
| Trust in the government for the elderly | 5168 | 4.35 | 0.935 | 1 | 5 |
| Variable Name | Female | Male | |||
|---|---|---|---|---|---|
| Sample Size | Mean | Sample Size | Mean | Mean-Diff | |
| Y(USD/km2) | 1854 | 22,421.77 | 3391 | 25,180.3 | −2758.53 *** |
| Whether to confirm the right to issue a certificate | 1854 | 0.433 | 3391 | 0.482 | −0.049 *** |
| Family social security coverage rate | 1854 | 76.142 | 3391 | 77.091 | −0.949 |
| Degree of food dependence on farmland | 1854 | 0.297 | 3391 | 0.342 | −0.045 *** |
| Farmland income dependence | 1854 | 0.206 | 3391 | 0.261 | −0.055 *** |
| Farmland area per household (km2) | 1854 | 2.785 | 3391 | 2.969 | −0.184 |
| Does the family have village officials or party members | 1854 | 0.045 | 3391 | 0.064 | −0.018 *** |
| Annual income per capita of the family (USD) | 1854 | 7987.877 | 3391 | 7900.372 | 87.505 |
| Household debt level | 1854 | 6.093 | 3391 | 4.618 | 1.475 * |
| Whether there is a dummy variable of land acquisition experience since 2000 | 1854 | 0.076 | 3391 | 0.081 | −0.005 |
| Age | 1745 | 56.305 | 3391 | 60.634 | −3.728 *** |
| Education | 1740 | 2.194 | 3374 | 2.618 | −0.425 *** |
| Willingness to do business | 1854 | 0.092 | 3390 | 0.109 | −0.017 ** |
| Number of local people with blood relationship | 1854 | 2.526 | 3388 | 2.823 | −0.296 *** |
| Financial and economic knowledge understanding | 1848 | 4.252 | 3387 | 3.894 | 0.358 *** |
| Social security perception | 1008 | 2.356 | 1935 | 2.143 | 0.214 *** |
| Trust in the government for the elderly | 378 | 0.048 | 3065 | 0.152 | −0.105 *** |
| Worked in other provinces | 215 | 0.060 | 1904 | 0.170 | −0.110 *** |
| Whether the community provides policy services | 1854 | 0.107 | 3391 | 0.147 | −0.040 *** |
| Organizational level | 1854 | 4.991 | 3391 | 4.980 | 0.011 ** |
| Variable Name | (1) | (2) | (3) | (4) | (5) | (6) | (7) |
|---|---|---|---|---|---|---|---|
| Gender | −0.229 *** | −0.233 *** | −0.228 *** | −0.204 *** | −0.214 *** | −0.210 *** | −0.210 *** |
| (−4.14) | (−4.84) | (−4.74) | (−4.25) | (−4.16) | (−4.09) | (−4.08) | |
| Whether to confirm the right to issue a certificate | 0.096 * | 0.077 | 0.085 * | 0.085 * | 0.086 * | ||
| (1.87) | (1.51) | (1.65) | (1.65) | (1.66) | |||
| Family social security coverage rate | 0.001 | 0.001 | 0.001 | 0.001 | |||
| (1.00) | (0.88) | (0.84) | (0.85) | ||||
| Degree of food dependence on farmland | 0.002 | 0.031 | 0.030 | 0.030 | |||
| (0.04) | (0.66) | (0.64) | (0.64) | ||||
| Farmland income dependence | −0.100 | −0.143 ** | −0.141 ** | −0.142 ** | |||
| (−1.54) | (−2.19) | (−2.16) | (−2.18) | ||||
| Cultivated land area per household | −0.013 *** | −0.012 *** | −0.012 *** | −0.012 *** | |||
| (−4.08) | (−3.91) | (−3.91) | (−3.90) | ||||
| Does the family have village officials or party members | 0.110 | 0.078 | 0.069 | 0.066 | |||
| (1.13) | (0.79) | (0.69) | (0.67) | ||||
| Annual income per capita of the family | 0.000 *** | 0.000 *** | 0.000 *** | 0.000 *** | |||
| (2.90) | (3.63) | (3.64) | (3.64) | ||||
| Household debt level | −0.000 | −0.001 | −0.001 | −0.001 | |||
| (−0.46) | (−0.99) | (−1.00) | (−1.02) | ||||
| Whether there is a dummy variable of land acquisition experience since 2000 | 0.415 *** | 0.371 *** | 0.371 *** | 0.371 *** | |||
| (4.60) | (4.10) | (4.09) | (4.10) | ||||
| Age | −0.011 *** | −0.011 *** | −0.011 *** | ||||
| (−4.96) | (−4.99) | (−4.97) | |||||
| Education | 0.108 *** | 0.107 *** | 0.107 *** | ||||
| (4.20) | (4.15) | (4.14) | |||||
| Willingness to do business | 0.140 * | 0.142 * | 0.142 * | ||||
| (1.74) | (1.76) | (1.76) | |||||
| Whether the community provides policy services | 0.106 | 0.105 | |||||
| (1.53) | (1.52) | ||||||
| Organizational level | −0.046 | ||||||
| (−0.42) | |||||||
| Constant term | 7.67 *** | 8.04 *** | 8.02 *** | 8.12 *** | 8.54 *** | 8.54 *** | 8.77 *** |
| Cultivated land quality dummy variable | No | No | No | Yes | Yes | Yes | Yes |
| City dummy variable | N0 | Yes | Yes | Yes | Yes | Yes | Yes |
| N | 5245 | 5245 | 5245 | 5245 | 5113 | 5113 | 5113 |
| r2_a | 0.003 | 0.272 | 0.272 | 0.288 | 0.297 | 0.297 | 0.297 |
| F | 17.146 | . | . | . | . | . | . |
| Variable Name | (1) | (2) | (3) | (4) | (5) | (6) | (7) |
|---|---|---|---|---|---|---|---|
| Education | 0.173 *** | 0.209 *** | 0.209 *** | 0.180 *** | 0.142 *** | 0.142 *** | 0.141 *** |
| (3.69) | (4.72) | (4.74) | (4.06) | (2.92) | (2.92) | (2.91) | |
| Willingness to do business | 0.352 ** | 0.283 * | 0.283 * | 0.242 * | 0.209 | 0.210 | 0.205 |
| (2.08) | (1.89) | (1.89) | (1.66) | (1.44) | (1.45) | (1.41) | |
| Financial and economic knowledge understanding | 0.001 | −0.026 | −0.025 | −0.027 | −0.020 | −0.020 | −0.018 |
| (0.02) | (−0.59) | (−0.57) | (−0.60) | (−0.45) | (−0.44) | (−0.41) | |
| Social security perception | 0.099 | −0.032 | −0.032 | −0.014 | −0.024 | −0.024 | −0.024 |
| (1.54) | (−0.55) | (−0.55) | (−0.23) | (−0.41) | (−0.41) | (−0.41) | |
| Whether or not a party member | 0.446 | −0.227 | −0.252 | −0.278 | −0.234 | −0.243 | −0.242 |
| (0.93) | (−0.51) | (−0.57) | (−0.62) | (−0.52) | (−0.54) | (−0.54) | |
| Worked in other provinces | −0.173 | 0.166 | 0.167 | 0.136 | 0.078 | 0.079 | 0.080 |
| (−0.31) | (0.31) | (0.31) | (0.26) | (0.15) | (0.15) | (0.15) | |
| Is the head of the household | 0.094 | −0.019 | −0.018 | −0.037 | 0.005 | 0.006 | 0.007 |
| (0.83) | (−0.17) | (−0.17) | (−0.34) | (0.05) | (0.06) | (0.06) | |
| Family pension burden | 2.698 | 1.092 | 1.369 | 0.733 | −0.937 | −0.924 | −0.850 |
| (0.43) | (0.19) | (0.24) | (0.13) | (−0.16) | (−0.16) | (−0.15) | |
| Area type | −0.036 | −0.971 ** | −1.013 ** | −0.885 ** | −0.857 ** | −0.861 ** | −0.860 ** |
| (−0.59) | (−2.40) | (−2.50) | (−2.20) | (−2.14) | (−2.14) | (−2.14) | |
| Constant term | 6.70 *** | 9.50 *** | 9.55 *** | 9.40 *** | 9.85 *** | 9.85 *** | 11.37 *** |
| Other control variables | No | No | No | Yes | Yes | Yes | Yes |
| Cultivated land quality dummy variable | No | No | No | Yes | Yes | Yes | Yes |
| City dummy variable | N0 | Yes | Yes | Yes | Yes | Yes | Yes |
| N | 1734 | 1734 | 1734 | 1734 | 1734 | 1734 | 1734 |
| r2_a | 0.017 | 0.308 | 0.308 | 0.317 | 0.318 | 0.318 | 0.318 |
| F | 3.988 | . | . | . | . | . | . |
| Variable Name | (1) | (2) | (3) | (4) | (5) | (6) | (7) |
|---|---|---|---|---|---|---|---|
| Gender&Is the head of the household | 0.000 | −0.781 | −0.781 | −0.700 | −0.776 | −0.776 | −0.765 |
| . | (−1.48) | (−1.48) | (−1.32) | (−1.50) | (−1.50) | (−1.47) | |
| Gender&Education | 0.180 | 0.201 | 0.202 | 0.197 | 0.148 | 0.148 | 0.149 |
| (1.31) | (1.51) | (1.51) | (1.49) | (1.14) | (1.14) | (1.14) | |
| Gender&Financial and economic knowledge understanding | 0.115 | 0.083 | 0.081 | 0.041 | 0.054 | 0.054 | 0.053 |
| (0.74) | (0.58) | (0.57) | (0.30) | (0.40) | (0.40) | (0.39) | |
| Gender&Worked in other provinces | −0.356 | 0.092 | 0.093 | 0.163 | 0.162 | 0.162 | 0.164 |
| (−0.61) | (0.16) | (0.17) | (0.29) | (0.29) | (0.29) | (0.30) | |
| Gender&Whether or not a party member | 0.104 | −0.402 | −0.402 | −0.337 | −0.278 | −0.270 | −0.270 |
| (0.14) | (−0.48) | (−0.48) | (−0.40) | (−0.34) | (−0.31) | (−0.31) | |
| Gender&Willingness to do business | 0.666 | 1.168 ** | 1.163 ** | 1.121 ** | 1.150 ** | 1.150 ** | 1.146 ** |
| (1.14) | (2.15) | (2.14) | (2.02) | (2.09) | (2.09) | (2.08) | |
| Gender&Whether the community provides policy services | −0.869 *** | −0.825 *** | −0.828 *** | −0.822 *** | −0.857 *** | −0.871 * | −0.869 * |
| (−2.72) | (−2.90) | (−2.91) | (−2.89) | (−3.01) | (−1.76) | (−1.76) | |
| Constant term | 7.68 *** | 8.05 *** | 8.05 *** | 8.23 *** | 8.23 *** | 8.23 *** | 8.23 *** |
| Parallel variables | No | No | No | Yes | Yes | Yes | Yes |
| Other control variables | No | No | No | Yes | Yes | Yes | Yes |
| Farmland quality dummy variable | No | No | No | Yes | Yes | Yes | Yes |
| City dummy variable | N0 | Yes | Yes | Yes | Yes | Yes | Yes |
| N | 2115 | 2115 | 2115 | 2115 | 2115 | 2115 | 2115 |
| r2_a | 0.017 | 0.281 | 0.281 | 0.300 | 0.306 | 0.305 | 0.305 |
| F | 4.217 | . | . | . | . | . | . |
Publisher’s Note: MDPI stays neutral with regard to jurisdictional claims in published maps and institutional affiliations. |
© 2022 by the authors. Licensee MDPI, Basel, Switzerland. This article is an open access article distributed under the terms and conditions of the Creative Commons Attribution (CC BY) license (https://creativecommons.org/licenses/by/4.0/).
Share and Cite
Yan, Z.; Wei, F.; Deng, X.; Li, C.; He, Q.; Qi, Y. Feminization of Agriculture: Do Female Farmers Have Higher Expectations for the Value of Their Farmland?—Empirical Evidence from China. Agriculture 2022, 12, 60. https://0-doi-org.brum.beds.ac.uk/10.3390/agriculture12010060
Yan Z, Wei F, Deng X, Li C, He Q, Qi Y. Feminization of Agriculture: Do Female Farmers Have Higher Expectations for the Value of Their Farmland?—Empirical Evidence from China. Agriculture. 2022; 12(1):60. https://0-doi-org.brum.beds.ac.uk/10.3390/agriculture12010060
Chicago/Turabian StyleYan, Zhongcheng, Feng Wei, Xin Deng, Chuan Li, Qiang He, and Yanbin Qi. 2022. "Feminization of Agriculture: Do Female Farmers Have Higher Expectations for the Value of Their Farmland?—Empirical Evidence from China" Agriculture 12, no. 1: 60. https://0-doi-org.brum.beds.ac.uk/10.3390/agriculture12010060