Article

A Label-Free Electrochemical Impedance Genosensor Coupled with Recombinase Polymerase Amplification for Genetically Modified Maize Detection

1
Key Laboratory of Agricultural Genetically Modified Organisms Traceability of the Ministry of Agriculture and Rural Affairs, Oil Crops Research Institute, Chinese Academy of Agricultural Sciences, Wuhan 430062, China
2
Development Center of Science and Technology, Ministry of Agriculture and Rural Affairs, Beijing 100176, China
*
Authors to whom correspondence should be addressed.
Submission received: 11 February 2022 / Revised: 21 March 2022 / Accepted: 22 March 2022 / Published: 23 March 2022
(This article belongs to the Special Issue Detection and Identification of Transgenic Organisms in Agriculture)

Abstract

:
As the cultivation scale of genetically modified (GM) crops strongly increases, a convenient DNA assay is highly demanded in resource-limited areas. A label-free electrochemical impedance (EI) genosensor using gold carbon dots (GCDs) was developed with easy-to-use portable device. GCDs were used to modify screen-printed carbon electrode and immobilize capture probes by conducting a simple protocol. After the amplification products anchored on the sensor surface via hybridization reactions, the EI signal increased due to the formation of biocomplex hampering the interfacial electron transfer. Under the optimal conditions, the proposed genosensor coupled with recombinase polymerase amplification (RPA) could detect maize Ruifeng12-5 in a linear range of 0.10–5.0% with a detection limit of 0.10%. In addition, combined with a one-step extraction and RPA amplification, the proposed sensor device can be applied in resource-limited laboratories without expensive instruments or professionals. Therefore, the developed method provides an easy-to-use and sensitive platform for GM organism detection.

Graphical Abstract

1. Introduction

Genetically modified (GM) crop is the fastest adopted crop technology in the world. In 2019, 190.4 million hectares of GM crops were planted in 29 countries, expanding 112-fold since 1996. Worldwide regulatory authorities have granted 4485 approvals, including 403 GM events from 29 GM crops. Among these approvals, maize dominates the most approved events [1]. Huge economic and social benefits of GM crops have been documented in the last 24 years. However, the biological safety of GM products has been controversial. As a result, most countries stipulate that GM crop cultivation must be strictly supervised. Due to the tremendous scale of cultivating area of GM crops, it is crucial to detect GM ingredients with simplicity, convenience and cost-effectiveness. Currently, the widely applied rapid screening of GM crops is the protein-based method due to its prominent advantages of convenient operation and prompt detection. Unfortunately, this approach only detects a few target proteins, and it cannot identify GM events in the surveillance of commercialized GM crops.
The DNA-based polymerase chain reaction (PCR) technique is widely used in the identification of GM organisms [2,3,4,5,6]. It occupies the highest specificity in which the event-specific strategy targets the junction border between the inserted DNA and the host genome. Since the insertion site of the transferred DNA region in the genome is unique for each GM event, the event-specific PCR approach can distinguish one GM line from others. However, the PCR method is not easy to be implemented in a resource-limited laboratory environment since it requires expensive equipment and highly trained personnel. The development of isothermal nucleic acid amplifying technologies can overcome these limitations. These methods are implemented at a constant temperature without the need of specific PCR equipment. Among these approaches, recombinase polymerase amplification (RPA) is one of the fastest amplification technologies and provides an easy testing method for on-site settings [7,8,9]. RPA can be implemented in a lyophilized pellet at a body temperature within 15 min to obtain double-stranded amplicons that can be easily detected using an antibody-based nucleic acid test strip. However, direct detection of RPA amplification products by test strips usually generates false positive signals caused by inevitable primer dimers [10,11]. In addition, the merely qualitative nature of the test limits its application to a product labeling policy with tolerance thresholds. Therefore, the development of a more reliable detection technology coupled with event-specific RPA is highly demanded for identification of GM crops.
Genosensors are constructed via immobilizing the single-strand DNA (ssDNA) and can hybridize with the complementary strand with high specificity, eliminating the above-mentioned drawbacks occurring with DNA amplification. Biosensors possess inherent merits including ease of use, potential of automation and cheap and integrated devices, thus showing a promising application in limited resource areas. Plenty of DNA-based sensors including surface plasma resonance biosensor [12], quartz crystal microbalance biosensor [13], electrochemical biosensor [14,15,16], photoelectrochemical biosensor [17], electrochemiluminescence biosensor [18] and electrochemical impedimetric biosensor [19,20] have been extensively used to detect GM ingredients in plants. Among these methods, the electrochemical impedance (EI) biosensor has raised hopes due to its innate benefits over other biosensors, such as high sensitivity, rapid analysis and easy integration in a portable device [21,22]. Moreover, EI-based biosensor as a label-free method without labeling or hybridization indicator is used to quantify DNA by monitoring the change of electron transfer resistance upon DNA hybridization, showing exceptional simplicity in terms of structure and manipulation.
Recently, due to the large surface area, low cost, excellent conductivity and superior biocompatibility, carbon nanoparticles used as a substrate for molecules immobilization were widely applied in the fabrication of electrochemical DNA sensors, such as graphene [23], carbon nanotubes [24] and carbon dots [25]. The use of carbon nanoparticles can greatly enhance the surface area and conductivity of the electrodes. However, these carbon nanomaterials involved a labor-intensive and time-consuming covalent bonding process using the NHS/EDC method or an additional inhomogeneous mixture with nanogold for the immobilization of DNA fragments on the electrode. Compared with these nanomaterials, gold carbon dots (GCDs) integrated with carbon skeleton and gold nanoclusters were prepared with a very simple method [26,27]. GCD can be used as a more homogeneous and economical nanomaterial for constructing DNA sensors by virtue of their simple synthesis and facile binding to DNA probes. In our study, an easy-to-use GCDs-based electrochemical impedance (EI) genosensor was developed with simple structure for the detection of GM maize Ruifeng12-5. Ruifeng12-5 is one of the latest biosafety certificate varieties approved for production in China in 2020, which has a broad prospect for commercial cultivation. To simplify the analytical procedure and shorten the assay time, a convenient pretreatment with one-step extraction and RPA amplification was adopted. Taking advantage of these technologies, the proposed sensor system can be applied in resource-limited laboratories with the lack of expensive instruments and well-trained personnel.

2. Materials and Methods

2.1. Materials and Apparatus

Chitosan and glutathione (GSH) were purchased from Aladdin Chemistry Co., Ltd. (Shanghai, China). Chloroauric acid (HAuCl4) and 6-mercapto-1-hexanol (MCH) were supplied by Sigma-Aldrich Chemical Co., Ltd. (Saint Louis, MI, USA). Glucose, K3[Fe(CN6)] and K4[Fe(CN6)] were obtained from Sinopharm Chemical Reagent Co., Ltd. (Shanghai, China). Phosphate buffer (PB) at 0.010 M and pH 7.4 containing 0.010 M of K3[Fe(CN6)]/K4[Fe(CN6)] was used as EI substrate. The chitosan solution at 1.0% was prepared and used for the study. A DNA oligonucleotide solution was diluted with Tris-ethylenediaminetetraacetic acid (TE) buffer at a pH 8.0 consisting of 0.010 M Tris-HCl and 1.0 mM EDTA. All aqueous solutions were prepared using ultrapure water produced by a Millipore-XQ system.
Genomic DNA-based certified reference materials (CRMs) of maize Ruifeng12-5 (GBW10140) and rice TT51-1 (GBW10142) and matrix-based CRM of Maize T25 (GBW100504) were all produced by Oil Crops Research Institute, Chinese Academy of Agricultural Sciences, and used for the experiment. GM maize Ruifeng12-5 homozygous seeds were kindly provided by the developer and identified by Supervision and Test Center (Wuhan) for Environmental Safety of Plants, Ministry of Agriculture and Rural Affairs, China. GM maize Bt11 and Bt176 were collected and identified by the Supervision and Test Center (Wuhan) for Environmental Safety of Plants, Ministry of Agriculture and Rural Affairs, China. Non-GM maize seeds were purchased from the local market and identified by our laboratory.
Transmission electron microscopy (TEM) was performed with a TECNAI-G20 transmission electron microscope (FEI Company, Hillsboro, OR, USA). Scanning electron microscopy (SEM) was conducted with a VEGA 3 LMU scanning electron microscope (Tescan Ltd., Brno, Czech Republic). Scanning transmission electron microscopy was carried out with a JEM-ARM300F scanning transmission electron microscope equipped with high-angle annular dark field (HAADF) and annular bright field (ABF) (JEOL Company, Tokyo, Japan). X-ray photoelectron spectroscopy (XPS) was performed on an Escalab 250Xi X-ray photoelectron spectroscope. Cyclic voltammetry (CV) was measured with a Corrtest CS350H electrochemical workstation (Corrtest Instruments Corp., Ltd., Wuhan, China). EI measurements were performed using a portable ACIP100 impedance analyzer (Zensor Co., Ltd., Suzhou, China). A disposable screen-printed carbon electrode (SPCE) was provided by Zensor Co., Ltd. (Shanghai, China).

2.2. Preparation of GCDs

Firstly, 1.5 mL of 0.10 M GSH solution was slowly dropped into 5.0 mL of 0.020 M HAuCl4 solution with stirring in an Erlenmeyer flask, and then the mixture was diluted to 50 mL with ultrapure water. Afterwards, 2.0 g of glucose was added into the resultant solution under stirring to obtain a clarified solution, followed by heating with a household microwave oven at 700 W for 6 min until the solution was evaporated and caramel-colored bubbles appeared. Thereafter, 50 mL of ultrapure water was added into the flask to fully dissolve the solid pellet. The above solution was separated by centrifugation at 10,000 rpm for 10 min to collect a brown supernatant. At last, a dialysis tube with a molecular weight cut-off of 8000–14,000 was used to dialyze the brown solution against water for 48 h to obtain GCDs.

2.3. DNA Extraction

Genomic DNA was extracted from GM crop samples by an improved CTAB method [28]. The extracted genomic DNA was quantified using a NanoDrop spectrophotometer (Thermo Fisher Scientific, Hillsboro, OR, USA). The DNA quantity and a maize haploid genome size of 2500 Mbp were used to calculate the maize genome’s copy numbers [29].
For the application in resource-limited laboratory, a one-step extraction method using a direct-plant lysis buffer (Riogene Inc., Nanjing, China) was adopted. Approximately 0.020 g of Ruifeng12-5 powder was inserted into a centrifuge tube with 100 μL lysis buffer, followed by incubation at 98 °C for 10 min. Finally, 1.0 μL of 10-fold diluted supernatant was directly dropped into the RPA system as the template.

2.4. Primer Design and RPA Reactions

The RPA primers were designed based on the integration flanking sequence upstream of the cry gene of maize Ruifeng12-5. After an extensive investigation, the optimal RPA primers were chosen with a resultant amplification fragment of 129 bp. All of the synthetic oligonucleotide sequences and primers were synthesized by Sangon Biotech Co., Ltd. (China), and the detailed information of the sequences is listed as follow (from 5′ to 3′):
Capture probe: HS-C6-GAGCAGCTTGAGCTTGGATCAGATTGTCGTTTC;
Target sequence: GAAACGACAATCTGATCCAAGCTCAAGCTGCTC;
RPA forward primer: gagcagcttgagcttggatcagattgtcgtttc;
RPA reverse primer: gatgacgttcggtgcctggaagacaagttc.
DNA amplification by RPA was performed according to the operation instruction of TwistAmp Basic kit (TwistDx, Cambridge, UK). Each reaction was carried out in a 47.5 μL mixture containing 29.5 μL of rehydration buffer, 4.0 μL of forward and reverse primers (each 10 μM), 2.0 μL of the DNA template (50 ng/μL) and 12 μL of nuclease-free water. The reaction mixture was subsequently added into the tube containing freeze-dried powder, followed by flicking until the powder fully dissolved. After that, the resultant solution was thoroughly mixed with 2.5 μL of 0.28 M magnesium acetate to trigger the reaction. The reaction tube was immediately incubated for 15 min at 40 °C. At last, the amplification products were analyzed using 1% (w/v) agarose gel electrophoresis.

2.5. Label-Free EI Genosensor for GM Crop Detection

A disposable SPCE was used as the working electrode to develop an EI-based DNA sensor. In this work, one working electrode (3.0 mm in diameter) was girdled around by one Ag reference electrode and one carbon counter electrode for assembling the SPCE substrate (3.8 cm × 1.2 cm). After the SPCE was thoroughly cleaned with ultrapure water, it was activated in a PB buffer at 0.10 M and pH 7.0 by a cyclic voltammetry method from 0.8 V to 1.3 V at a scan rate of 100 mV/s for 5 cycles. After that, 5.0 μL of a immobilization mixture containing 6.0 mg/mL GCDs and 1.0% (m/v) chitosan solution with a volume ration of 10:1 was deposited onto the surface of the SPCE and dried at room temperature (RT) to form a nanocomposite film. Five microliters of 10 μM thiol-functionalized capture probe (ssDNA) was then added onto the working electrode for 90 min at RT to toughly anchor on the surface of the GCDs-modified SPCE via a thiol–Au interaction. After being washed with ultrapure water, the self-assembled SPCE was incubated with 5.0 μL of 1.0 mM MCH at RT for 1 h to block the nonspecific adsorption. Finally, the DNA sensor was rinsed with 0.010 M PB buffer at pH 7.4 and was ready for use.
To perform the label-free EI genosensor for GM crops, RPA amplification products were diluted 5 folds with TE buffer, followed by thermally denaturation at 95 °C for 5 min and then being frozen on ice for 2 min. Afterwards, 10 μL of single-stranded amplicons issued from GM crops at different contents was deposited on the fabricated SPCE-based DNA sensor at 45 °C for 45 min. The DNA sensor was then washed with PB buffer to discard nonhybridized oligonucleotides and inserted into the portable EI analyzer (19 cm × 11 cm × 4.3 cm). In impedance detection, approximately 200 μL of EI substrate was dropped onto the sensor’s bioreceptor. EI measurements were collected in the frequency range from 0.1 Hz to 1 KHz with an amplitude of 100 mV using a portable analyzer.

3. Results and Discussion

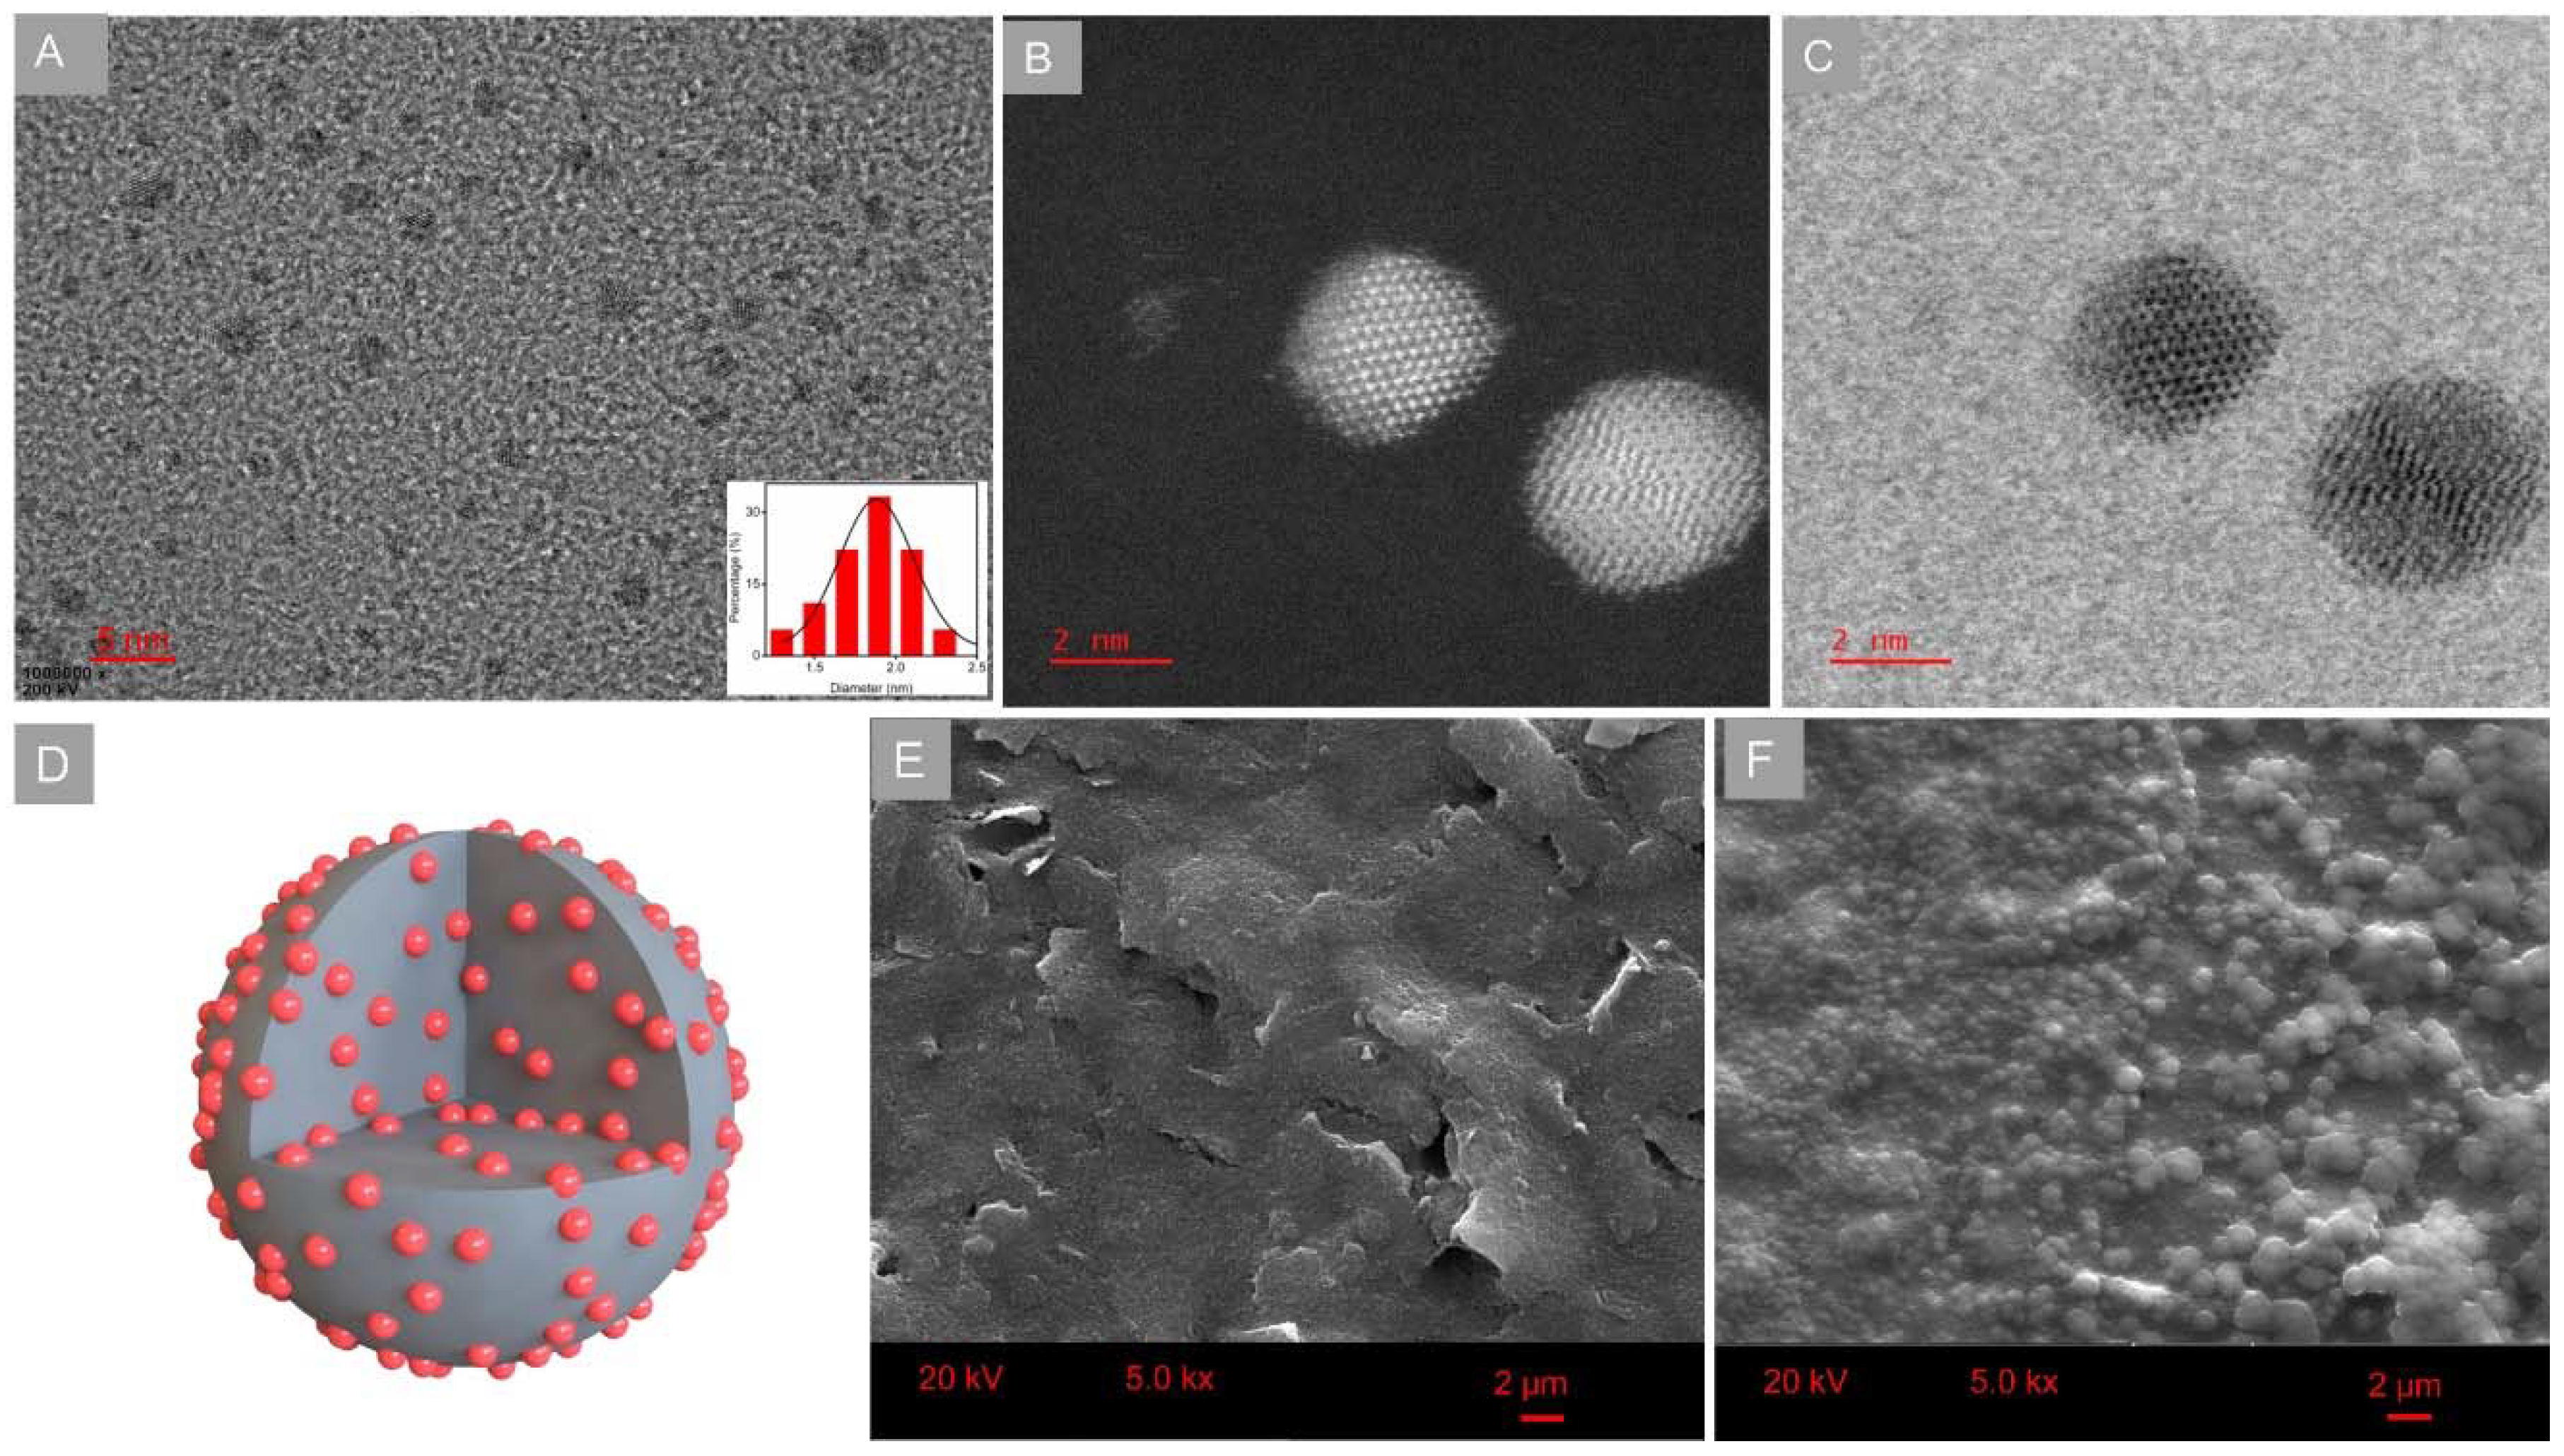
3.1. Characterization of GCDs-Based EI Genosensor

The GCDs were prepared with a facile microwave heating method. The morphology of the prepared GCDs was characterized with TEM and shown in Figure 1A. It was observed that the GCDs had monodisperse and spherical structure (approximately 2 nm) similary to the carbon dots [30], presenting a large surface area to load biomolecules. The elemental Au was verified with XPS. As presented in Supplementary Figure S1, the main elements of C, O and Au were found on the surface of GCDs. The further structure of GCDs was investigated with STEM equipped with HAADF and ABF. HAADF-STEM and ABF-STEM can distinguish heavy (such as gold) from light atoms (such as carbon). As exhibited in Figure 1B,C, Au and carbon atoms were observed to be alternately arranged in GCDs. Moreover, Au atoms were orderly arranged in crystal form in some GCDs, while others showed an amorphous nature presented in the GCDs. These results were consistent with the previous investigation [26], verifying that GCDs were composed of carbon skeleton and gold nanoclusters. The structure of GCDs was presented in Figure 1D, and gold nanoclusters were dispersed on the surface of GCDs as well as inside. The distribution of Au atoms on the surface of GCDs facilitated the conjugation with DNA molecules via Au-S bonds.
The morphologies of bare and GCDs-doped chitosan-modified working electrodes were characterized with SEM. As shown in Figure 1E, the bare electrode had a surface of uneven and inhomogeneous morphology. In comparison with the bare sensor, thousands of chitosan-mediated GCDs aggregations were obviously observed on the surface of GCDs-doped chitosan-modified electrodes (Figure 1F). The introduction of GCDs could contribute to an enhanced loading capacity of plentiful oligonucleotides onto the DNA sensor.
The stepwise assembly of the developed DNA sensor was validated using an electrochemical workstation by monitoring CV in 0.010 M K3[Fe(CN6)]/K4[Fe(CN6)] solution containing 0.10 M KCl at each step. As presented in Supplementary Figure S2, GCD-doped chitosan-modified electrode (curve b) exhibited a clearly increased redox peak current value in comparison with the bare electrode (curve a), which is attributed to the facilitated electron transfer activity of GCDs. With the introduction of capture probe (curve c) on the GCD-modified electrode, the peak current decreased because the deposition of negatively charged nucleic acid layers on sensor surface inhibited the access of [Fe(CN)6]3−/4− to electrodes. After the target sequence was hybridized with the capture probe/GCDs modified electrode (curve d), the current intensity decreased further, which demonstrated that the introduction of target DNA can increase the negative charge, thus increasing the electron-transfer resistance on sensor surface. Taken together, the results above confirmed that the proposed DNA sensor was successfully assembled.

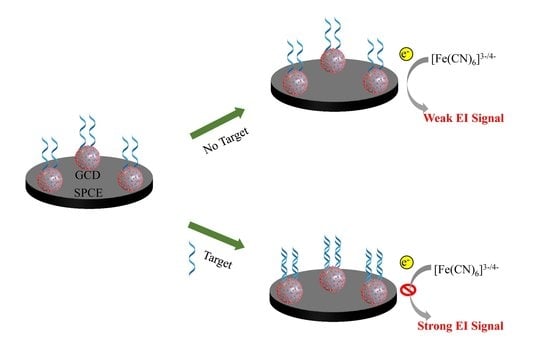
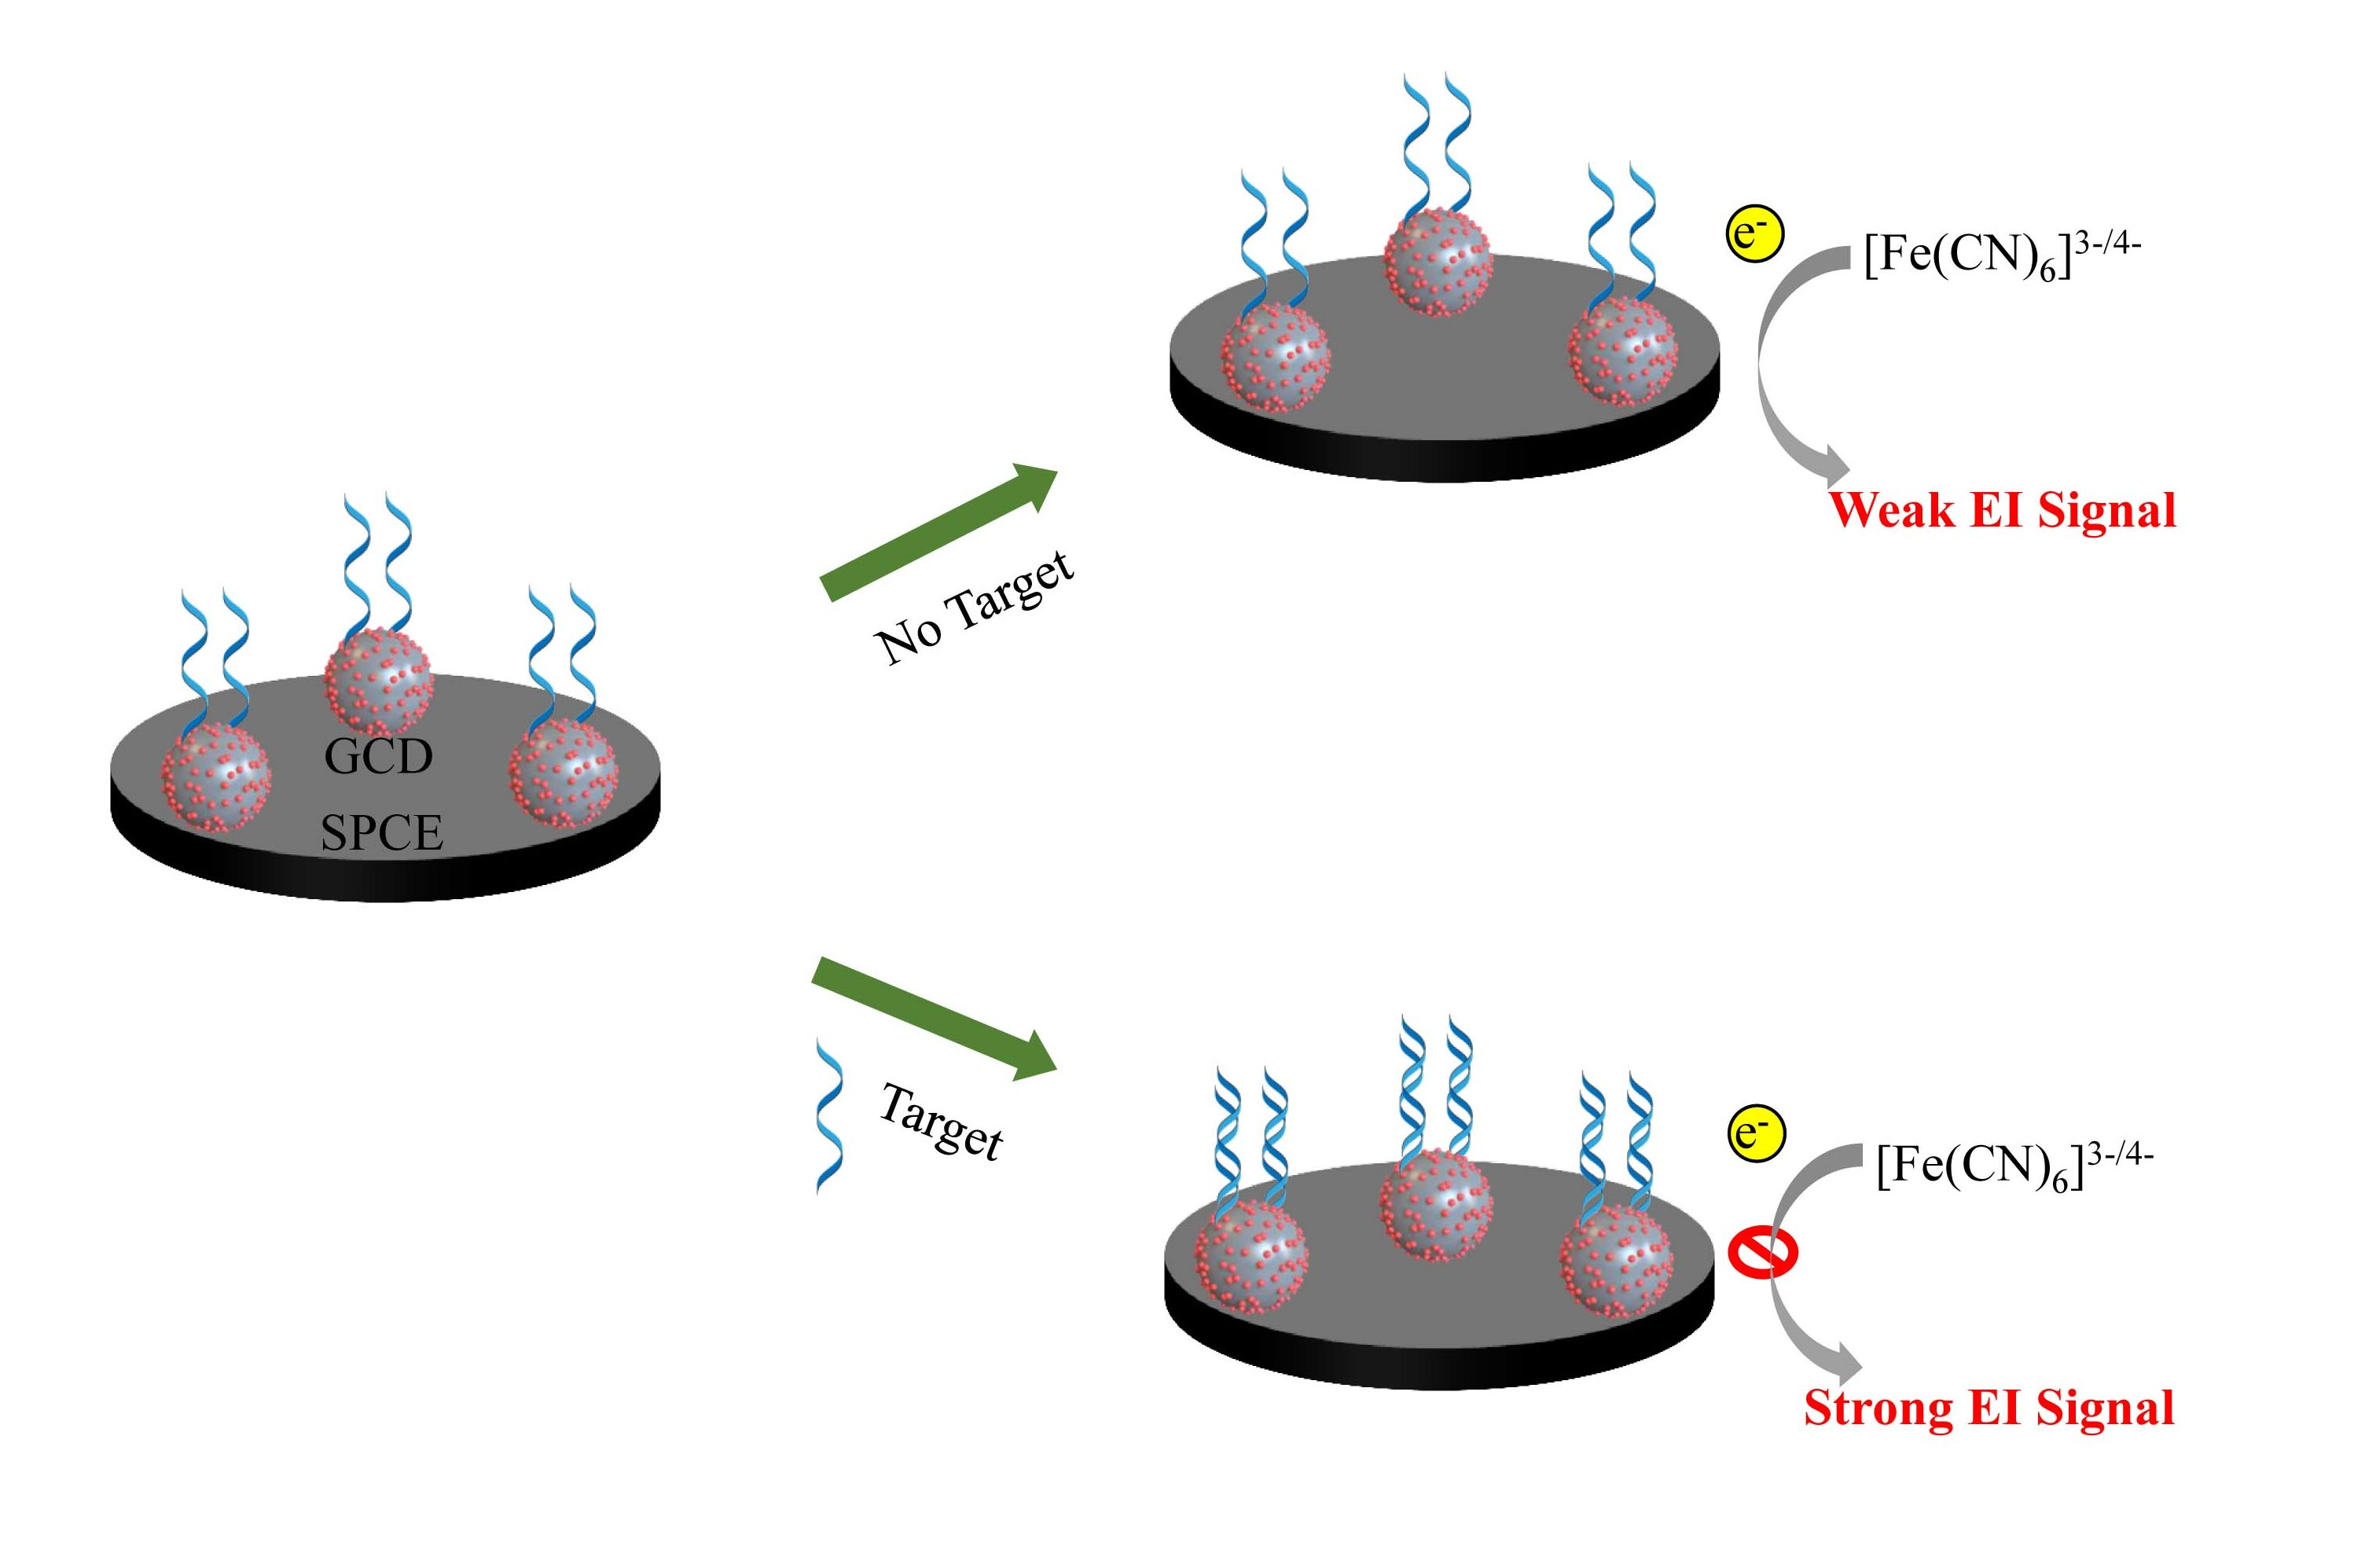
3.2. Principle of Label-Free EI Genosensor

The principle of the proposed label-free EI genosensor is illustrated in Figure 2. The developed DNA sensor was a portable device consisting of a handheld EI analyzer equipped with a coin-size SPCE. The GCDs were used as efficient electrode materials to boost electric conductivity and modify the working electrode in SPCE. The captured probe was bound on the GCD-modified sensor through electrostatic interaction to prepare the ready-to-use sensor. In the analytical procedure, GM maize samples were added to the EI sensor after pretreatment with one-step extraction within 10 min and RPA amplification within 15 min. The amplification products could anchor on the electrode’s surface by a double-stranded biocomplex through the hybridization of the immobilized ssDNA and target sequence. The interfacial electron transfer between the [Fe(CN)6]3−/4− and the composite surface was restrained by the negativity of the phosphate skeleton of anchoring DNA. As a result, the EI signal increased as GM crop content increased. The proposed label-free DNA sensor can be applied to measure target DNA just by monitoring the increase in EI signals, thus possessing an extremely simple manipulation.

3.3. Optimization of Experimental Conditions

The high analytical performance of EI-based genosensor can be achieved by optimizing important detection conditions, including capture probe immobilization and hybridization reaction conditions. In the experiments, the dependence of EI response on the amount of GCDs was investigated in detail in Supplementary Figure S3. Results are expressed as the relative Ret variation (ΔRet) between the DNA hybridization response and the blank response. Chitosan combined with nanoparticles forming a nanocomposite film on electrode can improve immobilization efficiency. It was observed that GCDs at 6.0 mg/mL and chitosan at 1.0% with a volume ratio of 10:1 was optimal to obtain satisfactory assay performance.
In addition, the influence of immobilization time of capture probe on the ΔRet response was exhibited in Supplementary Figure S4. After a careful investigation, the immobilization time was set at 90 min in this study. The effects of hybridization time and temperature between capture probe and target sequence on the ΔRet response were also evaluated. As presented in Supplementary Figures S5 and S6, the response of ΔRet increased gradually with increased hybridization time and temperature. The optimal performance was achieved at the setting of 45 min and 45 °C, respectively. Therefore, the hybridization time of 45 min and hybridization temperature of 45 °C were chosen for further experiments.
Conditions affecting the RPA reaction were estimated, such as reaction time and temperature and primer concentration. As shown in Supplementary Figures S7 and S8, the optimal reaction temperature was 40 °C, and the optimal concentrations for forward and reverse primers were 0.35 μM. It was found that the amplification products of RPA could be easily detected after 15 min of reaction (Supplementary Figure S9).

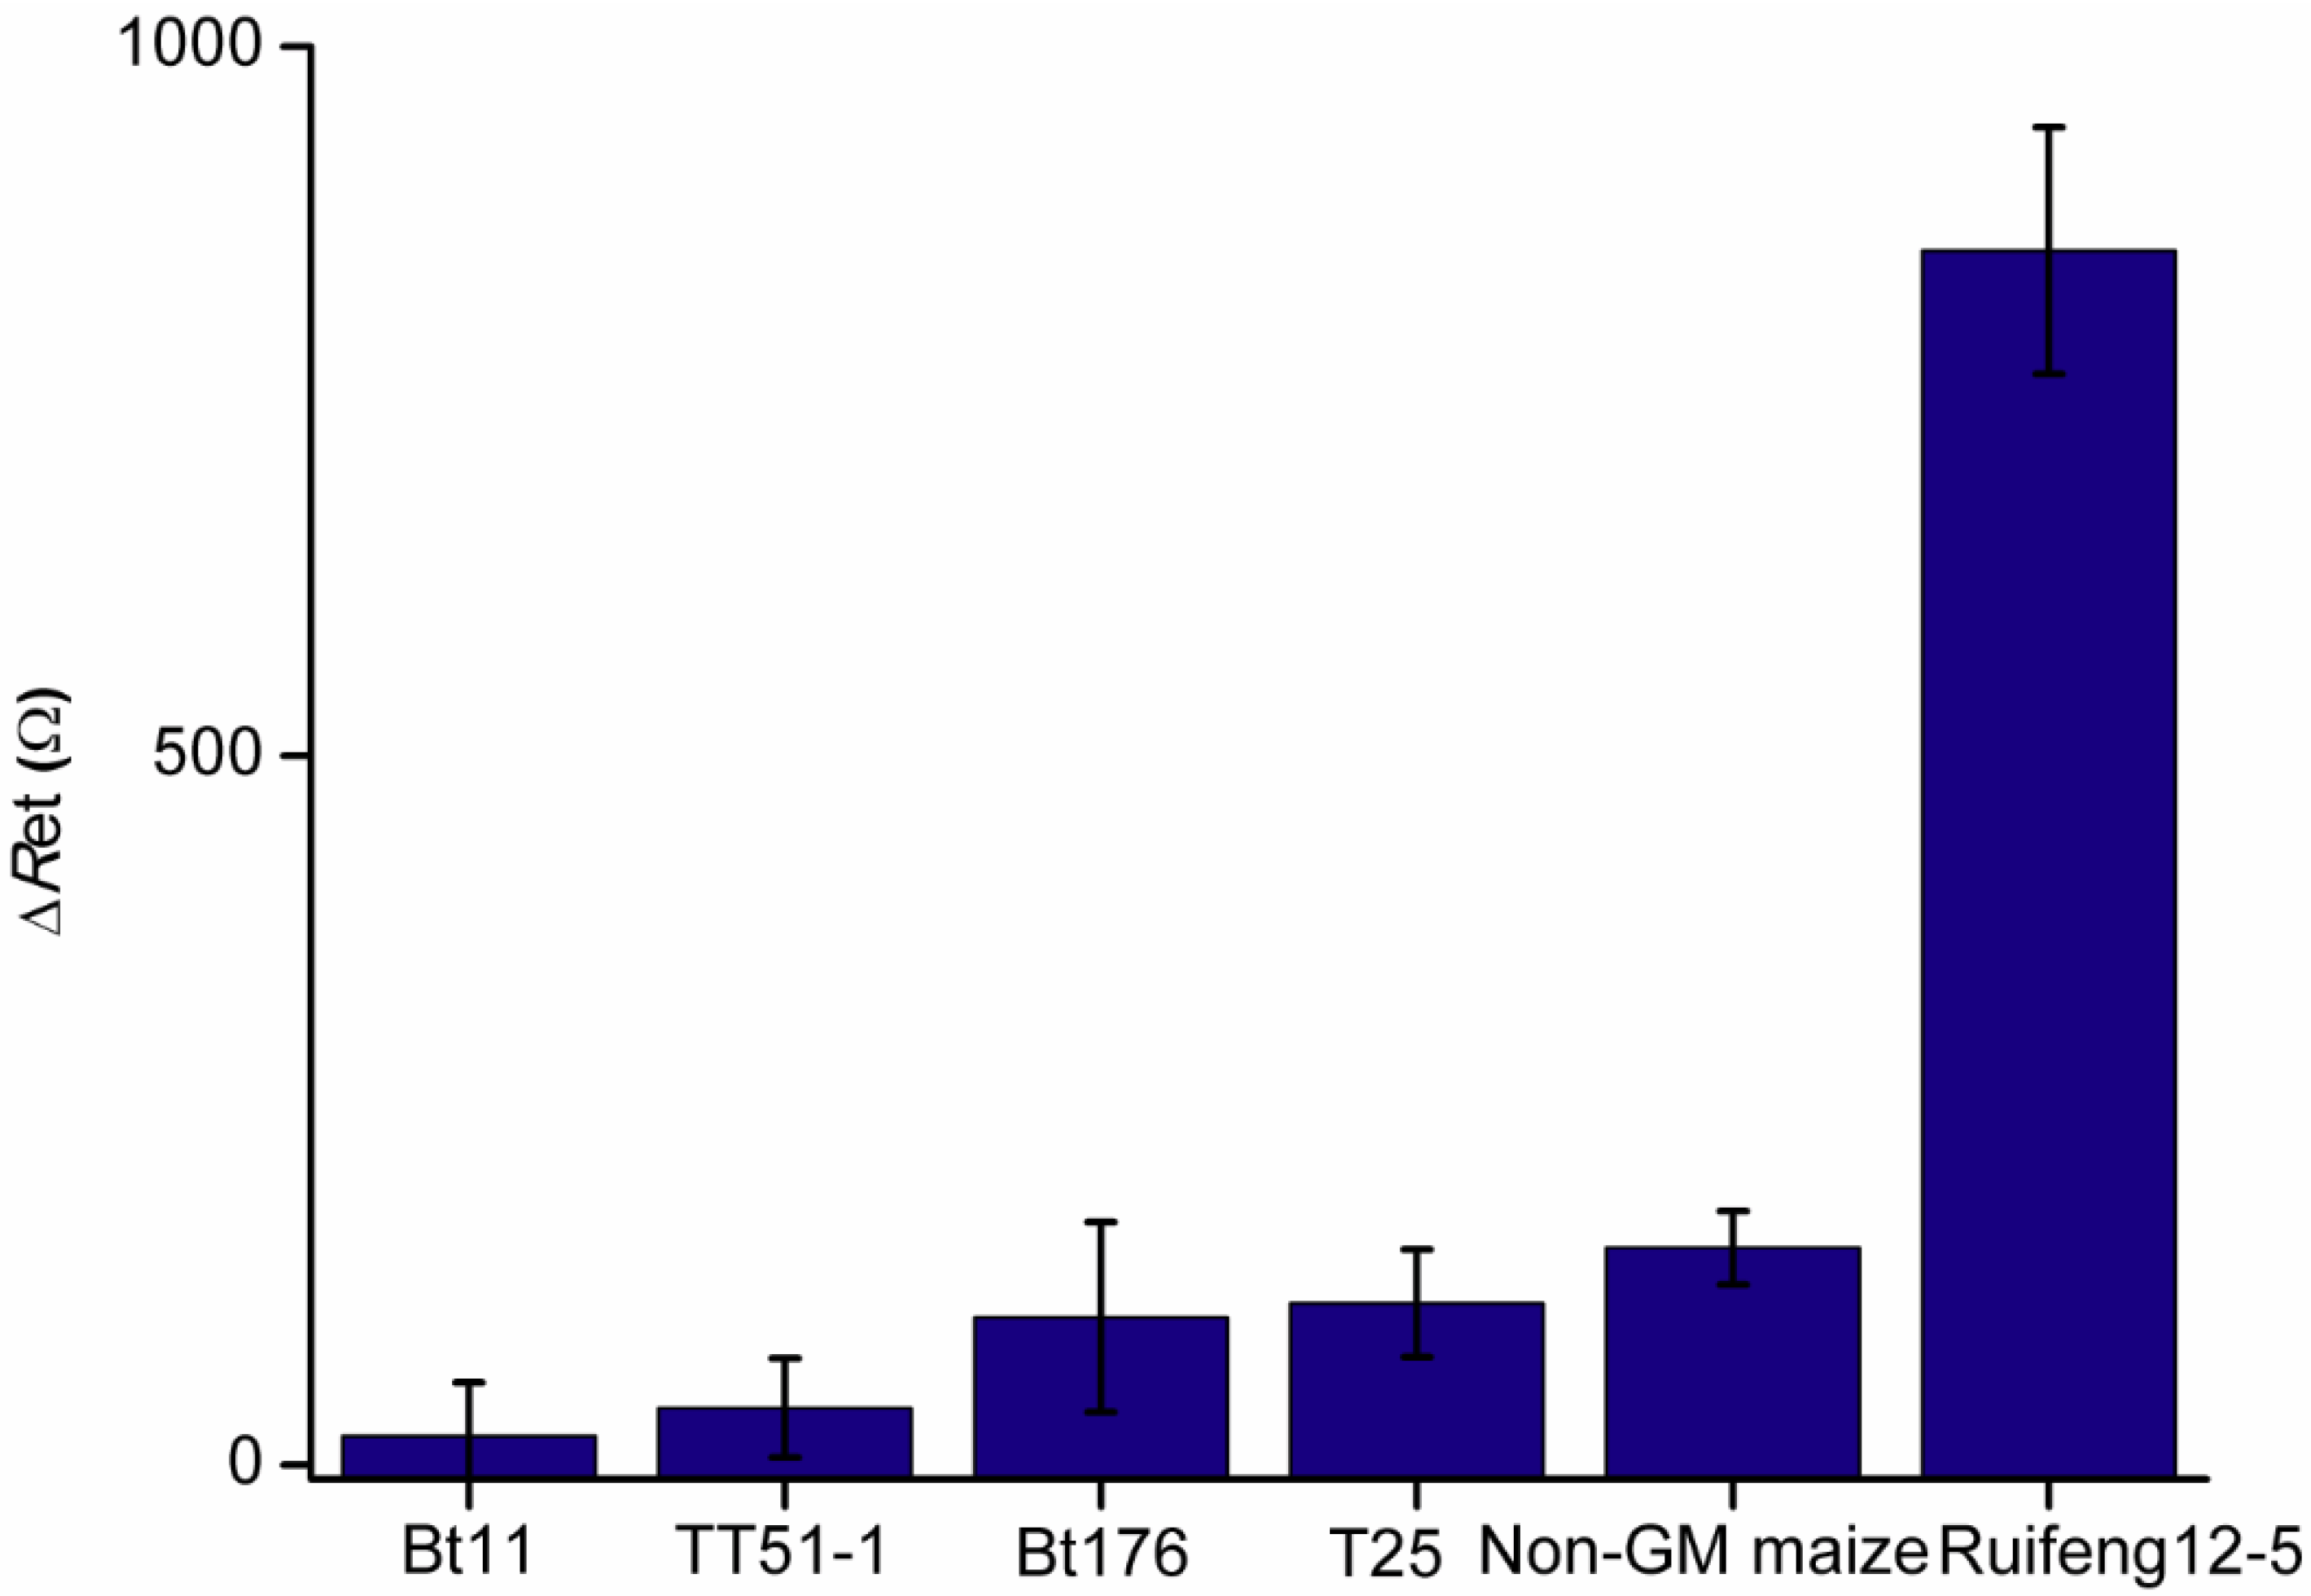
3.4. Specificity, Repeatability and Stability of EI Genosensor

The specificity of the developed RPA-based EI genosensor was tested among common GM varieties, including GM maize events (Bt11, Bt176 and T25) and GM rice TT51-1. All the initial templates for RPA were 10 ng/μL. As shown in Figure 3, the ΔRet values from the interfering GM samples were all close to the blank signal obtained from a non-GM maize sample. However, the enhanced ΔRet response was observed from maize Ruifeng12-5 at the same content. Therefore, the identification of maize Ruifeng12-5 using the proposed method should not interfere with these common GM varieties, therefore exhibiting an ideal specificity.
Moreover, the repeatability of the DNA sensor was investigated with the measurement of maize Ruifeng12-5 for five times at the contents of 5.0% and 10%, respectively. The relative standard deviations (RSDs) were 6.2% and 5.7%, respectively. Moreover, the stability of the fabricated biosensor was assessed using maize Ruifeng12-5 at 5.0%. After storage at 4 °C for five days, the initial ΔRet value decreased only 6.3%, suggesting that the capture probes were immobilized firmly onto the sensor’s surface by the GCDs/chitosan nanocomposite film. Therefore, the repeatability and stability of the proposed DNA sensor was acceptable.

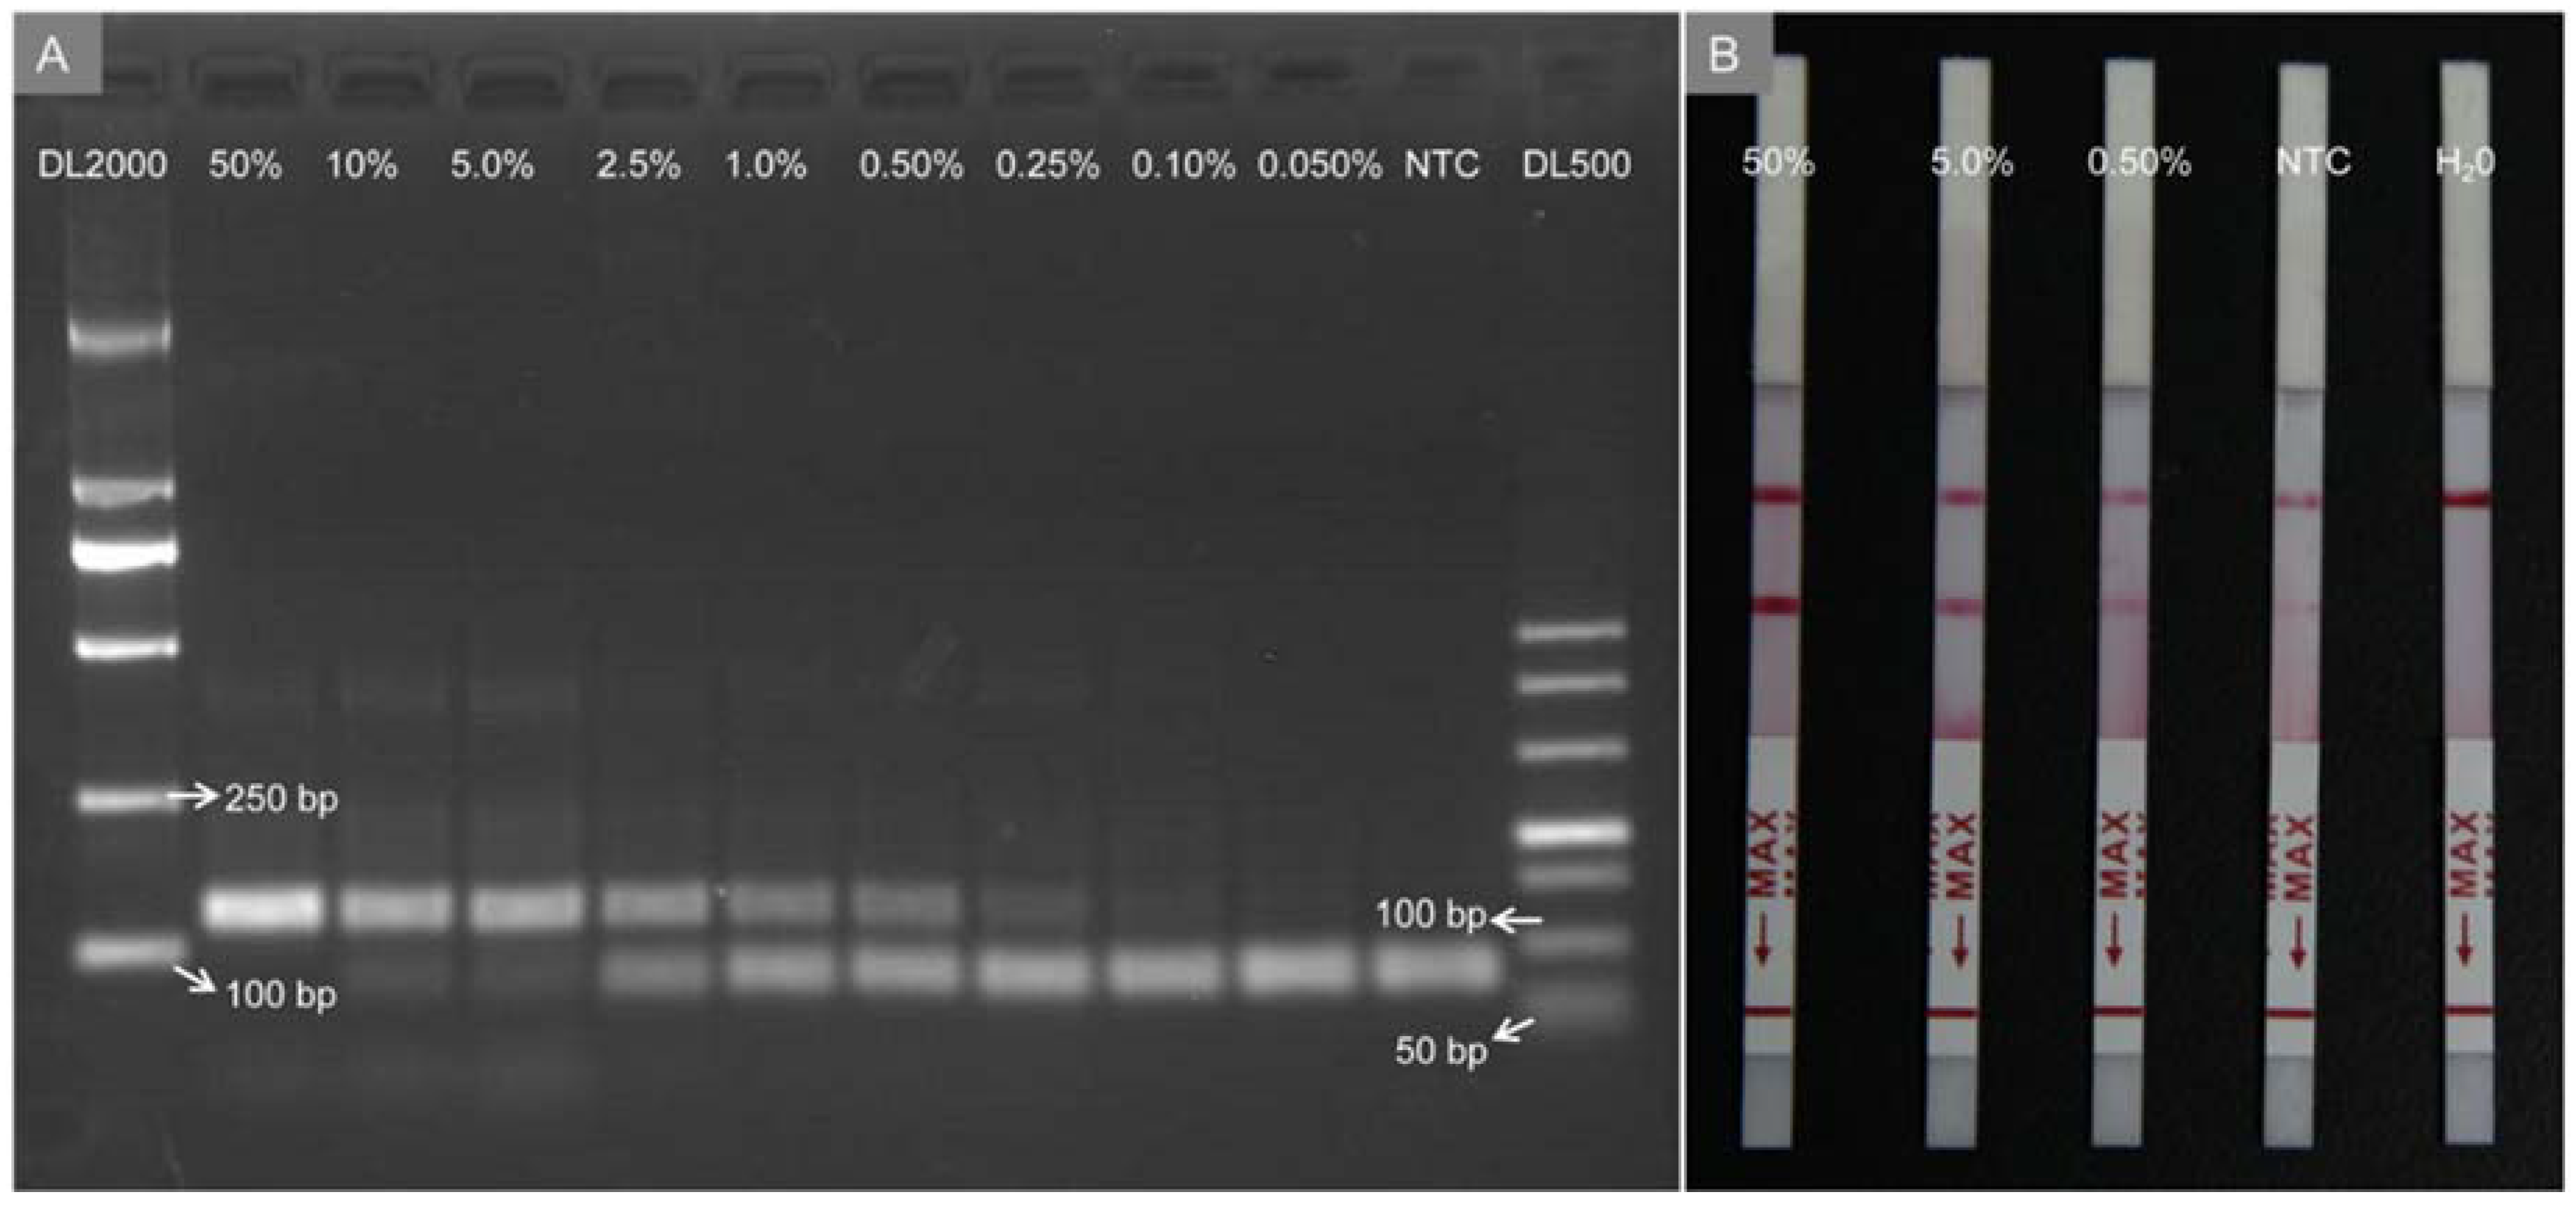
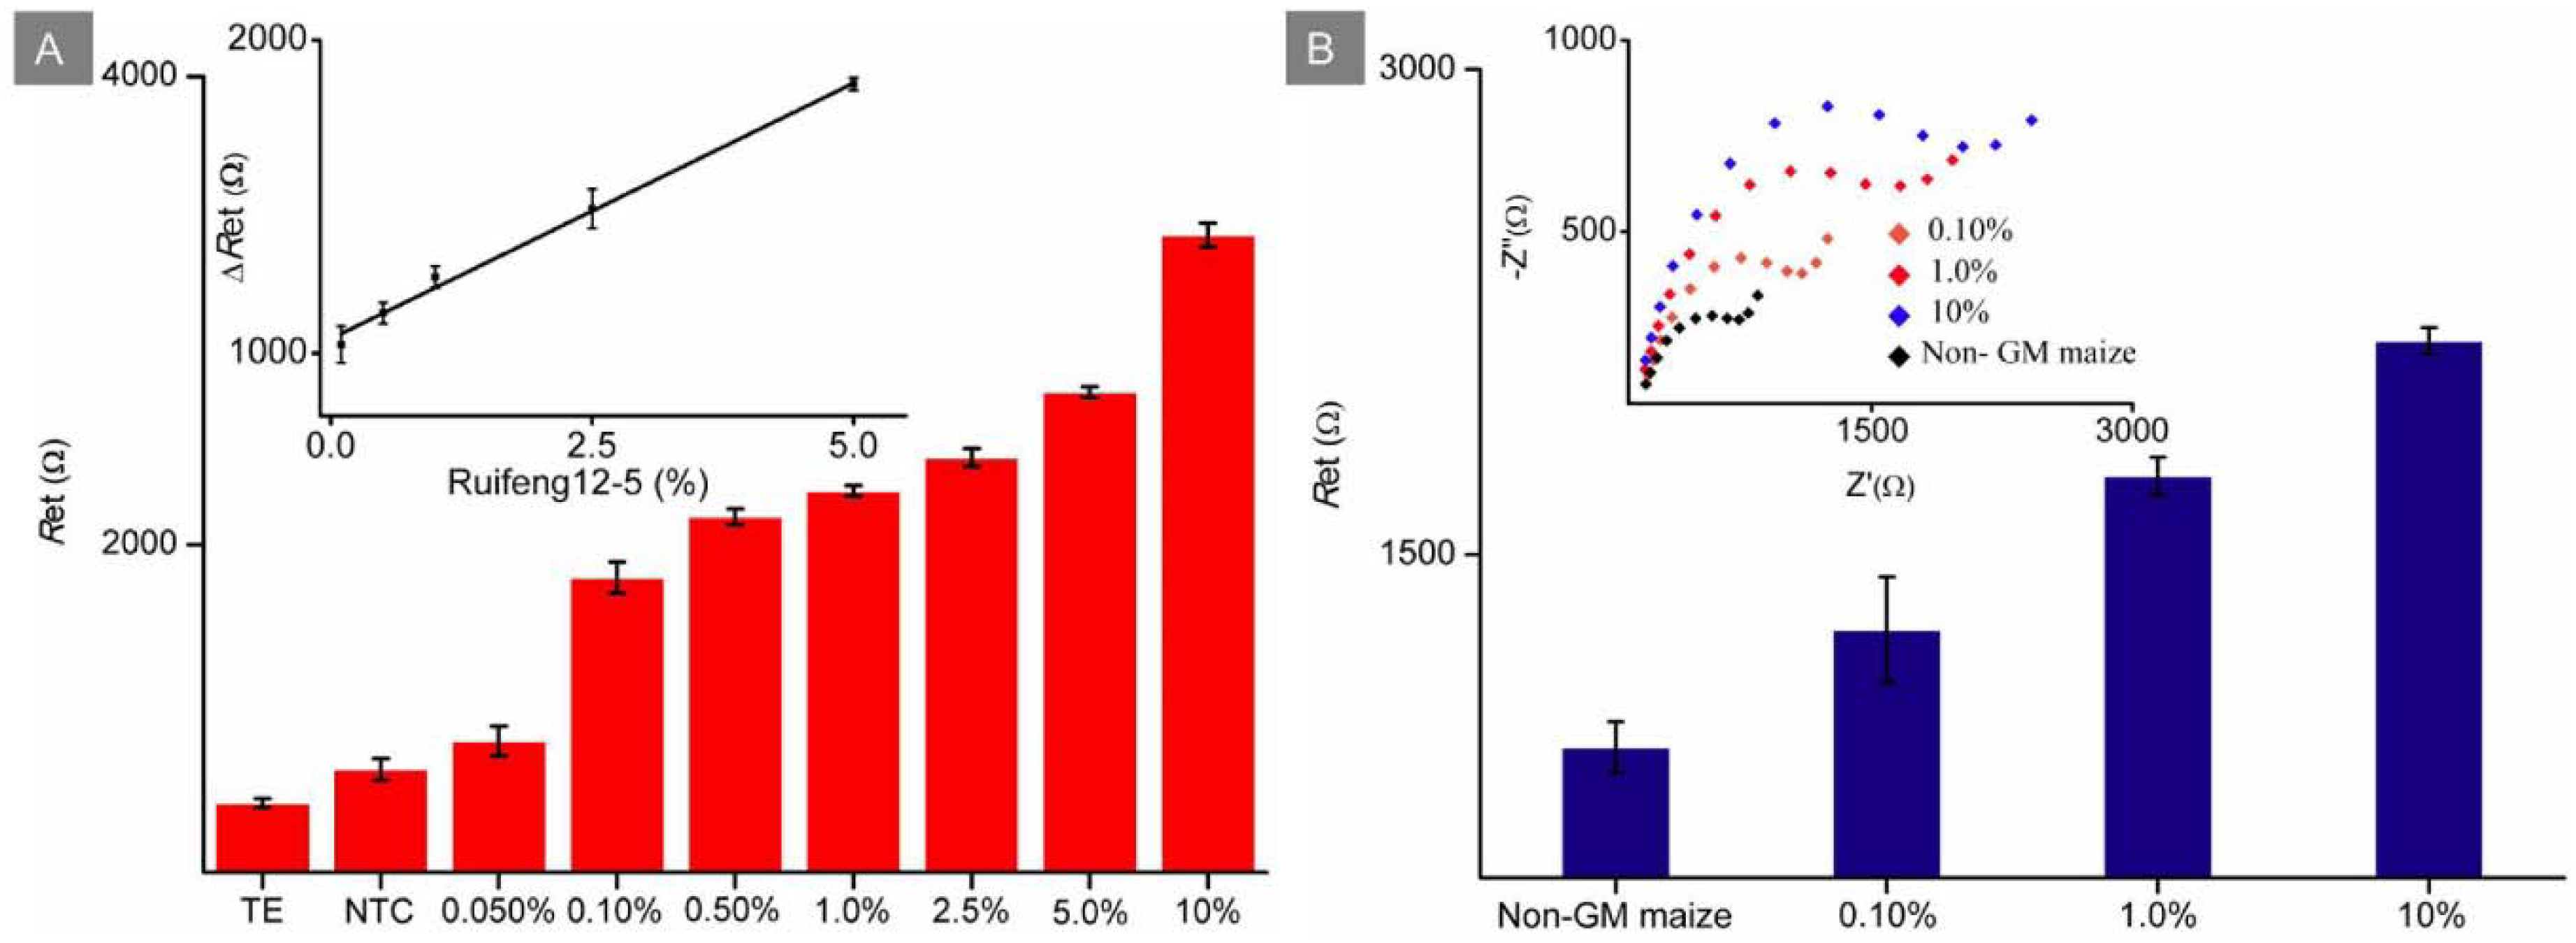
3.5. Sensitivity of EI Genosensor

To conveniently detect GM maize Ruifeng12-5, an RPA preamplification was developed to target a Ruifeng12-5 event-specific sequence. Standard samples for GM maize quantification were prepared by diluting genomic DNA CRM of Ruifeng12-5 with purified genomic DNA of non-GM maize to contents of 50%, 10%, 5.0%, 2.5%, 1.0%, 0.50%, 0.25%, 0.10% and 0.050%. RPA products were assayed by utilizing agarose gel electrophoresis (Figure 4A). It was observed that a limit of detection (LOD) of GM maize analysis using this method (defined as the lowest content with a visible lane) was 0.25%, which was significantly higher than that using the proposed DNA sensor. The dimers (bands of 63 bp) were also observed to generate target DNA amplification during regular RPA progress under lower GM crop contents. As presented in Figure 4B, after a commercial lateral flow strip was used to detect RPA amplification products based on biotin and FAM labeled RPA primers, a negative signal was observed for the H2O sample, while a false positive signal was generated at the no-template control (NTC) caused by primer dimers.
In this work, the portable EI analyzer embedded with a SPCE instead of the test strip was established for the quantification of RPA amplicons. Capture probe immobilized onto the sensor was the same with the forward RPA primer. However, Figure 5A showed that the primer dimers (NTC signal) did not seem to affect the EI signal significantly, probably because the non-complementary base mismatch restrained the accomplishment of dimer hybridization, and the anchoring complementary ssDNA of amplicons mainly caused the enhancement of the EI signal. As shown in Figure 5A, the EI response increased linearly with increasing concentrations of Ruifeng12-5 genomic DNA in the range from 0.10% to 5.0%. The linear regression equation was Y (Ω) = 25.21X (%) + 1056.35 (Y and X represent the ΔRet value and the content of genomic DNA, respectively) with a R2 of 0.9970. The LOD was 0.10%, which is roughly calculated to be 36 copies/μL based on maize haploid genome sizes. As presented in Table 1, the proposed method displayed comparable sensitivity than real-time quantitative PCR and DNA sensors coupled with preamplification.

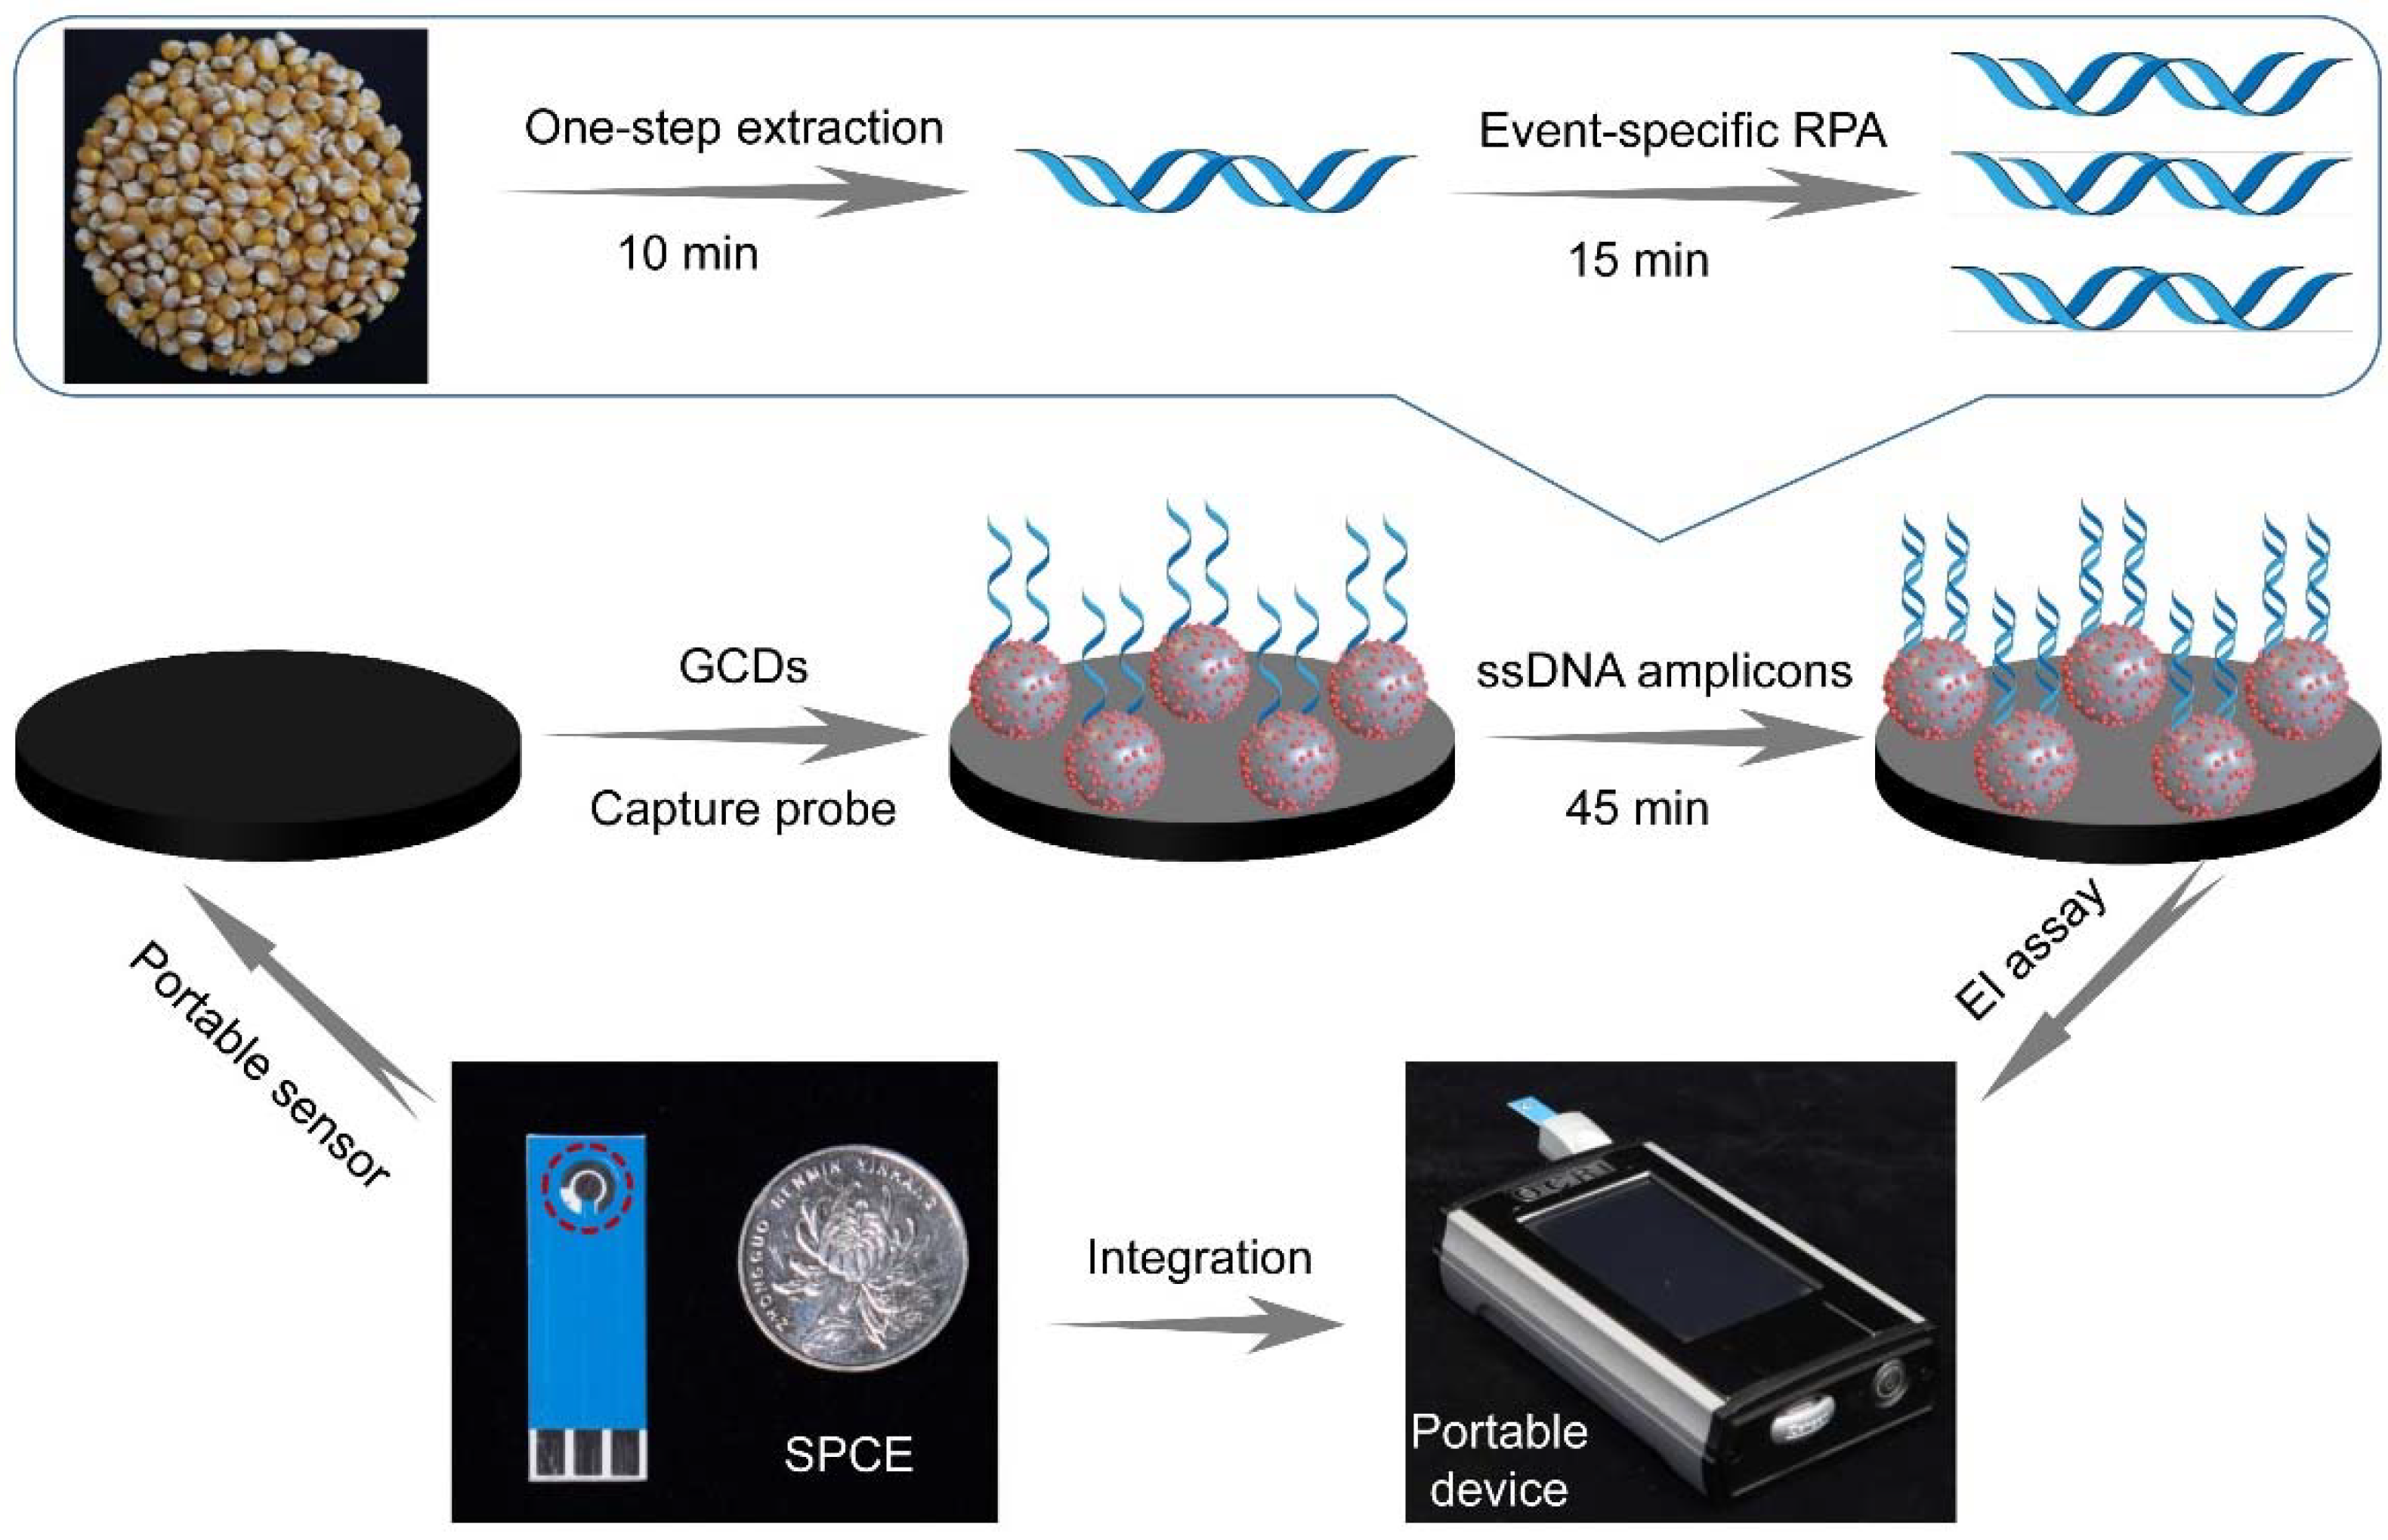
3.6. Identification of GM Maize in Entire Process

To identify GM crops conveniently, a one-step extraction pretreatment was employed to shorten the extraction time and to omit extraction purification steps. In this manner, different contents of GM maize seed were rapidly extracted within 10 min. The extracted cell lysate as the DNA temple was then directly added into the RPA system for rapid amplification within 15 min. Finally, the portable DNA sensor device was used for amplification products assay within 45 min. GM maize Ruifeng12-5 samples at contents of 10%, 1.0% and 0.10% were prepared by mixing homozygous Ruifeng12-5 seeds with non-GM maize seeds. The prepared Ruifeng12-5 samples were verified using real-time quantitative PCR with the standard reference method NY/T 2259.12-2015 (Ministry of Agriculture and Rural Affairs of China). As displayed in Supplementary Figure S10, the Cts of GM maize samples at contents of 100%, 10%, 1.0% and 0.10% were 24.9, 29.8, 31.5 and 34.1, respectively, while no signals were found in non-GM maize. These genuine samples were then detected by using the developed DNA sensor coupled with RPA and one-step extraction. As shown in Figure 5B, it was observed that the ΔRet response generated as low as 0.10% can be distinguished from that of non-GM maize, exhibiting adequate sensitivity to detect GM content up to a labeling threshold, such as 0.9% in EU. The proposed cascade system can be performed with a facile procedure within 1.3 h in resource-limited laboratory equipped with a water bath, pipettor and ready-to-use sensor.

4. Conclusions

In summary, GCDs were originally used to develop a facile EI genosensor for the detection of GM maize Ruifeng12-5 with the simplicity of structure and manipulation. The proposed RPA-based genosensor could detect Ruifeng12-5 down to 0.10%. Moreover, the developed label-free biosensor exhibited an exceptionally simple platform without DNA labeling or a hybridization indicator. The proposed DNA sensor was an easy-to-use device due to its convenient construction by inserting an SPCE into the handheld EI analyzer. Results can be read directly on the screen of biosensor without computer connections, and this biosensor can be used conveniently by nonprofessionals. Coupled with facile pretreatment with one-step extraction and RPA amplification, the developed cascade system was capable for the detection of genuine seed samples in resource-limited laboratory. Therefore, the proposed method provides an alternative platform with simplicity, sensitivity and specificity for the detection of GM organisms.

Supplementary Materials

The following supporting information can be downloaded at: https://0-www-mdpi-com.brum.beds.ac.uk/article/10.3390/agriculture12040454/s1, Figure S1: XPS of GCDs.; Figure S2: CV spectra of electrodes; Figure S3: Effect of the amount ratio of chitosan and GCDs on the ΔRet response; Figure S4: Effect of immobilization time of capture probe on the ΔRet response; Figure S5: Effects of hybridization time between capture probe and target sequence on the ΔRet response; Figure S6: Effects of hybridization temperature between capture probe and target sequence on the ΔRet response; Figure S7: Agarose gel electrophoresis of RPA products at various reaction temperatures; Figure S8: Agarose gel electrophoresis of RPA products from various primer concentrations; Figure S9: Agarose gel electrophoresis of RPA products at various reaction time; Figure S10. The real-time PCR amplified curves from maize Ruifeng 12-5 at different contents.

Author Contributions

Conceptualization, D.C. and S.Z.; methodology, D.C., S.Z., Y.W. and J.L.; software, D.C. and X.Y.; resources, Y.W., P.S. and G.W.; validation, D.C., S.Z. and Y.Y.; supervision, H.G. and G.W.; writing—original draft preparation, D.C. and H.G.; writing—review and editing, H.G., P.S., Y.W. and G.W.; project administration, P.S. and H.G. All authors have read and agreed to the published version of the manuscript.

Funding

This research was funded by the National Grand Project of Science and Technology (2021ZX08013001-005-002), the Natural Science Foundation of Hubei Province (2020CFB872) and the Central Public-interest Scientific Institution Basal Research Fund (1610172021004).

Institutional Review Board Statement

Not applicable.

Informed Consent Statement

Not applicable.

Data Availability Statement

Data is available from its original source as cited in the article.

Conflicts of Interest

The authors declare no conflict of interest.

References

  1. ISAAA. Global Status of Commercialized Biotech/GM Crops in 2019: Biotech Crops Drive Socio-Economic Development and Sustainable Environment in the New Frontier; ISAAA Briefs NO. 55; ISAAA: Ithaca, NY, USA, 2019. [Google Scholar]
  2. Cottenet, G.; Blancpain, C.; Sonnard, V.; Chuah, P.F. Development and validation of a multiplex real-time PCR method to simultaneously detect 47 targets for the identification of genetically modified organisms. Anal. Bioanal. Chem. 2013, 405, 6831–6844. [Google Scholar] [CrossRef] [PubMed]
  3. Li, X.F.; Wu, Y.H.; Li, J.; Li, Y.J.; Long, L.K.; Li, F.W.; Wu, G. Development and Validation of A 48-Target Analytical Method for High-throughput Monitoring of Genetically Modified Organisms. Sci. Rep. 2015, 5, 7616. [Google Scholar] [CrossRef] [PubMed] [Green Version]
  4. Rosa, S.F.; Gatto, F.; Angers-Loustau, A.; Petrillo, M.; Kreysa, J.; Querci, M. Development and applicability of a ready-to-use PCR system for GMO screening. Food Chem. 2016, 201, 110–119. [Google Scholar] [CrossRef]
  5. Rao, J.; Yang, L.; Guo, J.; Quan, S.; Chen, G.; Zhao, X.; Zhang, D.; Shi, J. Development of event-specific qualitative and quantitative PCR detection methods for the transgenic maize BVLA430101. Eur. Food Res. Technol. 2016, 242, 1277–1284. [Google Scholar] [CrossRef]
  6. Yang, L.T.; Yang, Y.; Jin, W.J.; Zhang, X.J.; Li, X.Y.; Wu, Y.H.; Li, J.; Li, L. Development and Interlaboratories Validation of Event-Specific Quantitative Real-Time PCR Method for Genetically Modified Rice G6H1 Event. J. Agric. Food Chem. 2018, 66, 8179–8186. [Google Scholar] [CrossRef]
  7. Li, J.; Macdonald, J. Advances in isothermal amplification: Novel strategies inspired by biological processes. Biosens Bioelectron. 2015, 64, 196–211. [Google Scholar] [CrossRef]
  8. Lutz, S.; Weber, P.; Focke, M.; Faltin, B.; Hoffmann, J.; Müller, C.; Mark, D.; Roth, G.; Munday, P.; Armes, N.; et al. Microfluidic lab-on-a-foil for nucleic acid analysis based on isothermal recombinase polymerase amplification (RPA). Lab. Chip. 2010, 10, 887–893. [Google Scholar] [CrossRef]
  9. Xu, Y.; Wei, Y.; Cheng, N.; Huang, K.; Wang, W.; Zhang, L.; Xu, W.; Luo, Y. Nucleic Acid Biosensor Synthesis of an All-in-One Universal Blocking Linker Recombinase Polymerase Amplification with a Peptide Nucleic Acid-Based Lateral Flow Device for Ultrasensitive Detection of Food Pathogens. Anal. Chem. 2018, 90, 708–715. [Google Scholar] [CrossRef]
  10. Hu, M.; Yuan, C.; Tian, T.; Wang, X.; Sun, J.; Xiong, E.; Zhou, X. Single-Step, Salt-Aging-Free, and Thiol-Free Freezing Construction of AuNP-Based Bioprobes for Advancing CRISPR-Based Diagnostics. J. Am. Chem. Soc. 2020, 142, 7506–7513. [Google Scholar] [CrossRef]
  11. Wang, X.; Xiong, E.; Tian, T.; Cheng, M.; Lin, W.; Wang, H.; Zhang, G.; Sun, J.; Zhou, X. Clustered Regularly Interspaced Short Palindromic Repeats/Cas9-Mediated Lateral Flow Nucleic Acid Assay. ACS Nano 2020, 14, 2497–2508. [Google Scholar] [CrossRef]
  12. An, N.; Li, K.; Zhang, Y.; Wen, T.; Liu, W.; Liu, G.; Li, L.; Jin, W. A multiplex and regenerable surface plasmon resonance (MR-SPR) biosensor for DNA detection of genetically modified organisms. Talanta 2021, 231, 122361. [Google Scholar] [CrossRef] [PubMed]
  13. Mannelli, I.; Minunni, M.; Tombelli, S.; Mascini, M. Quartz crystal microbalance (QCM) affinity biosensor for genetically modified organisms (GMOs) detection. Biosens. Bioelectron. 2003, 18, 129–140. [Google Scholar] [CrossRef]
  14. Chen, D.; Zhang, M.; Ma, M.; Hai, H.; Li, J.; Shan, Y. A novel electrochemical DNA biosensor for transgenic soybean detection based on triple signal amplification. Anal. Chim. Acta 2019, 1078, 24–31. [Google Scholar] [CrossRef] [PubMed]
  15. Huang, L.; Zheng, L.; Chen, Y.; Xue, F.; Cheng, L.; Adeloju, S.B.; Chen, W. A novel GMO biosensor for rapid ultrasensitive and simultaneous detection of multiple DNA components in GMO products. Biosens. Bioelectron. 2015, 66, 431–437. [Google Scholar] [CrossRef]
  16. Placido, A.; Pereira, C.; Guedes, A.; Fatima Barroso, M.; Miranda-Castro, R.; De-los-Santos-Alvarezd, N.; Delerue-Matos, C. Electrochemical genoassays on gold-coated magnetic nanoparticles to quantify genetically modified organisms (GMOs) in food and feed as GMO percentage. Biosens. Bioelectron. 2018, 110, 147–154. [Google Scholar] [CrossRef] [Green Version]
  17. Li, Y.; Sun, L.; Liu, Q.; Han, E.; Hao, N.; Zhang, L.; Wang, S.; Cai, J.; Wang, K. Photoelectrochemical CaMV35S biosensor for discriminating transgenic from non-transgenic soybean based on SiO2@CdTe quantum dots core-shell nanoparticles as signal indicators. Talanta 2016, 161, 211–218. [Google Scholar] [CrossRef]
  18. Zhu, D.; Liu, J.; Tang, Y.; Xing, D. A reusable DNA biosensor for the detection of genetically modified organism using magnetic bead-based electrochemiluminescence. Sens. Actuators B Chem. 2010, 149, 221–225. [Google Scholar] [CrossRef]
  19. Bonanni, A.; Esplandiu, M.J.; Del Valle, M. Impedimetric genosensors employing COOH-modified carbon nanotube screen-printed electrodes. Biosens. Bioelectron. 2009, 24, 2885–2891. [Google Scholar] [CrossRef]
  20. Wang, S.; Liu, Q.; Li, H.; Li, Y.; Hao, N.; Qian, J.; Zhu, W.; Wang, K. Fabrication of label-free electrochemical impedimetric DNA biosensor for detection of genetically modified soybean by recognizing CaMV 35S promoter. J. Electroanal. Chem. 2016, 782, 19–25. [Google Scholar] [CrossRef]
  21. Bolat, G.; Yaman, Y.T.; Abaci, S. Molecularly imprinted electrochemical impedance sensor for sensitive dibutyl phthalate (DBP) determination. Sens. Actuators B Chem. 2019, 299, 127000. [Google Scholar] [CrossRef]
  22. Mousavisani, S.Z.; Raoof, J.B.; Turner, A.; Ojani, R.; Mak, W.C. Label-free DNA sensor based on diazonium immobilisation for detection of DNA damage in breast cancer 1 gene. Sens. Actuators B Chem. 2018, 264, 59–66. [Google Scholar] [CrossRef]
  23. Aghili, Z.; Nasirizadeh, N.; Divsalar, A.; Shoeibi, S.; Yaghmaei, P. A nanobiosensor composed of Exfoliated Graphene Oxide and Gold Nano-Urchins for detection of GMO products. Biosens. Bioelectron. 2017, 95, 72–80. [Google Scholar] [CrossRef] [PubMed]
  24. Fortunati, S.; Rozzi, A.; Curti, F.; Giannetto, M.; Corradini, R.; Careri, M. Novel amperometric genosensor based on peptide nucleic acid (PNA) probes immobilized on carbon nanotubes-screen printed electrodes for the determination of trace levels of non-amplified DNA in genetically modified (GM) soy. Biosens. Bioelectron. 2019, 129, 7–14. [Google Scholar] [CrossRef] [PubMed]
  25. Ji, C.; Zhou, Y.; Leblanc, R.M.; Peng, Z. Recent Developments of Carbon Dots in Biosensing: A Review. ACS Sens. 2020, 5, 2724–2741. [Google Scholar] [CrossRef] [PubMed]
  26. Xie, X.; Hua, X.; Wang, Z.; Yang, X.; Huang, H. Real-Time Imaging Redox Status in Biothiols and Ferric Metabolism of Cancer Cells in Ferroptosis Based on Switched Fluorescence Response of Gold Carbon Dots. Anal. Chem. 2020, 92, 11420–11428. [Google Scholar] [CrossRef] [PubMed]
  27. Zhang, L.; Wang, D.; Huang, H.; Liu, L.; Zhou, Y.; Xia, X.; Deng, K.; Liu, X. Preparation of Gold-Carbon Dots and Ratiometric Fluorescence Cellular Imaging. ACS Appl. Mater. Interfaces 2016, 8, 6646–6655. [Google Scholar] [CrossRef] [PubMed]
  28. Li, J.; Li, L.; Zhang, L.; Zhang, X.; Li, X.; Zhai, S.; Gao, H.; Li, Y.; Wu, G.; Wu, Y. Development of a certified genomic DNA reference material for detection and quantification of genetically modified rice KMD. Anal. Bioanal. Chem. 2020, 412, 7007–7016. [Google Scholar] [CrossRef]
  29. Arumuganathan, K.; Earle, E.D. Nuclear DNA content of some important plant species. Plant Mol. Biol. Rep. 1991, 9, 208–218. [Google Scholar] [CrossRef]
  30. Hou, J.; Dong, J.; Zhu, H.; Teng, X.; Ai, S.; Mang, M. A simple and sensitive fluorescent sensor for methyl parathion based on L-tyrosine methyl ester functionalized carbon dots. Biosens. Bioelectron. 2015, 68, 20–26. [Google Scholar] [CrossRef]
  31. Kalogianni, D.P.; Koraki, T.; Christopoulos, T.K.; Ioannou, P.C. Nanoparticle-based DNA biosensor for visual detection of genetically modified organisms. Biosens. Bioelectron. 2006, 21, 1069–1076. [Google Scholar] [CrossRef]
  32. Cheng, N.; Shang, Y.; Xu, Y.; Zhang, L.; Luo, Y.; Huang, K.; Xu, W. On-site detection of stacked genetically modified soybean based on event specific TM-LAMP and a DNAzyme-lateral flow biosensor. Biosens. Bioelectron. 2017, 91, 408–416. [Google Scholar] [CrossRef] [PubMed]
  33. Li, K.; Luo, Y.; Huang, K.; Yang, Z.; Wan, Y.; Xu, W. Single universal primer recombinase polymerase amplification-based lateral flow biosensor (SUP-RPA-LFB) for multiplex detection of genetically modified maize. Anal. Chim. Acta 2020, 1127, 217–224. [Google Scholar] [CrossRef] [PubMed]
Figure 1. (A) TEM image, (B) HAADF-STEM and (C) ABF-STEM images of GCDs and the (D) structure of GCDs. SEM images of (E) bare and (F) GCD-doped chitosan modified working electrodes.
Agriculture 12 00454 g001
Figure 2. Schematic illustration of GCD-based EI genosensor coupled with one-step extraction and event-specific RPA for the identification of GM maize.
Agriculture 12 00454 g002
Figure 3. Specificity of the proposed RPA-based EI genosenor.
Agriculture 12 00454 g003
Figure 4. (A) Agarose gel electrophoresis and (B) lateral flow strip of RPA products from different contents of genomic DNA; NTC: no-template control.
Agriculture 12 00454 g004
Figure 5. (A) Ret responses of Ruifeng12-5 genomic DNA at different contents from TE buffer, and NTC and 0.050–10% using the developed sensor coupled with RPA; inset: calibration curves, where n = 5 for each point. (B) Ret responses of non-GM maize, 0.10%, 1.0% and 10% contents of GM maize Ruifeng12-5 using the proposed DNA senor coupled with one-step extraction and RPA methods, five measurements from the same RPA solution for each point; inset: EI spectra.
Agriculture 12 00454 g005
Table 1. Comparison of current available DNA-based methods for the determination of GM crops.
MethodAnalyteLODReference
Qualitative PCRRapeseed MS12.5 copies/μL[5]
Rapeseed RF150 copies/μL
Rapeseed RF25.0 copies/μL
Real-time PCRRice G6H110 copies/μL[6]
Multiplex real-time PCR9 taxon-, 10 element- and 28 event-specific targets1.0–16 copies/μL[2]
Ready-to-use PCR plates7 taxon-, 5 element-, 1 construct- and 3 event-specific targets5.0–20 copies/μL[4]
Electrochemical biosensorGM soybean and rice0.10% GM content[15]
Forster resonance energy transfer assayCaMV35s0.50% GM content[17]
Dry-reagent DNA biosensorCaMV35s and NOS0.10% GM content[31]
DNAzyme-lateral flow biosensorDP305423 × GTS 40-3-2 soybean0.10% GM content[32]
SUP-RPA-lateral flow biosensorMON810, MON863, MON8903450 copies/μL[33]
RPA-based EI genosensor Maize Ruifeng 12-50.10% GM content
(36 copies/μL)
The proposed method
Publisher’s Note: MDPI stays neutral with regard to jurisdictional claims in published maps and institutional affiliations.

