Article

LASAM Model: An Important Tool in the Decision Support System for Policymakers and Farmers

1
Economic and Social Development Faculty, Latvia University of Life Sciences and Technologies, 18 Svetes Street, LV-3001 Jelgava, Latvia
2
Department of Bioeconomics, Institute of Agricultural Resources and Economics, 14 Struktoru Street, LV-1039 Riga, Latvia
3
Information Technology Faculty, Latvia University of Life Sciences and Technologies, 2 Liela Street, LV-3001 Jelgava, Latvia
*
Author to whom correspondence should be addressed.
Submission received: 20 March 2022 / Revised: 8 May 2022 / Accepted: 12 May 2022 / Published: 17 May 2022
(This article belongs to the Special Issue Application of Decision Support Systems in Agriculture)

Abstract

:
Today’s global food system (including production, transportation, processing, packing, storage, retail sale, consumption, losses and waste) provides income to more than a billion people all over the world and makes up a significant part of many countries’ economies. The 21st century’s food systems that bring food from “farm to fork” face various challenges, including a shortage of agricultural land and water, competition with the energy industry, changes in consumption preferences, a rising global population, negative effects of climate change, etc. Therefore, many countries are working on creating various models to function as an important decision support system tool for policymakers, farmers and other stakeholders. Various agricultural sector models see particularly extensive use in the European Union (EU), determining the impact of the Common Agricultural Policy (CAP) and helping to create future development scenarios. This is why a special model adapted to the national conditions, called LASAM (Latvian Agricultural Sector Analysis Model), was created in Latvia, making it possible to use historical data on the development of agricultural sectors, medium-term price projections for agricultural products in the EU, changes in support policy, as well as the necessity for the resources used to project the long-term (up to 2050) development of agriculture. The LASAM model covers the crop sector, the animal sector and the overall socioeconomic development, as well as the growth of organic farming and greenhouse gas (GHG) emissions. This paper discusses the main objectives achieved in developing a decision support tool and presenting the research results: LASAM was used to prepare projections of the possible development of Latvia’s principal sectors of agriculture until 2050, considering the necessity to reduce GHG emissions, made available through the LASAM web application. Given that the projection data obtained by LASAM are public, they can be used (1) for national policy making in rural business development, which affects the development of the economy as a whole; and (2) internationally, to compare the projections made in Latvia with those obtained through various agricultural sector models and projected development trends.

1. Introduction

Agriculture is a unique sector of the economy that converts raw materials into agricultural products and involves the use of immediate weather conditions (temperature, precipitations, and the solar radiation available to the plant) [1]. Agriculture and food systems include various fields of activities associated with the manufacture of agricultural products (food and non-food), fisheries, processing, distribution, retail sale, consumption, and disposal of unused products. Food systems include a broad range of stakeholders—people and organizations—as well as the sociopolitical, economic, technological and natural environments, in which the production of food takes place [2,3]. Today’s global food system (including production, transportation, processing, packing, storage, retail sale, consumption, losses and waste) provides income to more than a billion people all over the world. As a business activity, agriculture generates 1% to 60% of the GDP in different countries, with a global average of approximately 4% in 2017 [4]. The global value added of agriculture, forestry and fishing rose by 68% in real terms between 2000 and 2018, reaching USD 3.4 trillion, an increase of USD 1.4 trillion compared with 2000. Agriculture is still the second biggest source of employment in the world, behind the service sector [5]. Agriculture and food production are also critical for the economy and society of the EU. In 2016, the 28 Member States of the EU had some 11 million farms, with 22 million people regularly employed in agriculture. Put together, agriculture and food production provided 44 million jobs in the EU [6]. Investments in agriculture and food production have a multiplier effect on other sectors, such as services and manufacturing, which helps to further improve food security and economic development [2]. At the same time, modern agriculture puts a significant strain on biodiversity, topsoil, water and the atmosphere, which will only increase with time if the current trends of an increasing population, rising meat and energy consumption, and food waste are to continue. Thus, agricultural production that is efficient but reduces environmental impact is rising in importance [7]. Agriculture also generates a significant amount of GHG emissions, accounting for more than 10% of the total CO2 emissions in the EU-28 [8]. Global food systems promote greenhouse gas emissions, and reducing these emissions is a critical component of solving the problems of climate change. There are various tools for decision making support that agricultural producers could use to assess if their business decisions affect emissions [9]. However, policymakers also need such tools to support them in their decision making in order to lead them to evidence-based policies in food and agriculture industries [10]. Researchers have noted that farmers find it difficult to access information about weather, fertility of land, technologies and other topics that they need. Administrative bodies also lack the information they need to make effective management decisions. Digital technologies can solve these problems [11]. This is why different projection models can provide a structured method for thinking about the adaptation of agriculture to climate change and a science-based study of the effect of various factors on the potential development of agriculture. At least 70 years of research into the implementation of agricultural innovation have resulted in a growing spread of the projection models used [12]. This is why discoveries made through research are compiled using mathematical models. Because models simplify complex real conditions, one must assess if the models are appropriate to the specific use and the real conditions pertaining to it [13]. Such models can be used by farmers, various stakeholders interested in the development of agriculture, and policymakers. The modelling support tools available to and used by farmers are employed in various fields. Models often see use in projecting the utilization of agricultural land in order to create accurate maps for projecting changes in the use of land in future scenarios [14], for GIS application maps [14,15], and in projecting crop harvests [13]. Researchers point out that land-use models are one of the key elements of global balancing models, intended to describe food supply and assess agriculture in the future [16]. This is because land use is critical to produce food, animal feed, fibrous materials and fuel, and it affects the Earth’s biogeochemistry, biogeophysics, biodiversity, and climate. To achieve a quantitative understanding of the effect of agriculture on the Earth’s system, the best models must include the best technical knowledge and data about land use [17]. In crop farming, agricultural land suitability analysis (ALSA) is one of the principal tools for achieving sustainable agriculture and attaining the current global food supply target set in the United Nations Sustainable Development Goals (SDG) [18]. ALMaSS and similar models can help to achieve more economical use of resources, and, with the assessment of the significance of multiple criteria in decision making, improve the results of governance appropriate to its goals and location [19]. To assess agricultural development until 2050, Brazil uses the global partial equilibrium model GLOBIOM-Brazil, which determines the competition for the use of land among different industries: agriculture, forestry and bioenergy, which reflects the special circumstances of Brazil [20]. Researchers emphasize that technological change has a decisive role in agriculture, making it possible to satisfy future demand for agricultural products. However, so far, agricultural sector models and models for changes in land use have been found to be deficient due to a lack of data [21].
Some models perform a general, integrated assessment and projection of crop yields. These include general equilibrium models, such as IMAGE-MAGNET or AIM, partial equilibrium models, e.g., GLOBIOM, GCAM, MAgPIE, IMPACT, as well as gridded crop models (GGCMs) [21,22,23]. They perform comprehensive analyses to determine the reasons why different crop models (for the production and productivity of different crops) result in significantly different results under various climate projections. This is carried out to determine what biophysical processes and what deficiencies in knowledge create this uncertainty, and what factors should be prioritized to improve the reliability of results [24]. One can find out about changes in wheat harvests in Western Australia using a simple generalized additive model (GAM), which can be set up in a user-friendly online tool, so that it can be used by crop farmers and their consultants [25]. However, the United Kingdom (UK) uses meta-models to assess the productivity of improved (permanent, temporary) and semi-natural grassland systems [26].
Particular attention in agricultural modelling is paid to the management of water resources [27]. Global climate change is causing more frequent and destructive floods. To understand the threat of flooding in the future, the research literature discusses current and future flooding risks in the 21st-century in China, using historical weather observation data and the results of global climate models (GCM) [28]. Inconsistencies in flood projections give rise to caution, especially among those policymakers who are in charge of managing water resources, reducing the risk of floods and adapting to climate change on a regional and local scale [29]. The studies propose the latest system and decision ma-king approach to assess the possible risk of water shortage, using these methods to eliminate the threats identified based on regional risk assessment (RRA) scenarios [30]. Because there are concerns of the effects of climate change and their variability on global agricultural production [31], many studies are devoted to modelling the impact of climate change. For example, by 2050, the average loss of topsoil due to water erosion can rise 13–22.5% in the EU and UK agricultural regions, compared with the 2016 baseline. These projections were made using a combined land use and climate change model system [32]. The ISI-MIP model was created to project the effect of global warming on agricultural, water, biomass production and other sectors [33]. The models identify climate change scenarios to study the availability of water for agriculture, to assess changes in ecosystem services and the effect of climate on the possible adaptation of harvests and crops, and the possibility of reducing the spread of livestock diseases [20,34,35,36].
The purpose of global and regional agriculture modelling systems is to provide the latest information on the various stakeholders and decision makers involved in the production of foods in order to support global and national food supply [23]. This is why the research literature includes evidence of assessing and making projections about various sectors, fields, activities. For example, a financial decision making support system has been developed to help reduce financial risks and aid the stable growth of small and medium enterprises in the agricultural sector [37]. There are assessments of labor productivity and the effectiveness of the worker performing certain types of work [38]. There are projections of the economic situation [39] and changes in the prices of products, land and the workforce [40]. Some models show changes in consumption trends to determine the growth potential of the agricultural sector [41] and the market situation to improve the efficiency of agriculture [42]. There are projections of a rising population, income and the level of consumption having a long-term effect on agriculture [43], etc.
Many general equilibrium models see more use in projecting the development of global food markets and supporting the analysis of future-orientated policy [44,45,46,47,48]. EU decision makers have traditionally employed the results of various quantitative models, choosing from various political tool options. For example, the AGMEMOD model has been used to analyze scenarios for multiple reforms in EU agricultural policy [49,50]. The simulation models most commonly applied in the EU are: (a) systems dynamic; (b) agent-based; (c) hybrid; (d) discrete event models. To model its agricultural sector, the EU institutions use GEM-E3, MAGNET, AGLINK, CAPRI, AGMEMOD, ESIM, GLOBIOM-EU, AgriPoliS, FeedMod, POLES, the IHS Global Link Model [51].
The LASAM model has several advantages and also limitations in comparison to the mentioned models used at the EU level. Firstly, the LASAM model can be used only for a small open economy. That means an assumption that changes in supply of the economy do not have implications on prices. A small open economy is a price taker, as changes in supply of commodities have no impact on the price. For this reason, prices on agricultural commodities are exogenous. The advantage of the LASAM model is its ability to make very detailed projections at the sub-sectoral level for different farm sizes, make integrated calculations of socioeconomic indicators and integrated calculations of GHG emissions according to the Intergovernmental Panel on Climate Change methodology used for GHG emissions inventories.
The future implementation of the EU CAP in the context of the Green Deal will require an assessment to achieve the goals of the Green Deal and to speed up the transition to sustainable food systems [52]. This is why the responsible ministries of decision and policymaking, as well as stakeholder organizations and researchers, devote much attention to a detailed and in-depth analysis of agriculture and the aspects associated with it, so that based on historical development, they can identify the potential for adapting to many global challenges to be faced in the future, and project the possible development of these challenges.
Agriculture and food processing make up a significant proportion of the economy in Latvia as well, generating 4.75% of the country’s gross domestic product, 23% of the total value of exports, and providing some 100 thousand rural jobs in 2020. Farming businesses manage 36% of the total area of the country [53]. Thus, in view of prior research, our goal is to quantitatively determine the agricultural development outlook for 2050, based on land-use practice and the historical development of the sectors using the original LASAM model. Therefore, the study analyzed and included the following question and goal: (1) To provide interested parties—policymakers, farmers and others—with the decision making information they need through a publicly available representation of the model’s results. (2) How well does the LASAM model represent the situation in different sectors of agriculture, and does it make it possible to project their development in Latvia until 2050?

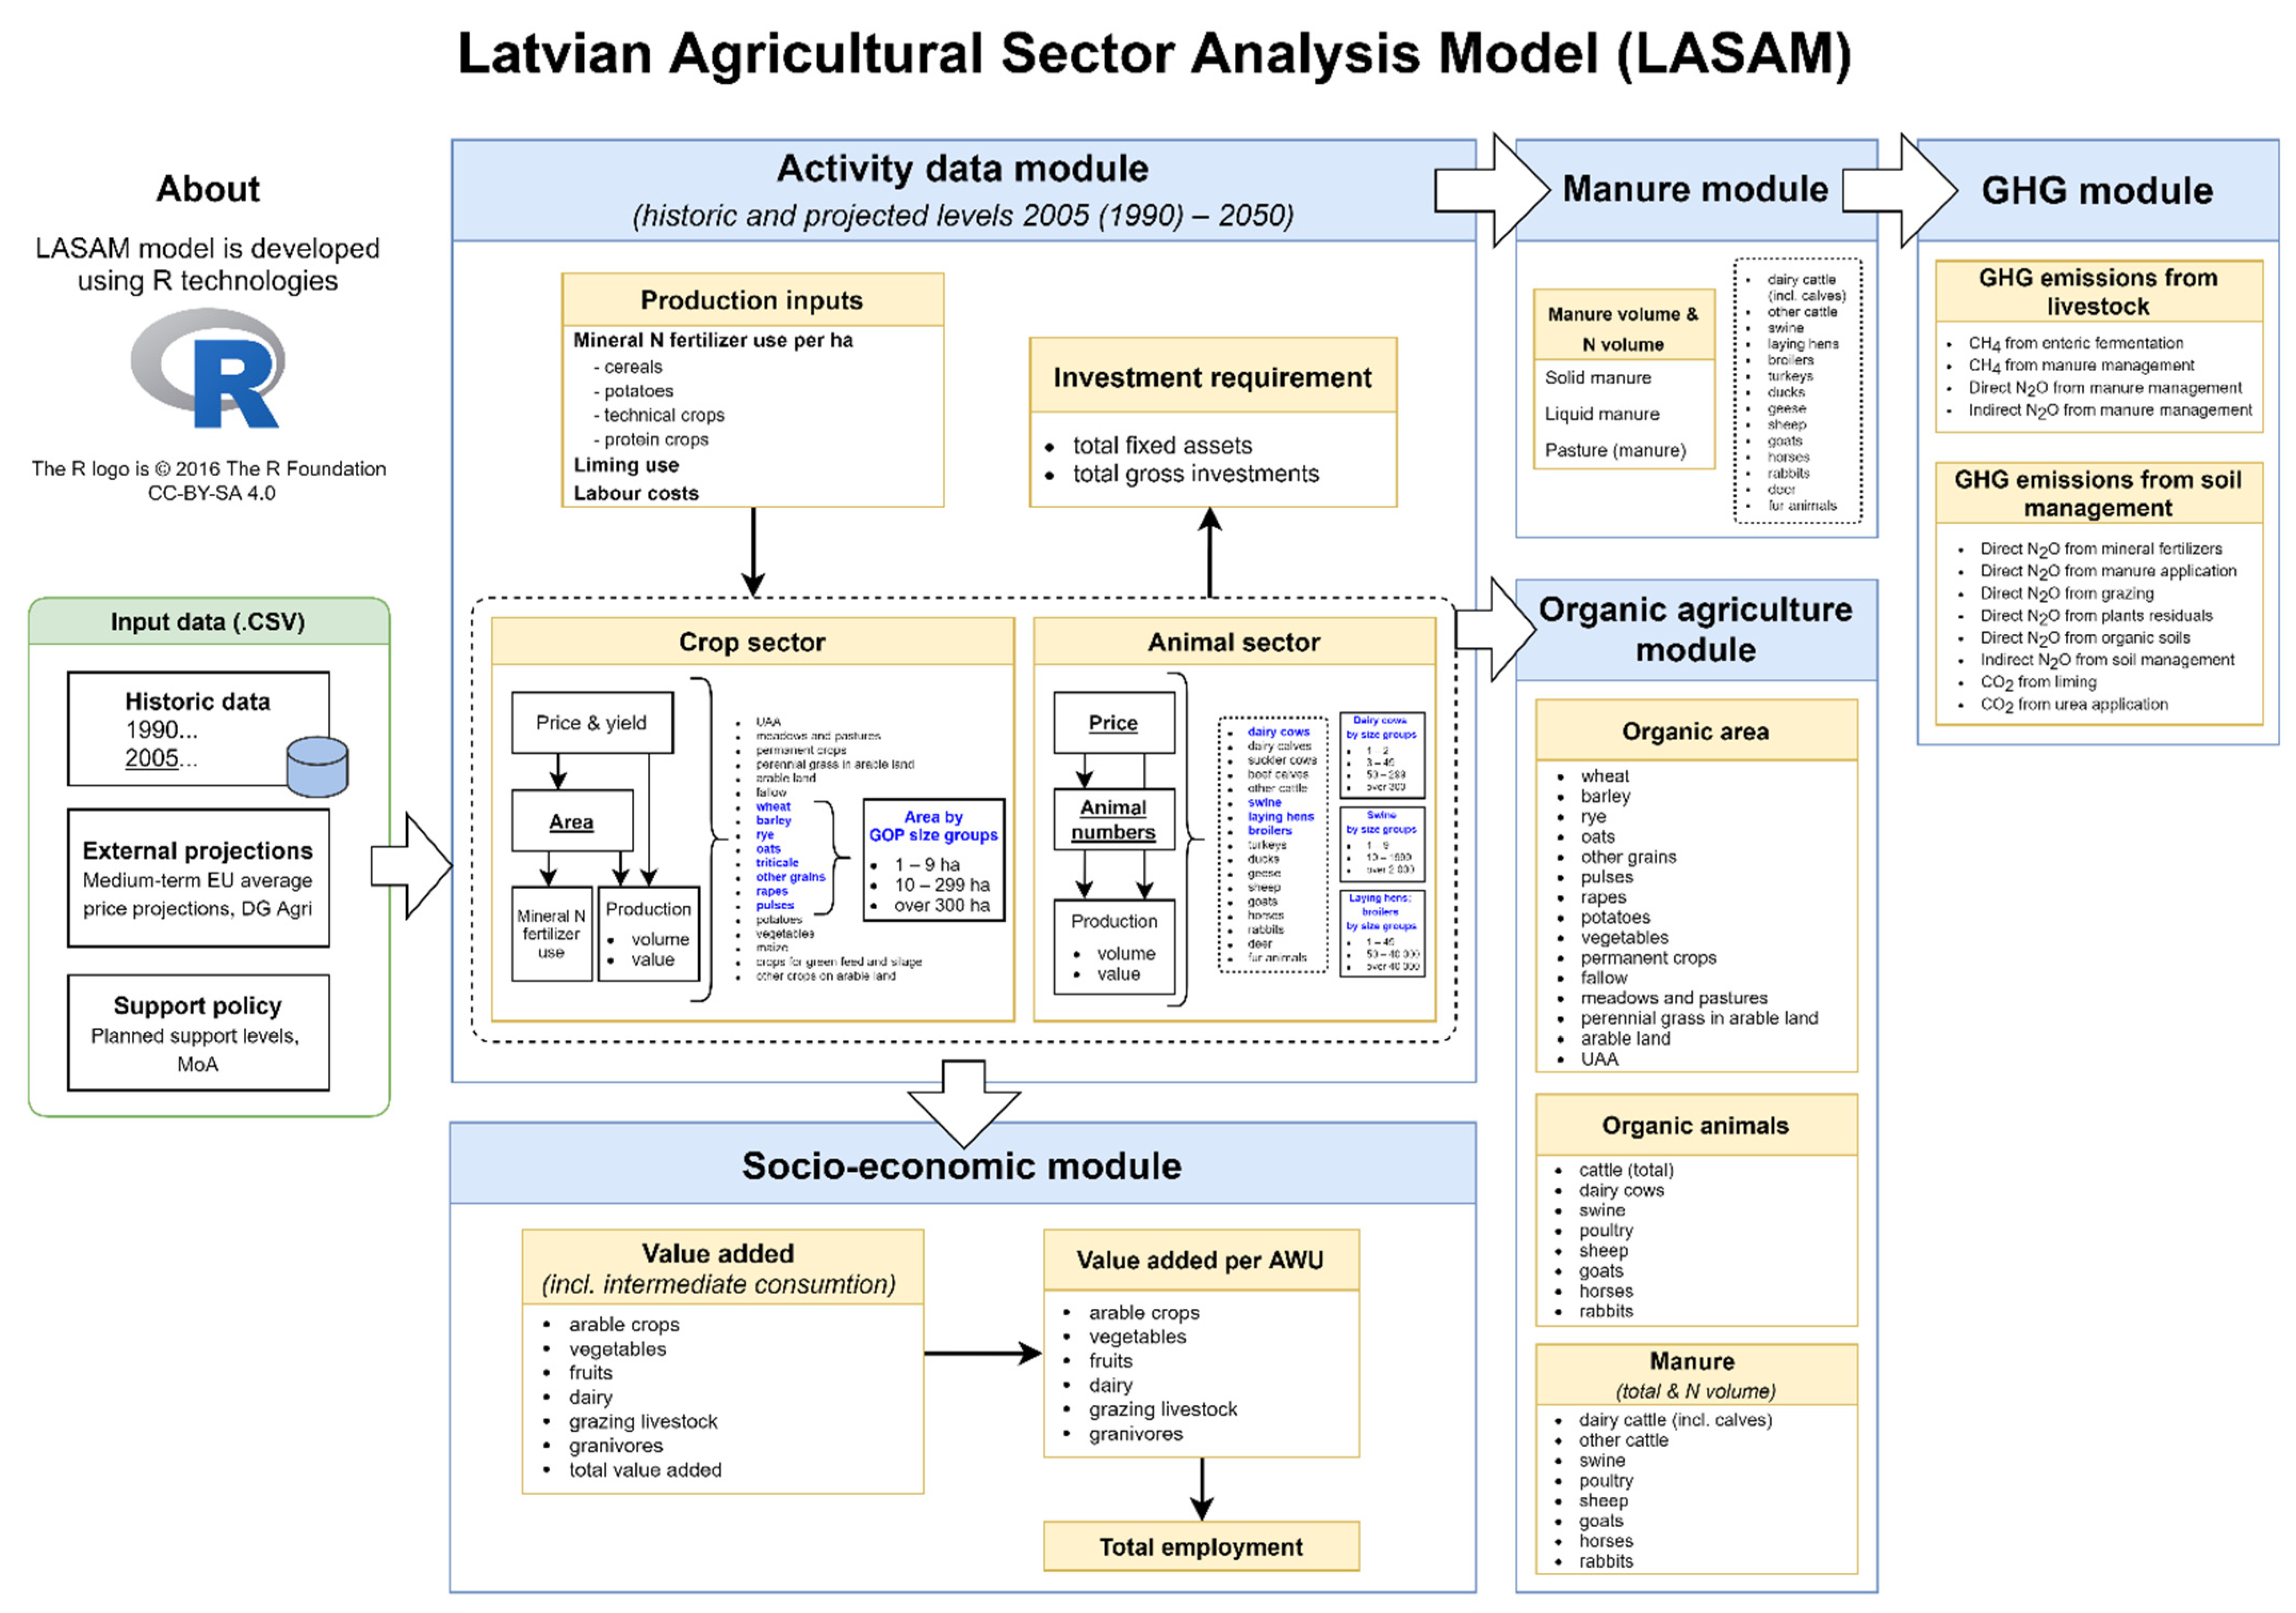
2. Materials and Methods

LASAM was developed at the Latvia University of Life Sciences and Technologies in 2016 as an econometric, recursive, multi-period scenario model to generate projections for the Latvian agricultural sector until 2050. The model covers all agricultural sectors, and it was developed considering the special features and trends of each sector. The model makes it possible to assess the development of agricultural sectors under different scenarios, with a particular focus on assessing the potential impact of climate change policy. Using LASAM parameters, exogenous data and lagged endogenous data, one can make projections for the model’s endogenous variables over a set of alternative policy scenarios and over a given projection period.
Initially, the model generated projections for so-called activity data, which were further used within the national GHG inventory (National inventory report) to project emissions from agriculture. In the following years (up to 2021), the model was refined, and new modules and components were introduced. As the model lacked the socio-economic information that could be used for policy analysis and planning, including information on the effects on value added, productivity and employment in agriculture, a socio-economic module was introduced in 2017. Later, an investment component was also added to obtain projections for total fixed assets and gross investments in agriculture. The introduction of a GHG module allowed the generation of projections of agricultural GHG emissions by the model (GHG emission calculation methodology is based on the National inventory report). In 2019, the model was expanded to include a farm size component, making it possible to obtain projections by area and by animal herd size for the main agricultural sectors. For the purpose of assessing GHG emissions, a manure module was also added, yielding projections on total manure and manure N distribution, including solid manure, liquid manure and manure deposited on pasture. The same year, the model was also complemented with an organic agriculture module to generate projections for organic agriculture in Latvia.
Input data for the model come from a variety of sources. The key information sources of historic data include the Central Statistical Bureau of Latvia (agricultural statistics), the Agricultural Data Centre (data from animal and dairy register), the Institute of Agricultural Resources and Economics (Farm Accountancy Data Network (FADN), Economic Accounts for Agriculture data), the Rural Support Service (data on registered utilized agricultural area (UAA), the Ministry of Agriculture (data on organic farming) and the National Inventory Report (data on GHG emission factors). Some historic data series start from 1990, but almost all the data are available from 2005. The model also uses external projections for the average prices of main agricultural products in the EU based on the medium-term outlook by DG Agriculture and Rural Development. Additionally, information about the planned support levels comes from the Ministry of Agriculture.
The projections for activity data are mainly based on time-series and regression ana-lysis and equations. For example, the UAA area is projected depending on the changes in the revenue-cost ratio. The calculation of the revenue-cost ratio assumes that wheat is a significant driver of the UAA, meaning that revenue consists of the average price of wheat in the previous and current year, multiplied by the corresponding average wheat yield, which, in order to consider the motivating aspect for development (there is higher supply and lower price in a year with a good harvest and vice versa), is compared to the average productivity in the period since 2005; the revenue side also includes expected single area payments for the two upcoming years. While labor costs are considered an influencing factor in the cost side (cost per annual work unit (AWU) expressed per area (ha) managed per AWU). For price projections, exogenous data on commodity prices developments from the medium-term EU agricultural outlook are used; the planned support level is also an exogenous variable, while all other variables are obtained endogenously, projected by LASAM.
The results summary devotes attention to the following years: (1) 2005 as the reference year for the policy to reduce GHG emissions in the non-ETS sector; (2) 2020 (in some cases 2019) as the last year for which statistical data are available. This year can be considered to be the current situation because any comparison under it can indicate a reduction in the achieved level of economic activities, with negative effects on employment and the economic performance of the sector; (3) 2030 is the target year for the GHG policy in the non-ETS sector, by which the goals set in the policy documents must be met; (4) 2050 is a long-term target and the last projection year. The LASAM model contains more than 300 equations that are reviewed regularly. The general methodology for the main projections has been described in previous research papers. The LASAM model was developed using the R programming language [54,55,56,57,58,59,60,61].
An overview of the LASAM model is shown in Figure 1.

3. Results

This section includes the main objectives achieved in developing a decision support tool and presenting the results of modelling. The results section shows the main results of the research pertaining to the interactive web application in order to present and analyze the results of the research that concern long-term projections for the development of Latvian agriculture until 2050 in its key sectors (crop production, animal production, organic farming), the projections for socioeconomic development in agriculture, and the projections for agricultural GHG emissions in Latvia, developed by means of LASAM in 2021.

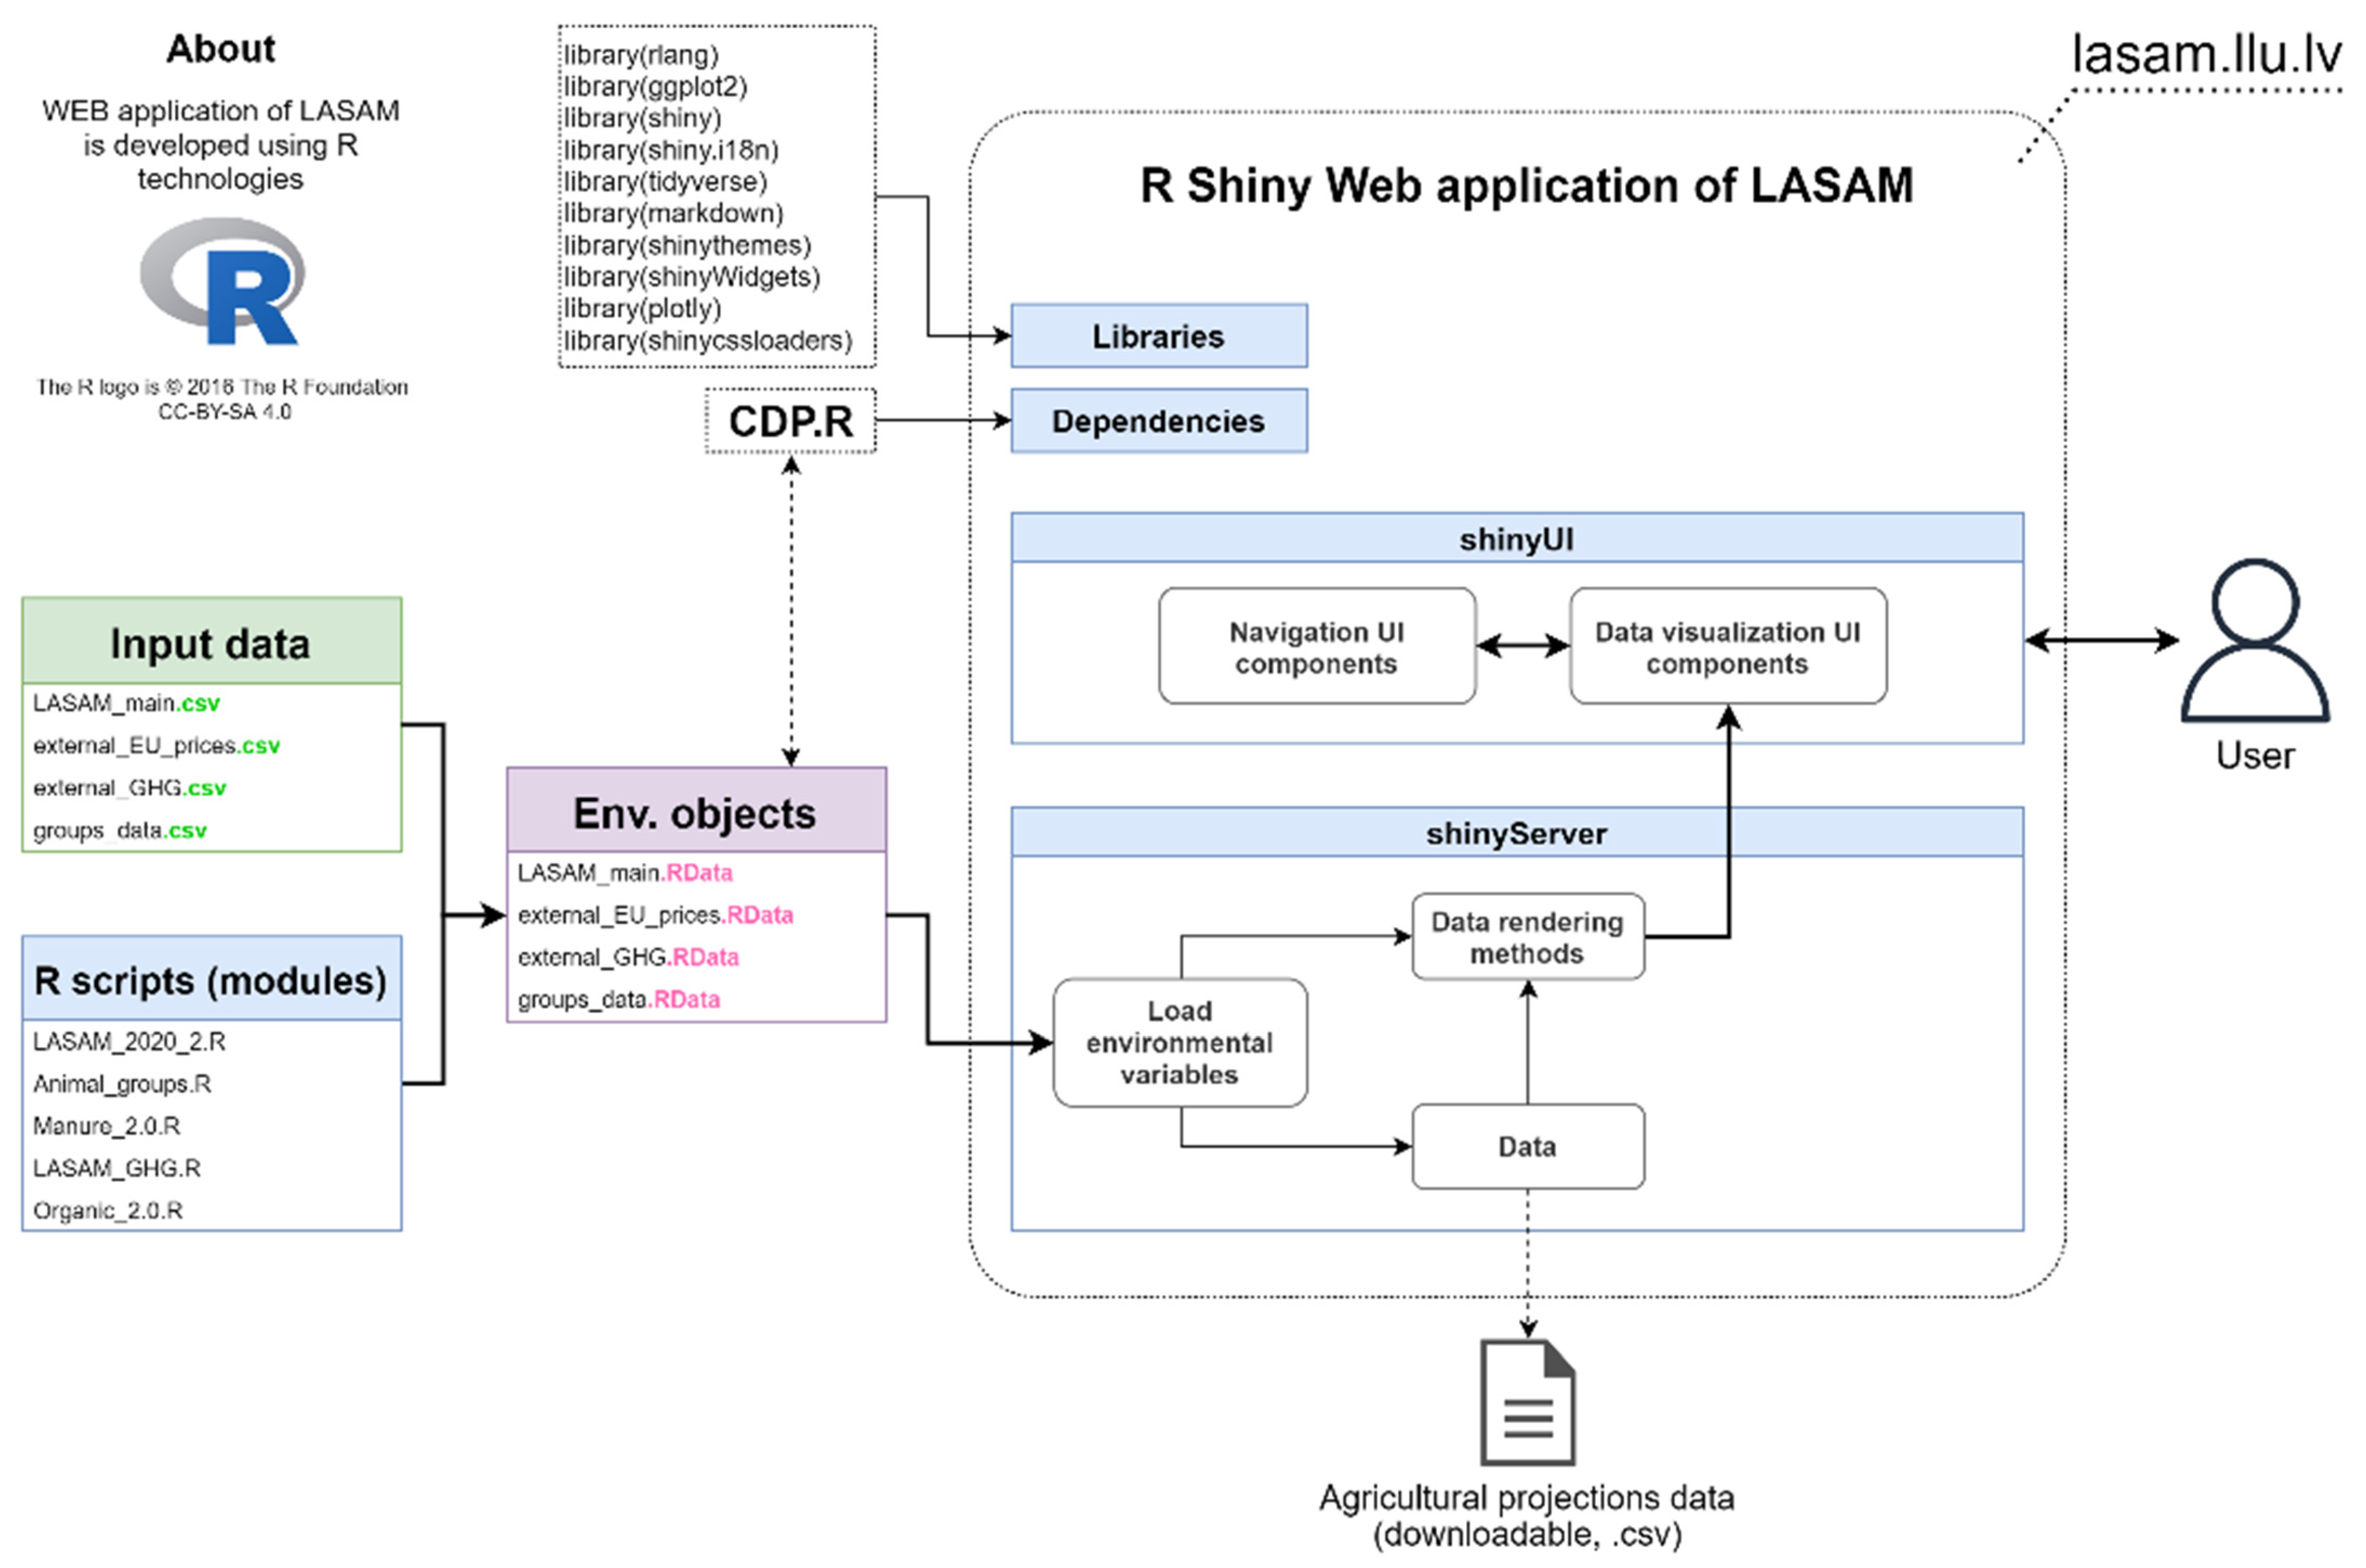
3.1. WEB Application of the LASAM Model

The research involved the development of an interactive web application that makes it possible to demonstrate and analyze the results of the model. The interactive web application can be used as a decision support tool in agriculture and industries related to it, including government policymakers. The web application and the LASAM model are based on R open-source solutions, including an R Shiny server. The application architecture is shown in Figure 2.
The interactive web application was developed using R Shiny. The web application also employs other R libraries:
  • plotly and ggplot2 (graphing libraries);
  • tidyverse (collection of R libraries for data science);
  • shiny.i18n (library for multilanguage support);
  • shinythemes, shinyWidgets and shinycssloaders (UI design libraries);
  • rlang (collection of R frameworks);
  • markdown (markup language support library).
As input data, the application uses R environmental objects imported into the system. The R objects provided include variables, functions, projections and other objects that were created as a result of processing of historic statistical data using the LASAM model.
The model effectively consists of a number of R scripts, each of which comprises various data processing mechanisms, calculation methods and projection functions. If executed, each of these scripts perform the required processing of the input data, delivering results in the form of R environmental variables. These objects can then be exported/imported as R environmental objects and used to present the results in the web application. This approach makes it possible to increase the speed and efficiency of the application, which is much needed, considering the amount of data processed using LASAM and the permanence of the displayed results over a longer period of time.

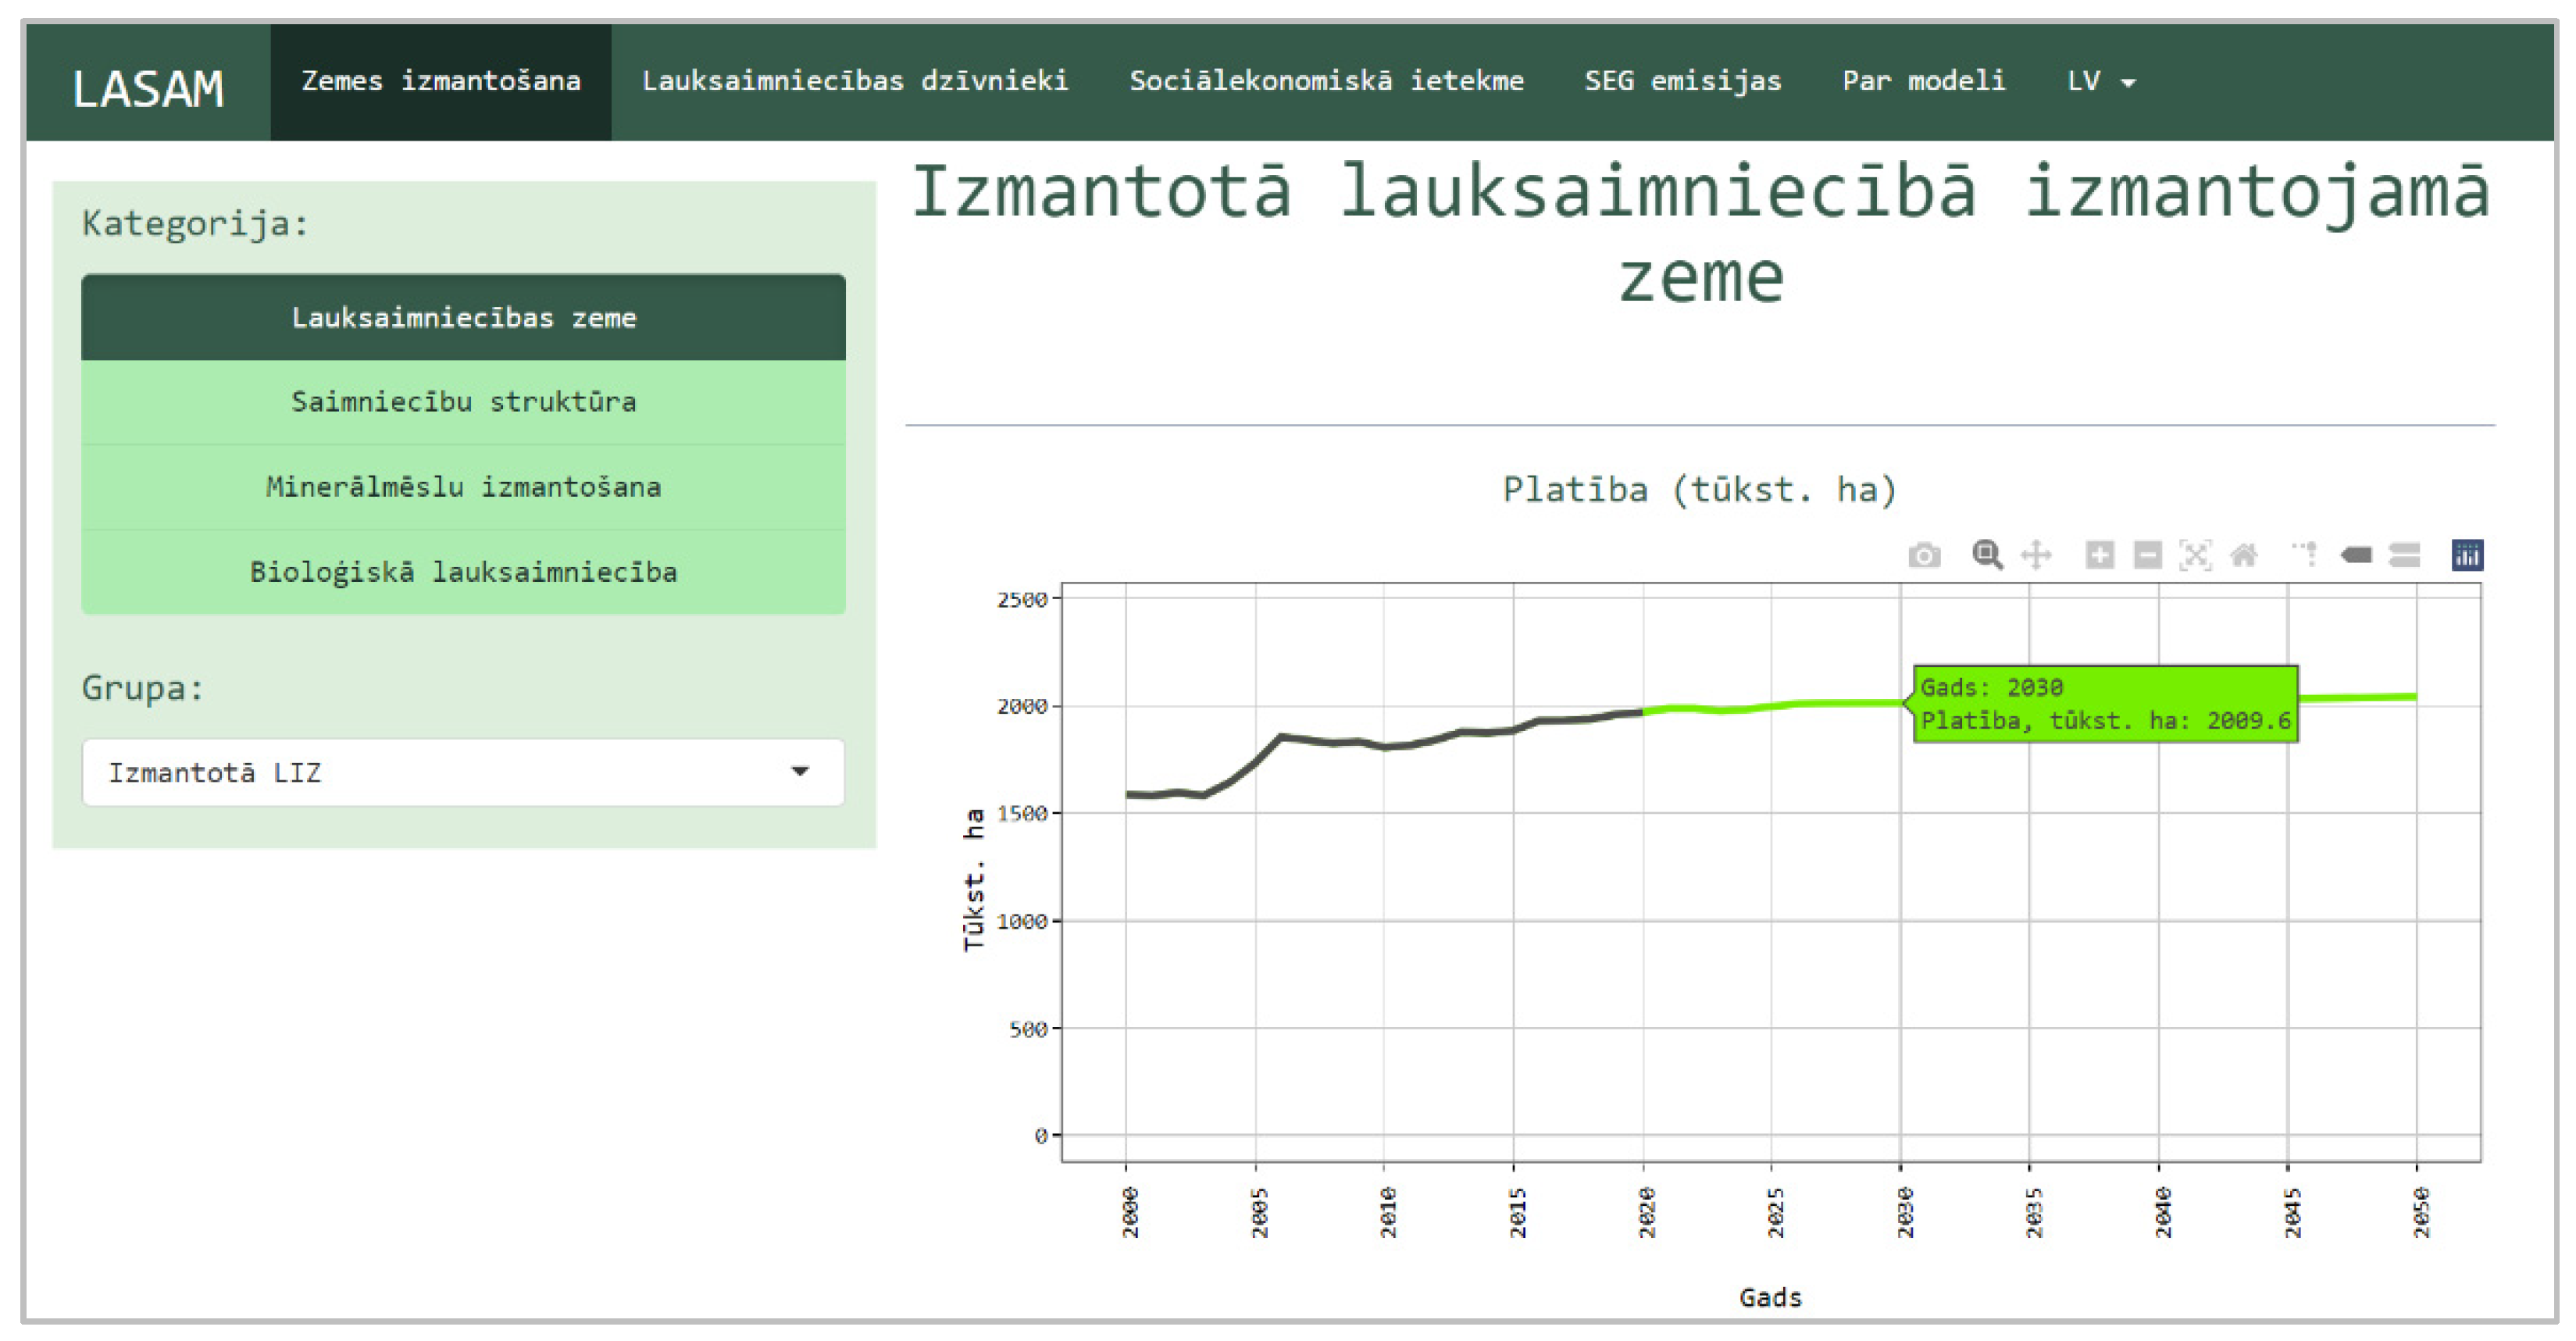
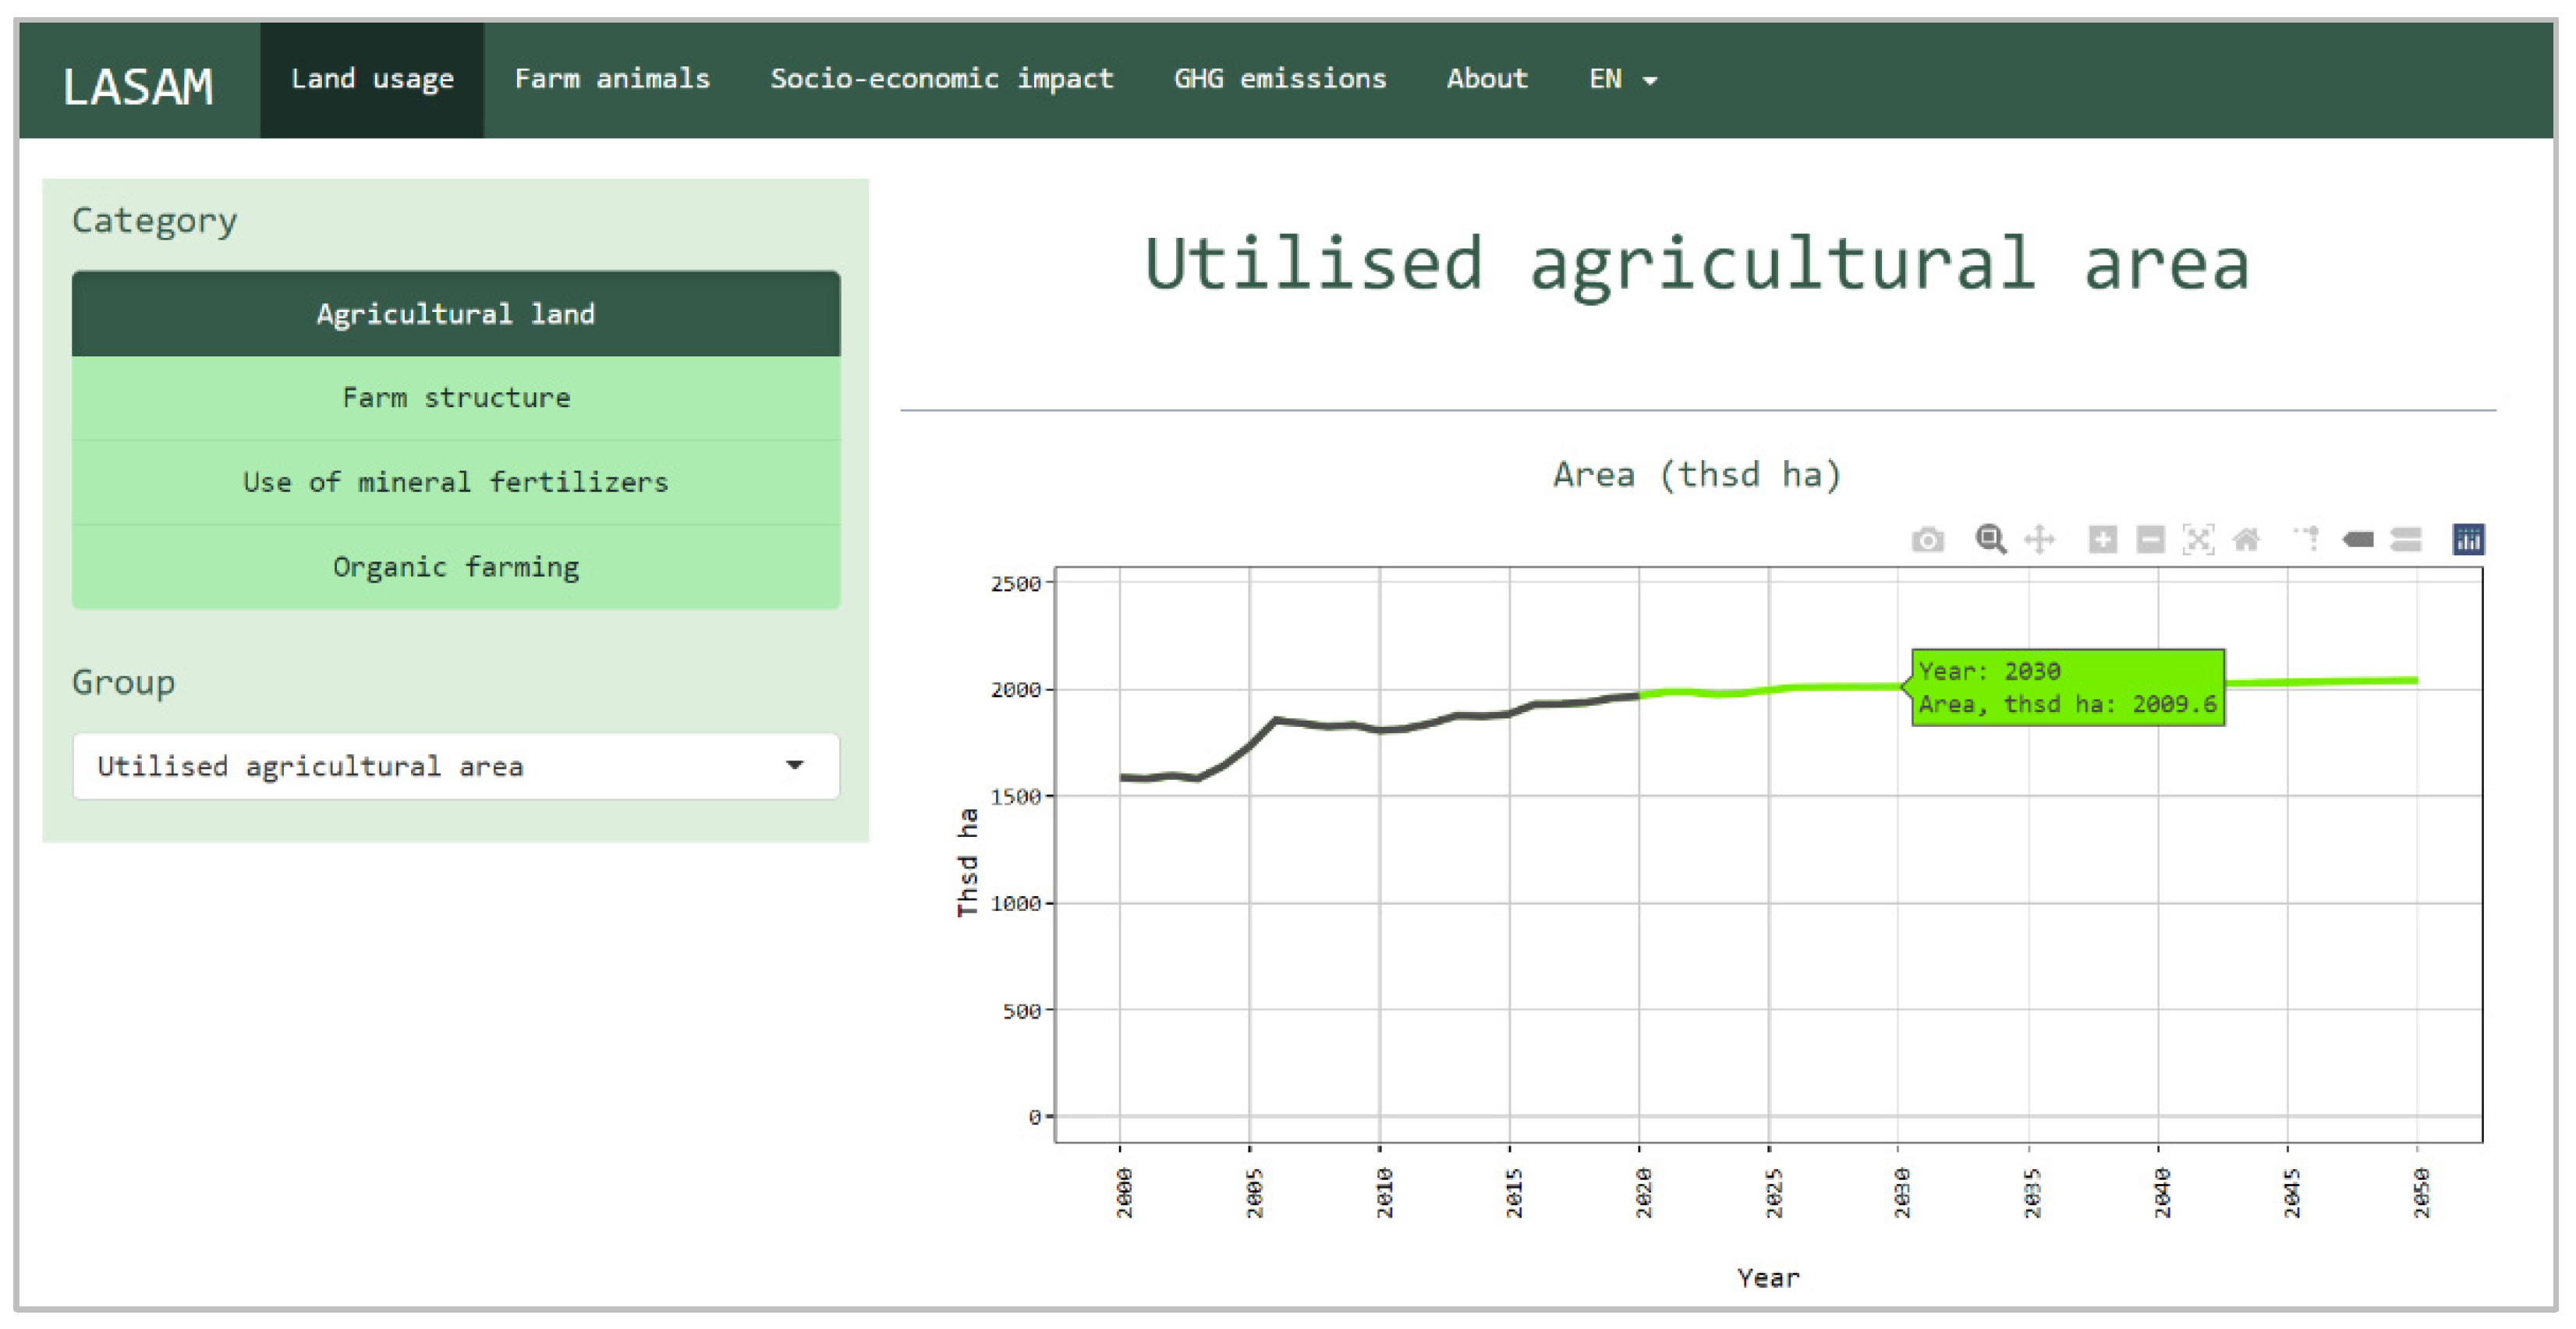
3.2. Availability and Use of the WEB Application of the LASAM Model

From 2021, the LASAM model has been available to anyone interested in Latvia and elsewhere online, in Latvian (Figure 3) and English (Figure 4), at lasam.llu.lv, and it can be used by farmers, policymakers and other stakeholders.
Anyone can familiarize themselves with the description of the model, and any of the sections of interest to them, including land use, farm animals, socioeconomic impact and GHG emissions. Each of the sections have multiple subsections, each containing appropriate projection results. Furthermore, pointing at the data point for a specific year, the user can also see the exact numeric value. As the dataset and model is updated annually, everyone interested is able to access the latest projection data.

3.3. Contents of the WEB Application of the LASAM Model

The interactive LASAM web application includes research results on the long-term projections for Latvian agricultural development up to 2050, created by LASAM in 2021 and covering the largest and most important sectors of agriculture.

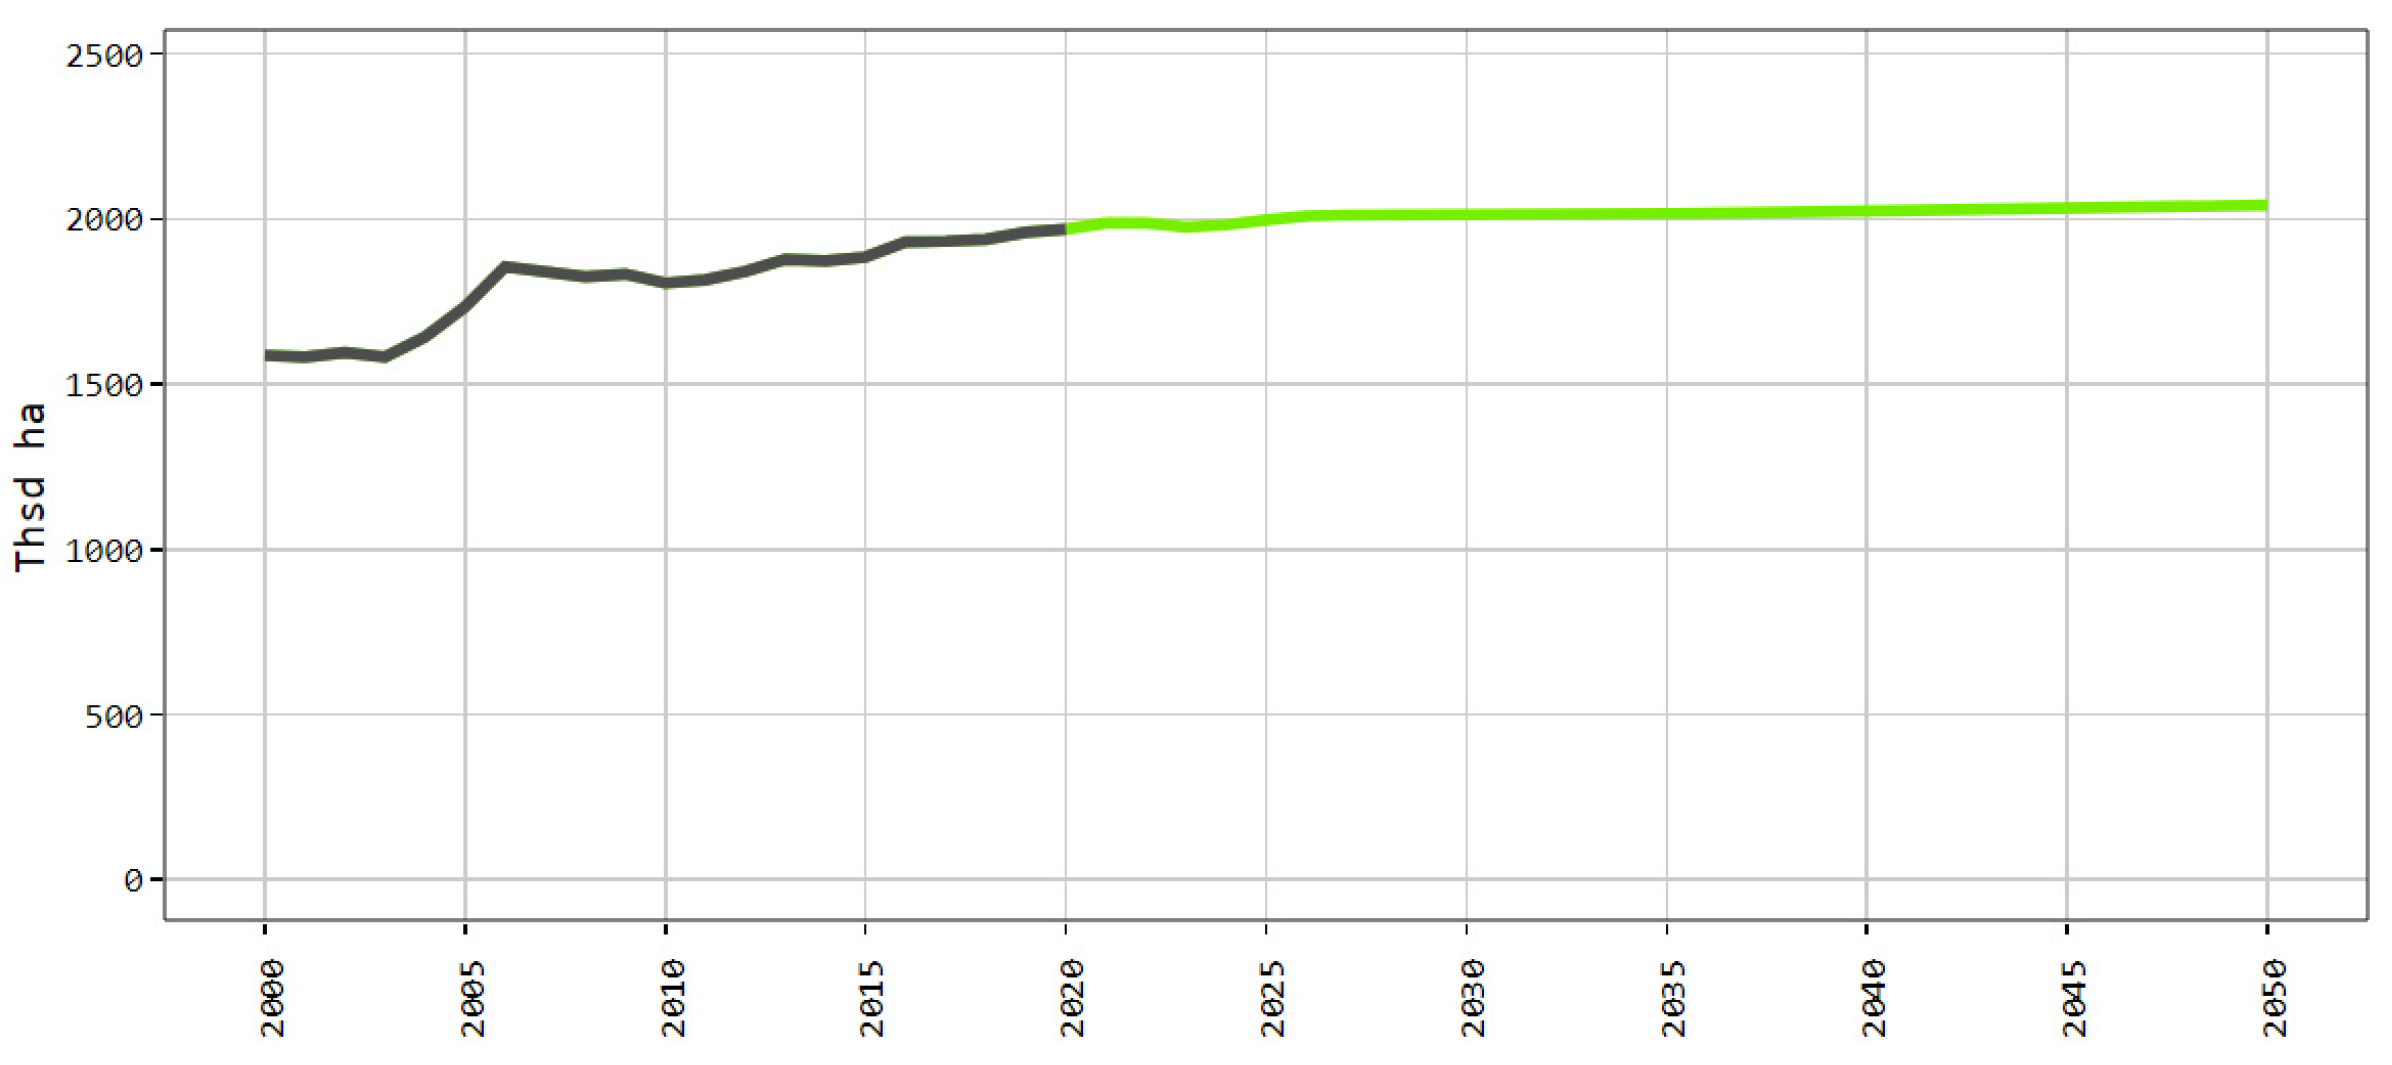
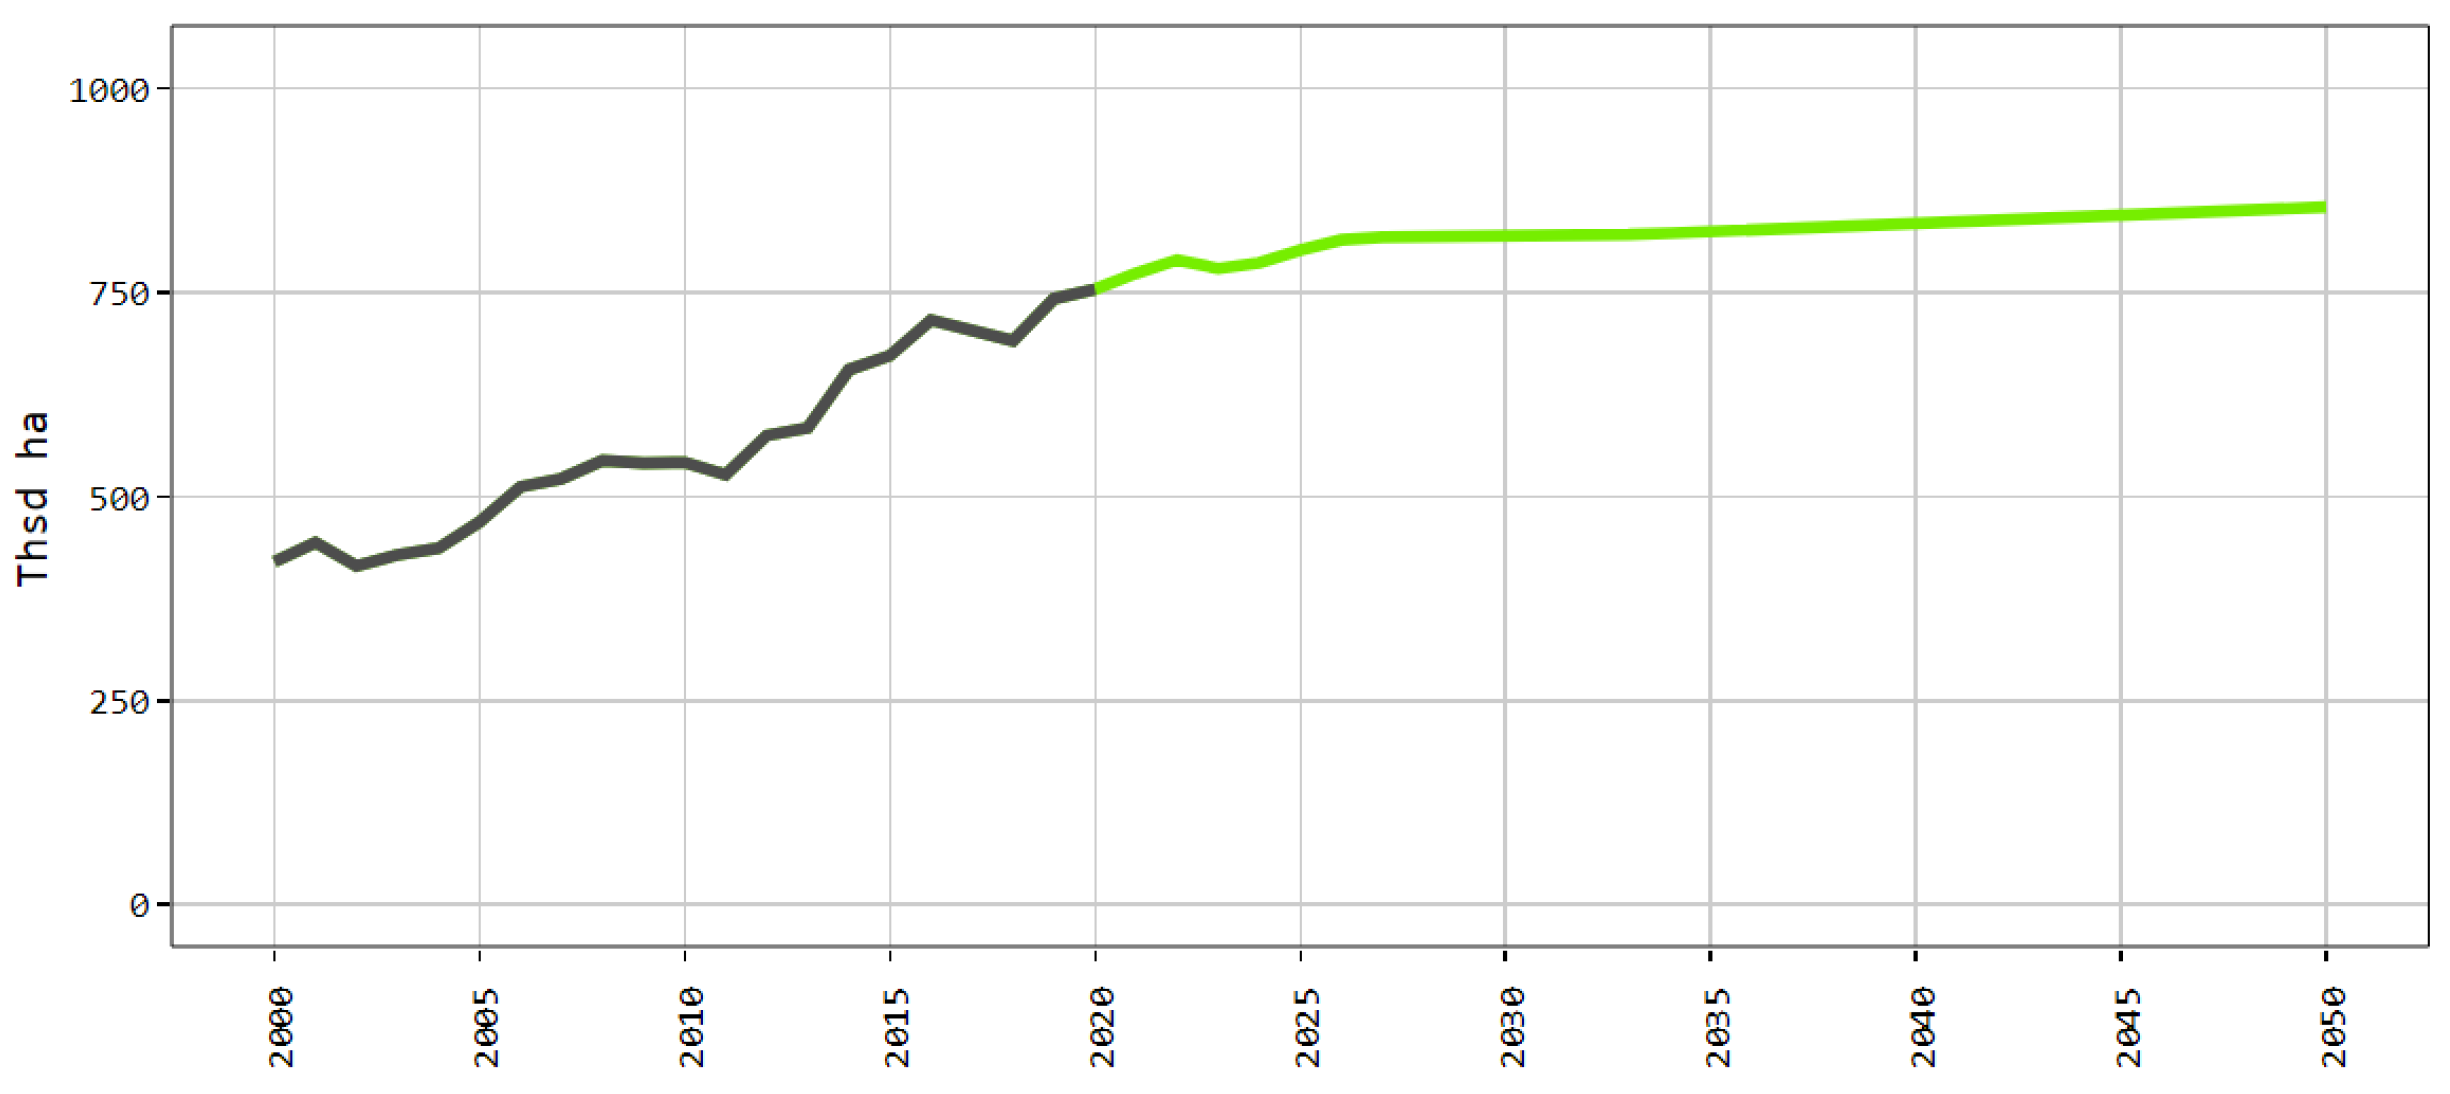
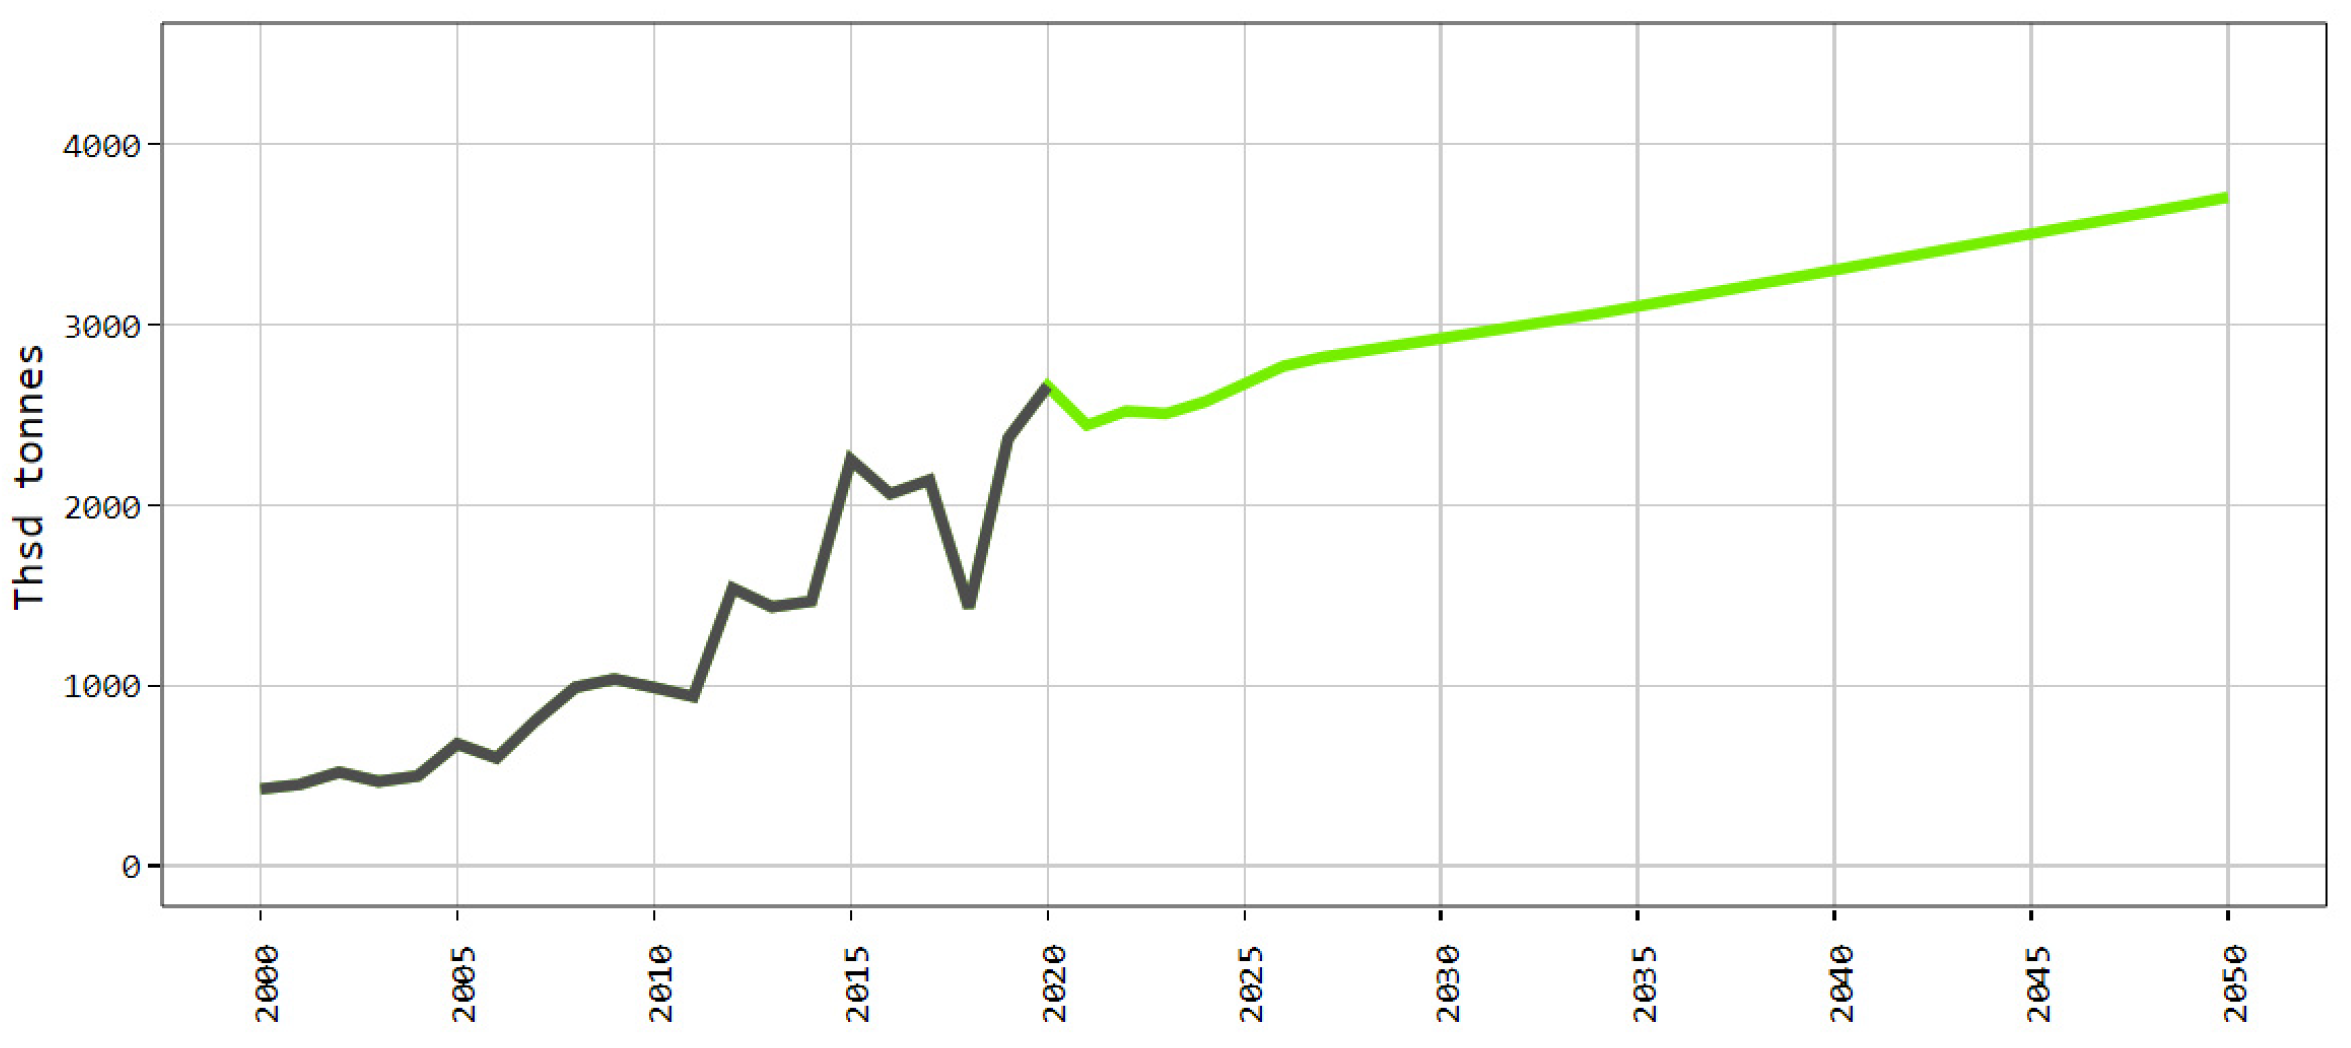
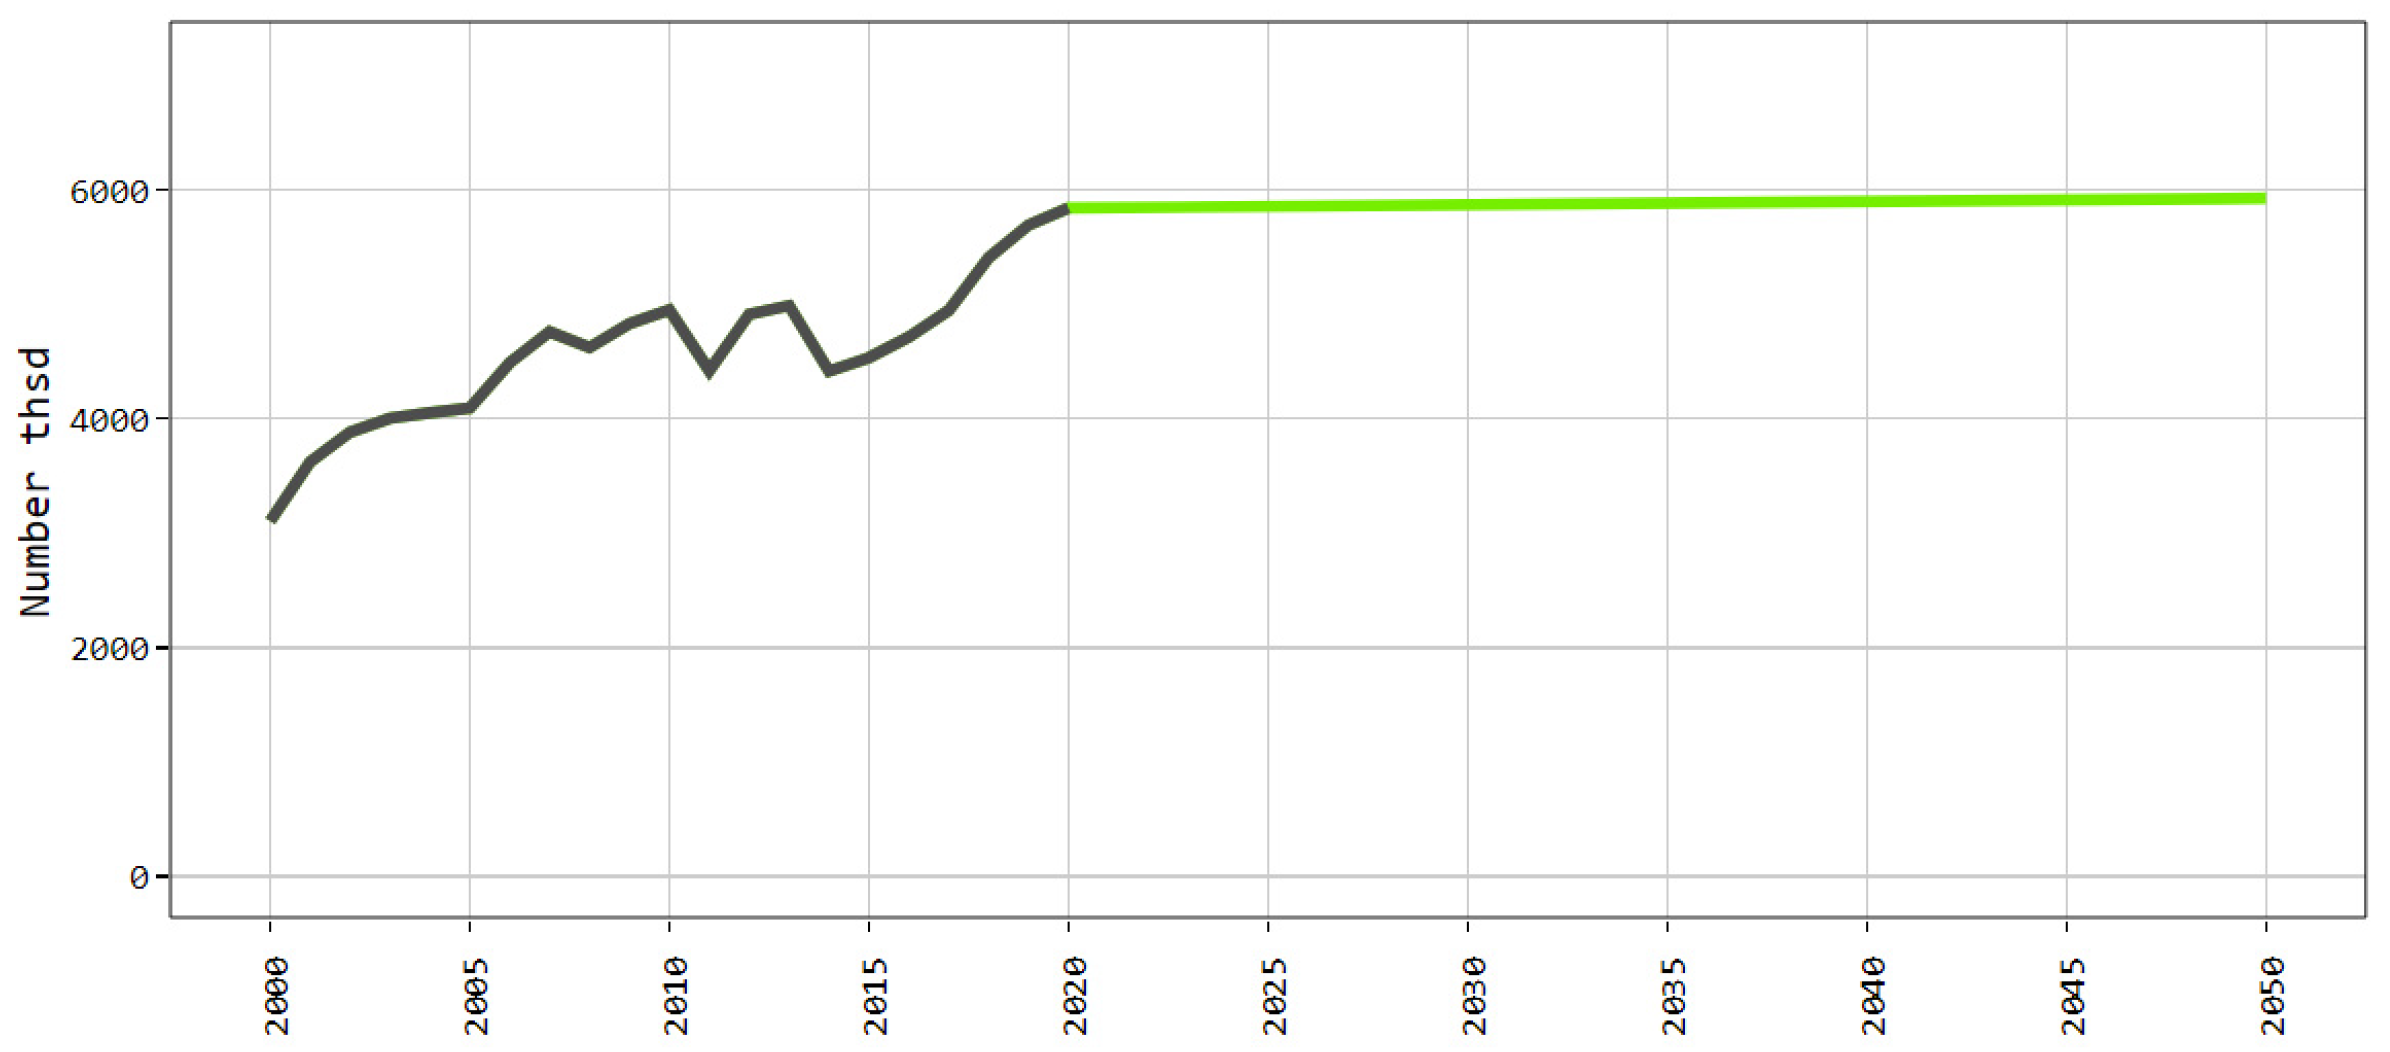
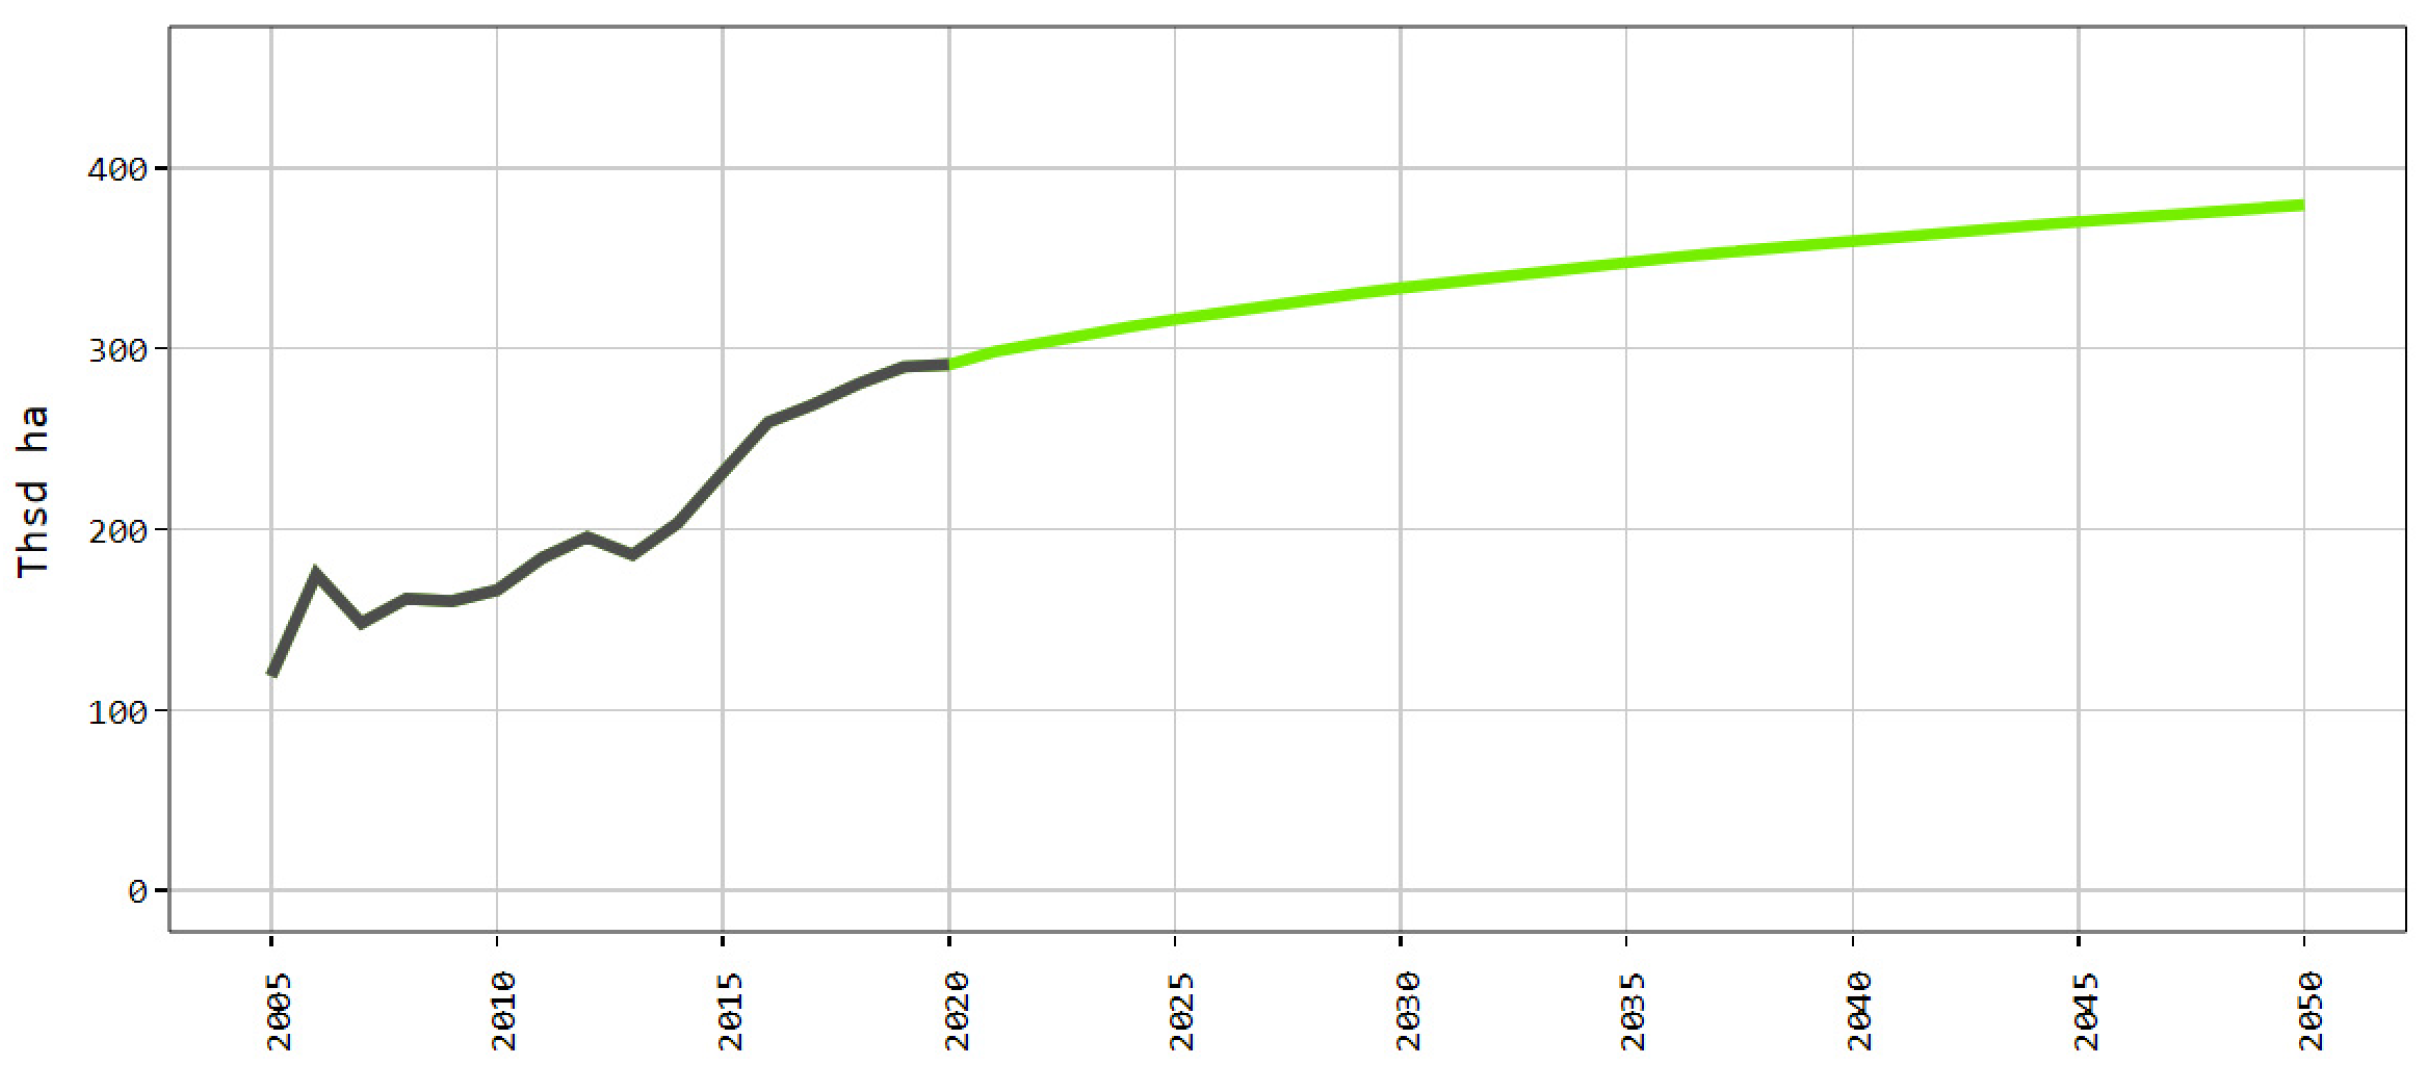
3.3.1. Projections for the Crop Sector until 2050

One of the most important indicators that can be used to describe trends in land use is the area of agricultural land involved in production (Figure 5). It is projected that the EU single-area payment rate, as well as the wheat prices that are expected to be high and relatively stable on average, could result in a slight increase in the area of agricultural land. The price of wheat was selected as the reference price because the expansion of the area used for wheat is the main driver for the increasing area of agricultural land.
However, this increase can also be significantly affected by short-term factors, especially crop yield. If the climate causes crop yield to be very low or very high in the coming years (this will affect the financial results of farming businesses and, thus, their capacity to grow), this could have a significant impact on the projections.
Although the research projects fluctuations in the area of agricultural land use until 2032, with a subsequent constant increase in that area, the projected changes are small. According to the projections, the utilized agricultural areas will be almost 2% larger in 2030 than in 2020, and by 2050, this projected increase will be almost 4%, compared to 2020. The changes in the UAA are largely due to changes in the area of arable land (Figure 6). Thus, the area of arable land is affected by the same factors that served as the basis for projecting the expanding area of agricultural land. Similarly, to the total area of agricultural land, the area of arable land is expected to fluctuate slightly until 2032, with a gradual increase from then onwards. In 2030, the projected area of arable land will be almost 4% larger than in 2020, and by 2050, this projected increase will be 6%. The area of arable land in Latvia is projected to reach 1.42 million hectares in 2050.
Until 2020, the overall increase in the total area used for grains, oilseeds and pulses (GOP, including fallow land) was largely created by the rising area occupied by grain farming, as in 2020, accounting for 75% of the total area of GOP crops, and a similar proportion will remain until 2050 (78%). The projections show that until 2030, the GOP crop area will fluctuate slightly, and then it will begin to see a gradual increase. By 2030, the overall area occupied by GOP crops will be 6% larger compared with the 1002.5 thousand hectares in 2020. However, in 2050, it will exceed the 2020 level by 9% (1097.2 thousand hectares).
The proportion of the area used for GOP crops by the small farm group (with an area of 1 to 9 ha) decreased gradually over the period analyzed, with similar trends expected in the future. In the small farm group, the area is expected to decrease by 13% by 2030, and by 31% by 2050, as compared with the 2020 level. The projections are similar for farms with an area of up to 300 ha, and those with an area of more than 300 ha. On these farms, the area grew gradually, but will decrease slightly after 2020, which will be followed by a gradual increase between 2023 and 2050 (with a +11.5% rise in 2050, as compared with the area in 2020).
Grains are a group of crops that have seen a significant rise in production after Latvia joined the EU. The successful development of the sector is due to several factors, including direct and indirect financial support by the EU, high grain prices, access to the EU market and consolidation processes in the sector, thereby increasing production intensity, as well as the use of the latest production technologies. As the sector develops in the future, the area under crops is to decrease slightly in 2023, followed by a gradual increase. Overall, the area under crops will increase from 753.7 thousand hectares in 2020 to 854.3 thousand in 2050 (+13%). In 2030, the expected increase in area will be 8%, compared with 2020 (Figure 7).
The production of rapeseed has quickly grown from almost zero in the mid-1990s, with a significant increase in the area it occupies since 2016 (Figure 8). The projections show that despite an area reduction that starts in 2022, rising yield will mean that by 2050 the amount of rapeseed produced will be 481.4 thousand tons, extending the 2020 production level (451.3 thousand tons) by almost 7%. The rapeseed output projected for 2030 will be lower than in 2020 (−10.5%) because a decrease in production is expected after the record amount in 2020.
Wheat is the most important crop that defines the development of grain farming (Figure 9). Since the accession to the EU, the area covered by wheat has been rapidly expanding in Latvia. The reason is its more attractive prices and higher yield compared with other crops, as well as the presence of a well-developed market, which makes it possible to sell wheat at a good price, even in Latvia. The projections show that by 2050, the area used for wheat will expand to 633.1 thousand hectares, compared with 498.8 thousand in 2020 (+27%). This expansion will already be notable in 2030, reaching 583 thousand hectares, with a 17% increase.
Wheat yield is also expected to rise. The tendency of wheat yield to increase has been observed historically, and it could continue into the future. The projected increase in yield is partially caused by technological innovations, but also, to a larger extent, by the more intensive use of mineral fertilizer. In general, between 2020 and 2050, yield is expected to increase by 10% (from 5.33 t ha−1 to 5.85 t ha−1).
As the area occupied by wheat crops and their productivity are expected to rise, the amount of grain produced will increase significantly (Figure 10). The output is to grow from 2.66 million tons in 2020 to 2.91 million tons in 2030 (+9.5%), and to 3.71 million tons in 2050 (+39%). It is worth pointing out that within the period analyzed, the amount of wheat produced in Latvia in 2020 was the highest since 2000.

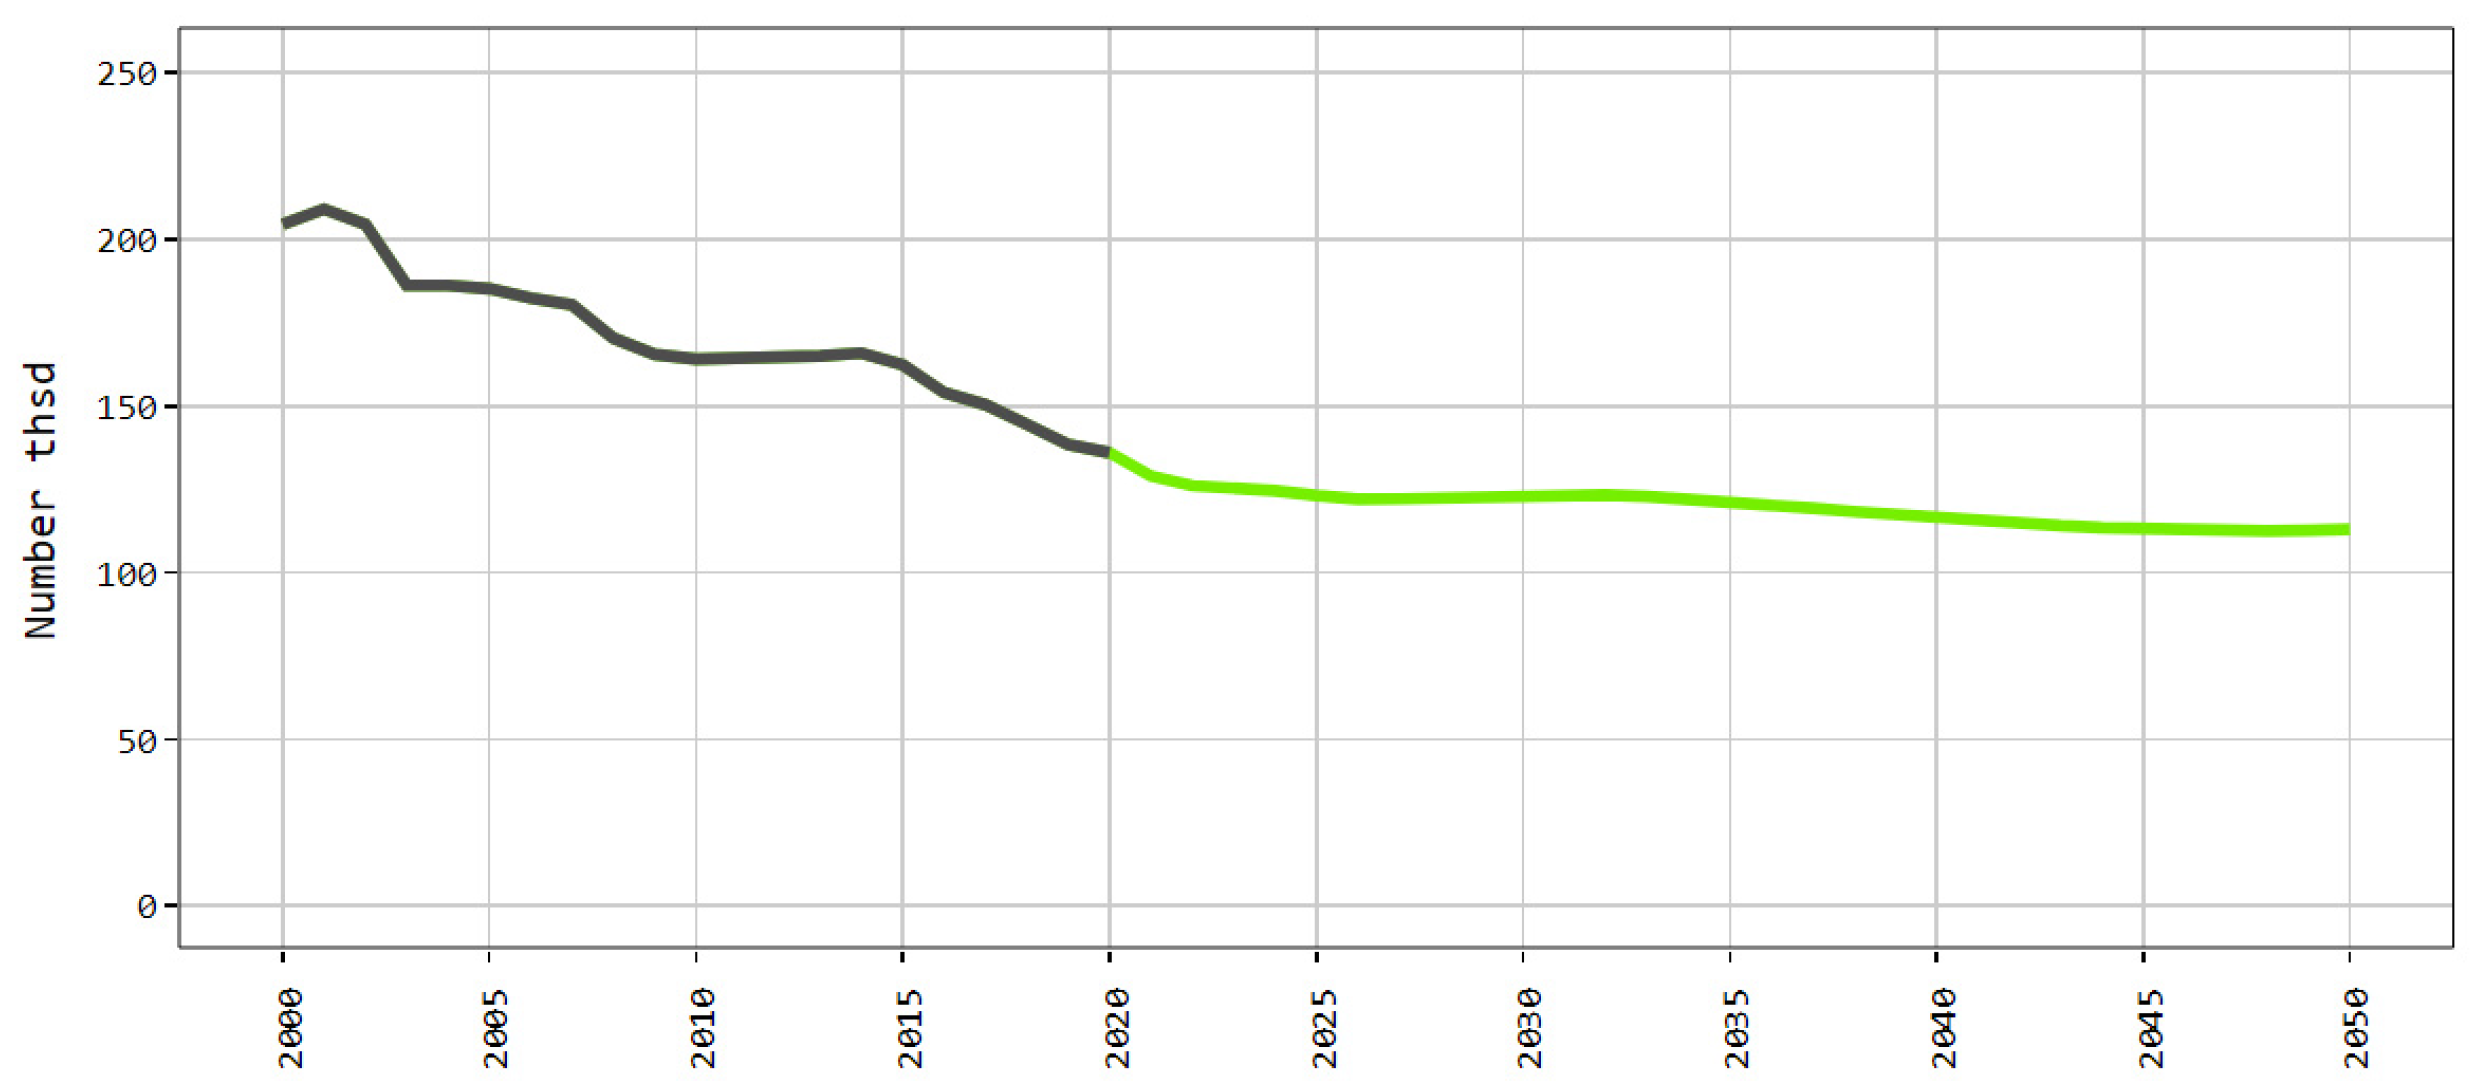
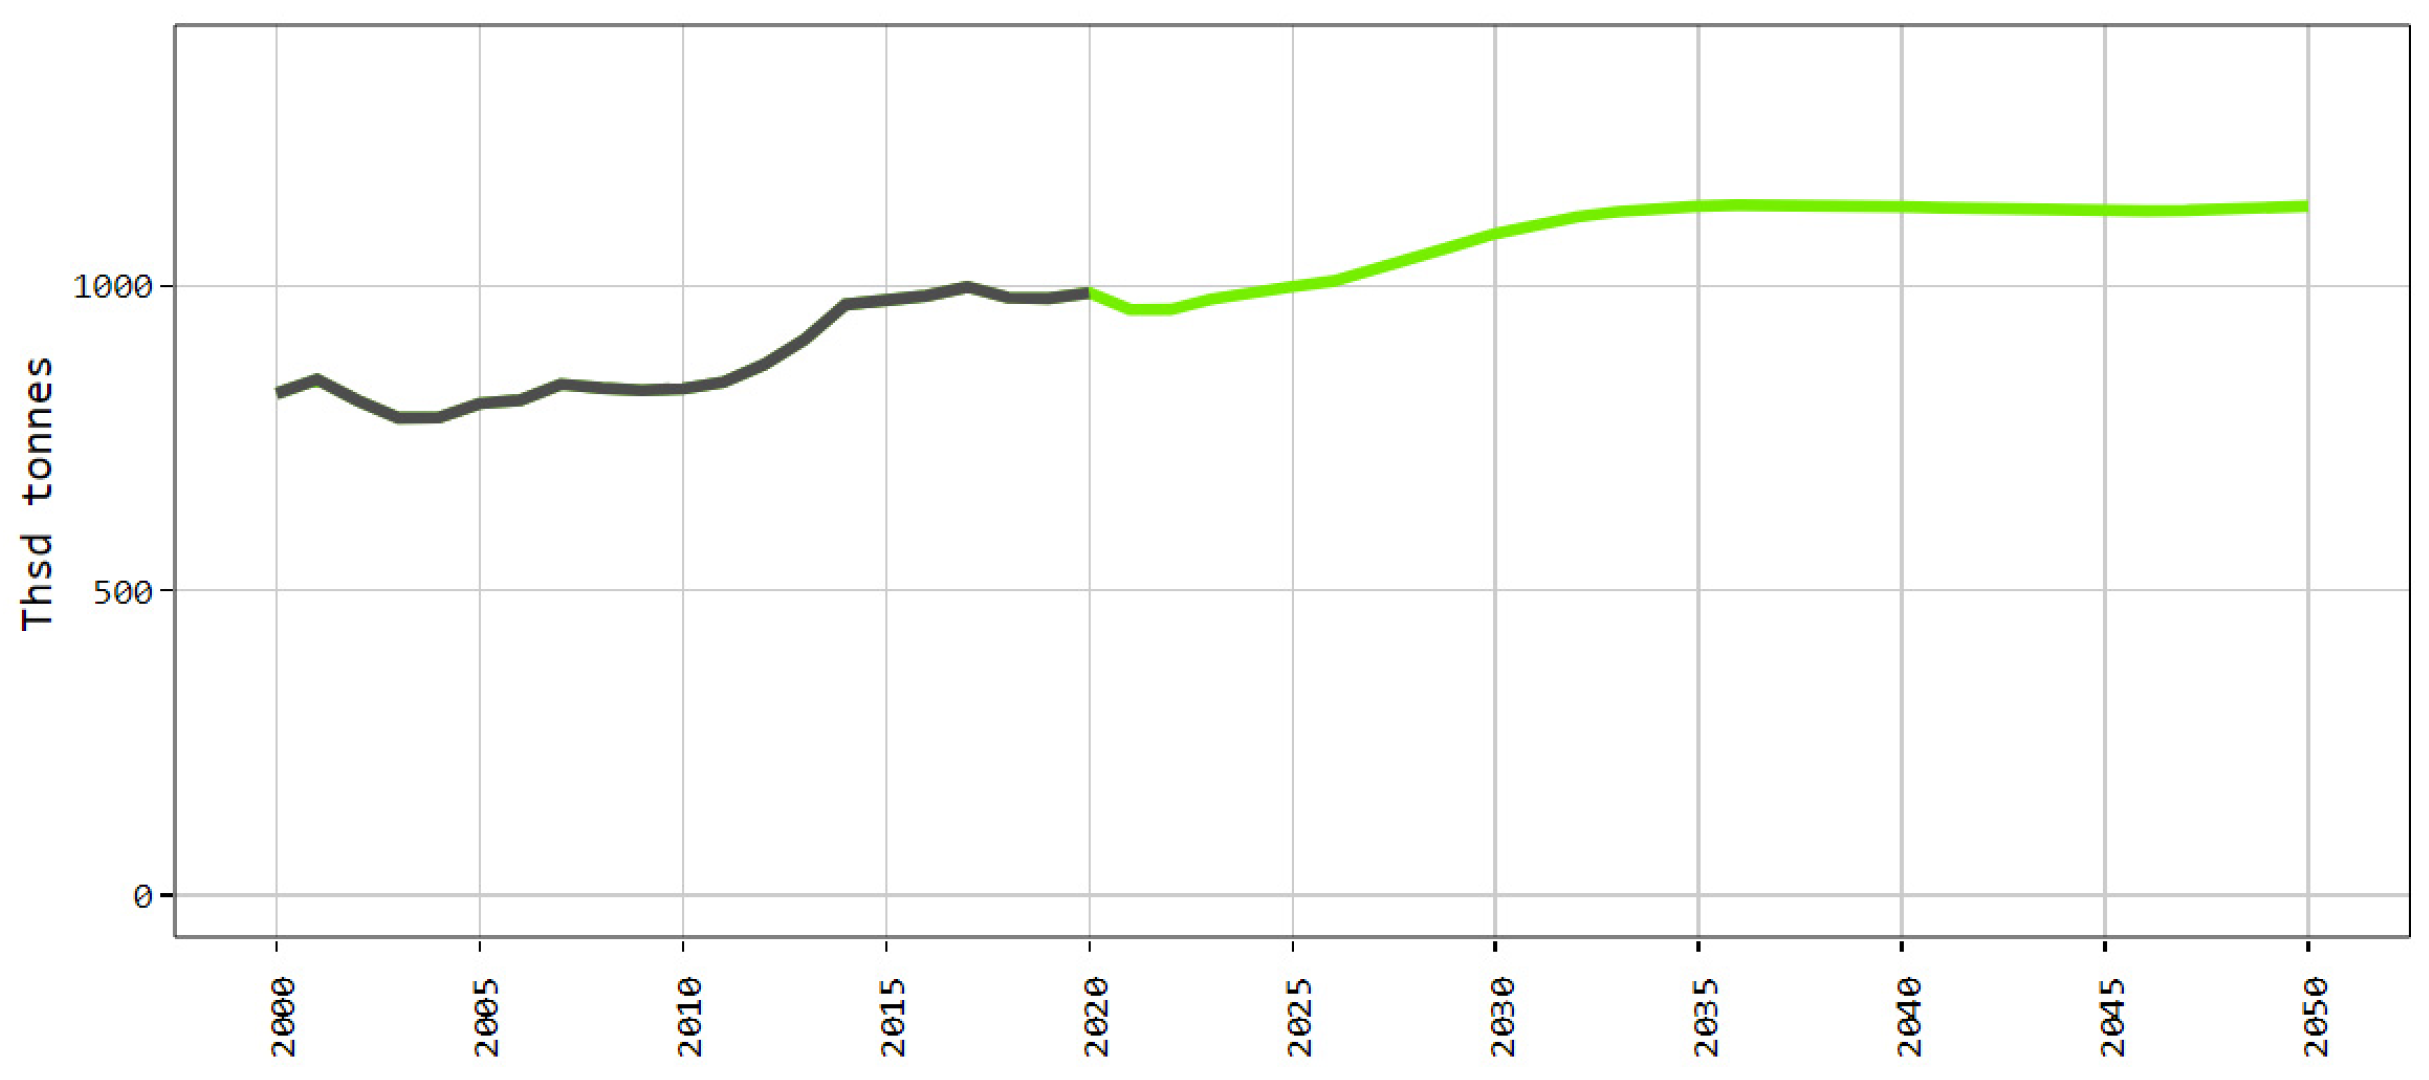
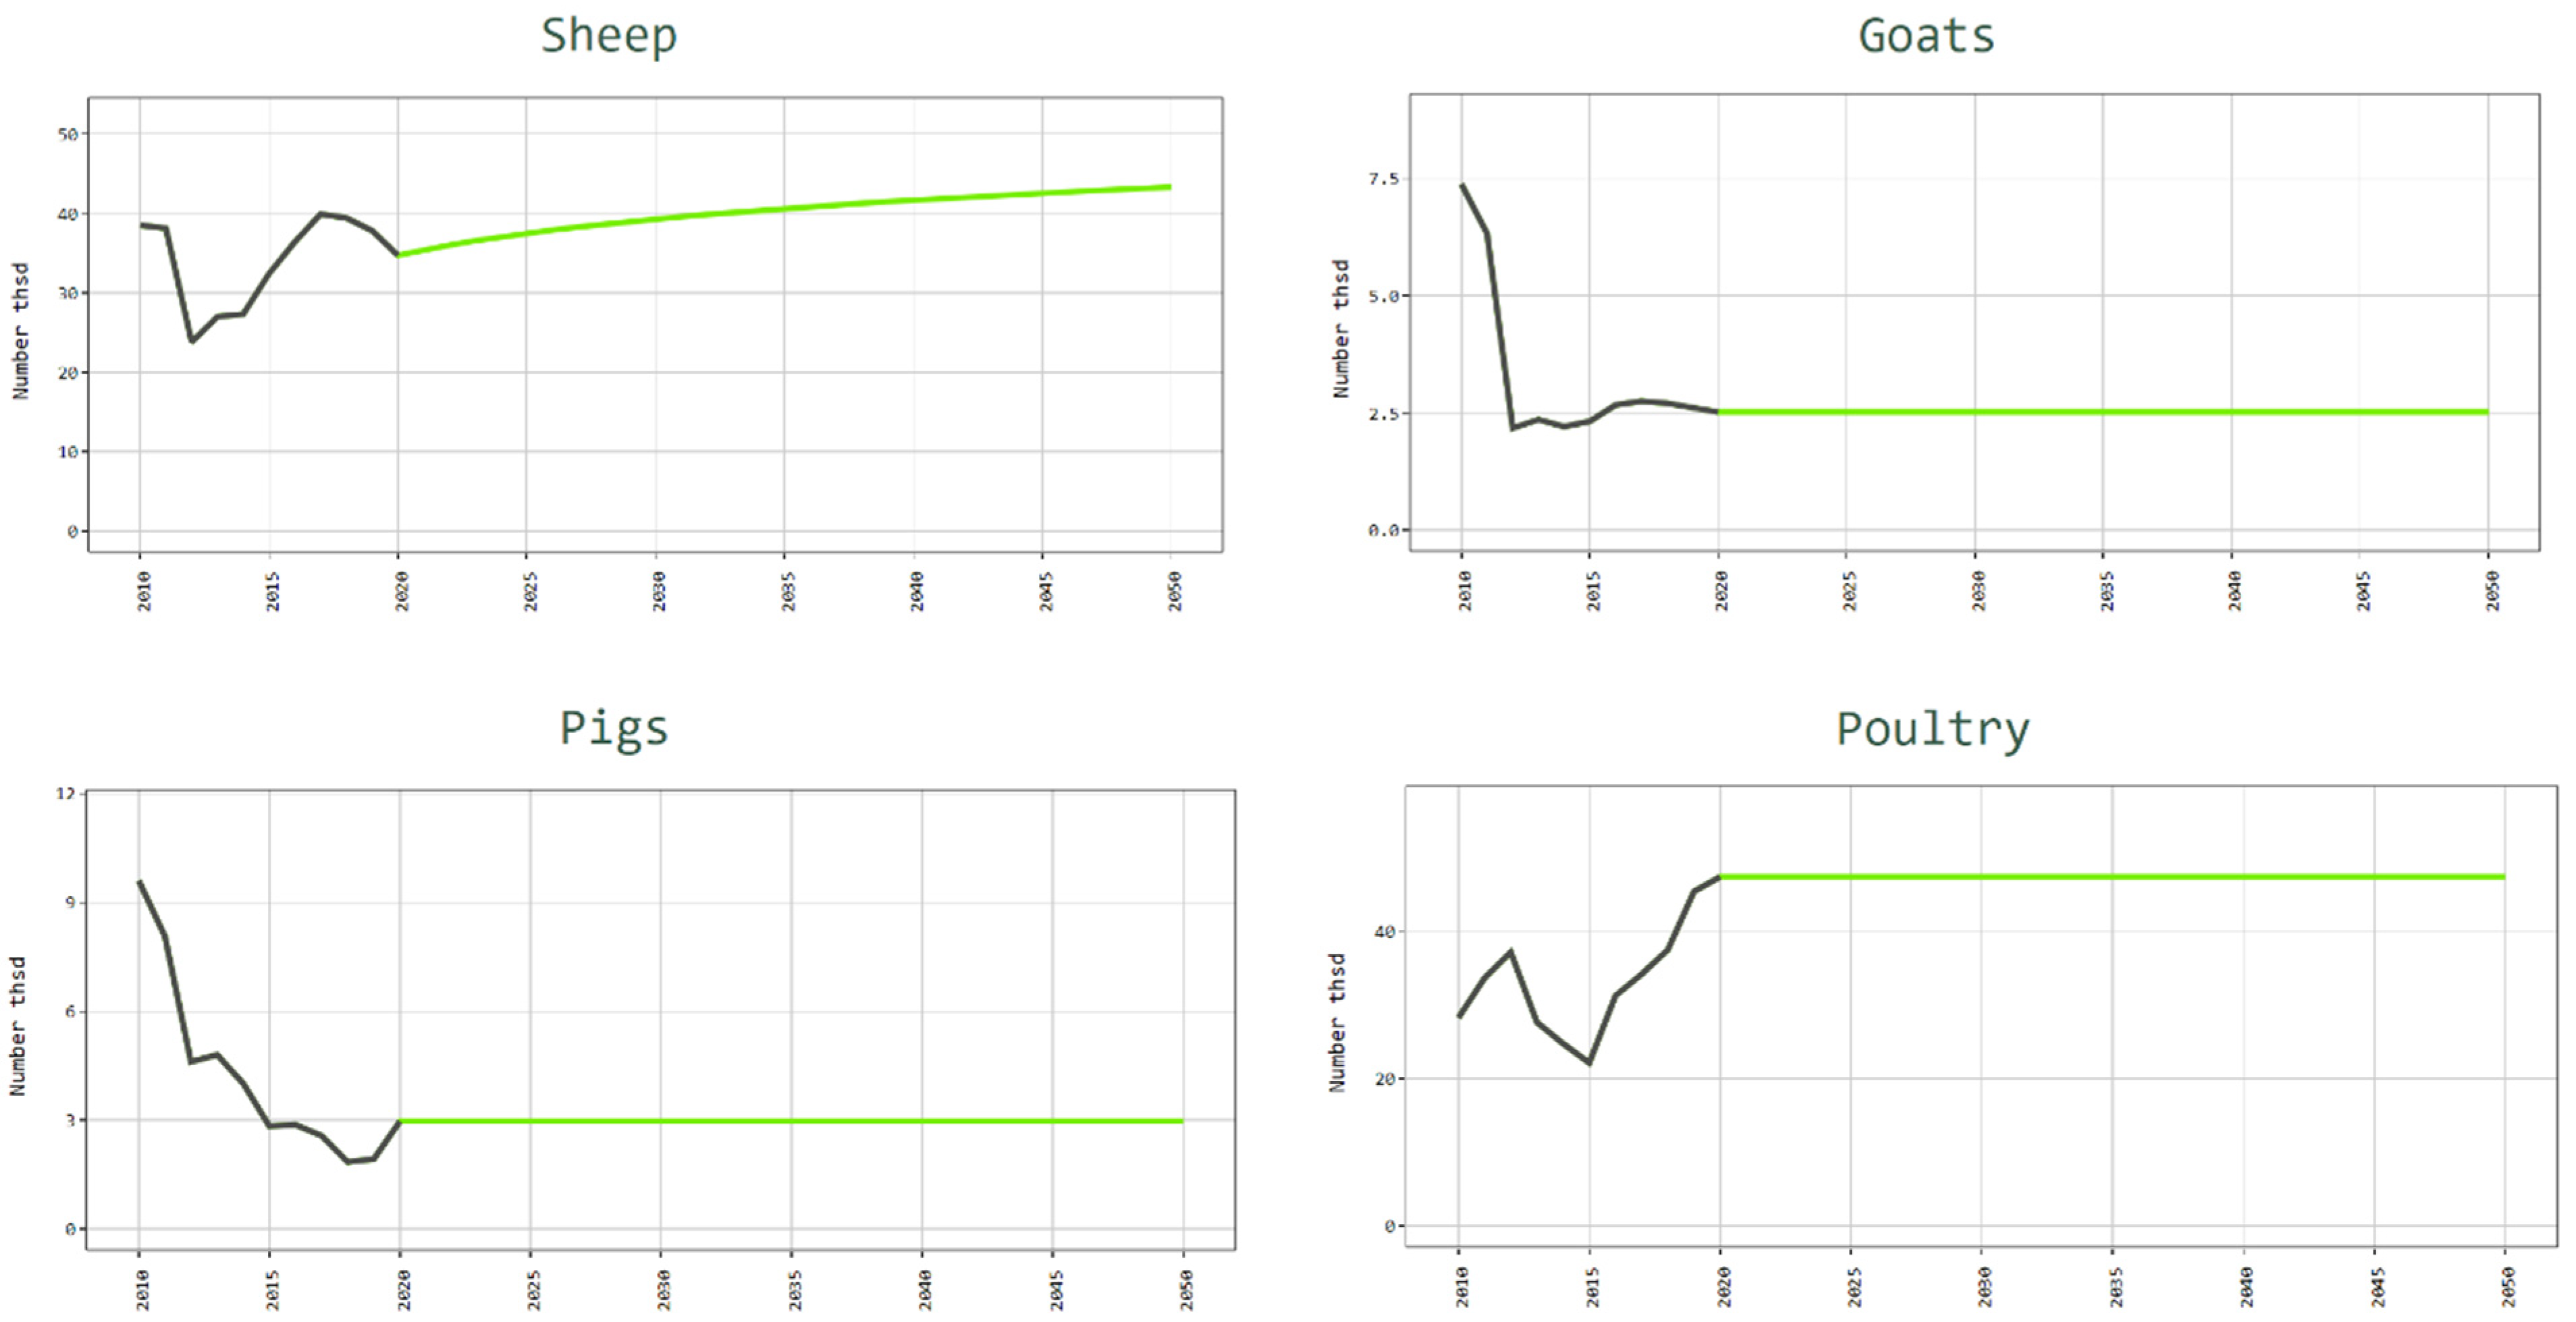
3.3.2. Projections for the Animal Sector in Latvia until 2050

Milk production. The number of dairy cows is expected to decrease gradually (Figure 11). In 2050 it will have decreased to 113 thousand cows, compared with 136 thousand in 2020 (−17%).
In projecting milk production, trends in three groups were considered: commercial production of milk for processing, farm consumption of milk as food, and consumption of milk as animal feed. The projection suggests that milk production will be relatively stable in the years to come, but will rise gradually from 2025 (Figure 12). The prerequisite for the successful development of the sector is an advantageous combination of prices, support policy and key costs, as well as the availability of land for producing animal feed. According to the projections, a total of 1085.4 thousand tons of milk will be produced in 2030, a number that is expected to rise to 1130.3 thousand in 2050, for a respective 10% and 13% increase relative to 988.2 thousand tons in 2020. The only group expected to rise is commercial milk production (+24%, from 845.8 thousand tons in 2020 to 1044.8 thousand, in 2050). The production of milk for own consumption and as animal feed is to decrease by 2050 due to a reduction in the number of small farms, which in turn leads to less farm consumption of milk as food. Farm consumption of milk is projected to decrease from 86.1 thousand tons in 2020 to 61.5 thousand in 2050 (−29%). However, the intensification of dairy farms will reduce the quantity of milk used as animal feed, which is expected to decrease by 2050 (from 56.3 thousand tons in 2020 to 24 thousand in 2050), accounting for only 2% of the total milk production.
Milk yield is to rise consistently, reaching 8790 kg per cow in 2030, and 10,000 kg in 2050 (+40% compared with 2020). This projection is affected by a number of factors, most prominently by the intensification of production, the choosing of higher-yield breeds, improvement of the breeding process and feeding and animal-keeping technologies that promote higher milk yields, all of which will continue in the future. The intensification of production is also encouraged by the farm investment funding provided by the EU.
Beef production is a relatively new sector in Latvia, beginning in 2003–2004, which saw the introduction of beef cattle and their growing and breeding in Latvia. In this sector, the number of suckler cows is expected to grow rapidly until 2024 (Figure 13). Starting from 2024, the number of suckler cows is projected to be constant, at 67.5 thousand. The development of beef farming is difficult to project due to its dependence on political factors (ability to export calves, support payments, emission policies). Latvian beef producers have successfully worked together to find markets for their products outside Latvia, and the growth of this sector is not solely dependent on domestic demand. Industry experts are not in agreement in regard to the future of this sector: some see the potential for growth, while others believe that the expansion of this sector could stop in the near future.
Growth in this sector could be spurred by a policy that preserves large areas dedicated to pastures, preventing their conversion into cereal and other crops. Conditions that impede such a conversion and maintain the existence of “unburdened” pasture land could stimulate the development of a relatively large beef sector.
The sheep sector is expected to continue its development (Figure 14); however, this projection is optimistic, and the sector may experience slower growth. This is because, despite its rapid expansion, it is still yet to find its export niche, being mostly oriented towards the domestic market. The focus on the domestic market poses a serious handicap on the development of this sector. As personal income rises in Latvia, the consumption of cheap meat (chicken, pork) will partially be replaced with lamb; however, Latvia has no traditions associated with lamb consumption, with no major changes expected in the consumption pattern. At the same time, the projection of the number of sheep rising from 91.9 thousand in 2020 to 104.5 thousand in 2030 and 119.1 thousand in 2050 (+30% compared with 2020) is realistic, as sheep will account for a relatively small share of meat consumption. Similarly to beef farming, sheep farming could be encouraged through a policy affecting the use of pasture land, especially given the lower emissions generated by sheep, as compared to cattle. Overall, successful growth of this sector requires finding new export markets. If this does not occur in the near future, the projection will have to be critically revised.
The difference between the price of pork and animal feed has rapidly fallen in the past 10 years, significantly affecting the profitability of pig production and leading to a reduction in the number of pigs. This process was also fueled by the falling quantity of pigs in smaller farms, as pig farming intensified through the use of EU investment support, among other things. Thus, the sector is dominated by large pig farms. The projections show that due to the decreasing revenue-cost ratio, a gradual reduction in the number of pigs is expected, from 306.8 thousand in 2020, down to 251.8 thousand in 2050 (−18%) (Figure 15).
The development of the poultry sector is defined by a few major businesses, and it is difficult to project the trends in this sector, as they largely depend on the business strategy and decisions of these companies. Thus, in making projections about the development of poultry farming, the average level for the last few years was used, assuming that during the projection period, the number of poultry will remain stable, with a weak rising trend (Figure 16). According to the projections, in 2030, the number of poultry birds will rise to 5.88 million, and by 2050, to 5.92 million (+1.5% increase compared with 5.84 million in 2020).
The number of broilers is expected to stabilize at 2020 levels across all poultry farm groups. Thus, by 2050, the total number of broilers will remain at 2.36 million, of which 1 million will be on farms with the number of broilers up to 49.14 million in businesses with 50 to 40,000 broilers, and the largest proportion, 2.34 million, will be on farms with the number of broilers at more than 40 thousand. This group of farms will account for 99.4% of the total broilers.
The number of laying hens is expected to rise gradually, reaching 3.42 million in 2050, which will only exceed the 2020 level (3.35 million) by 2%. Most laying hens (87.5% in 2020) are on farms with more than 40 thousand hens, and the number of poultry on these farms is expected to remain at 2020 levels (2.93 million). Thus, the projection points at very little change in the number of laying hens. An increase in the number of laying hens is only expected on the farms with 50 to 40,000 hens: in 2050 these will have a total of 393.4 thousand laying hens, which is 23% more than in 2020.

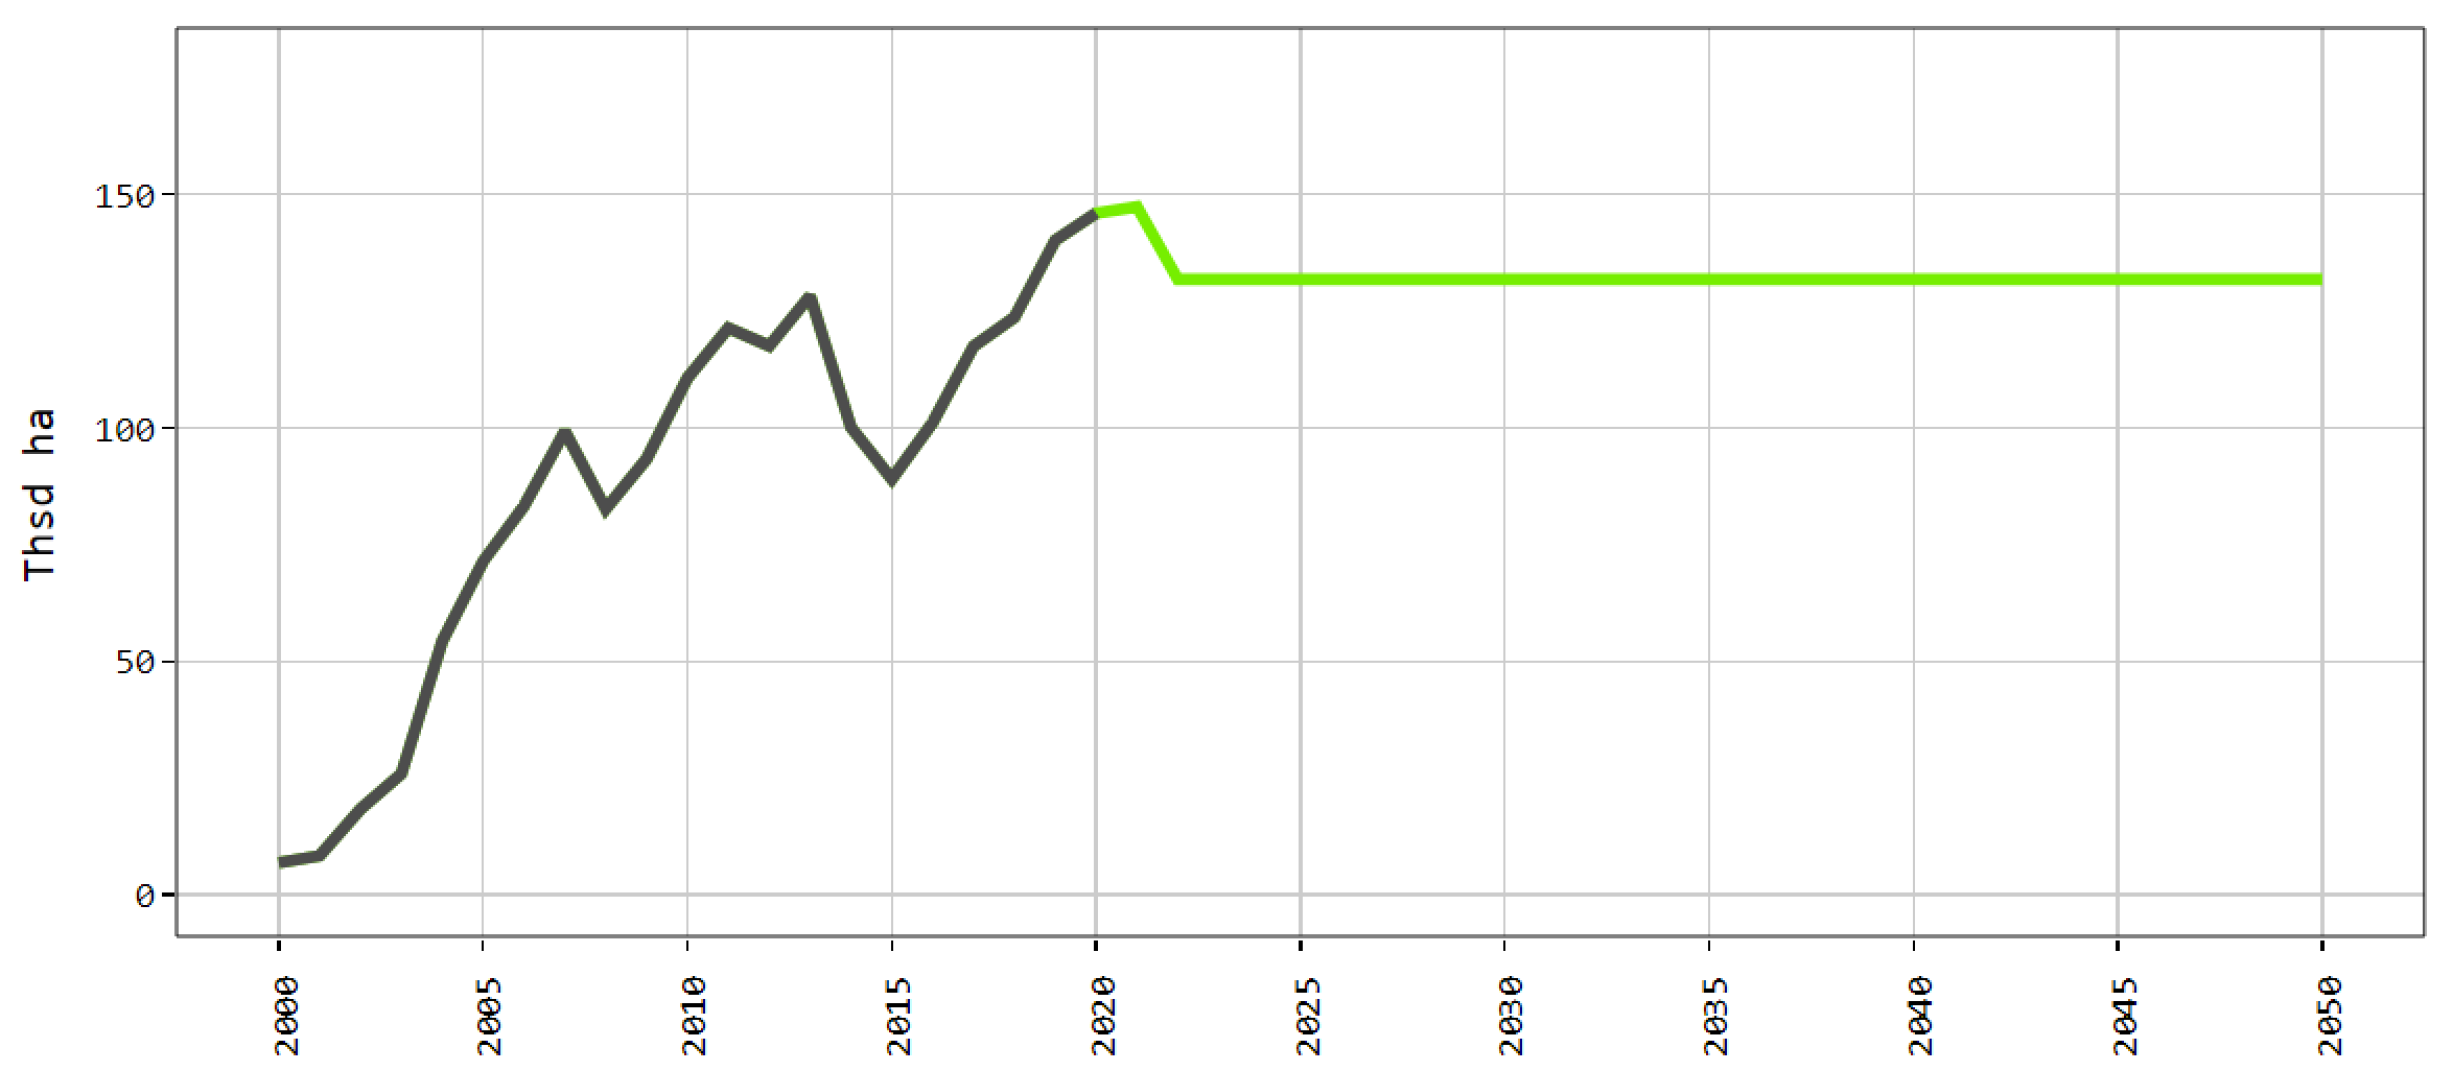
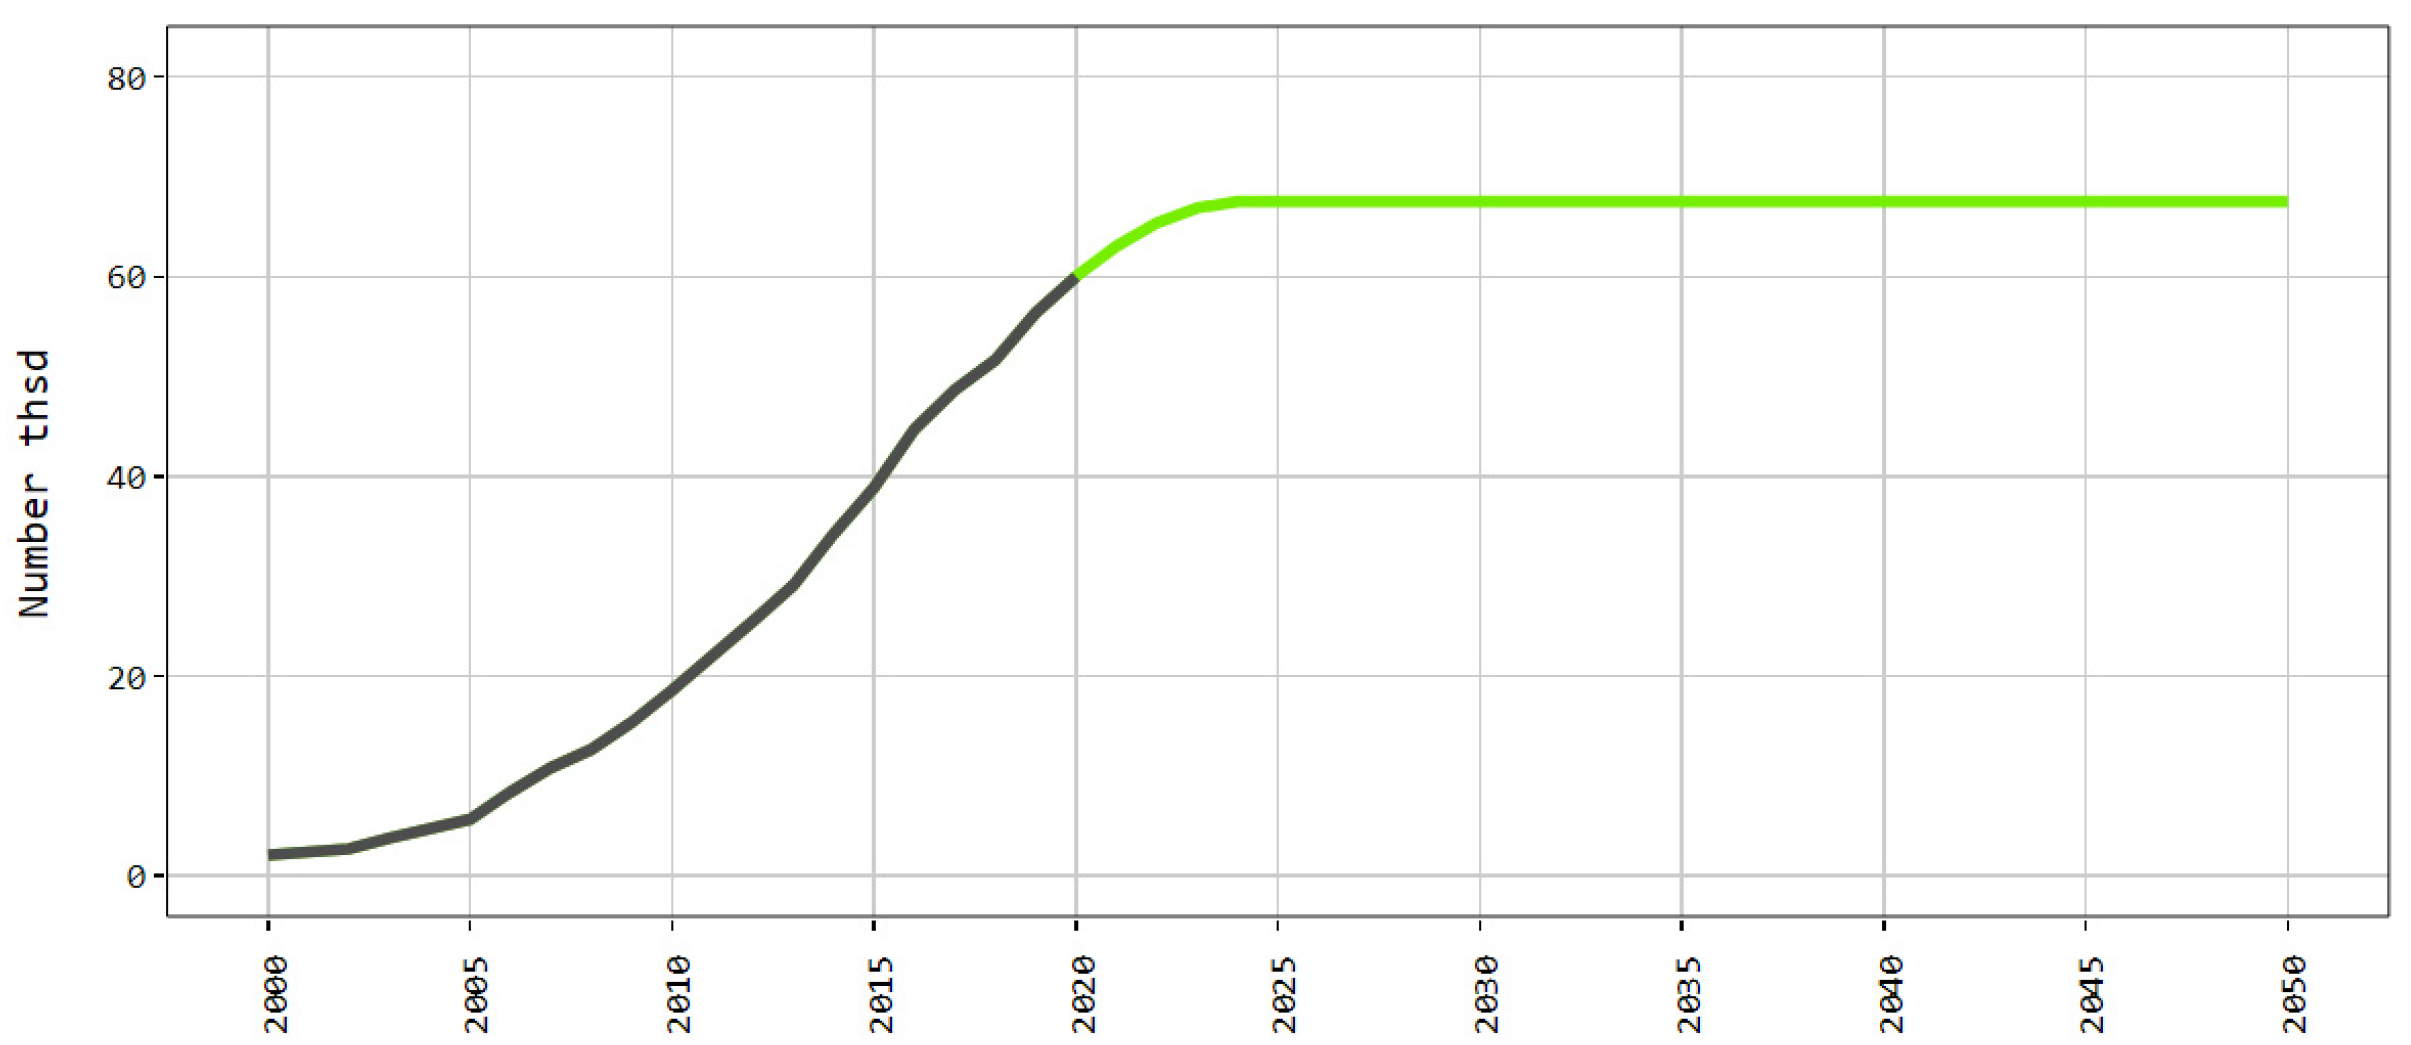
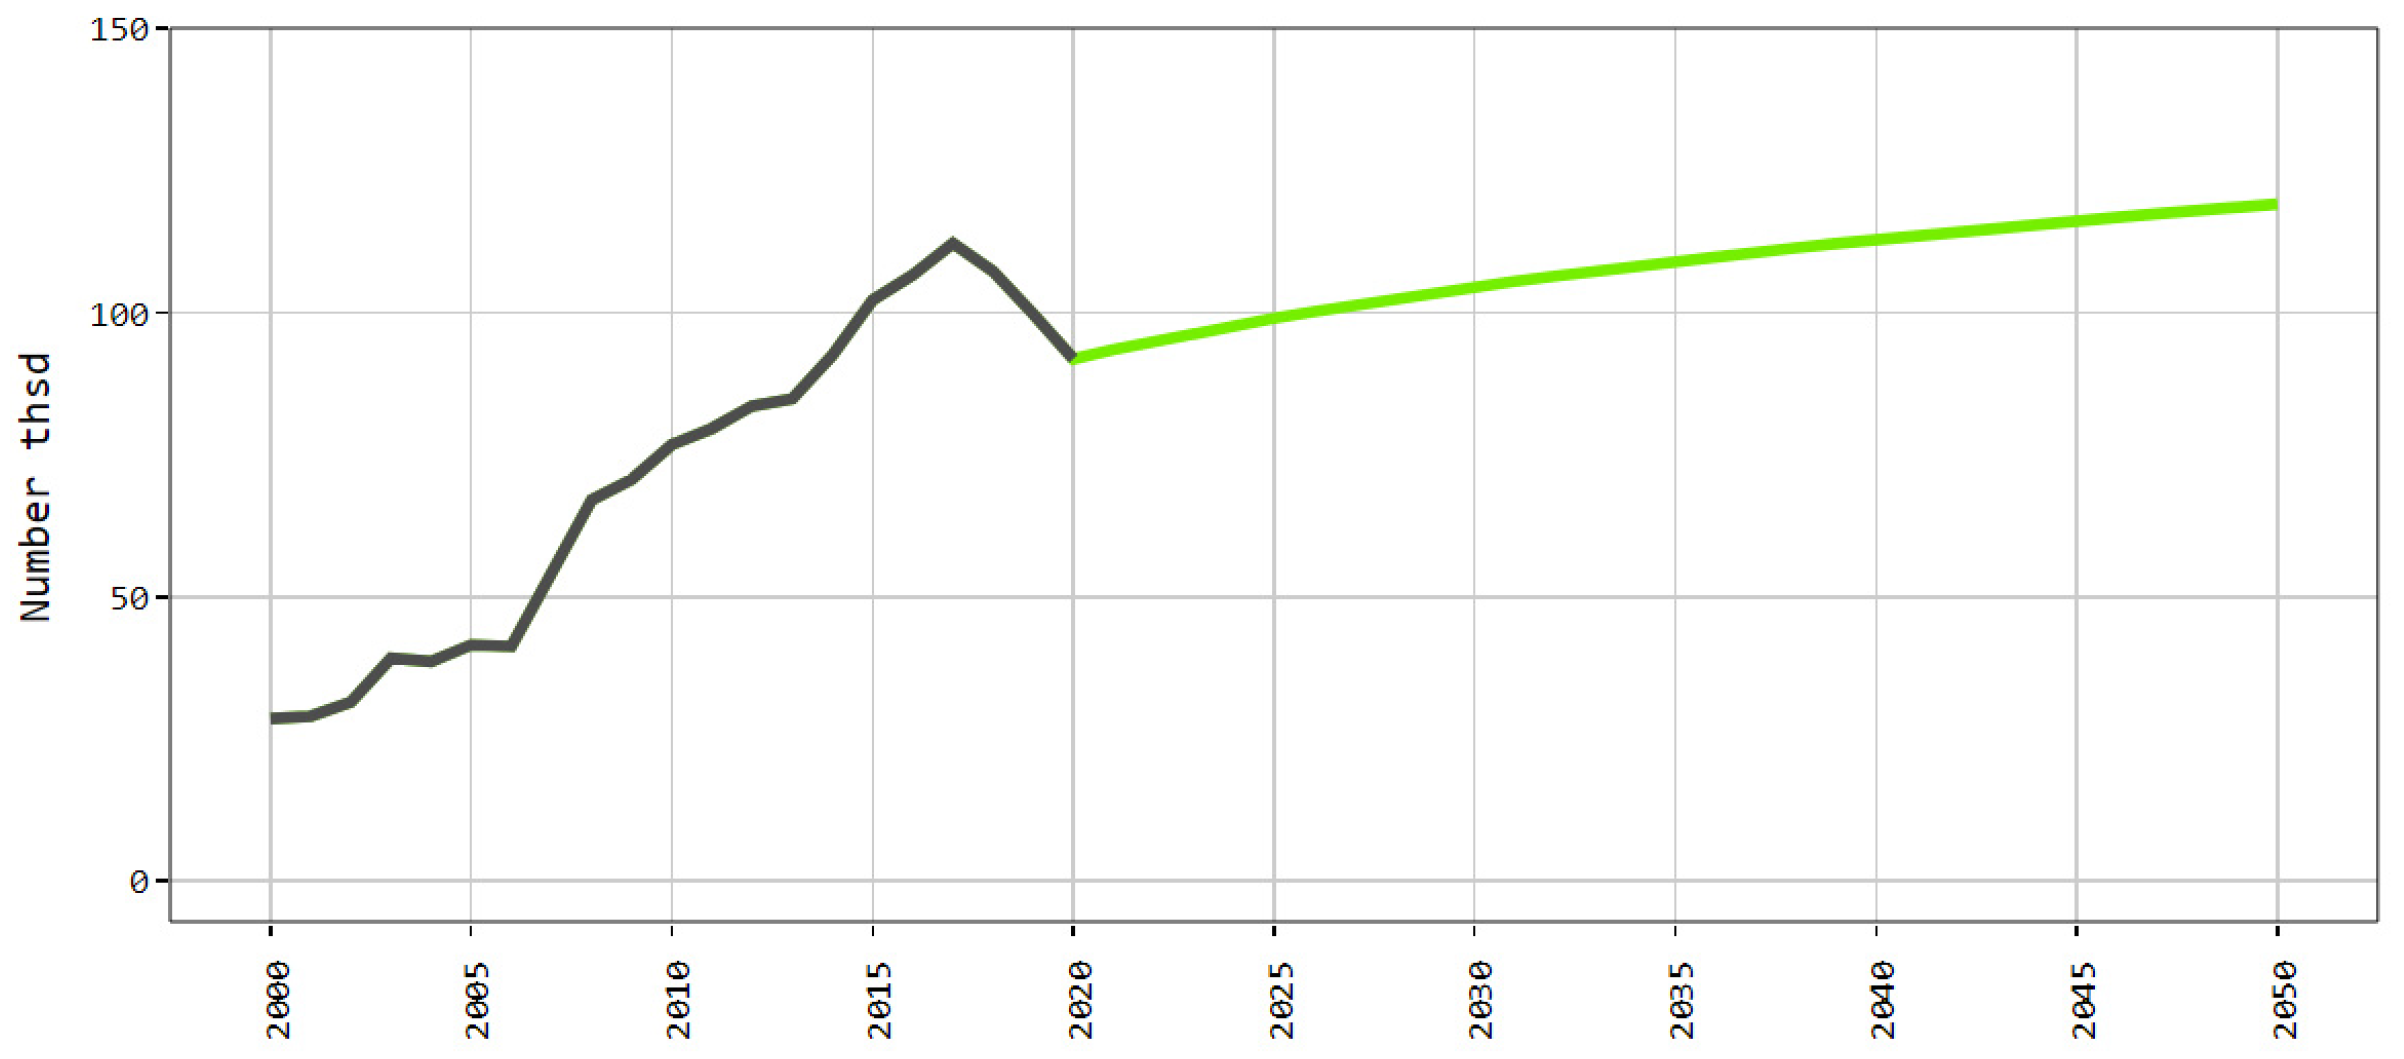
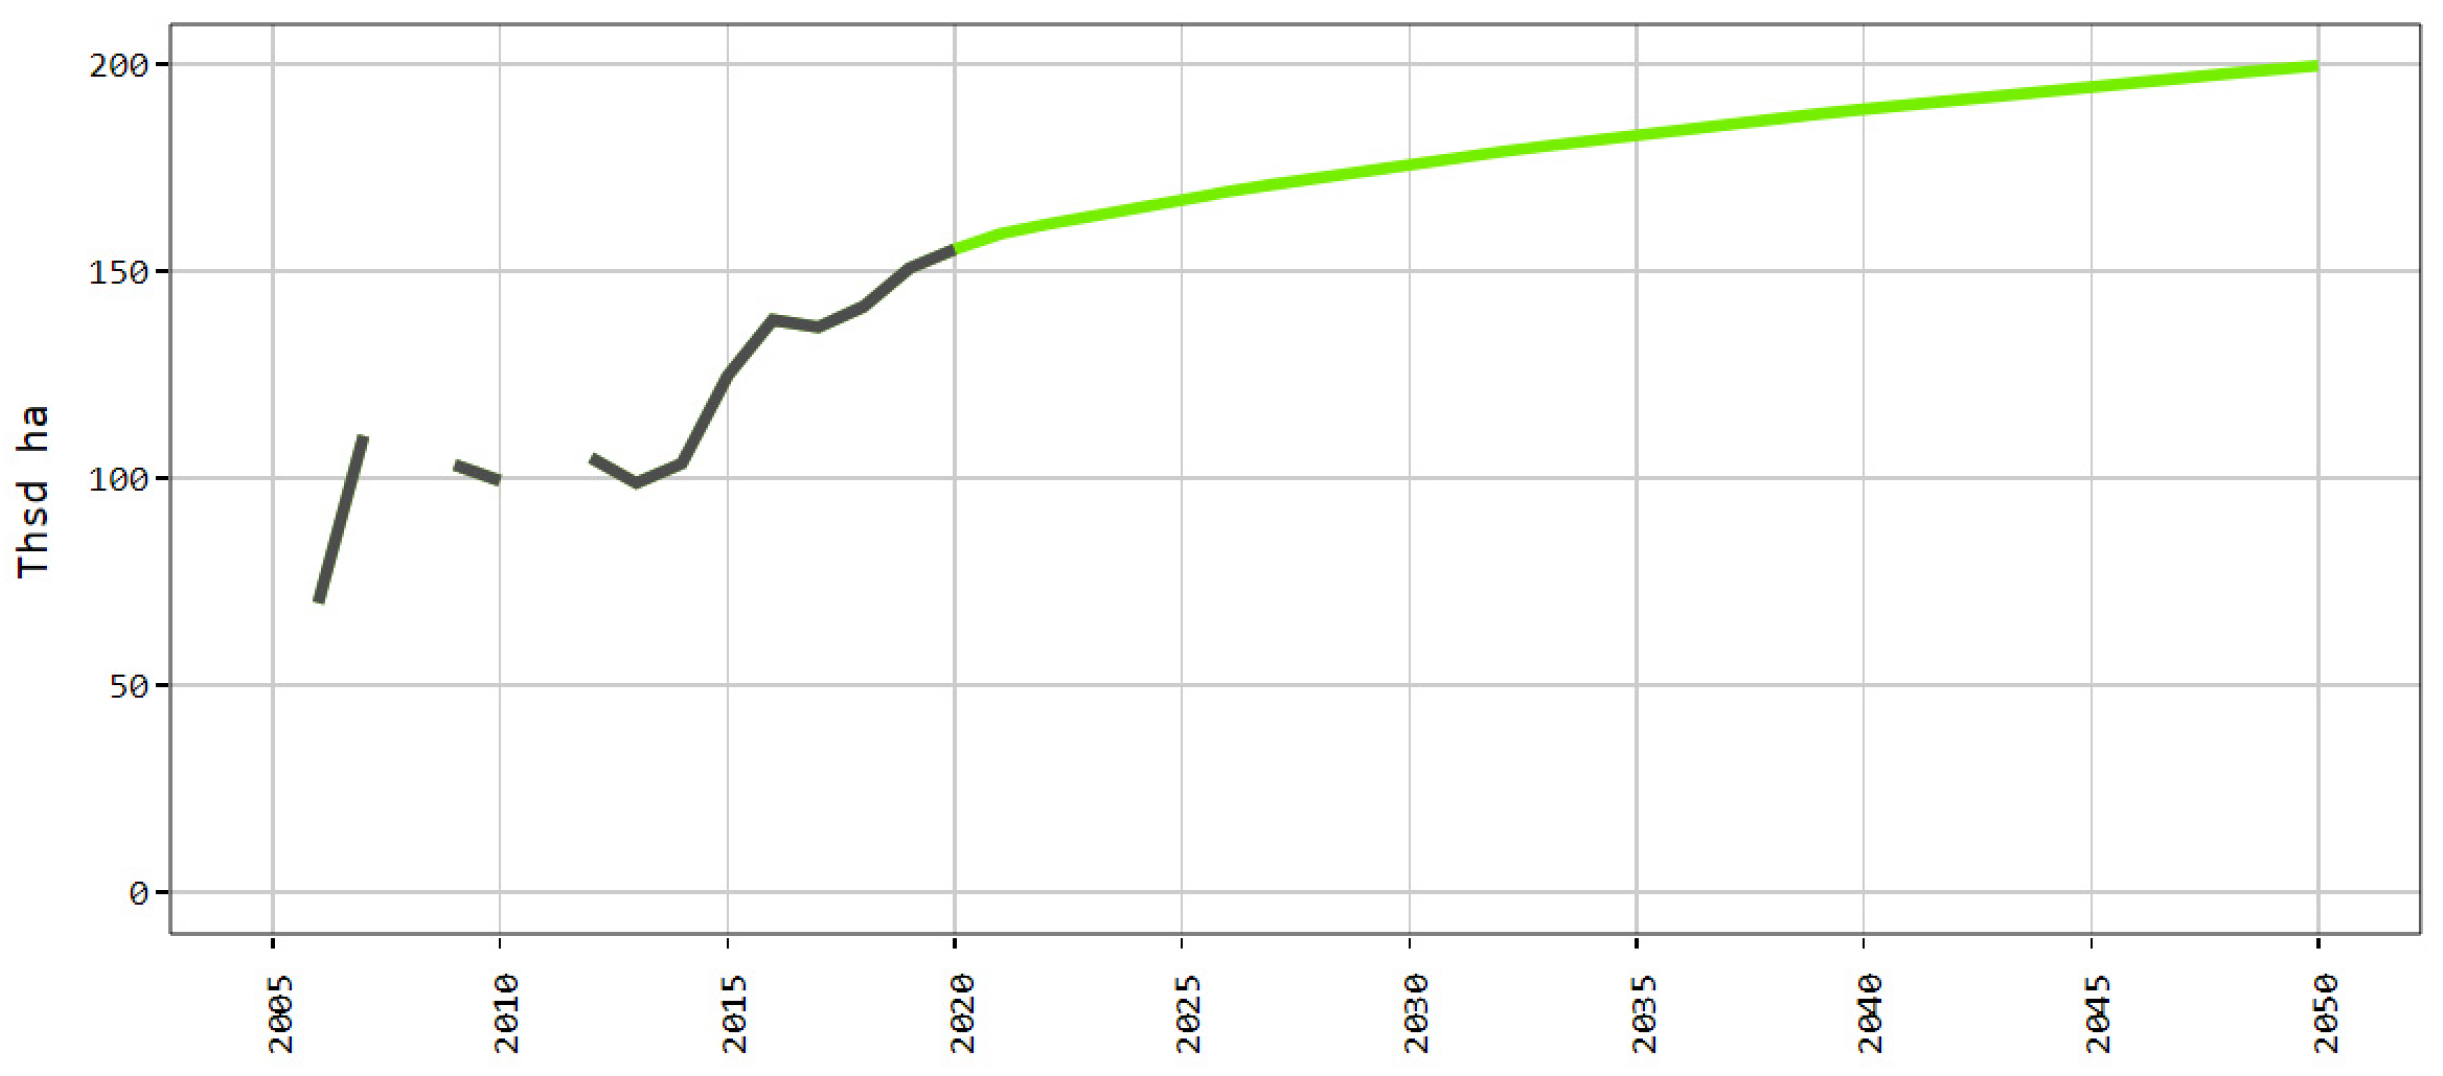
3.3.3. Projections for Organic Farming in Latvia until 2050

Organic farming continues its development in Latvia. The number of farms engaging in organic farming reached 4058 in 2020, and this number has stabilized over the last 5 years [54].
The utilized agricultural area for organic farming is gradually expanding, with a similar trend expected to continue into the future (Figure 17). Organic farming will occupy 333.5 thousand hectares by 2030, a number that will rise to 379.4 thousand in 2050, a respective 15% and 30% increase, relative to the 291.1 thousand in 2020.
Organic farming is characterized by diversified production, with arable land taking up slightly less than a half of the utilized agricultural area under organic farming in 2020. The area of arable land used for organic farming has also increased in recent years (Figure 18). This area is expected to gradually expand, reaching 175.7 thousand ha in 2030, and 199.5 thousand in 2050. The projected upward trend for arable land is similar to that of the overall area of agricultural land used for organic farming, with 13% and 29%, respectively.
As in previous years, the livestock sector of organic farming is dominated by dairy farming. In 2020, the total number of cattle was 102 thousand, of which 33.5 thousand were intended for slaughtering, 17.6 thousand were dairy cows, and 50.8 thousand were other cattle [54]. The total number of cattle is expected to rise by 15% by 2030 (116.9 thousand) and by 31% by 2050 (134 thousand), with this growth mostly fueled by beef and other cattle, whereas the projected increase in the number of dairy cows will only be 20% (21.2 thousand) by 2050, as compared with 2020 (Figure 19).
The number of sheep in organic farming has grown rapidly since 2013 and is expected to continue rising. By 2030, it is expected to reach 40.1 thousand (a + 16% increase, compared with 34.7 thousand in 2020), and in 2050, the number of sheep is projected to be 43.3 thousand (+25%) (Figure 19).
The number of goats in organic farms has shrunk rapidly since 2010, from 7.38 thousand in 2010 to 2.52 thousand in 2020 (an almost 3-fold decrease). In the future, the number of goats is expected to stabilize and remain at the 2020 level (Figure 19).
The past few years have not been particularly beneficial for pig farming due to outbreaks of African swine fever and other factors; the sector is also experiencing a rapid decrease in the number of small businesses. This is why the number of pigs in organic farming also saw a significant reduction, from 9.6 thousand in 2010, down to 2.97 thousand in 2020 (3.2 times). The projections suggest that the number of pigs will stabilize and remain at the 2020 level (Figure 19).
After 2012, with the implementation of EU regulations imposing stricter requirements for the welfare of laying hens, the number of organic poultry stock fell rapidly; however, it started expanding once again in 2016, and in 2020, reached its highest level since 2010. The number of poultry stock is expected to stabilize at 2020 levels in the future, with 47.3 thousand birds (Figure 19).

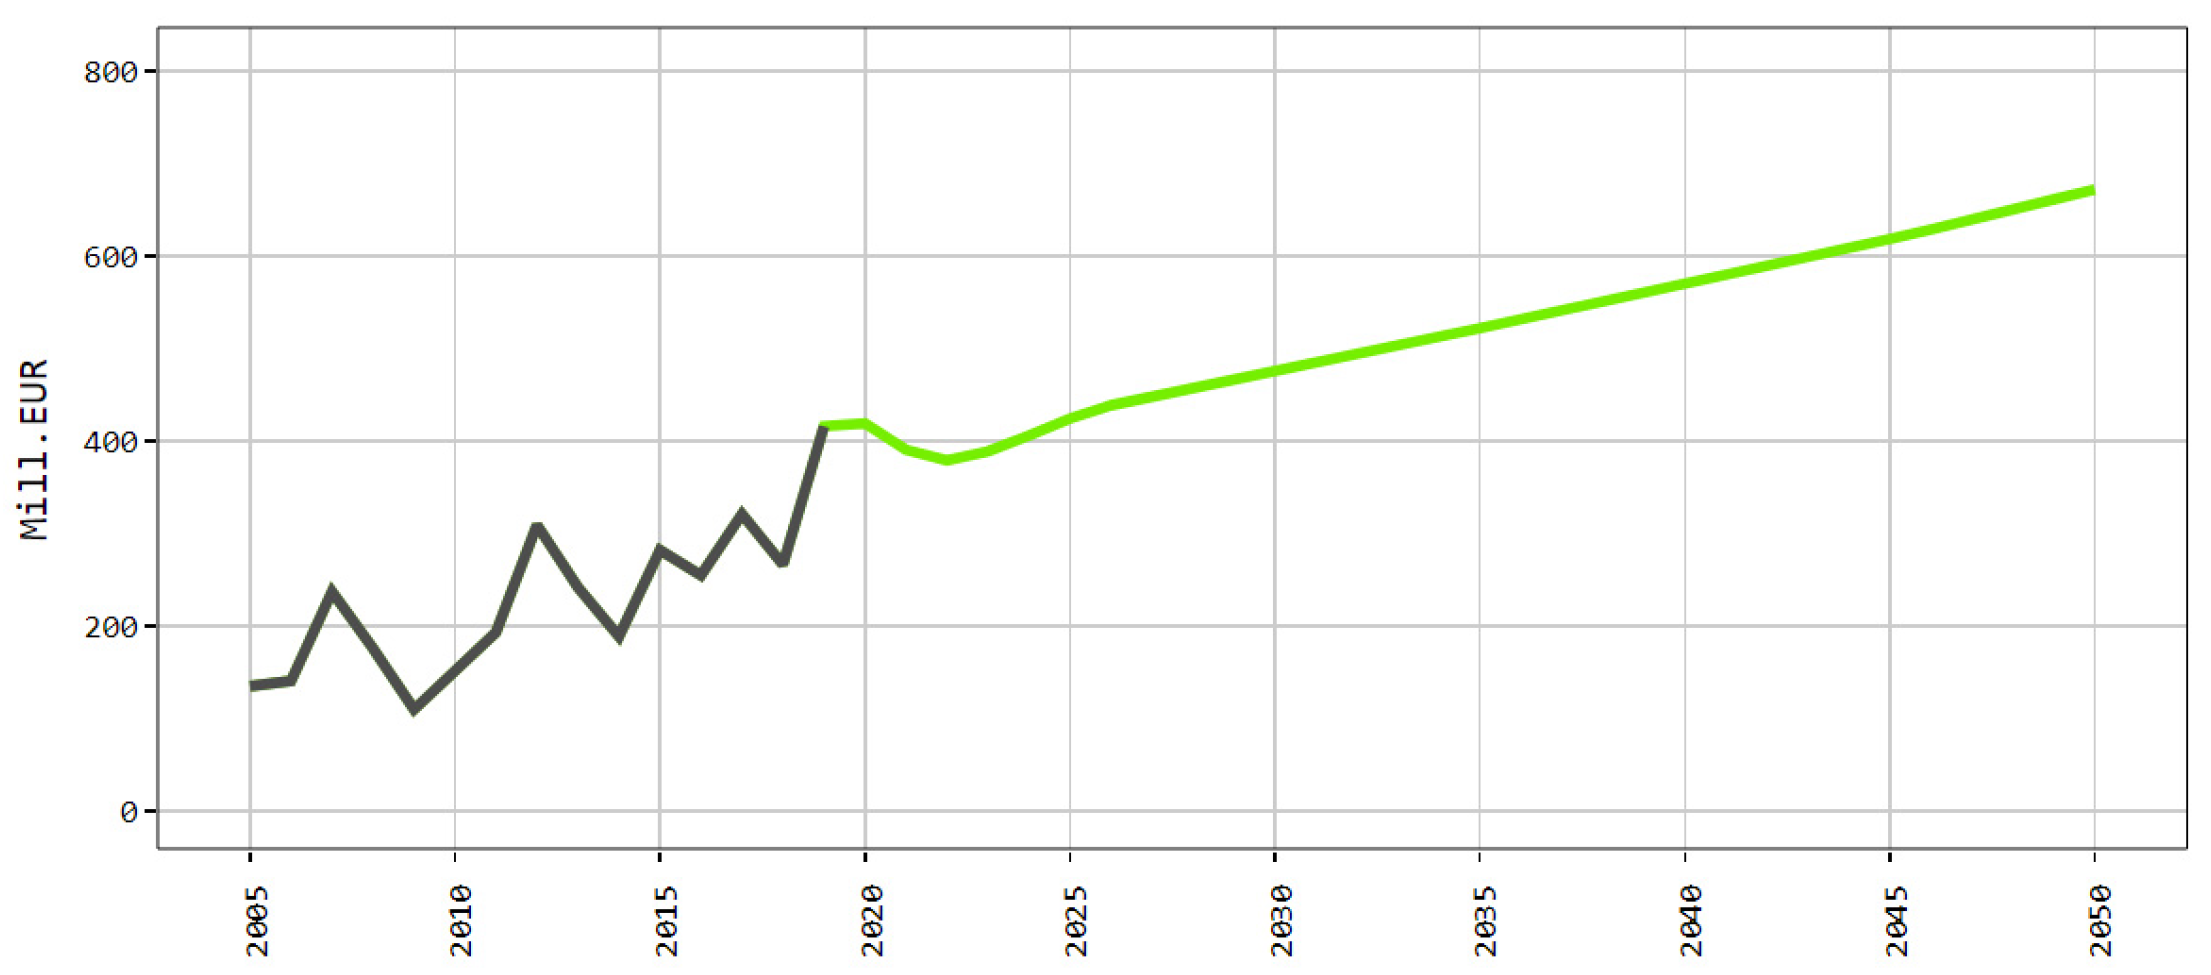
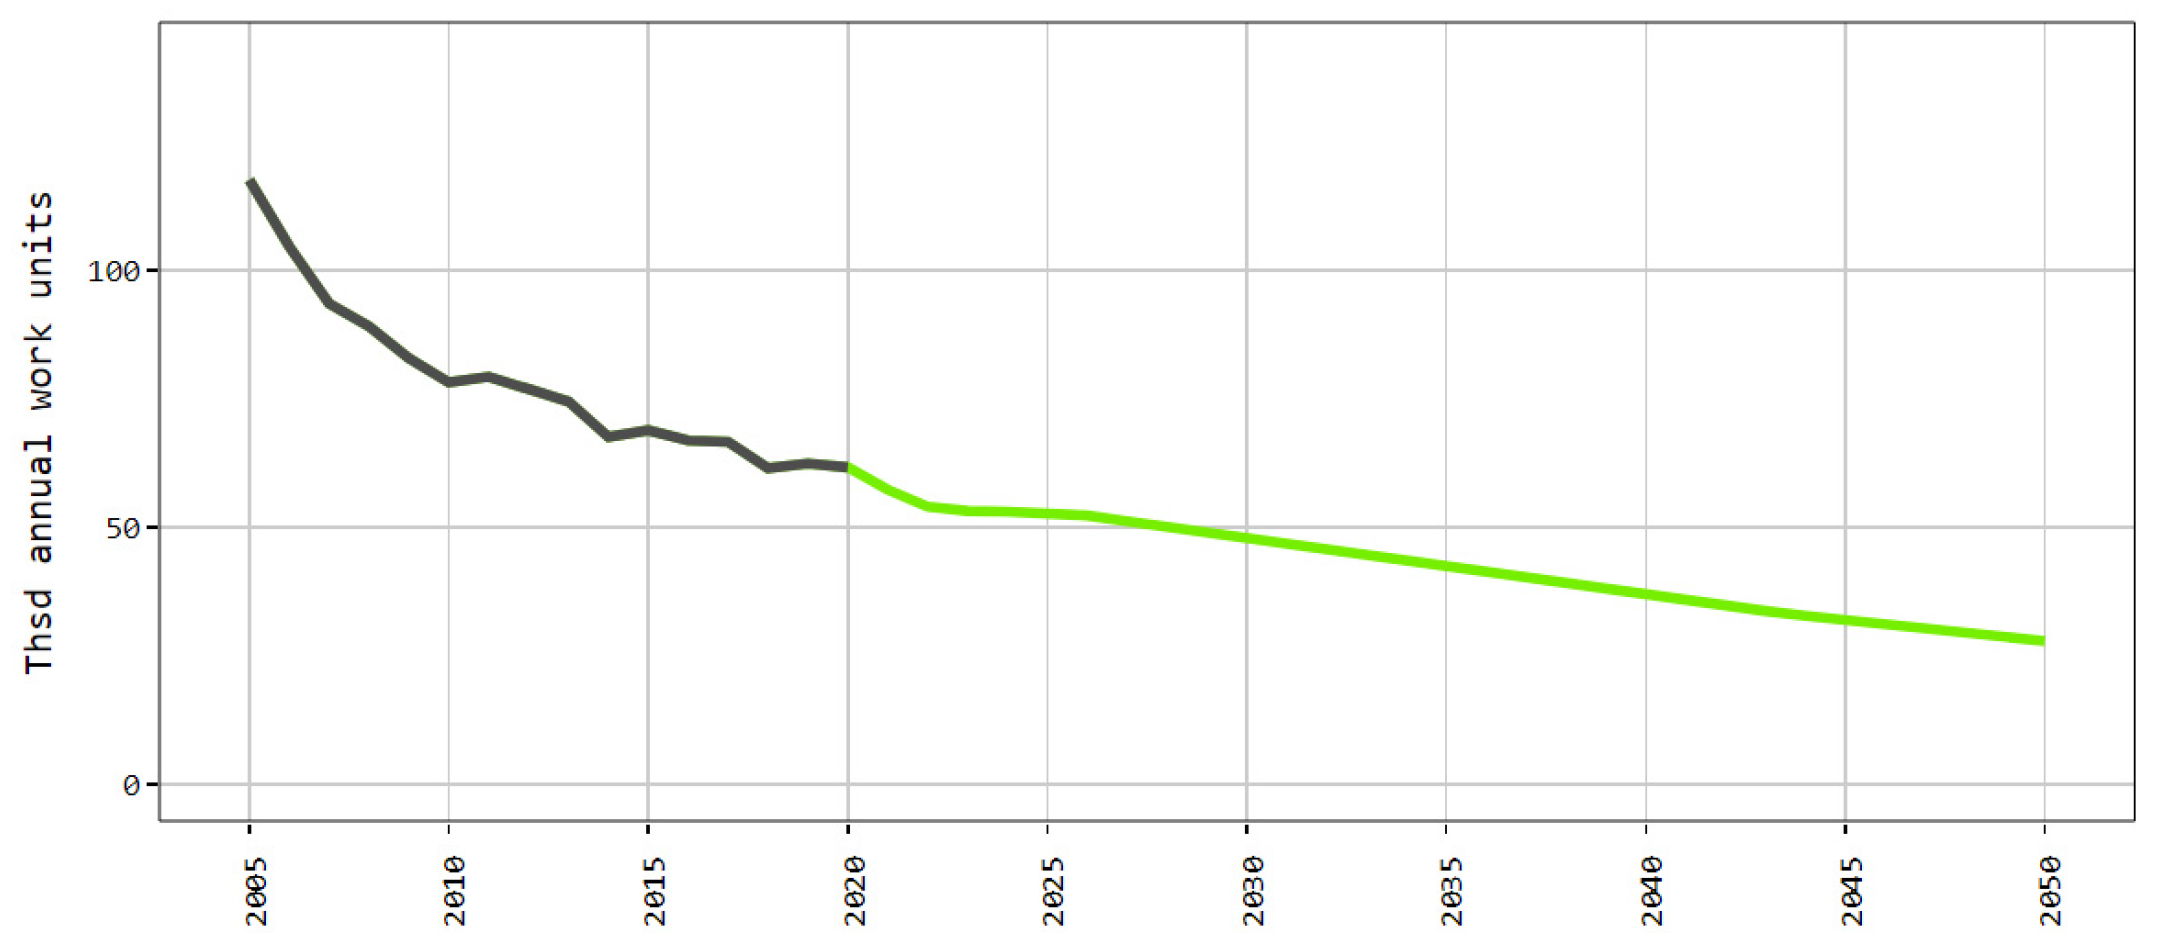
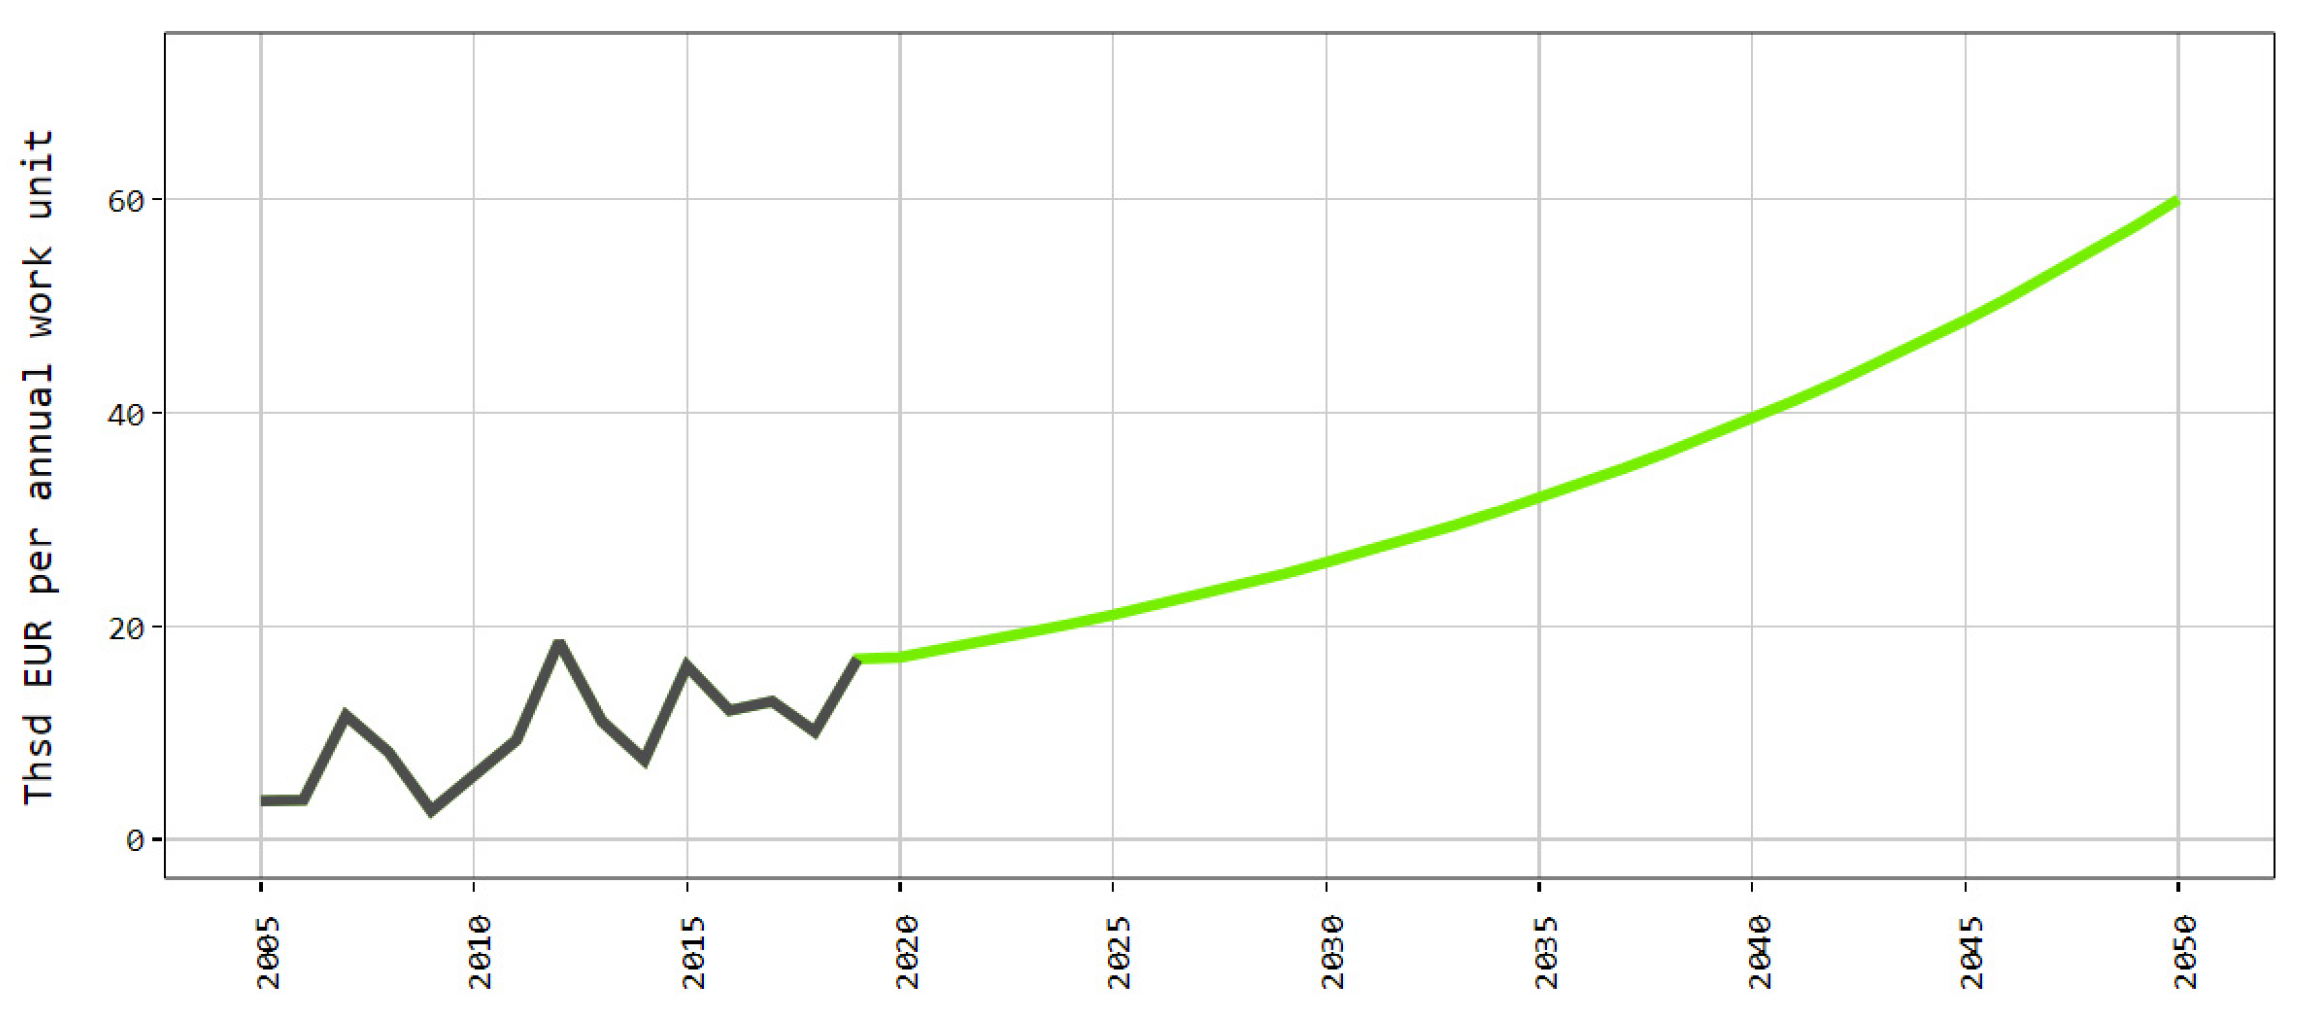
3.3.4. Projected Socioeconomic Development in Latvian Agriculture until 2050

Value added is an increase in the market value of a product that arises as a result of any business activity. In the model, value added was calculated by subtracting intermediate consumption from the value of the product (production volume multiplied by price). In agriculture, changes in value added are caused by fluctuations in production volume and prices, and the trends here have been unstable since 2005 (Figure 20). According to the projections for the development of different agricultural sectors, the minor slump in 2021–2023 will be followed by a gradual increase in value added. The projections show that by 2050, the total value added in the main sectors of agriculture will reach EUR 672.3 million, i.e., 62% more than in 2019 (EUR 416.2 million). By 2030, this rise will lead to a value of EUR 474.2 million (+14% compared with 2019). One should point out that thanks to a significant increase in the value added of crop production, 2019 saw the value added reaching its highest value since 2005, exceeding that of 2018 by 56%.
The number of persons employed in agriculture is gradually falling, with a drop of 47% between 2005 and 2020 (Figure 21). Similar trends can be seen in employment projections as well. According to the projections, the number of agricultural workers will continue falling, down to 46.7 thousand in 2030 and 27.9 thousand in 2050 (24% and 2.2-times less, respectively, compared with 61.7 thousand in 2020).
The value added in producer prices (without support payments) was also used to determine the amount of value added per annual work unit in agriculture. The projections were made based on the farm data taken from the FADN database, analyzing groups of farms based on their specializations. Farms specializing in field crops are expected to increase their productivity significantly due to the concentration of businesses and intensification of production processes (Figure 22). The value added per employee will reach EUR 26 thousand in 2030, and EUR 60 thousand in 2050, for a respective 53% and 3.5-times increase compared with 2019 (EUR 16.9 thousand).
For comparison, the amount of value added per employee generated by specialized field crop farms in other countries is significantly higher, with EUR 44.4 thousand in Germany, EUR 64.7 thousand in Sweden, and EUR 85 thousand in the Netherlands in 2019. This means that reaching EUR 60 thousand in value added per employee is something that Latvian farms specializing in field crops can achieve.
In line with the projected increase in value added, the specialized dairy farms are to see a rise in productivity (Figure 23). The growing per-employee value added will be fueled by the intensification of production processes. The projected rise in per-employee value added in dairy farming is considerable, given that currently this indicator is at a low level in that sector. For comparison, in 2019, German specialized dairy farms created EUR 41.7 thousand of value added per employee, with EUR 35.3 thousand in Sweden, EUR 43.1 thousand in Ireland, and as high as EUR 96.9 thousand in Denmark. In Latvia, the per-employee added value will reach EUR 12.3 thousand in 2030, and EUR 40 thousand in 2050, for a respective 78% and 5.8-times increase compared with 2019 (EUR 6.9 thousand).
With the rising production and its concentration in Latvian agriculture, the value of fixed assets is to increase as well, reaching EUR 2328 million in 2030 and EUR 3252 million in 2050, compared with EUR 1800 million in 2019.
A possible need for investments in Latvian agriculture was assessed, given the value of fixed assets (which is determined as a functional relationship based on production volume and farm concentration) and depreciation. According to the projections, the annual demand for gross investments could be around EUR 551 million in 2030, rising to EUR 693 million in 2050.

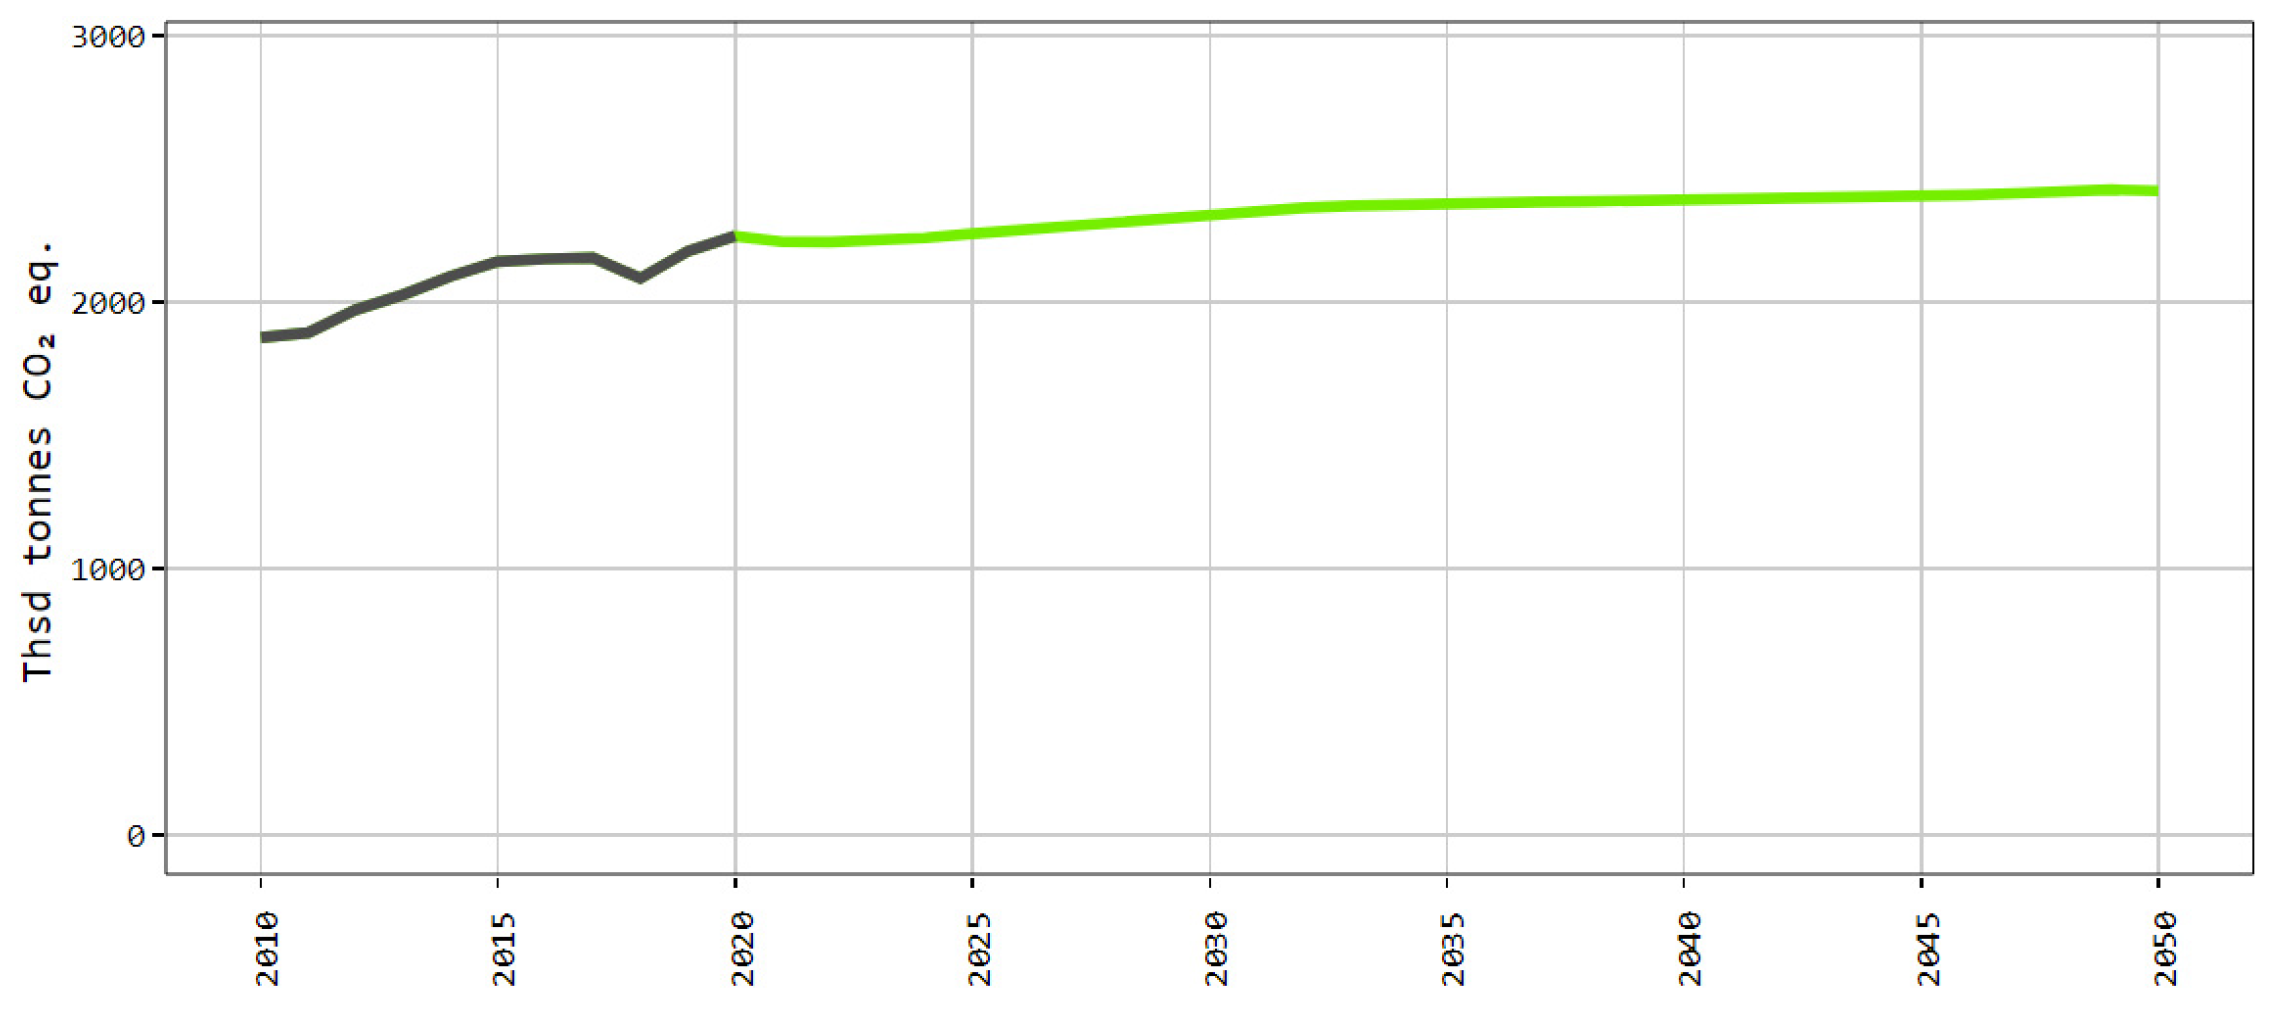
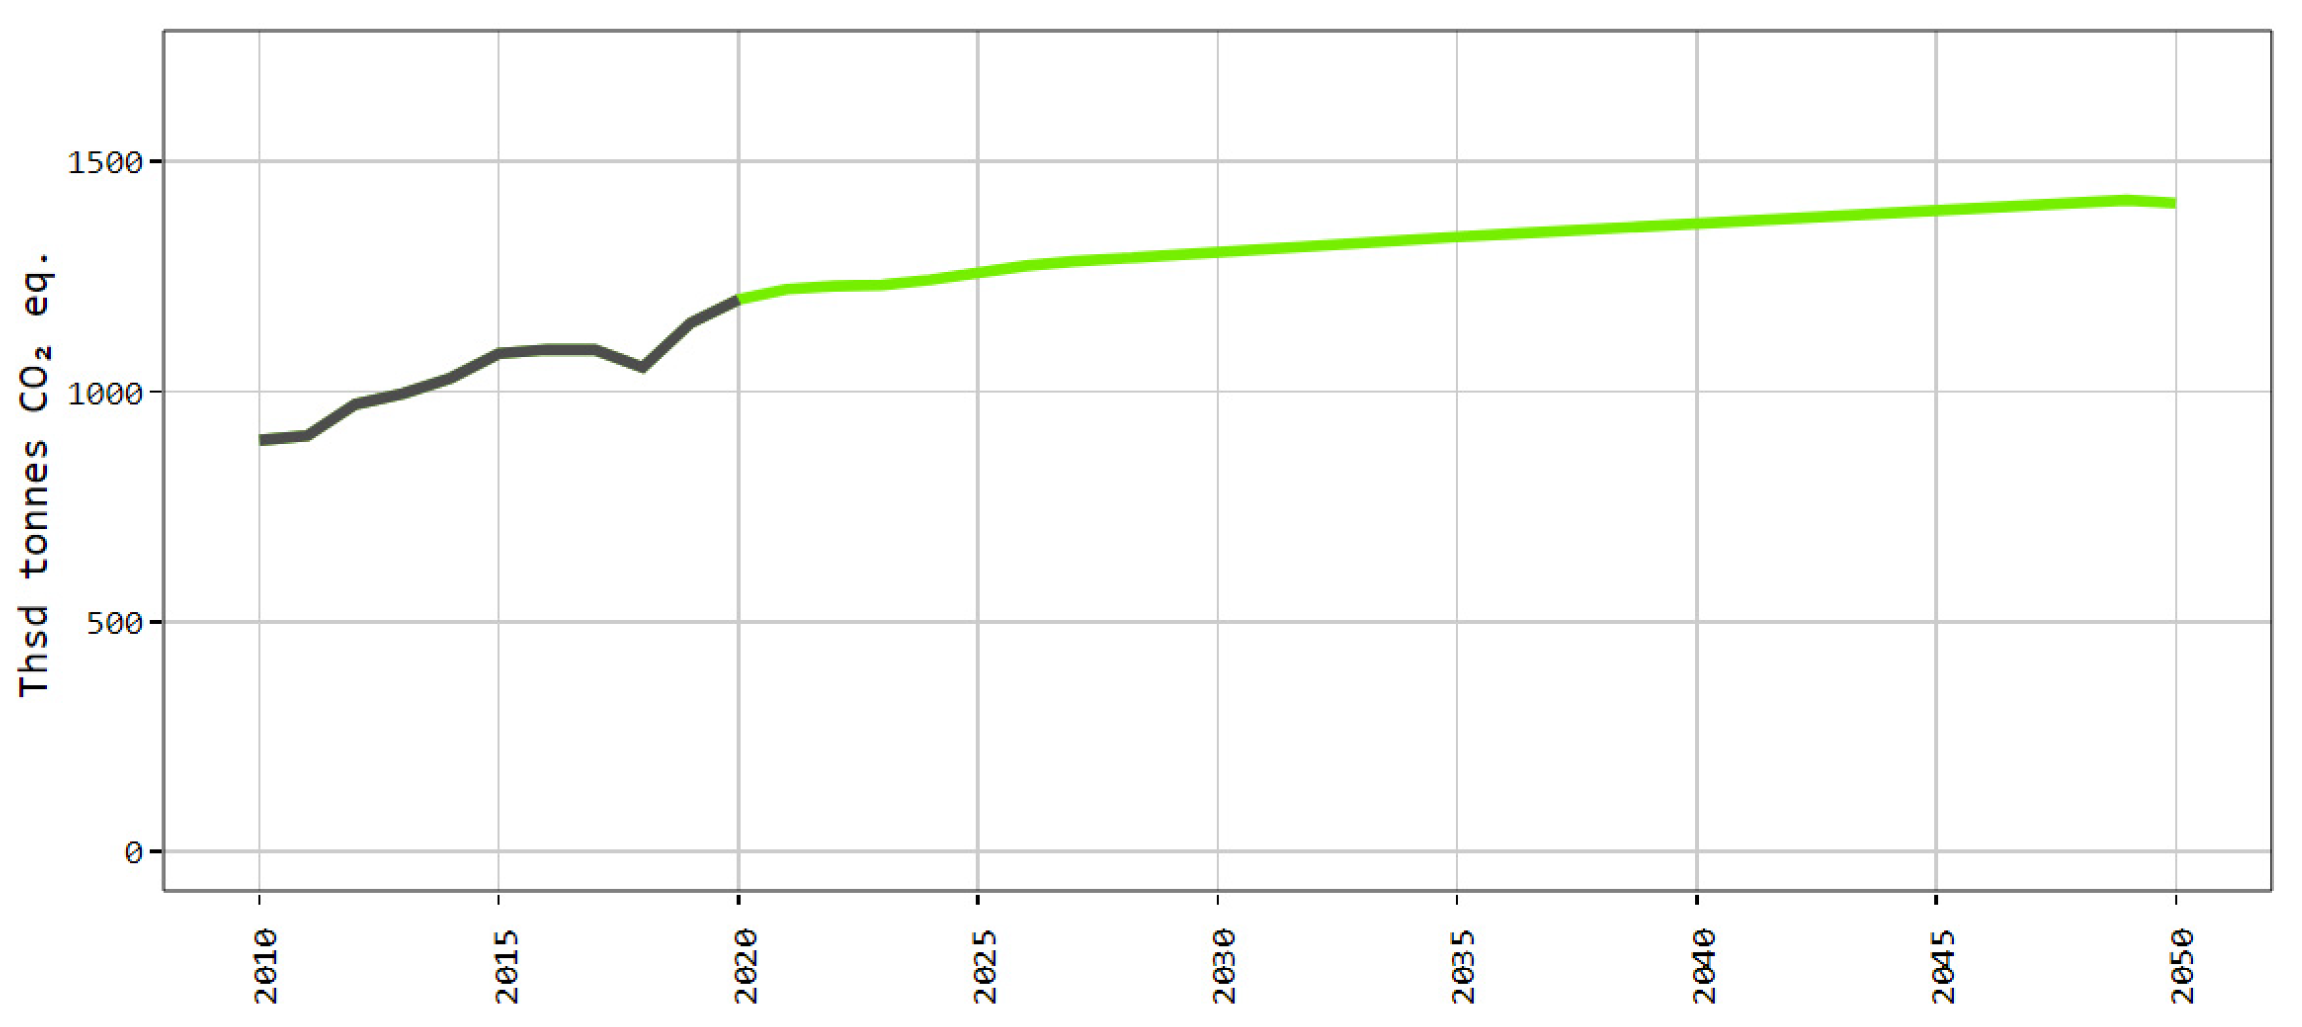
3.3.5. Projected GHG Emissions from Latvian Agriculture until 2050

The agricultural sector produces methane (CH4), nitrous oxide (N2O) and carbon dioxide (CO2) emissions.
Emissions from livestock and manure management include: (1) CH4 emissions produced by livestock enteric fermentation processes and manure management; and (2) direct and indirect N2O emissions from manure management.
Emissions produced by agricultural soil management, which includes: (1) direct N2O emissions caused by the use of synthetic and organic fertilizers; livestock grazing (urine and dung deposited on pastures; crop residues; cultivation of organic soil in arable land and pastures; and (2) indirect N2O emissions from atmospheric deposition, and the leaching and run-off; and CO2 emissions due to the use of urea and liming [63].
In 2019, agriculture made up 19.8% of total GHG emissions in the non-ETS sector in Latvia. Most of these emissions (53.6%) came from the management of land used in agriculture, 38.6% from enteric fermentation, and 7.8% from manure management. The use of urea and liming creates a relatively small proportion of the emissions, 2.5%.
Given the rising production of Latvian agriculture, the total GHG emissions are expected to rise from 2248 thousand tons of CO2 equivalent in 2020 to 2333 thousand tons of CO2 equivalent in 2030 (+4% compared with 2020 and +25% compared with 2010), and to 2418 thousand tons of CO2 equivalent in 2050 (+4% compared with 2030, +8 compared with 2020 and +29% compared with 2010) (Figure 24 and Figure 25).
In 2010, livestock and manure management accounted for 52% of total agricultural GHG emissions in Latvia. In 2020, it was only 47%, and is expected to fall to 44% in 2030, and in 2050 to 42% of the total GHG emissions from Latvian agriculture. However, an increasingly larger proportion of the GHG emissions will be taken up by agricultural soil management (56% and 58%, respectively), given the crop-dominant nature of future projections.

4. Discussion

The discussion section offers an assessment of the model’s results, and a comparison with important trends in other scientific studies, given the latest academic sources.
Many factors affect the development of agriculture in Latvia. First and foremost, these include its historic development and the country joining the EU in 2004, which made it possible to receive support as part of the CAP, the relatively stable domestic market, and instruments put in place to support agricultural production in the event of price reductions. However, adverse weather conditions, especially the weather caused by climate change, has affected agriculture more than other economic sectors, both in Latvia and in the world. Climate change creates short-term shocks such as extreme weather, and stresses such as elevated temperature and reduction in biodiversity. The shocks have an immediate effect, while stress is a slow process that whittles away the capacity of systems to handle changes, making them more vulnerable. The components and participants of agricultural and food systems experience shocks and stresses of different types and intensity, and due to the interrelations among these components, disruptions in any one of them can quickly spread throughout the entire system. Any problems faced by producers are likely to have an impact on the income of poorer people due to rising food costs [64]. This is why the issue of reliable and all-encompassing long-term projections for the agricultural sector has always been important to governments, given the special features pertinent to that sector, and the extreme challenges it is to face in the future. Because no one knows exactly how different factors affecting the food system will progress over time, even though they will certainly define the future. As a result of this, governments, international and civic organizations, as well as academics, have increasingly called for reliable projections that identify alternative scenarios and highlight potential routes for developing and strengthening the resilience of food and agricultural systems [46]. When it comes to modelling, the main challenge is gaining quantitative evidence to support these models, because their different interpretations make it difficult to consistently achieve observable and measurable variables and detect correlations quantitatively [12]. However, various forecasting systems are adapted to the needs of different clients, and they differ from one another depending on how important the information entered in the system, as well as the results projected and to be achieved, are for the user [23]. For example, in Latvia, the LASAM model projects the development of agriculture based on the gradual increase in arable land and land used in agriculture, leading to higher crop yields and harvests, especially for wheat, and especially in larger farming groups. The intensification of crop farming and livestock farming will also play a critical role in protecting the use of agricultural land in the future [22]. In turn, this will cause an increase in GHG emissions by 2050, and the emissions caused by the crop farming sector will be decisive in the overall emissions balance, as policymakers will have to think about support measures to incentivize farmers to work in a more environmentally friendly way and reduce various emissions, especially in the context of the EU Green Deal. This is because 21 to 37% of total GHG emissions in the world are associated with food systems, including agriculture and land use, as well as storage, transportation, packing, processing, retail sale and consumption of food [4]. Because agriculture has a direct effect on the environment, organic farming can lead to such production of foodstuffs that satisfies the needs of the public and those of the environment. This is why organic farming is an important element in the sustainable development of rural regions, principally aimed at protecting nature and making food products that meet the quality expectations of the customers [65,66]. The LASAM model offers advantages to this effect because it includes long-term projections, covering both conventional and organic agriculture, and anyone interested can compare the future development prospects of these two sectors in terms of land use as well as livestock farming. Although it is expected that by 2050, the utilized agricultural area under organic farming in Latvia will rise by 30%, compared with 2020, the share of organically farmed land relative to the total amount of agricultural land will be 17% in 2030 and 19% in 2050. This means that Latvia may possibly fail to achieve the Green Deal goal set by the European Commission, with 25% of total agricultural land being used for organic farming by 2030 [67].
In Latvia, the number of dairy cows is not expected to rise, while milk production will be affected by the increasing milk yield, technological advances and herd management. However, businesses in the industrial meat production sectors (poultry and pigs) have invested in the development of their production infrastructure, continuing to optimize its use to maximize the revenue from their business activities. Because neither the growth of the domestic market nor the expansion into new export markets are projected to occur, there is no sufficient reason to believe that the sector could undergo rapid development. It is also emphasized by other researchers that decision support systems are critical in modern agriculture because the demand for agricultural products is rising and will have to make more while using a limited amount of land [1,4,16,68]. Factors that enable better decisions may differ, and long-term motivation for farmers can differ from their short-term motivation. For example, those leasing and owning property may necessitate distinct conceptual models, and the decision making for these groups can differ drastically. Even the planning capacity of farmers can be different, given the duration of planning periods (5, 10 and 20 years) [69]. This is why LASAM offers certain advantages to its users, because everyone who uses the model can choose a planning period based on their interests, as this publicly available model includes numeric indicator values for every year.
The information available in the model will become even more significant if it encompasses not only the physical parameters of different sectors of agriculture, such as land area, productivity, total harvest, livestock number, its productivity and total production volume, but also socioeconomic indicators. This is because the efficiency of agriculture largely depends on the workforce engaged in agricultural production, which typically has limited mobility [70]. Furthermore, persons employed in agriculture contribute to the development of the respective rural area. Additionally, LASAM points specifically at the problems Latvia’s agriculture will face in the future, as the number of workers employed in the sector in 2050 will be less than half of that in 2020. Thus, in view the projections provided by the model, policymakers should find measures to compensate for the job shortages in rural areas. However, the trend for the workforce to diminish also has a positive side, as with the projected increase in the value added of agriculture, labor productivity in agriculture will rise considerably. This is because the specific nature of labor productivity in agriculture has to do with a direct correlation between the amount of work spent, and the result of the work, expressed both as a value and in physical terms [38]. At the same time, many countries show a tendency to lack workers in agricultural sectors, which leads to technological upgrades and investments to compensate for the missing workforce. Agricultural investments help the country to achieve food security and increase its level of self-sufficiency [70]. This is where LASAM answers another question; that is, how much future investment will be necessary to achieve the projected production levels in the corresponding agricultural sectors. Thus, both farming businesses and policymakers should agree on the amount of necessary investments, involving in this process not only the investment support instruments of the EU CAP but also credit institutions, fostering a lending policy that is beneficial and attractive to farmers.
Importantly, the model and projection results are public and available for use by anyone interested in the topic who can choose specific fields of interest, sectors, periods, at both the national and the international level. In fact, LASAM outputs are already used by some Latvian models, specifically land use, energy and GHG models. Thus, the projections prepared using LASAM can find a broader use.
A review of the research literature revealed that some countries and international institutions prefer developing projection models based on their national or organizational needs, but some countries do not have such models. LASAM can also be used for agricultural projections for other small open economies.
However, policymakers, farmers, stakeholders, etc. could expand the functions of the LASAM model in the future, expanding the scope and practical application of its projections: (1) for assessing GHG emissions in different agricultural sectors, making it possible to assess the GHG emissions created by farms depending on the type of farming they are engaged in (input data), despite the fact that globally, there are GHG emissions calculators for various fields, including crop farming, livestock farming and forestry. Researchers Colomb et al. have identified eighteen main calculators which, however, have critical differences in terms of their methods and scope of applicability, significantly affecting results [71]; (2) for assessing not only the GHG emissions but also the possibility of carbon sequestration in agriculture. The carbon sequestration process, which involves plant-uptake of carbon dioxide from the atmosphere and storage of carbon in the biomass and soil through photosynthesis, can help to prevent the loss of productivity in soil, limit the concentration of GHG in the atmosphere, and reduce the negative effects of climate change on the ecosystems of agriculture. Capturing additional carbon in the soil is a sustainable land use practice, and it can be useful for farming businesses, which can increase their harvest and reduce production costs as a result [72]. Furthermore, regionally adapted carbon agriculture programs is one of the ways to adjust the storage of carbon in soil to local conditions [73]. Carbon sequestration and fossil fuel offset by bioenergy crops is an important component of a possible total societal response to a GHG emission reduction initiative [74]. We believe that as the complexity and diversity of technologies and practices rise, we need to continue research, which includes making quality projections about the best and the most eco-friendly business practices in agriculture in order to reduce the stress caused by negative climate change and other challenges on managing natural resources.
The LASAM web application is updated using LASAM data. The planned technical updates include measures to optimize performance, reducing software reaction time, to upgrade libraries, to fix bugs, etc. The opportunities for further soft-linking LASAM with other models are also being assessed. One of the interesting future enhancements of the LASAM model could be the integration of artificial intellect components, making the model self-sufficient to update itself and to work with a minimum from the outside.

5. Conclusions

In the 21st century, agriculture and food systems are important components of national economies, accounting for 1 to 60% of the GDP of various nations (the average global level was at 4% in 2017); agriculture is still the second biggest global source of employment after services, facing many challenges associated with the management of natural resources and the negative effects of climate change. This is why many countries develop different models to serve as a tool for projecting the development of agricultural sectors in order to make better policy decisions, to better project the activities of farming businesses, and to achieve the higher involvement of stakeholders. There are broadly available and globally used methods for projecting the use of agricultural land, crop harvests, use of water and other resources necessary for agriculture and the efficiency of such use, and for assessing the effect of these factors on the economy, climate change, researching the development of the food market, etc. Various agricultural sector models see particularly extensive use in the EU, determining the impact of the CAP and helping to create future development scenarios.
In 2016–2021, a special model adapted to the national conditions, called LASAM, was created in Latvia, making it possible to use the historical data on the development of agricultural sectors, medium-term price projections for agricultural products in the EU, changes in support policy, as well as the necessity for the resources used, to project the long-term (up to 2050) development of agriculture. The LASAM model includes the crop sector, the animal sector and the overall socioeconomic development, as well as the growth of organic farming and GHG emissions projections. It is publicly available to everyone, including farmers and policymakers.
The projection data prepared reveal the following key agricultural development trends in Latvia until 2050: (1) rising arable land area, fueled by the projected increase in the utilized agricultural area for production; (2) crop production will develop due to the expansion of the areas and the production volume of cereal crops, especially wheat, which is a result of successful growth in the sector after Latvia joined the EU, which included direct and indirect financial support by the EU, high grain prices, access to the EU market, as well as consolidation processes in the sector, increasing production intensity, as well as use of the latest production technologies; (3) in the herbivore livestock sector, milk production will play a more important role, and a stable increase is expected due to higher milk yield and more milk production by commercial dairy farms. An increase in the number of suckler cows is expected to continue until 2024, after which the number is to be constant, at 67.5 thousand animals, due to the difficulty in projecting the development of beef farming. This depends on a number of factors: the possibility of exporting calves, support payments, emissions policy, etc.; (4) the number of pigs is to fall due to a decrease in their number on small farms; in poultry farming, whose development is steered by a small number of large companies, stability is projected; (5) the agricultural and arable land used in organic farming will rise gradually until 2050. The herbivore sector of organic farming is expected to experience a consistent rise, with stability in the other sectors; (6) for socioeconomic performance, a rapid rise in value added is projected, with the need to invest in fixed assets due to a loss of the workforce, resulting in a significant increase in labor productivity; and (7) because of the rising production volume of Latvia’s agriculture, the total GHG emissions will slowly increase with a change in GHG emission structure, which will be dominated by the emissions from agricultural soil management due to the expansion of crop farming.
The public availability of LASAM in Latvian and English is a positive feature that enables the broader use of its results.

Author Contributions

Conceptualization, I.P. and A.N.; methodology, A.K., A.N. and D.K.; software, A.K. and D.K.; validation, A.N. and I.U.; formal analysis, I.P. and I.U.; investigation, I.P., A.N., A.K. and I.U.; resources, I.P.; data curation, A.K. and I.U.; writing—original draft preparation, I.P.; writing—review and editing, A.N., D.K. and A.K.; visualization, A.N. and D.K.; supervision, I.P.; project administration, I.P. and A.N.; funding acquisition, I.P. All authors have read and agreed to the published version of the manuscript.

Funding

The research was promoted with the support of the project of the Ministry of Agriculture of the Republic of Latvia “Forecasting of Agricultural Development and the Designing of Scenarios for Policies until 2050”, agreement No. 21-00-S0INV05-000007/S402.

Institutional Review Board Statement

Not applicable.

Informed Consent Statement

Not applicable.

Data Availability Statement

LASAM historic and projection data. (link): https://lasam.llu.lv (accessed on 18 March 2022).

Conflicts of Interest

The authors declare no conflict of interest. The funders had no role in the design of the study; in the collection, analyses, or interpretation of data; in the writing of the manuscript, or in the decision to publish the results.

References

  1. Nelson, G.C.; Van Der Mensbrugghe, D.; Ahammad, H.; Blanc, E.; Calvin, K.; Hasegawa, T.; Havlik, P.; Heyhoe, E.; Kyle, P.; Lotze-Campen, H.; et al. Agriculture and climate change in global scenarios: Why don’t the models agree. Agric. Econ. 2014, 45, 85–101. [Google Scholar] [CrossRef]
  2. FAO; Committee on World Food Security. Principles for Responsible Investment in Agriculture and Food Systems; FAO: Rome, Italy, 2014; 32p, Available online: https://www.fao.org/3/au866e/au866e.pdf (accessed on 16 January 2022).
  3. FAO. In Brief to The State of Food and Agriculture 2021: Making Agrifood Systems More Resilient to Shocks and Stresses; FAO: Rome, Italy, 2021; 28p, Available online: https://www.fao.org/3/cb7351en/cb7351en.pdf (accessed on 16 January 2022).
  4. Mbow, C.; Rosenzweig, L.G.; Barioni, T.G.; Benton, M.; Herrero, M.; Krishnapillai, E.; Liwenga, P.; Pradhan, M.G.; Rivera-Ferre, T.; Sapkota, F.N.; et al. Food Security. In Climate Change and Land: An IPCC Special Report on Climate Change, Desertification, Land Degradation, Sustainable Land Management, Food Security and Greenhouse Gas Fluxes in Terrestrial Ecosystems; IPCC: Geneva, Switzerland, 2019; pp. 437–550. Available online: https://www.ipcc.ch/site/assets/uploads/sites/4/2021/02/08_Chapter-5_3.pdf (accessed on 17 January 2022).
  5. FAO. World Food and Agriculture—Statistical Yearbook 2020; FAO: Rome, Italy, 2020; 366p. [Google Scholar] [CrossRef]
  6. European Commission, Directorate-General for Communication. Agriculture: A Partnership between Europe and Farmers; Publications Office: Brussels, Belgium, 2017; 16p, Available online: https://data.europa.eu/doi/10.2775/358697 (accessed on 19 January 2022).
  7. Ponisio, L.C.; M’Gonigle, L.K.; Mace, K.C.; Palomino, J.; De Valpine, P.; Kremen, C. Diversification practices reduce organic to conventional yield gap. Proc. R. Soc. B Biol. Sci. 2015, 282, 7. [Google Scholar] [CrossRef] [PubMed] [Green Version]
  8. Solazzo, R.; Donati, M.; Tomasi, L.; Arfini, F. How effective is greening policy in reducing GHG emissions from agriculture? Evidence from Italy. Sci. Total Environ. 2016, 573, 1115–1124. [Google Scholar] [CrossRef] [PubMed]
  9. Jabbour, R.; McClelland, S.C.; Schipanski, M.E. Use of decision-support tools by students to link crop management practices with greenhouse gas emissions: A case study. Nat. Sci. Educ. 2021, 50, e20063. [Google Scholar] [CrossRef]
  10. Taghikhah, F.; Voinov, A.; Shukla, N.; Filatova, T.; Anufriev, M. Integrated modeling of extended agro-food supply chains: A systems approach. Eur. J. Oper. Res. 2021, 288, 852–868. [Google Scholar] [CrossRef]
  11. Kuznetsova, M.A.; Iakusheva, O.I.; Rogozhin, A.N.; Borovsky, K.V.; Statsyuk, N.V. Digital Forecast Technologies for Sustainable Agriculture: Optimization of Fungicidal Treatments of Potato for the Far East Region. IOP Conf. Ser. Earth Environ. Sci. 2021, 666, 042023. [Google Scholar] [CrossRef]
  12. Montes de Oca Munguia, O.; Pannell, D.J.; Llewellyn, R. Understanding the Adoption of Innovations in Agriculture: A Review of Selected Conceptual Models. Agronomy 2021, 11, 139. [Google Scholar] [CrossRef]
  13. St-Pierre, N.R. Comparison of model predictions with measurements: A novel model-assessment method. J. Dairy Sci. 2016, 99, 4907–4927. [Google Scholar] [CrossRef] [Green Version]
  14. Kapitza, S.; Golding, N.; Wintle, B.A. A fractional land use change model for ecological applications. Environ. Model. Softw. 2022, 147, 105258. [Google Scholar] [CrossRef]
  15. Yildirim, F.; Kaya, A. Selecting Map Projections in Minimizing Area Distortions in GIS Applications. Sensors 2008, 8, 7809–7817. [Google Scholar] [CrossRef] [Green Version]
  16. Fujimori, S.; Hasegawa, T.; Masui, T.; Takahashi, K. Land use representation in a global CGE model for long-term simulation: CET vs. logit functions. Food Secur. 2014, 6, 685–699. [Google Scholar] [CrossRef]
  17. Hurtt, G.C.; Chini, L.P.; Frolking, S.; Betts, R.A.; Feddema, J.; Fischer, G.; Fisk, J.P.; Hibbard, K.; Houghton, R.A.; Janetos, A.; et al. Harmonization of land-use scenarios for the period 1500–2100: 600 years of global gridded annual land-use transitions, wood harvest, and resulting secondary lands. Clim. Chang. 2011, 109, 117–161. [Google Scholar] [CrossRef] [Green Version]
  18. Akpoti, K.; Kabo-Bah, A.T.; Zwart, S.J. Review—Agricultural land suitability analysis: State-of-the-art and outlooks for integration of climate change analysis. Agric. Syst. 2019, 173, 172–208. [Google Scholar] [CrossRef]
  19. Topping, C.J.; Dalby, L.; Valdez, J.W. Landscape-scale simulations as a tool in multi-criteria decision making to support agri-environment schemes. Agric. Syst. 2019, 176, 102671. [Google Scholar] [CrossRef]
  20. Zilli, M.; Scarabello, M.; Soterroni, A.C.; Valin, H.; Mosnier, A.; Leclère, D.; Havlik, P.; Kraxner, F.; Lopes, M.A.; Ramos, F.M. The impact of climate change on Brazil’s agriculture. Sci. Total Environ. 2020, 740, 139384. [Google Scholar] [CrossRef]
  21. Dietrich, J.P.; Schmitz, C.; Lotze-Campen, H.; Popp, A.; Müller, C. Forecasting technological change in agriculture—An endogenous implementation in a global land use model. Technol. Forecast. Soc. Chang. 2014, 81, 236–249. [Google Scholar] [CrossRef]
  22. Van Zeist, W.-J.; Stehfest, E.; Doelman, J.C.; Valin, H.; Calvin, K.; Fujimori, S.; Hasegawa, T.; Havlik, P.; Humpenöder, F.; Kyle, P.; et al. Are scenario projections overly optimistic about future yield progress? Glob. Environ. Chang. 2020, 64, 102120. [Google Scholar] [CrossRef]
  23. Fritz, S.; See, L.; Carlos, J.; Bayas, L.; Waldner, F.; Jacques, D.; Becker-Reshef, I.; Whitcraft, A.; Baruth, B.; Bonifacio, R.; et al. A comparison of global agricultural monitoring systems and current gaps. Agric. Syst. 2019, 168, 258–272. [Google Scholar] [CrossRef]
  24. Tao, F.; Palosuo, T.; Rötter, R.P.; Díaz-Ambrona, M.; Mínguez, I.C.G.; Semenov, M.A.; Kersebaum, K.C.; Cammarano, D.; Specka, X.; Nendel, C.; et al. Why do crop models diverge substantially in climate impact projections? A comprehensive analysis based on eight barley crop models. Agric. For. Meteorol. 2020, 281, 107851. [Google Scholar] [CrossRef]
  25. Chen, K.; O’Leary, R.A.; Evans, F.H. A simple and parsimonious generalised additive model for predicting wheat yield in a decision support tool. Agric. Syst. 2019, 173, 140–150. [Google Scholar] [CrossRef]
  26. Qi, A.; Murray, P.J.; Richter, G.M. Modelling productivity and resource use efficiency for grassland ecosystems in the UK. Eur. J. Agron. 2017, 89, 148–158. [Google Scholar] [CrossRef]
  27. Albert, M.; Bergez, J.-E.; Couture, S.; Faivre, R.; Willaume, M. Decision-Making Process Factors Explain Some of the Heterogeneity of Irrigation Practices among Maize Farmers in Southwestern France. Water 2021, 13, 3504. [Google Scholar] [CrossRef]
  28. Liang, Y.; Wang, Y.; Zhao, Y.; Lu, Y.; Liu, X. Analysis and Projection of Flood Hazards over China. Water 2019, 11, 1022. [Google Scholar] [CrossRef] [Green Version]
  29. Kundzewicz, Z.W.; Krysanova, V.; Dankers, R.; Hirabayashi, Y.; Kanae, S.; Hattermann, F.F.; Huang, S.K.; Milly, P.C.D.; Stoffel, M.; Driessen, P.; et al. Differences in flood hazard projections in Europe—Their causes and consequences for decision making. Hydrol. Sci. J. 2016, 62, 1–14. [Google Scholar] [CrossRef] [Green Version]
  30. Ronco, P.; Zennaro, F.; Torresan, S.; Critto, A.; Santini, M.; Trabucco, A.; Zollo, A.L.; Galluccio, G.; Marcomini, A. A risk assessment framework for irrigated agriculture under climate change. Adv. Water Resour. 2017, 110, 562–578. [Google Scholar] [CrossRef]
  31. Tubiello, F.N.; Fischer, G. Reducing climate change impacts on agriculture: Global and regional effects of mitigation, 2000–2080. Technol. Forecast. Soc. Chang. 2007, 74, 1030–1056. [Google Scholar] [CrossRef]
  32. Panagos, P.; Ballabio, C.; Himics, M.; Scarpa, S.; Matthews, F.; Bogonos, M.; Poesen, J.; Borrelli, P. Projections of soil loss by water erosion in Europe by 2050. Environ. Sci. Policy 2021, 124, 380–392. [Google Scholar] [CrossRef]
  33. Hempel, S.; Frieler, K.; Warszawski, L.; Schewe, J.; Piontek, F. A trend-preserving bias correction—The ISI-MIP approach. Earth Syst. Dyn. 2013, 4, 219–236. [Google Scholar] [CrossRef] [Green Version]
  34. Rosenzweig, C.; Strzepek, K.M.; Major, D.C.; Iglesias, A.; Yates, D.N.; McCluskey, A.; Hillel, D. Water resources for agriculture in a changing climate: International case studies. Glob. Environ. Chang. 2004, 14, 345–360. [Google Scholar] [CrossRef]
  35. Bennett, R.M.; Jones, P.J. Modelling the impact of BSE policy on agriculture in England and Wales. Land Use Policy 1999, 16, 11–22. [Google Scholar] [CrossRef]
  36. García-Garizábal, I.; Causapé, J.; Abrahao, R.; Merchan, D. Impact of Climate Change on Mediterranean Irrigation Demand: Historical Dynamics of Climate and Future Projections. Water Resour. Manag. 2014, 28, 1449–1462. [Google Scholar] [CrossRef]
  37. Akinfiev, V.; Tsvirkun, A. Decision Support Systems for Stable Development of Agricultural SMEs. IFAC PapersOnLine 2021, 54, 289–292. [Google Scholar] [CrossRef]
  38. Zhilyakov, D.I.; Kharchenko, E.V.; Kandiba, A.A. Labor productivity modeling in the agricultural sector. IOP Conf. Ser. Earth Environ. Sci. 2021, 677, 022073. [Google Scholar] [CrossRef]
  39. Jedruchniewicz, A.; Danilowska, A. Accuracy of economic situation projections in the Polish agriculture. Econ. Sci. Rural Dev. 2016, 42, 228–234. [Google Scholar]
  40. Gorton, M.; Davidova, S.; Banse, M.; Bailey, A. The International Competitiveness of Hungarian Agriculture: Past Performance and Future Projections. Post Communist Econ. 2006, 18, 69–84. [Google Scholar] [CrossRef]
  41. Akidarju, M.S.; Onyemaechi, E.G.; Dauda, M.G. An assessment of some poultry management practices and disease recognition by poultry farmers in Maiduguri arid zone, Nigeria. World’s Poult. Sci. J. 2010, 66, 285–296. [Google Scholar] [CrossRef]
  42. Hoffman, L.A.; Etienne, X.L.; Irwin, S.H.; Colino, E.V.; Toasa, J.I. Forecast performance of WASDE price projections for U.S. corn. Agric. Econ. 2015, 46, 157–171. [Google Scholar] [CrossRef]
  43. Doelman, J.C.; Stehfest, E.; Tabeau, A.; Van Meijl, H.; Lassaletta, L.; Gernaat, D.E.H.J.; Hermans, K.; Harmsen, M.; Daioglou, V.; Biemans, H.; et al. Exploring SSP land-use dynamics using the IMAGE model: Regional and gridded scenarios of land-use change and land-based climate change mitigation. Glob. Environ. Chang. 2018, 48, 119–135. [Google Scholar] [CrossRef] [Green Version]
  44. Daioglou, V.; Stehfest, E.; Wicke, B.; Faaij, A.; van Vuuren, D.P. Projections of the availability and cost of residues from agriculture and forestry. Glob. Change Biol. Bioenegy 2016, 8, 456–470. [Google Scholar] [CrossRef]
  45. Yu, W.; Hertel, T.W.; Preckel, P.V.; Eales, J.S. Projecting world food demand using alternative demand systems. World Bank Econ. Rev. 2004, 18, 205–236. Available online: https://www.gtap.agecon.purdue.edu/resources/download/2873.pdf (accessed on 27 January 2022). [CrossRef] [Green Version]
  46. FAO. The Future of Food and Agriculture—Alternative Pathways to 2050; Summary Version; FAO: Rome, Italy, 2018; 60p, Available online: https://www.fao.org/3/CA1553EN/ca1553en.pdf (accessed on 28 January 2022).
  47. Palazzo, A.; Vervoort, J.M.; Mason-D’Croz, D.; Rutting, L.; Havlík, P.; Islam, S.; Bayala, J.; Valin, H.; Kadi Kadi, H.A.; Thornton, P.; et al. Linking regional stakeholder scenarios and shared socioeconomic pathways: Quantified West African food and climate futures in a global context. Glob. Environ. Chang. 2017, 45, 227–242. [Google Scholar] [CrossRef] [Green Version]
  48. Johansson, A.; Guillemette, Y.; Murtin, F.; Turner, D.; Nicoletti, G.; de la Maisonneuve, C.; Bagnoli, P.; Bousquet, G.; Spinelli, F. Looking to 2060: Long-Term Global Growth Prospects; OECD Economic Policy Papers No.03; OECD: Paris, France, 2012; 30p. [Google Scholar]
  49. Zrakić, M.; Salputra, G.; Levak, V. Potential impact of EU Common Agriculture Policy on Croatian dairy sector—Modelling results. Mljekarstvo 2015, 65, 195–202. [Google Scholar] [CrossRef] [Green Version]
  50. Salputra, G.; Chantreuil, F.; Hanrahan, K.; Donnellan, T.; Van Leeuwen, M. Policy Harmonized Approach for the EU Agri-cultural Sector Modelling. Agric. Food Sci. 2011, 20, 119–130. Available online: https://hal.archives-ouvertes.fr/hal-01462608 (accessed on 27 January 2022). [CrossRef]
  51. Zeverte-Rivza, S.; Nipers, A.; Pilvere, I. Agricultural Production and Market Modelling Approaches. Economic Science for Rural Development. In Proceedings of the International Scientific Conference, Nr. 45: Integrated and Sustainable Regional Development. Marketing and Sustainable Consumption, Jelgava, Latvia, 27–28 April 2017; pp. 267–274. Available online: https://llufb.llu.lv/conference/economic_science_rural/2017/Latvia_ESRD_45_2017-267-274.pdf (accessed on 29 January 2022).
  52. Barreiro-Hurle, J.; Bogonos, M.; Himics, M.; Hristov, J.; Pérez-Domiguez, I.; Sahoo, A.; Salputra, G.; Weiss, F.; Baldoni, E.; Elleby, C. Modelling Environmental and Climate Ambition in the Agricultural Sector with the CAPRI Model. Exploring the Potential Effects of Selected Farm to Fork and Biodiversity Strategies Targets in the Framework of the 2030 Climate Targets and the Post 2020 Common Agricultural Policy; European Commission, Joint Research Centre, Publications Office of the European Union: Luxembourg, 2021; 93p. [Google Scholar] [CrossRef]
  53. Zemkopības Ministrija. Latvijas Lauksaimniecība 2020; Latvijas Republikas Zemkopības Ministrija: Riga, Latvia, 2021; 207p.
  54. Krievina, A.; Pilvere, I.; Nipers, A.; Upite, I. Projections of Organic Livestock Farming in Latvia: Ecology, Economics, Education and Legislation. In Proceedings of the 20th International Multidisciplinary Scientific GeoConference Proceedings SGEM 2020, Albena, Bulgaria, 18–24 August 2020; Bulgarian Academy of Sciences: Sofia, Bulgaria, 2020; Volume 20, pp. 939–946. [Google Scholar] [CrossRef]
  55. Nipers, A.; Pilvere, I.; Krievina, A.; Upite, I. Projections of Organic Crop Farming in Latvia; Ecology, Economics, Education and Legislation. In Proceedings of the 20th International Multidisciplinary Scientific GeoConference Proceedings SGEM 2020, Albena, Bulgaria, 18–24 August 2020; Bulgarian Academy of Sciences: Sofia, Bulgaria, 2020; Volume 20, pp. 931–938. [Google Scholar] [CrossRef]
  56. Pilvere, I.; Nipers, A.; Krievina, A.; Upite, I. Development Prospects of Milk Production in Various Size Farm Groups in Latvia. In Proceedings of the International Scientific Conference, Jelgava, Latvia, 20−22 May 2020; LLU: Jelgava, Latvia, 2020; pp. 754–762. [Google Scholar] [CrossRef]
  57. Nipers, A.; Pilvere, I.; Krievina, A.; Bratka, V. Projecting Investments and Fixed Assets in Angriculture in Latvia. Engineering for Rural Development. In Proceedings of the International Scientific Conference, Jelgava, Latvia, 24−26 May 2019; LLU: Jelgava, Latvia, 2019; pp. 1779–1785. [Google Scholar] [CrossRef]
  58. Nipers, A.; Krieviņa, A.; Pilvere, I. Projecting Productivity in Agriculture in Latvia. Research for Rural Development. In Proceedings of the International Scientific Conference, Jelgava, Latvia, 9–11 May 2018; LLU: Jelgava, Latvia, 2018; Volume 2, pp. 130–137. [Google Scholar] [CrossRef]
  59. Pilvere, I.; Krievina, A.; Nipers, A. Projecting Value Added in Agriculture in Latvia. Engineering for Rural Development. In Proceedings of the International Scientific Conference, Jelgava, Latvia, 9–11 May 2018; LLU: Jelgava, Latvia, 2018; pp. 1084–1090. [Google Scholar]
  60. Nipers, A.; Pilvere, I.; Zeverte-Rivza, S.; Krievina, A. Use of Econometric Model for Developing an Outlook for Livestock Sector in Latvia. Engineering for Rural Development. In Proceedings of the International Scientific Conference, Jelgava, Latvia, 24–26 May 2017; LLU: Jelgava, Latvia, 2017; pp. 874–883. [Google Scholar] [CrossRef]
  61. Nipers, A.; Pilvere, I.; Zeverte-Rivza, S.; Upite, I.; Krievina, A. Projections for Latvian Cereal Sector. Ecology, Economics, Education and Legislation. In Proceedings of the International Multidisciplinary Scientific GeoConference-SGEM Proceedings, Vienna, Austria, 27–29 November 2017; Bulgarian Academy of Sciences: Sofia, Bulgaria, 2017; pp. 1170–1176. [Google Scholar] [CrossRef]
  62. Latvia University of Life Sciences and Technology. Zinātniskā Pētījuma “Lauksaimniecības Attīstības Prognozēšana un Politikas Scenāriju Izstrāde līdz 2050. Gadam” Projekta Atskaite; Latvia University of Life Sciences and Technology: Jelgava, Latvia, 2021; 165p. Available online: http://petijumi.mk.gov.lv/sites/default/files/title_file/Lauksaimniecibas_attistibas_prognozesana_un_politikas_scenariju_izstrade_lidz_2050_gadam_PETIJUMS_0.pdf (accessed on 22 January 2022).
  63. IPCC. Overview: 2019 Refinement to the 2006 IPCC Guidelines for National Greenhouse Gas Inventories; Gómez, D., Irving, W., Eds.; IPCC: Geneva, Switzerland, 2019; 15p. [Google Scholar]
  64. FAO. The State of Food and Agriculture 2021: Making Agrifood Systems More Resilient to Shocks and Stresses; FAO: Rome, Italy, 2021; 182p, Available online: https://www.fao.org/3/cb4476en/cb4476en.pdf (accessed on 4 February 2022).
  65. Kobylinska, M. Spatial Diversity of Organic Farming in Poland. Sustainability 2021, 13, 9335. [Google Scholar] [CrossRef]
  66. Badgley, C.; Moghtader, J.; Quintero, E.; Zakem, E.; Chappell, M.J.; Avilés-Vázquez, K.; Perfecto, I. Organic agriculture and the global food supply. Renew. Agric. Food Syst. 2007, 22, 86–108. [Google Scholar] [CrossRef]
  67. European Commission. Factsheet: From Farm to Fork: Our Food, Our Health, Our Planet, Our Future. 20 May 2020. Available online: https://ec.europa.eu/commission/presscorner/detail/en/fs_20_908 (accessed on 8 February 2022).
  68. Wajid, A.; Hussain, K.; Ilyas, A.; Habib-ur-Rahman, M.; Shakil, Q.; Hoogenboom, G. Crop Models: Important Tools in Decision Support System to Manage Wheat Production under Vulnerable Environments. Agriculture 2021, 11, 1166. [Google Scholar] [CrossRef]
  69. Liu, T.; Bruins, R.J.F.; Heberling, M.T. Factors Influencing Farmers’ Adoption of Best Management Practices: A Review and Synthesis. Sustainability 2018, 10, 432. [Google Scholar] [CrossRef] [PubMed] [Green Version]
  70. Bórawski, P.; Guth, M.; Bełdycka-Bórawska, A.; Jankowski, K.J.; Parzonko, A.; Dunn, J.W. Investments in polish agriculture: How production factors shape conditions for environmental protection? Sustainability 2020, 12, 8160. [Google Scholar] [CrossRef]
  71. Colomb, V.; Bernoux, M.; Bockel, L.; Chotte, J.L.; Martin, S.; Martin-Phipps, C.; Mousset, J.; Tinlot, M.; Touchemoulin, O. Review of GHG Calculators in Agriculture and Forestry Sector. A Guideline for Appropriate Choice and Use of Landscape Based Tools. Version 2.0. June 2012. Available online: https://www.fao.org/fileadmin/templates/ex_act/pdf/Review_existingGHGtool_GB.pdf (accessed on 15 February 2022).
  72. World Bank. Carbon Sequestration in Agricultural Soils; Report No. 67395-GLB; World Bank: Washington, DC, USA, 2012; 118p, License: CC BY 3.0 IGO; Available online: https://openknowledge.worldbank.org/handle/10986/11868 (accessed on 19 February 2022).
  73. Mattila, T.J.; Hagelberg, E.; Söderlund, S.; Joona, J. How farmers approach soil carbon sequestration? Lessons learned from 105 carbon-farming plans. Soil Tillage Res. 2022, 215, 105204. [Google Scholar] [CrossRef]
  74. Lemus, R.; Lal, R. Bioenergy Crops and Carbon Sequestration. Crit. Rev. Plant Sci. 2005, 24, 365–384. [Google Scholar] [CrossRef]
Figure 1. General overview of the LASAM model structure.
Agriculture 12 00705 g001
Figure 2. Architecture of the interactive WEB application of the LASAM model.
Agriculture 12 00705 g002
Figure 3. Publicly available LASAM model, in Latvian (example).
Agriculture 12 00705 g003
Figure 4. Publicly available LASAM model, in English (example).
Agriculture 12 00705 g004
Figure 5. Utilized agricultural area in 2000–2020, with a 2021–2050 projection for Latvia, in thousands of hectares [62].
Agriculture 12 00705 g005
Figure 6. Arable land in 2000–2020, with a 2021–2050 projection for Latvia, in thousands of hectares [62].
Agriculture 12 00705 g006
Figure 7. Cereal area in 2000–2020, with a 2021–2050 projection for Latvia, in thousands of hectares [62].
Agriculture 12 00705 g007
Figure 8. Rapeseed area land in 2000–2020, with a 2021–2050 projection for Latvia, in thousands of hectares [62].
Agriculture 12 00705 g008
Figure 9. Wheat area in 2000–2020, with a 2021–2050 projection for Latvia, in thousands of hectares [62].
Agriculture 12 00705 g009
Figure 10. Wheat production in Latvia, in 2000–2020, with a projection for 2021–2050, thousands of tons [62].
Agriculture 12 00705 g010
Figure 11. Number of dairy cows in Latvia in 2000–2020, with a projection for 2021–2050, thousands [62].
Agriculture 12 00705 g011
Figure 12. Milk production in Latvia in 2000–2020, with a projection for 2021–2050, in thousands of tons [62].
Agriculture 12 00705 g012
Figure 13. Number of suckler cows in Latvia in 2000–2020, with a projection for 2021–2050, thousands [62].
Agriculture 12 00705 g013
Figure 14. Number of sheep in Latvia in 2000–2020, with a projection for 2021–2050, thousands [62].
Agriculture 12 00705 g014
Figure 15. Number of swine in Latvia in 2000–2020, with a projection for 2021–2050, thousands [62].
Agriculture 12 00705 g015
Figure 16. Number of poultry in Latvia in 2000–2020, with a projection for 2021–2050, thousands [62].
Agriculture 12 00705 g016
Figure 17. Utilized agricultural area in organic farming in 2005–2020, with a 2021–2050 projection for Latvia, in thousands of hectares [62].
Agriculture 12 00705 g017
Figure 18. Arable land in organic farming in 2005–2020, with a 2021–2050 projection for Latvia, in thousands of hectares [62].
Agriculture 12 00705 g018
Figure 19. Number of animals in organic farming in Latvia in 2010–2020, with a projection for 2021–2050, thousands [62].
Agriculture 12 00705 g019aAgriculture 12 00705 g019b
Figure 20. Value added in the main sectors of agriculture in 2005–2019, and a 2020–2050 projection for Latvia, in millions of EUR [62].
Agriculture 12 00705 g020
Figure 21. Number of persons employed in agriculture in 2005–2020, and a 2021–2050 projection for Latvia, thousands [62].
Agriculture 12 00705 g021
Figure 22. Value added per employed in specialized field crop farms in 2005–2019, and a 2020–2050 projection for Latvia, in thousands of EUR [62].
Agriculture 12 00705 g022
Figure 23. Value added per employed in specialized dairy farms in 2005–2019, and a 2020–2050 projection for Latvia, in thousands of EUR [62].
Agriculture 12 00705 g023
Figure 24. GHG emissions in Latvia in 2010–2020, with a projection for 2021–2050, thousands of tons CO2 equivalent [62].
Agriculture 12 00705 g024
Figure 25. GHG emissions from agricultural soil management in Latvia in 2010–2020, with a projection for 2021–2050, thousands of tons CO2 equivalent [62].
Agriculture 12 00705 g025
Publisher’s Note: MDPI stays neutral with regard to jurisdictional claims in published maps and institutional affiliations.

