Article

Impact of Population Aging and Renewable Energy Consumption on Agricultural Green Total Factor Productivity in Rural China: Evidence from Panel VAR Approach

College of Economics, Sichuan Agricultural University, Chengdu 611130, China
*
Author to whom correspondence should be addressed.
Submission received: 7 April 2022 / Revised: 13 May 2022 / Accepted: 15 May 2022 / Published: 18 May 2022
(This article belongs to the Special Issue Ecological Restoration and Rural Economic Development)

Abstract

:
China is moving toward the important goal of being a green and low-carbon country, and the current severity level of population aging is of particular concern to the government. Aging, renewable energy consumption, and technological progress are closely linked. In this research, a panel vector autoregressive (PVAR) model is employed to investigate the long-run equilibrium relationship between population aging, renewable energy consumption and agricultural green total factor productivity using panel data for 30 Chinese provinces (cities) from 2000 to 2019. The findings reveal that, in the long run, both population aging and renewable energy use have considerable positive impacts on agricultural green total factor productivity. In addition, in order to more intuitively understand the impact of population aging and renewable energy consumption on agricultural green total factor productivity, the analysis adopts the impulse response function and variance decomposition. The contributions of population aging and renewable energy consumption to agricultural green total factor productivity are 2.23% and 0.56%, respectively, when the lag period is chosen to be 15, which implies that population aging and renewable energy use will continuously contribute to agricultural green total factor productivity. The study results have significant theoretical implications for understanding China’s aging population structure and current renewable energy use. Given the above results, this study puts forward countermeasures and suggestions from four aspects: improving agricultural infrastructure, increasing agricultural technology investment, increasing the stock of agricultural human capital and strengthening international cooperation.

1. Introduction

As an essential power source for national economic development, agriculture has received significant attention from the Party and the State. In order to achieve sustainable growth in agricultural output, China has been increasing its investment in agricultural research over the past two decades. Public agricultural research investment exceeded that of the United States for the first time in 2009 [1]. As of 2017, China’s total agricultural inputs have accumulated 1102.4 billion. The increasing number of inputs in the agricultural sector has also made it easier for farmers to access water, electricity, farm machinery, etc. According to the National Bureau of Statistics 2020 statistics, the power generation capacity of rural hydropower stations was 2,423,689 million kilowatt-hours, the number of small tractors nationwide reached 1.72 million units, and the national crop mechanization rate reached more than 70%. However, the extensive use of agrochemicals in agricultural production has caused severe environmental pollution, posing a threat to agricultural products and rural environmental safety. The Second National Pollution Source Census indicates that one of the environmental pollution sources within China is agricultural pollution sources. Data in the China Ecological and Environmental Status Bulletin 2020 also show that the utilization rate of chemical fertilizers for the three major food crops of rice, wheat and corn in 2020 was 40.2%, the utilization rate of pesticides was 40.6%, and the total utilization rate of livestock and poultry manure was only 75%. Therefore, agricultural development should ensure the balance of the supply and demand of agricultural products under the rigid constraint of resources and fully consider the carrying capacity of resources and environmental protection issues. It has been discovered that agricultural green development is the key to solving China’s agricultural resource and environmental concerns [2]. Increasing green total factor productivity in agriculture is an efficient method of achieving green agricultural development [3,4]. In China, the contribution of agricultural green total factor productivity to agricultural output is as high as 60%, and it plays a vital role in ensuring China’s food security and contributing to high-quality agricultural development [5].
China has made amazing gains in economic development since the reform and opening up, becoming the world’s second-largest economy and contributing more than 30% to the global economy for several years in a row. The “demographic dividend” is without a doubt one of the most important elements driving China’s fast economic expansion. The “demographic dividend” is rapidly disappearing. According to the definition of the World Health Organization (WHO), if the proportion of older individuals over the age of 60 exceeds 10% of the total population or if the proportion of older persons over the age of 65 reaches 7%, a country or territory has become an aging society. According to the information from the fifth national census in 2000, the proportion of the elderly population over sixty years old in China was 10.93%. Taking this as the standard, China has been an aging society since 2000. In recent years, population aging in China has been intensifying, and this indicator has continued to climb. As of the seventh census in 2021, China’s old population has surpassed 264 million people, accounting for 18.7% of the total population. Population aging will bring about a shrinkage in the total population and labor force, which will lead to potential socioeconomic problems, such as a decrease in the economic growth rate [6].
The increase in the proportion of the aging population will also have an impact on the demographic structure, and the change in demographic structure will affect a variety of economic conditions. At the same time, economic development cannot be separated from energy consumption [7], and as a major player in the world electricity market, China’s electricity consumption has been in the forefront of the world [8]. According to statistics, China overtook the United States to become the world’s top electricity consumer in 2011. According to resource allocation theory, there is a mutual substitution relationship between agricultural labor and agricultural machinery. Agricultural machinery will be underutilized if too much labor is invested in agricultural production. In the process of effective resource allocation from labor-intensive to agricultural capital and energy-intensive production, its energy consumption (electricity consumption) will generally increase significantly [9]. Along with the shift in the type of resource use and the rise in people’s income levels, the energy consumption intensity gradually changes from the initial rising state to a declining state [10]. As China’s economy enters into a new normal, the population development and residents’ lifestyles are also changing dramatically, and China’s population structure is aging and gradually developing in depth. In contrast, the increasing aging population will weaken the agricultural labor supply. On the other hand, the increasing aging population will also force the upgrading of agricultural technology, which will gradually replace the traditional crude production methods. Agricultural technical efficiency and agricultural technological progress have jointly promoted agricultural green total factor productivity.
China is currently in the midst of a period of rapid economic growth. It is vital to boost agricultural green total factor productivity in order to speed the building of the development path of agricultural modernization. China has clearly recommended to “increase total factor productivity”, concentrating on the agricultural sector to enhance agricultural green total factor productivity, focus on rural ecological conservation and promote agricultural modernization in the report of the 19th National Congress of China. Based on this, our paper selects the provincial panel facts of China from 2000 to 2019 to examine the long-term relationship between population aging, renewable energy consumption and agricultural green factor productivity. The marginal contributions of this paper may be reflected in the following aspects. First, based on provincial data, this paper investigates the effects of population aging and renewable energy consumption on agricultural green total factor productivity in each province of China. The aging population is one of the most prominent issues facing China in the new era, while agriculture is the foundation of the nation. Exploring their relationship is of great practical significance for promoting agricultural production and realizing rural revitalization. Second, this paper addresses the causality test between population aging, renewable energy consumption and agricultural green total factor productivity, which deepens the understanding of the long-term effects of population aging and agricultural electricity use on agricultural green total factor productivity. Finally, this paper can enrich the theoretical study of population aging and renewable energy consumption and provide a reference basis for the government to formulate policies to improve agricultural green total factor productivity.
The rest of the paper is organized as follows. The second part presents the literature review, the third part describes the methodology used, the fourth part contains the analysis and discussion of the empirical results, and the fifth part contains the conclusion and policy recommendations. References are given at the end of the paper.

2. Literature Review

Total factor productivity (TFP) refers to the additional production efficiency achieved under the condition of a given level of inputs of various factors of production. Not only can it be used to explore the sources of economic growth, but it is also often used as a measure of scientific and technological progress [11]. Unlike traditional total factor productivity, green total factor productivity (AGTFP) in agriculture is a more accurate indicator of production efficiency that includes resource and environmental pollution constraints [12,13,14]. Existing research suggests that green total factor productivity growth in agriculture largely depends on advances in agricultural technology [15,16]. Technological progress has become a significant driver of agricultural output. Human capital is undoubtedly direct among the various factors influencing technological progress [17]. According to the life cycle theory of human capital stock, the human capital stock of the agricultural labor force shows an “inverted U-shaped” change [18,19]. The highly educated labor force is likely to be attracted to areas with higher levels of economic development. Studies have shown that human capital not only enhances the ability of a country or region to develop its technological innovation but also indirectly drives the innovation capacity of other regions that have adopted the technology [20]; Nelson and Phelps [21] proposed that the stock of human capital has a positive impact on the dissemination of innovative technologies. Romer [22] believes that the stock of human capital plays a decisive role in technological growth. In other words, the larger the stock of human capital, the faster the absorptive capacity and diffusion speed of technological innovation. Ang et al. [17] showed that the degree of influence of human capital on technological innovation and diffusion is different if a country has a low level of human capital. Then, after the introduction of high-tech products, immature human capital is more suitable for imitating the application of new technologies due to the lack of a technology-receptive population, while experienced human capital is more suitable for the innovation of technology.
As the aging of the population accelerates, many issues are becoming more prominent. At present, there is no unified educational conclusion about the impact of population aging on human capital. Overall, the influence of the populace getting old on human capital can be divided into three primary perspectives. The first view is that population aging has a depressive effect on human capital. Choi and Shin [23] explored the impact of population aging on human capital through an OLG model, suggesting that population aging reduces the labor supply, thus significantly weakening the growth potential of the capital stock and becoming a potential threat to economic growth. Bairoliya and Miller [24] conducted a study on demographic changes in China. They found that population aging leads to favorable fertility policies by the government, while an increase in fertility leads to a slight decrease in per capita income and human capital investment. A 1% increase in the share of the populace over the age of 65 is associated with a 0.3% decrease in per capita education expenditure, which has a dampening effect on average educational attainment. Khor et al. [25] studied the stock of human capital in China. They noted that although the amount of human capital in China is increasing, it is still low compared to other middle-income-level countries. Increasing aging leads to a decline in the labor force population, and a shortage of human capital in the age-appropriate labor force can lead to a stagnation of the country’s economic development. The second view is that the aging of the population can promote human capital. Some scholars have studied the relationship between aging and human capital investment, stating that aging promotes increased opportunities for human capital investment, thereby reducing the dampening effect of aging on per capita output [26]. It has also been shown that population aging increases the productive capacity and significantly reduces the economic cost, thereby creating incentives for human capital investment through the overlap of generations (OLG) model [27]. In the early stages of aging, a higher share of the middle-aged population will provide society with a large amount of skilled labor, which will reduce the demand for young labor, while the current high level of aging will provide more skilled labor for the future, thus increasing the productive capacity of society and reducing the cost of aging. Čiutienė and Railaitė [28] argue that population aging will shift social attitudes, thus making young people more education-oriented. The aging population can make fuller use of their experience and contribute to deepening human capital. Other arguments propose that the impact of the populace getting older on human capital is complex. Zhang et al. [29] used an overlapping generations model based on imperfect public education and pension systems and found a hump-shaped relationship between population aging and human capital investment. When aging is high, most people tend to reduce public human capital investment by lowering tax rates, resulting in a trend where human capital investment initially rises and slowly declines over time. Gradstein et al. [30] also found that population aging has a mixed effect on human capital investment and is not a simple monotonic curve.
Renewable energy consumption is also one of the essential factors influencing the total green factor in agriculture. Established studies have analyzed the relationship between renewable energy consumption and human capital, indirectly demonstrating the correlation between renewable energy consumption and green total factors in agriculture. Ozcan et al. [31] analyzed the dynamic impact of renewable energy consumption in Turkey using panel data, and the results showed a significant positive relationship between renewable energy consumption and human capital stock. Alvarado et al. [32] found through their study that human capital reduces the consumption of non-renewable energy. This finding is in line with Yao et al. [33], whose findings indicate that human capital promotes the use of renewable energy. The relationship between population aging and renewable energy consumption is not uniformly answered by academia. Bano et al. [34] found through a study of BRICS countries that population aging is one of the positive factors that promote renewable energy consumption. Zhang et al. [35], through a study of China’s aging population, point out that there are significant differences in energy consumption habits between older and younger people, but overall, both have a positive impact on renewable energy consumption. On the other hand, in a study by Willis et al. [36], it was found that older people are less receptive to renewable energy and are less likely to adopt renewable energy compared to younger people. Tarazkar et al. [37] obtained the same conclusion by studying how young people contribute more to renewable energy consumption than older people.
By combing the literature, we found that the definition of green total factor productivity in agriculture is more relevant, and it is mainly influenced by technological progress [15,16]. Among the many factors that influence technological progress, human capital is, again, the most direct factor [
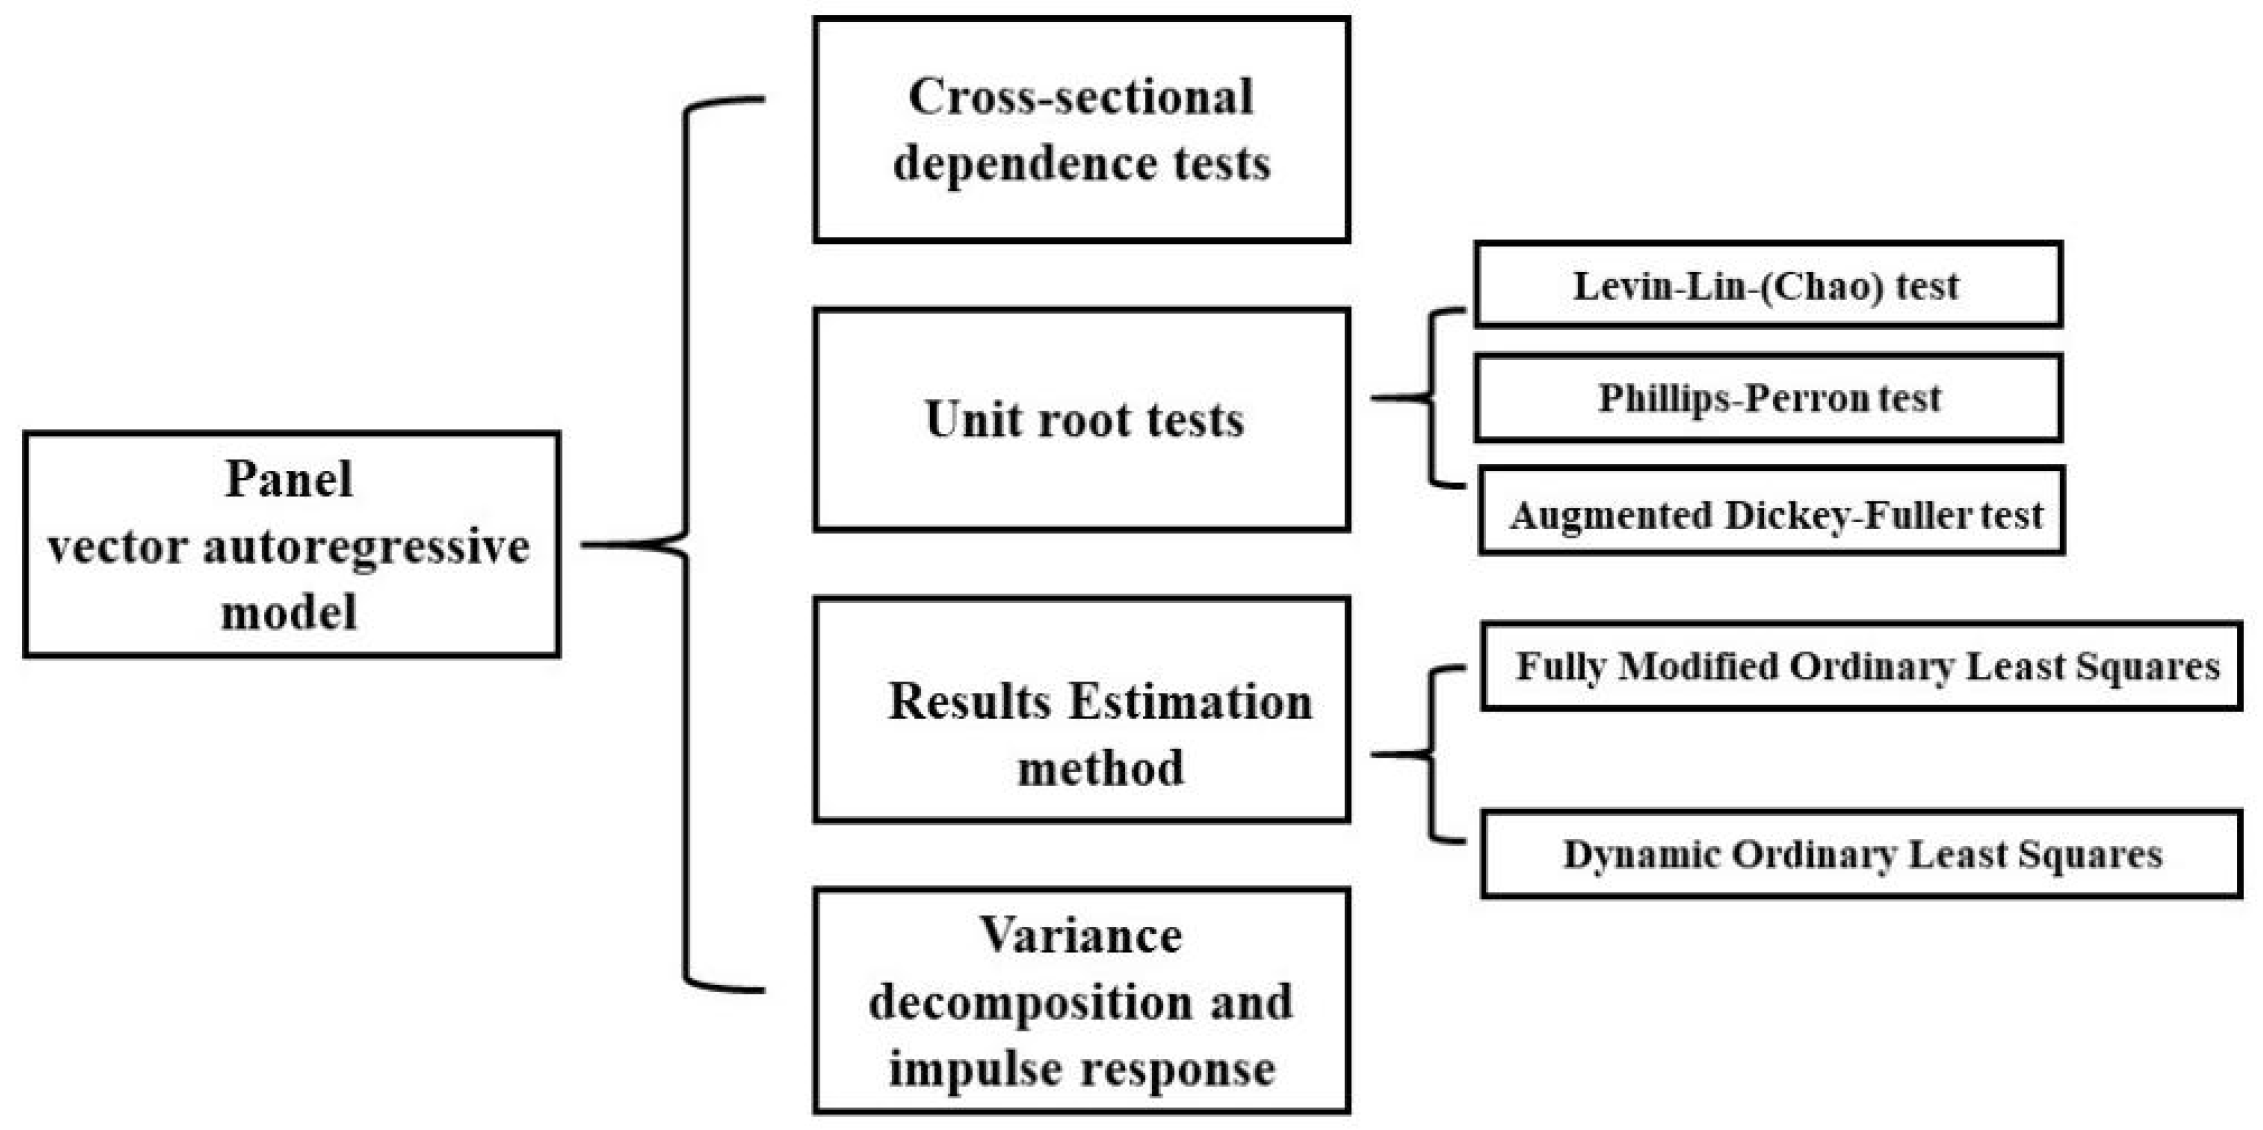
17]. Most scholars have indirectly demonstrated the impact that these factors bring to green total factor productivity in agriculture by verifying the relevant factors that affect human capital. However, when discussing population aging and renewable energy consumption, there is no uniform academic proof of its unidirectional relationship with human capital. As far as the method is concerned, the accuracy and reliability of the obtained estimation results are low. In contrast, few scholars have directly discussed the effects of population aging and renewable energy on green total factor productivity in agriculture. Based on the above gaps, this paper uses provincial panel data from 2000 to 2019 in China to test the relationship between population aging, renewable energy consumption and green total factor productivity in agriculture using vector autoregressive (VAR) models to provide a reference for the government to formulate relevant policies to enhance green total factor productivity in agriculture.

3. Method

3.1. Model Specification

Sims [38] first used a vector autoregressive (VAR) model to analyze the dynamic relationships among multiple variables The model assumes that all variables are endogenous, and the endogenous variables regress the lags of all endogenous variables in the model to test the dynamic relationships among all variables. Holtz-Eakin et al. [39] extended the vector autoregressive model to make a perfect combination of panel data and time series models, making it a powerful analytical tool for macro-dynamics research. In order to examine renewable energy consumption, population aging and agricultural green total factor productivity in the same framework, this paper constructs a suitable PVAR model based on the traditional vector autoregressive model. The expressions are:
Y i ,   t = α t + π 1 Y i ,   t 1 + π 2 Y i ,   t 2 + π p Y i ,   t p + β i + μ i ,   t
where, Y i ,   t represents a column vector containing three variables: Lnagtfp, Lnaging and Lnelectricity. AGTFP represents agricultural green total factor productivity, aging represents population aging, and electricity represents renewable energy consumption; i and t denote region and time; P represents the lag order of the model; μ i ,   t represents the random interference term, which is assumed to obey the normal distribution. The specific approach used in the model is shown in the following figure (Figure 1):

3.2. Cross-Sectional Dependence Tests

In previous studies [40,41], the panel unit root test and panel stationarity test assumed that each cross-section was independent of each other, but the actual situation was that this assumption had certain limitations [42]. Under the circumstance of correlation between cross-sections, the results of the panel check are significantly distorted. Therefore, the cross-section correlation test is the main part of the panel test. Breusch proposed the Breusch–Pagan LM Test Method to test the cross-sectional correlation in 1980. Pesaran [43] elevated this method and proposed the Pesaran CD and standardized La Grange multiplier (LM) test. Next, we use the above three methods to test. The Breusch–Pagan LM Test formula is as follows:
L M = i = 1 N 1 j = i + 1 N T i j μ i j 2 χ 2 ( N ( N 1 ) / 2 )
When the sample size is relatively small, N and T are applicable to Equation (2). With the further increment of N, the result will be gradually distorted, and the greater the N, the lower the reliability of the result reflected by the LM. Finally, this test method is not applicable to samples with large sizes. Pasaran improved the disadvantages of the above method and proposed a new method for cross-section inspection of giant pattern N and variable fixed time T. The formula is as follows:
L M = 1 N ( N 1 ) i = 1 N 1 j = i + 1 N ( T i j μ i j 2 1 ) N ( 0 , 1 )
C D = 2 N ( N 1 ) i = 1 N 1 j = i + 1 N T i j μ i j 2 N ( 0 , 1 )
In Formula (4), μ i j 2 is the correlation coefficient of the residual, and the specific calculation formula is as follows:
μ i j = μ i j = t 1 T ε i j ε j i ( t 1 T ε i j 2 ) 1 2 ( t 1 T ε j t 2 ) 1 / 2
where   ε i j and ε j i are standard errors.

3.3. Unit Root Test

3.3.1. Levin–Lin–(Chao) Test

The LLC [40] test is a common left unilateral test. In principle, the LLC test method adopts the form of an ADF test. The improved formula of LLC inspection based on ADF inspection is as follows:
Δ y i t = ρ y i   t 1 + j = 1 k i γ i j Δ y i   t j + Z i t + ε i t ,   i = 1 , 2 , , N ; t = 1 , 2 , , T
However, standardized proxy variables are affected by Δ y i t and y i t . Specifically, they can affect it in the following two ways:
(1) estimate proxy variables. After determining the number of additional items, K, the following two regression equations can be established:
Δ y i t = j = 1 k i γ ^ i   j Δ y i   t j Z i t ^ + ε ^ i t ,   Δ y i   t 1 = j = 1 k i γ ˜ i   j Δ y i   t j + Z i t ˜ + ε ˜ i t 1
transposition of terms:
ε ˜ i t = Δ y i t j = 1 k i γ ^ i   j Δ y i   t j Z i t ^ ,   ε ˜ i t 1 = Δ y i t j = 1 k i γ ˜ i j Δ y i   t j Z i t ˜
Standardize ε ˜ i t and ε ˜ i t 1 :
ε ˜ i j * = ε ^ i t / s i ,   ε ˜ i j * = ε ˜ i t 1 / s i
s i (i = 1, 2, …, N) represents the standard deviation of the regression residuals of each variable. In this way, the proxy variables ε ^ i j * , ε ˜ i j * , Δ y i t and   Δ y i t 1 can be obtained.
(2) Using the surrogate variables ε ^ i j * and ε ˜ i j * , the following regression analysis can be carried out:
ε ^ i j * = ρ ε ˜ i j * + v i t
In addition, LLC also shows that the following t ˜ p , the estimator ρ ^ correction statistic, is getting closer and closer to the standard normal distribution.
t ˜ p ^ = t p ^ ( N T ˜ ) S N σ ^ 2 s ( ρ ^ ) μ m T ˜ * σ m T ˜ * N ( 0 , 1 )
where t p ^ represents the standard t statistic and N represents the interface capacity; T ˜ = T ( i k i / N ) 1 (T is the individual capacity); S N refers to the average value of the ratio of the long-term standard deviation and information standard deviation of each individual in the data sample; σ ^ 2 represents the variance of error item, v i t , and S ( ρ ) refers to ρ . In addition, μ m T ˜ and σ m T ˜ represent the adjustment terms of the mean and standard deviation, respectively.

3.3.2. Augmented Dickey–Fuller (ADF) Test

Choi [44] proposed a combined p i test statistic based on Fisher’s principle to test in different root cases (Fisher ADF). First, each individual is tested by ADF. The ADF-Fisher statistic is constructed by summing the probabilities, p i , corresponding to the ADF statistic. Under the original assumption, assume H 0 is the root of the existing unit:
D F F i s h e r = 2 i = 1 N l o g ( p i ) χ 2 ( 2 N )

3.3.3. Phillips–Perron Test

Phillips and Perron use σ 2 and σ s 2 to modify the nonparametric of the estimated value of the t statistic in the ADF test [45,46]. The improved formula is as follows:
Z ( τ ) = τ ( σ ^ 2 / σ ^ S l 2 ) ( 1 / 2 ) ( σ ^ S l 2 σ ^ 2 ) T σ ^ S l 2 t = 2 T ( x t 1 x ¯ T 1 ) 2
where σ ^ 2 represents the unconditional variance sample estimator of σ 2 . The formula is as follows:
σ ^ 2 = T 1 t = 1 T ε ^ t 2
We assume that the lag order of { ε t } significant autocorrelation can be taken as 1, where σ ^ S l 2 represents the estimated value of conditional variance sample σ ^ S 2 :
σ ^ S l 2 = T 1 t = 1 l ε ^ t 2 + 2 T 1 j = 1 t j ( l ) t = j + 1 T ε ^ t ε ^ t j
In the formula j   ( l ) = 1 1 l 1 , this weight guarantees σ ^ S l 2 to be positive.
x ¯ T 1 = 1 T 1 t = 1 T 1 x t

3.3.4. Panel Cointegration Test

We use the residual-based totally ADF test (also known as the Kao test) to modify the panel cointegration test. In the panel regression model, y i t = x i t β + z i t γ + e i t , e i t represents a non-cointegration I (1) process. Kao [47] used DF and ADF methods to check the null hypothesis of no cointegration. For the ADF test, Kao proposed the following regression equation:
e ^ i t = ρ e ^ i , t 1 + j = 1 p θ j Δ e ^ i , t j + v i t p
In addition, we also constructed ADF statistics without a cointegration null hypothesis:
A D F = t A D F + 6 N σ ^ v 2 σ ^ 0 v σ ^ 0 v 2 2 σ ^ v 2 + 3 σ ^ v 2 10 σ ^ 0 v 2
Among them, σ ^ σ v 2 = y y y x x x 1 , σ ^ 0 v 2 = Ω ^ y y Ω ^ y x Ω ^ x x 1 .

3.3.5. Fully Modified Ordinary Least Squares (FMOLS) and Dynamic Ordinary Least Squares (DOLS)

OLS regression can yield consistent estimates of the cointegration parameters [48]. However, since OLS tests ignore short-term dynamic effects, they may lead to large biases [49], and the fact that such distributions are nonstandard is also subject to perturbation terms, making the test results invalid and making statistical inference difficult. Therefore, Phillips and Hansen [50] proposed a nonparametric correction for OLS estimation, the so-called FMOLS estimation, while the DOLS estimation also has the above correction effect [51,52]. Moreover, we can find that both FMOLS and DOL are interdimensional group average estimators.
This technique can explain the troubles of sequence correlation and endogenous explanatory variables in finding long-term relationships. When processing the panel data of the region i = 1, 2, …, N and time t = 1, 2, …, M, we can use the following cointegration equation:
Y i t = α i t + β X i t + ε i t X i t = X i t 1 + ε i t
Z i t = ( Y i t , X i t ) ~ I ( 1 ) and ω i t = ( ε i t , μ i t ) ~ I ( 0 ) with long-run covariance matrix Ω i = L i L i . L i is the lower triangular decomposition of Ω i , which can also be decomposed as Ω i = Ω 0 + Γ i + Γ i . Ω 0 is the weighted sum of the covariance in the same period, and Γ i is the weighted sum of the self variance.
The panel FMOLS estimator for the coefficient β is shown below:
β N T * = N 1 i = 1 N ( i = 1 T ( X i t X ¯ i ) 2 ) 1 ( i = 1 T ( X i t X ¯ i ) Y i t * T τ i ^ Y i t * = ( Y i t Y i ¯ ) L 21 i ^ L 22 i ^ Δ X i t ,   τ i ^ Γ 21 i ^ + Ω 21 i 0 ^ L 21 i ^ L 22 i ^ ( Γ 22 i ^ + Ω 22 i 0 ^ )
The DOLS is written as follows:
Y i t = α i + β i X i t + j = j i j l θ i j Δ X i t j + ε i t *
where the estimated coefficient, β , is given by:
β d o l s * = N 1 i = 1 N ( t = 1 T Z i t Z i t i ) 1 ( t = 1 T Z i t Y i t * )
where Z i t = ( X i t X i ¯ , Δ X i t j , , Δ X i t + k ) is a 2 ( K + 1 ) vector of regressors.

3.3.6. Variance Decomposition and Impulse Response Method

We used variance decomposition and impulse response evaluation to examine the impacts of a number of elements on variables. At the same time, the responses of endogenous variables to themselves and other endogenous variables were also tested. In the VAR model, a change in variables indicates that the endogenous variables are disturbed (called a “pulse”), that is, their error changes. The impact of error alternating on itself and other endogenous variables is called the response of endogenous variables. Through the image analysis of the impulse response function, the time delay and intensity change of each variable to the fluctuation transmission effect of the dependent variable can be effectively reflected. Through the above analysis, the VAR model can be transformed into [53]:
y t = j = 0 p ϕ i y t i + ε t
In the above formula, ε t represents the independent identically distributed error term with a zero mean and covariance matrix. ϕ i is a simple impulse response function. ϕ i can be converted to the average value of the infinite vector translation according to the following formula [54].
ϕ i = { I k , i = 0 j = 1 i ϕ t j A j , i = 1 , 2 ,
I k and A j are the identity element of the companion matrix and the coefficient matrix of the VAR transformed into the infinity VMA form, respectively.
In the original function, assuming weak stationarity, y t obtains an infinite moving average representation:
y t = j = 0 A j ε t j
The lag interval selected in this paper is 15.

4. Results

4.1. Cross-Section Correlation and Unit Root Test Results

The outcomes of the cross-sectional correlation test in Table 1 definitely exhibit the existence of cross-sectional dependence among the three variables. We chose three different test methods (LLC, ADF and P.P.) to further test the cross-sectional correlation, and the results are shown in Table 2. Through these three test methods, we found that at 1%, only lnelectricity can reject the original hypothesis of unit root, and the other variables failed to reject the original hypothesis. However, after the first-order difference processing, all variables rejected the initial hypothesis at 1%. This indicates that there may be pseudo-regression, and a further cointegration test is needed. Therefore, we used Kao’s residual panel cointegration check (ADF) to affirm whether a long-term cointegration relationship between variables exists.

4.2. Kao’s Residual Panel Cointegration Test (ADF) Results

Table 3 shows the results of the Kao’s residual panel cointegration test (ADF). We found that the value of 0.0039 was far less than the critical value of 0.01, so we rejected the initial hypothesis that there is at least one cointegration relationship.

4.3. Long-Run and Short-Run Estimates

Table 4 shows the coefficients of the regression equation (The sketch is shown in Figure 2), the standard error of the regression coefficient and its significance probability. The long-term equilibrium coefficient shows the long-term impact between variables, and the short-term parameter estimation shows the short-term dynamic mechanism between variables. Population aging has only a short-term hindering effect on agricultural green total factor productivity. In the long run, the increase in the proportion of aging will inevitably lead to an improvement in agricultural green total factor productivity. This is consistent with the findings of Vandenbussche et al. [55,56,57]. The increase in population aging promotes the generation of knowledge “spillovers” that increase individual productivity and regional productivity as well as the upgrading of the industrial infrastructure structure, resulting in an increase in green total factor productivity in agriculture.

4.4. Robustness Tests

The estimation outcomes of DOLS and FMOLS are given in Table 5 (The process sketch is shown in Figure 3). In the long run, both population aging and renewable energy consumption have optimistic impacts on green total factor productivity in agriculture, and both have significant positive effects at the 1% level. Specifically, under the DOLS method, when population aging increases by 1%, agricultural green total factor productivity increases by about 0.34%, the renewable energy consumption index increases by 1% and the agricultural green total factor productivity index increases by about 0.06%. Under the FMOLS approach, each 1% increase in population aging increases agricultural green total factor productivity by about 0.45%, while each 1% increase in the renewable energy consumption index increases agricultural green total factor productivity by about 0.09%. In terms of parameter significance, the fit of FMOLS is good. This result coincides with Čiutienė et al. [28], who found that population aging can significantly contribute to the growth of green total factor productivity in agriculture. The possible reason for this is that aging provides society with a large pool of skilled labor and a deepening of the stock of human capital, conditions that accumulate to increase agricultural green total factor productivity [26,27,28].

4.5. Stability of the Panel VAR Model

This study constructed a VAR model of population aging, renewable energy consumption and agricultural green total factor productivity. The test found that when the data lag was 15, it was the best index. In the causal check, it was found that there is a one-way or two-way causal relationship between the above three variables. Because the three variables are endogenous variables, we subsequently examined the stationarity of the VAR model, and the consequences are shown in Figure 4. By watching the inverse root of the AR attribute polynomial, we found that all points are in the circle, indicating that the VAR model is stable. The variance decomposition and impulse response outcomes based totally on the VAR model are described in detail in Section 4.6 of this paper.

4.6. Variance Decomposition and Impulse Response Analysis Results

We used the variance decomposition and impulse response analysis methods proposed by Lanne [53] to obtain the magnitude of the effects of population aging and renewable energy consumption on total factor productivity in agriculture in 30 Chinese provinces (cities). The results of the variance decomposition and impulse response evaluation for the 15-year projection length are shown in Table A1 (See Appendix A) and Figure 5, respectively. The results show that 97.2% of the total factor productivity changes can be explained by their changes in the 15-year projection period, while the effects of population aging and renewable energy consumption are 2.23% and 0.56%, respectively. The effects of population aging on agricultural green total factor productivity are consistently much higher than those on electricity consumption, which indicates that the effects of population aging on agricultural green total factor productivity will be increasingly significant. The possible reason is that, along with the increase in aging, human capital also gradually ages. Through the continuous accumulation of knowledge and skills, the ability of technology absorption and diffusion also gradually increases, which in turn directly or indirectly enhances agricultural green total factor productivity in terms of upgrading industrial structures and green development awareness [55,56,57]. We discovered that the effect of renewable energy consumption on population aging reached 2.05% in the 15th year of the projection period, which implies that renewable energy consumption and population aging will proceed to substantially affect the change in agricultural green total factor productivity in the next decade. The intensification of population aging will also continue to have a certain impact on renewable energy consumption, which is consistent with our check results.
Maury et al. [58] estimated the impact of the age of human capital on the use efficiency of 57 common goods, based on the retro effect theory. The results show that the impact of capital stock on agricultural green total factor productivity will gradually increase with the intensification in population aging, but it is becoming weaker and weaker. According to the research results (Figure 5), we can see that, after giving a standard pulse to the population aging variable, the agricultural green total factor productivity did not respond in the initial stage, rising slowly from the second stage until the third stage showed a long-lasting positive effect, which shows that aging has great potential in promoting agricultural green total factor productivity. In addition, after giving a standard deviation impulse response to renewable energy consumption, the agricultural green total factor productivity did not respond in the first stage. It decreased slowly from the second stage, showing a negative effect, turned into an upward trend from the third stage and became a positive effect in the seventh stage. This shows that renewable energy consumption will hinder the improvement in agricultural green total factor productivity initially, but in the long run, renewable energy consumption will also have a significant positive impact on agricultural green total factor productivity. On the other hand, in the long run, population aging has a significant negative effect on renewable energy consumption, indicating that population aging will significantly inhibit renewable energy consumption. This is not consistent with the findings of Pais-Magalhães et al. [59] and Aslam [60]. A reasonable explanation is that they may have controlled for climatic conditions, and the settlement characteristics in their study differ significantly from the multi-regional census data involved in this paper. The pull of aging on renewable energy consumption is more prevalent in high-income countries [61]. In addition, agricultural green total factor productivity shows a long-term and stable positive impact on population aging. In contrast, the impact of agricultural green total factor productivity on power consumption fluctuates greatly in the short term but shows a weak positive impact in the long run. Overall, agricultural green total factor productivity has positive effects on population aging and renewable energy consumption in the long run, but they have slight impacts.
Based on many empirical analyses, the results show that these effects are significant. Despite the lack of data in the past two years, the research conclusion is still very reliable on the whole.

4.7. Discussion

The findings of this paper are consistent with related studies by previous scholars [20,22,55,56,57]. This paper examines how green total factor productivity in agriculture changes with increasing population aging and renewable energy consumption through a panel phase-volume autoregressive model. This study finds that both aging and renewable energy consumption have significant positive effects on AGTFP in the long run. Specifically, the impact of population aging on green total factor productivity in agriculture is dampened in the short run, while the impact still appears to be positive in the long run. On the other hand, we find that the effect of population aging is better than that of renewable energy consumption and that the effect of renewable energy on the green production factors in agriculture is larger in the short term and weaker in the long term. In addition, the aging population has a reverse disincentive effect on renewable energy consumption. Previously, few scholars have examined the impact on AGTFP directly from the perspective of population aging and renewable energy consumption. The existing literature on green total factor productivity in agriculture starts from the key influencing factor of technological progress [62,63,64]. Moreover, Jin et al. [15] and Adnan et al. [16] point to technological progress as the main driver. In previous studies on individual factors, Čiutienė et al. [28], Fougère and Marcel [26], Maury et al. [58], Naseem et al. [65,66,67,68] reached the same conclusions as this paper. For example, Vandenbussche et al. [55] showed that the increase in population aging facilitates the generation of knowledge “spillovers” that increase individual and regional productivity as well as the upgrading of the industrial infrastructure structure, leading to an increase in green total factor productivity in agriculture. Tang and Tan [67] found an interaction between renewable energy consumption and green total factor productivity in agriculture and that renewable energy consumption has a reinforcing effect on the increase in green total factor productivity in agriculture. Several other studies [6,59,69] show the inhibitory effect of population aging on renewable energy consumption.
Probably due to differences in measurement methods, regions and time, the findings of Pais-Magalhães et al. [59,61,70,71] and our group are not entirely consistent. For example, Engbom [70] found that increasing population aging is detrimental to green total factor productivity in agriculture, which is different from the results we obtained. The possible reason is that they considered more productivity in their study and, therefore, did not pay much attention to the effect of time. In contrast, we selected data from different times and performed a variance decomposition and impulse response analysis (see Figure 5). Figure 2, Figure 3 and Figure 5 clearly reflect our conclusions. Overall, population aging and renewable energy consumption have potentially positive long-term effects on total factor productivity in agriculture. In this way, this study fills the previous gap and completes the research on green total factor productivity in agriculture.

5. Conclusions and Policy Implications

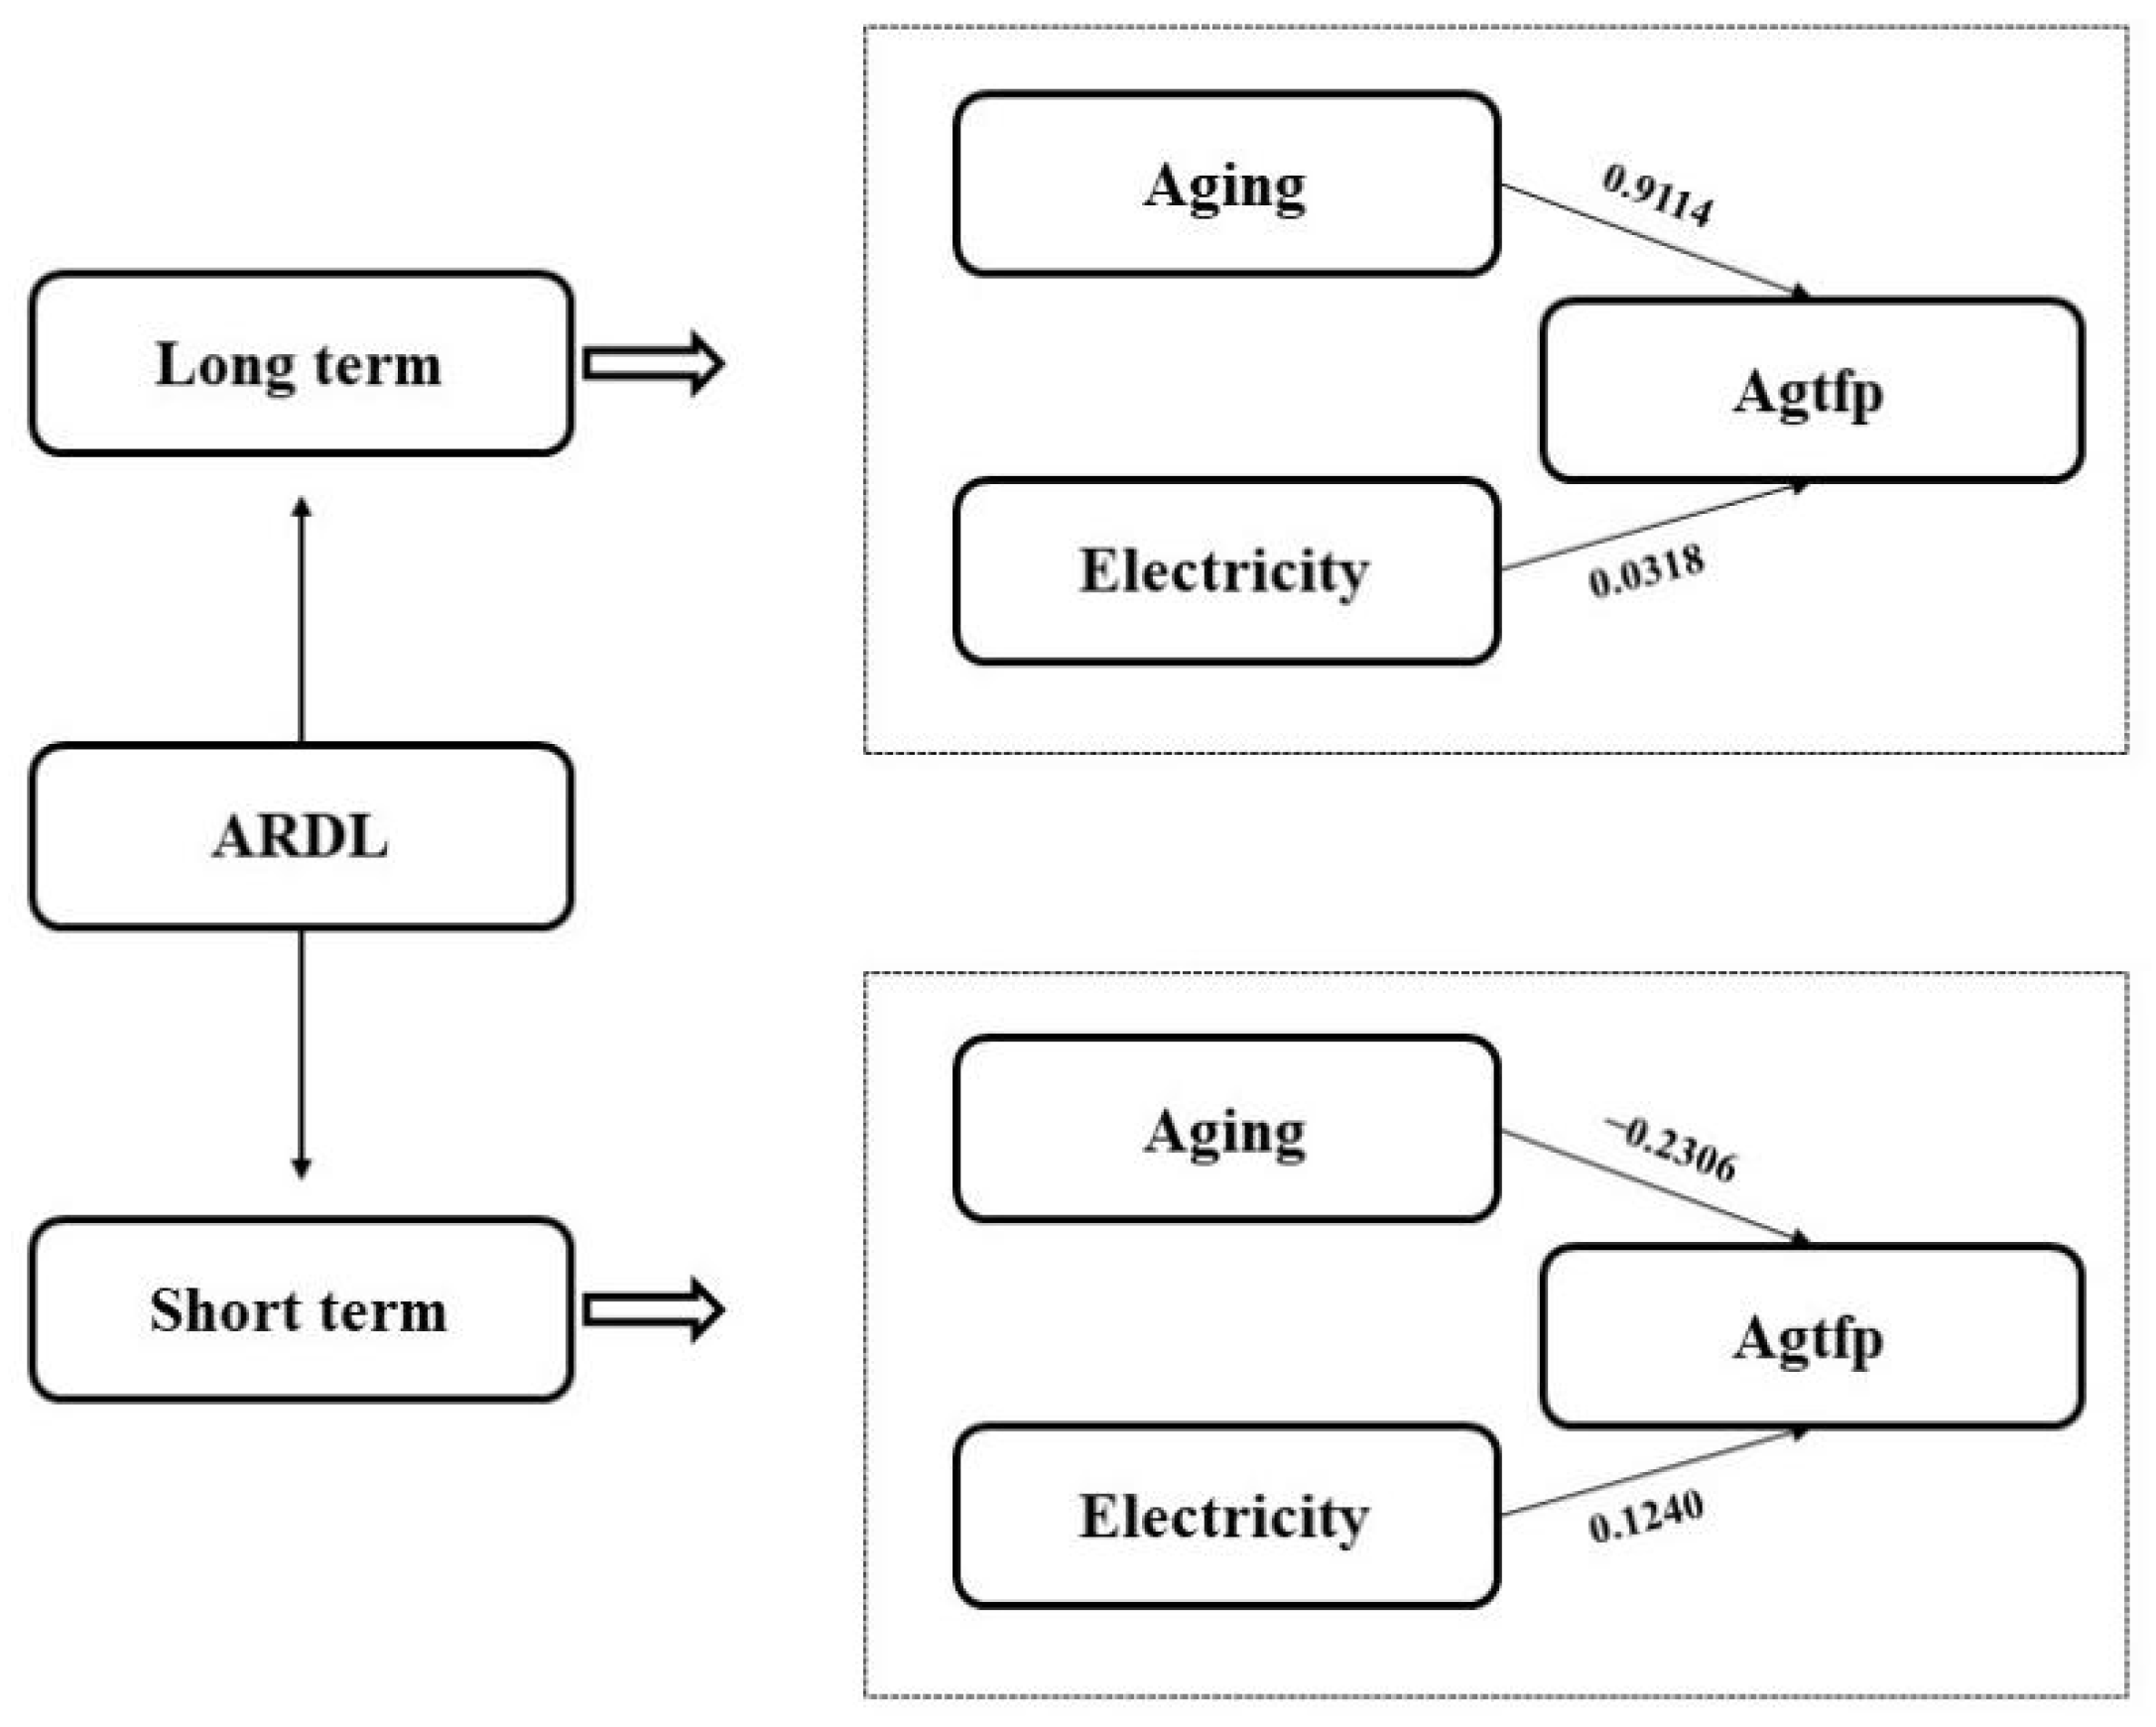
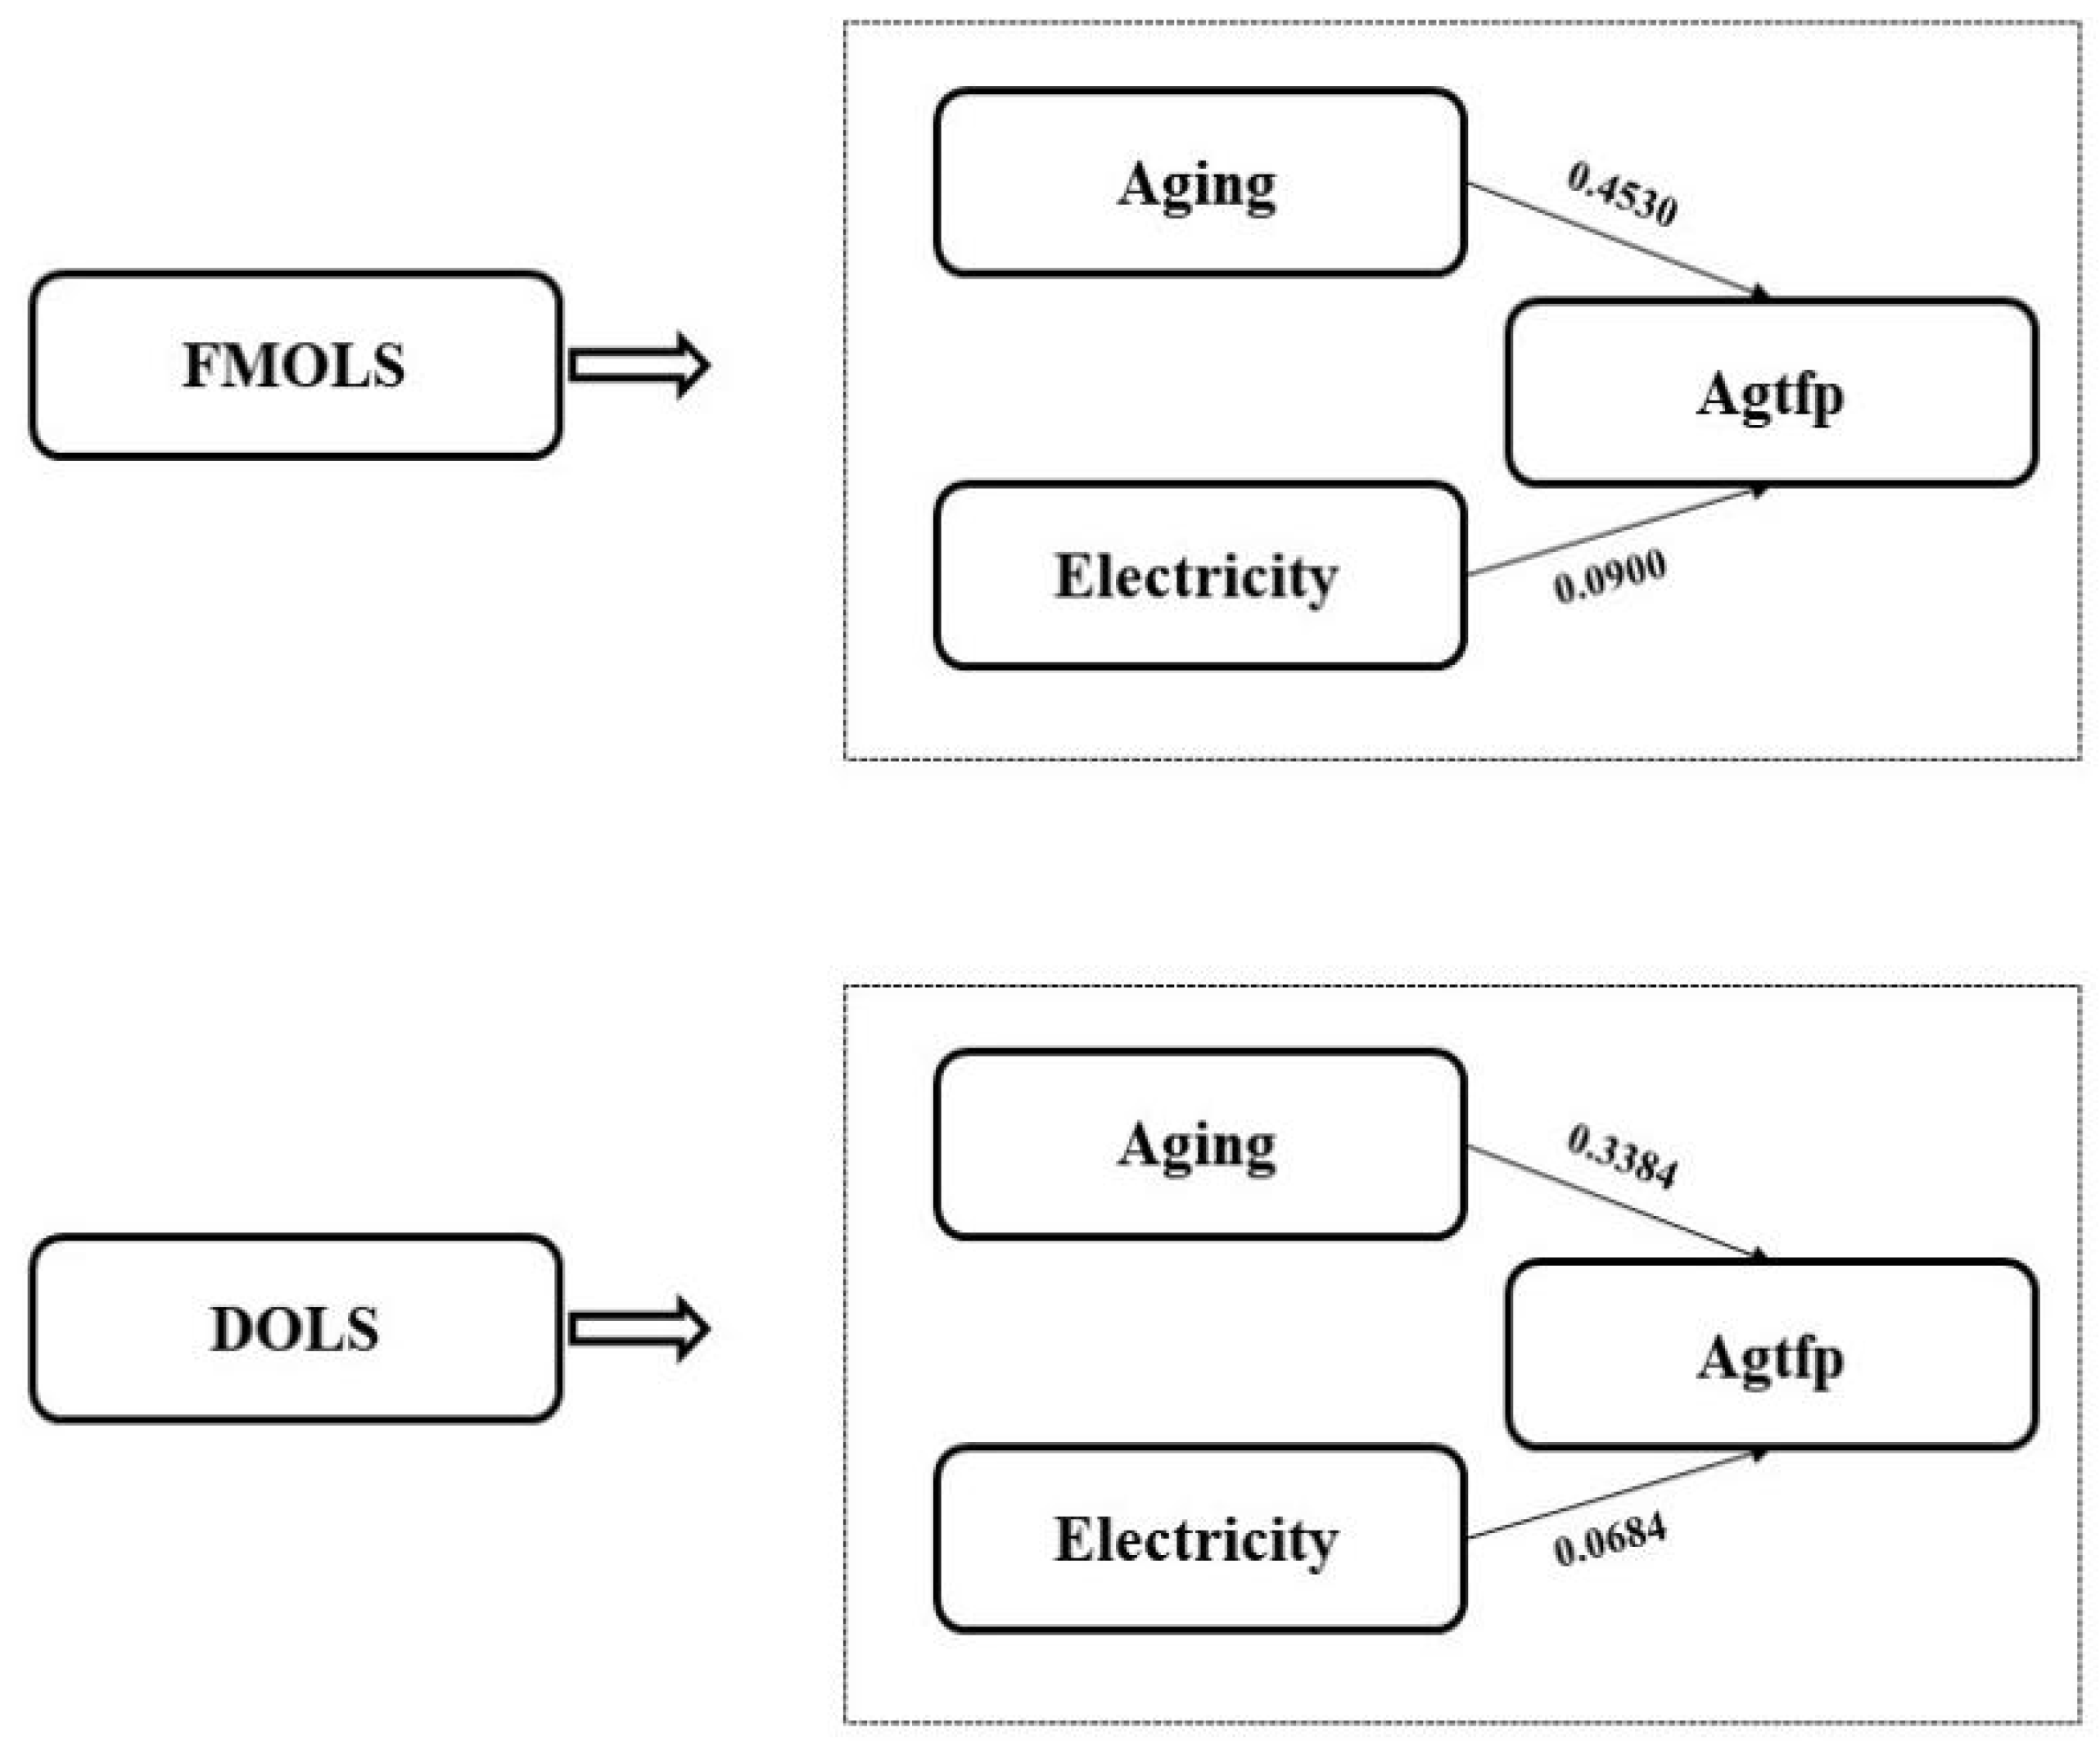
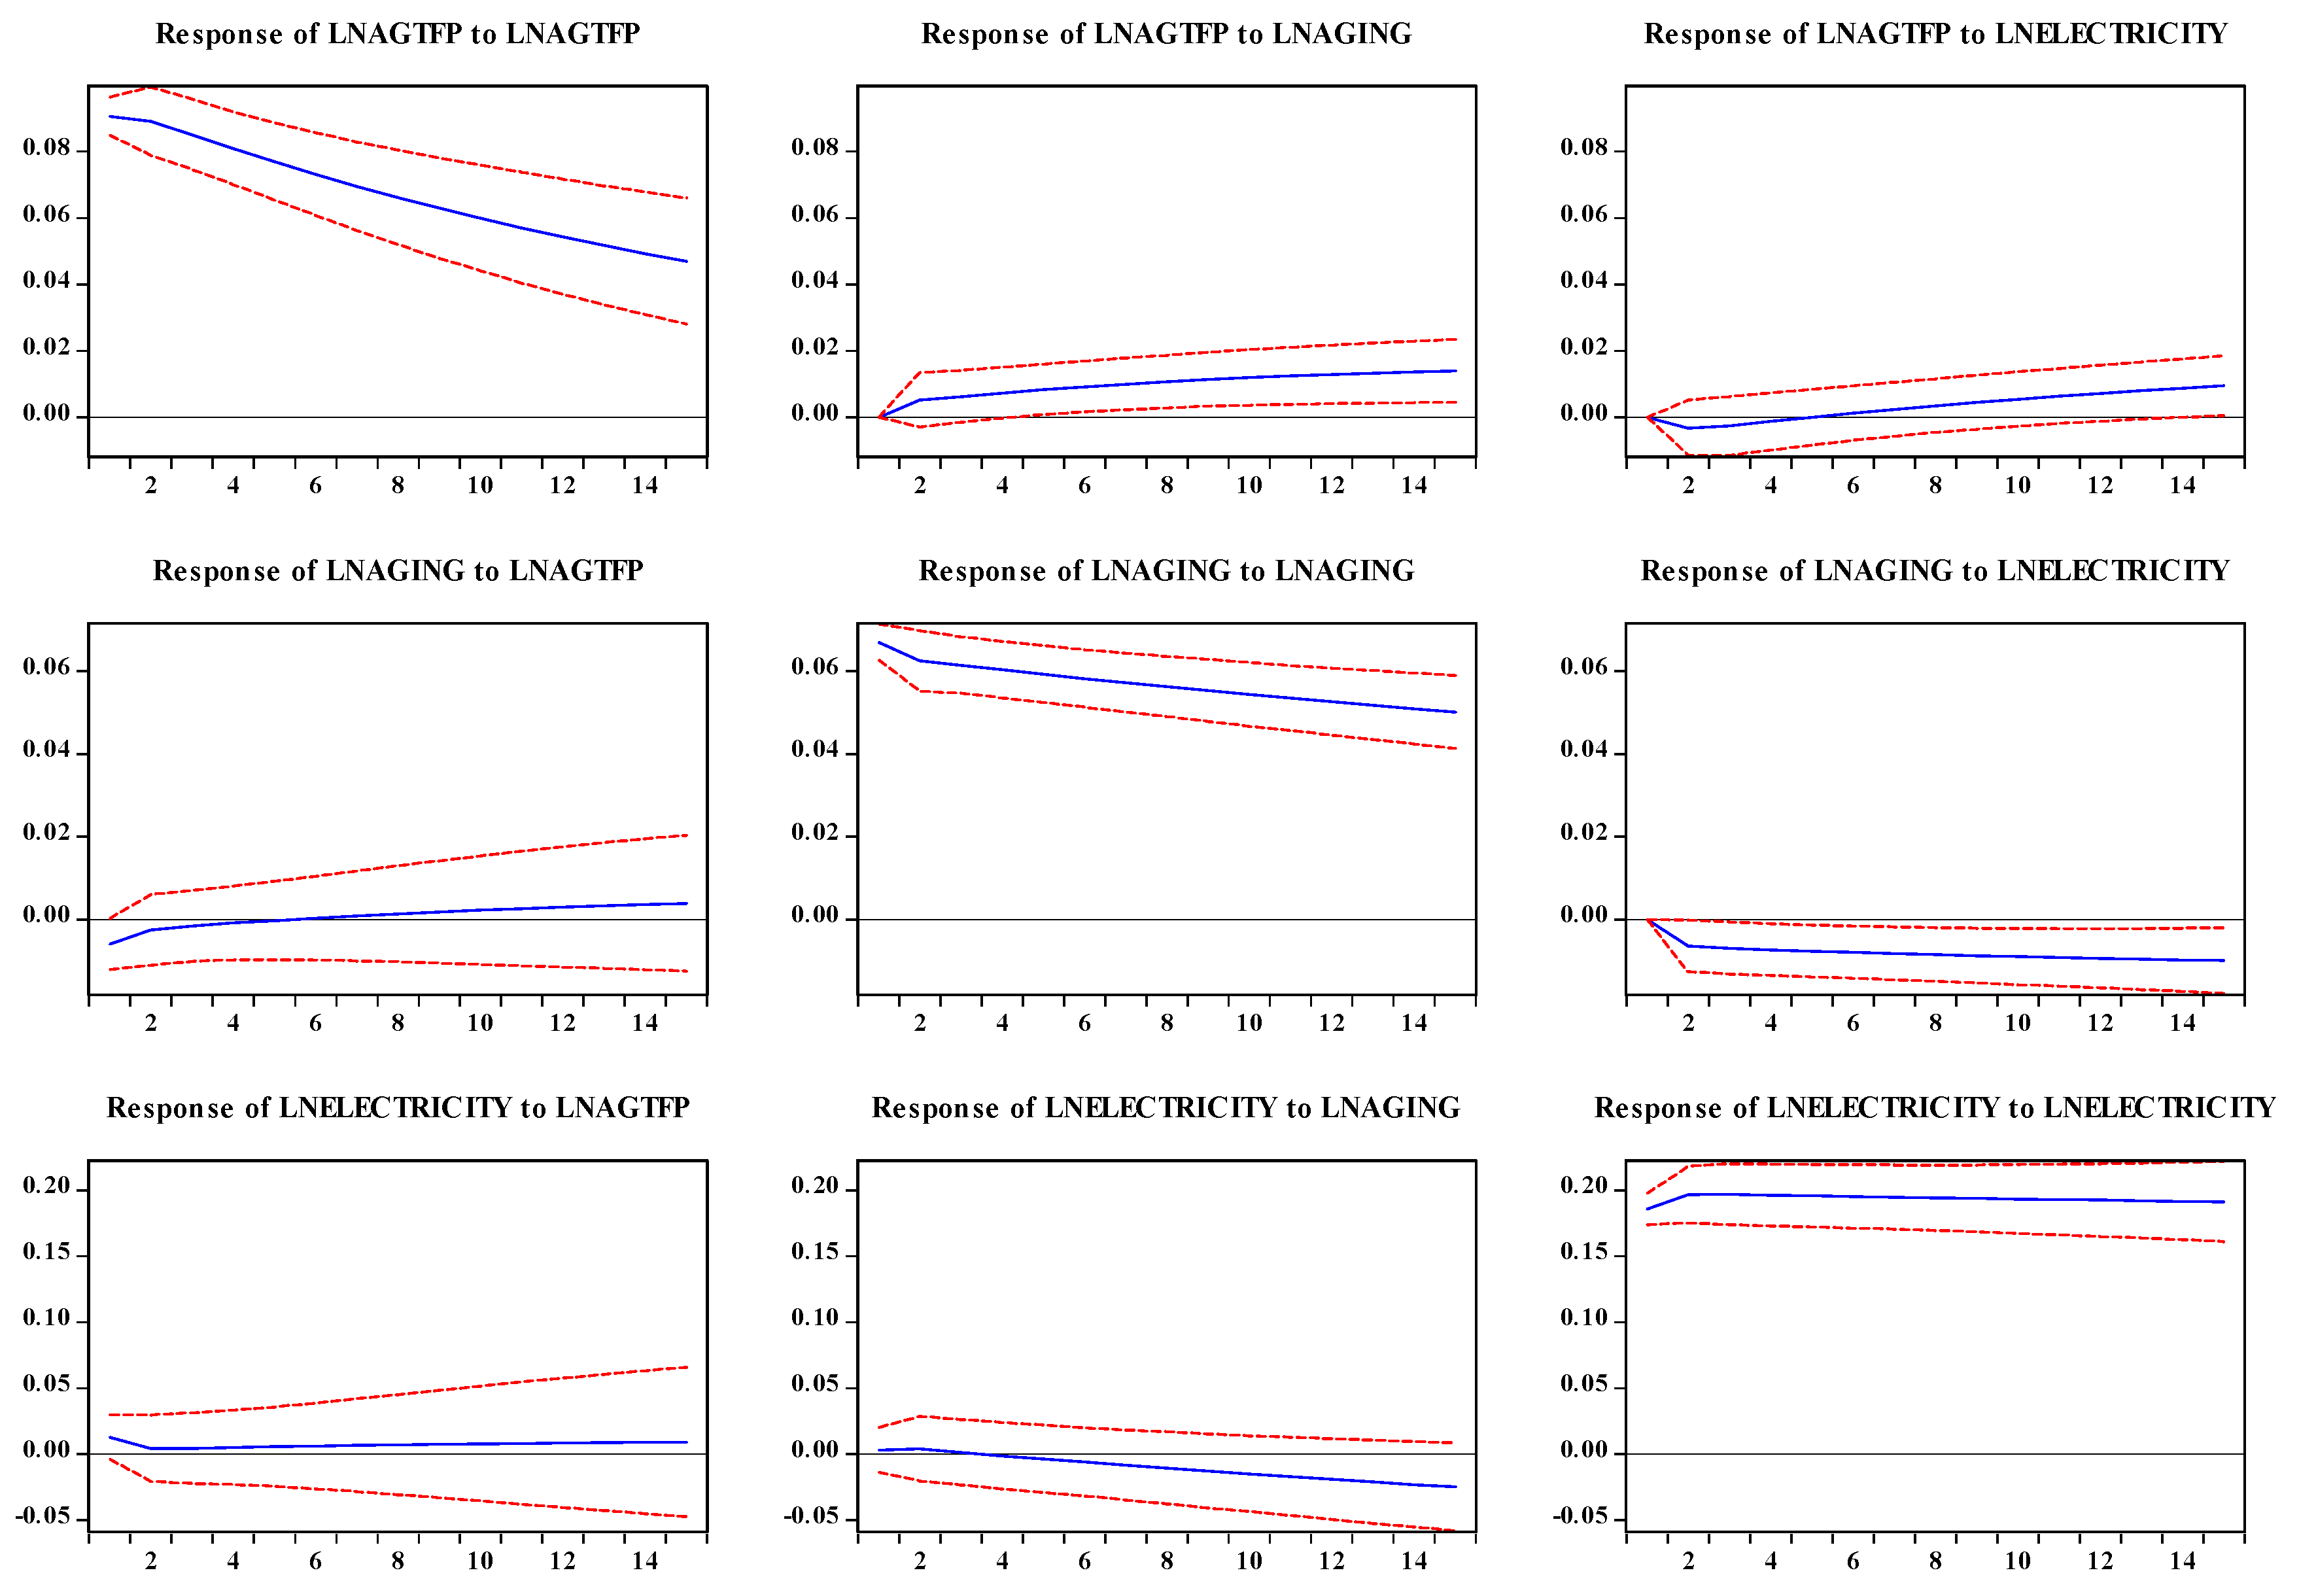
In this study, we examined the effects of population aging and renewable energy consumption on green total factor productivity in agriculture by analyzing panel data from 30 provinces in China for 20 years (2000 to 2019) using impulse response models. We first performed cross-sectional correlation tests and unit root tests on the data and then verified the long-run cointegration relationship between the three variables using the ADF test. The empirical consequences exhibit that there is a long-run cointegration relationship between population aging, renewable energy consumption and agricultural green total factor productivity. However, in contrast, the aging population has a more significant impact on agricultural green total factor productivity. In addition, based on the above analysis, we also found that the effect of renewable energy consumption on agricultural green total factor productivity is weakly positive. However, population aging has an inverse inhibitory effect on renewable energy consumption, and there is a negative relationship between the two. In the case of China, the trend of population aging cannot be changed in the short term, and the process of population aging in China will begin to hinder the increase in the agricultural green total factor rate, which will have a suppressing effect on agricultural green total factor productivity in the short term, but its impact on agricultural green total factor productivity is still positive in the long term.
Based on the above study results, we put forward the following policy recommendations: First, local governments ought to supply full play to their role in agricultural infrastructure construction, and perfect agricultural infrastructure provides a good platform for agriculture production. Second, local governments should continue to increase technological investment; develop high technology, high mechanization and efficient agriculture; create a high-quality workforce; and effectively promote agricultural modernization and reform. Third, the quality of the existing labor force should be improved, mainly for the young labor force, to enhance its absorption and application of new technologies, thus increasing the stock of human capital and improving its agricultural production efficiency. In addition, it is necessary to attract highly qualified personnel from other fields to enter the field of agricultural production to inject fresh and developmental blood into the field of agricultural production. Finally, learning from advanced foreign experience and introducing advanced management strategies will help to improve China’s human capital stock.
The research in this paper innovates on the basis of previous studies and focuses on population aging, an important issue in agricultural production, but there are some limitations: the research between the three factors of population aging, the degree of renewable energy consumption use and agricultural green total factor productivity improvement is not systematic enough. In addition, different provinces and cities in China have different levels of economic development, population size, living concepts and habits, and there are also differences in agricultural production. It is suggested that we can focus on multi-faceted, wide-ranging and multi-level research in the future, refine the factors influencing green total factor productivity in agriculture and implement differentiated management according to local conditions.

Author Contributions

Conceptualization, L.G. and H.L.; methodology, L.G. and M.T.; software, L.G. and M.T.; formal analysis, L.G., X.Z. and H.L.; writing—original draft preparation, L.G., X.Z. and H.L.; Writing—review and editing, H.L., L.G., X.Z. and M.T.; funding acquisition, L.G. All authors have read and agreed to the published version of the manuscript.

Funding

National social science fund of China (21BGL022, 20CMZ037); The soft science project of Sichuan Province, China (2021JDR0300).

Institutional Review Board Statement

Not applicable.

Informed Consent Statement

Not applicable.

Data Availability Statement

The data presented in this study are available within the article.

Conflicts of Interest

The authors declare no conflict of interest.

Appendix A

Table A1. Impulse response and variance decomposition results.
PeriodS.E.LNAGTFPLNAGINGLNELECTRICITY
Variance Decomposition of LNAGTFP:
10.0906100.00000.00000.0000
20.127399.76800.16930.0626
30.153399.64440.28430.0713
40.173599.53750.40160.0609
50.190099.42200.52720.0508
60.203899.28950.66260.0479
70.215699.13690.80780.0553
80.225898.96320.96230.0744
90.234898.76851.12550.1059
100.242798.55331.29650.1502
110.249798.31831.47430.2074
120.255998.06451.65800.2774
130.261697.79321.84660.3602
140.266797.50532.03920.4555
150.271397.20222.23480.5629
Variance Decomposition of LNAGING:
10.06720.777899.22220.0000
20.09190.492099.02900.4790
30.11080.358998.91910.7220
40.12630.280998.82920.8900
50.13970.229998.74461.0255
60.15160.195998.65911.1450
70.16220.173798.57051.2558
80.17190.160898.47791.3613
90.18080.155298.38101.4637
100.18900.155898.28001.5641
110.19660.161698.17521.6632
120.20370.171898.06681.7614
130.21040.185897.95521.8590
140.21680.202997.84081.9562
150.22270.222997.72402.0531
Variance Decomposition of LNELECTRICITY:
10.18620.47990.029999.4902
20.27080.25370.038199.7081
30.33480.18340.026599.7901
40.38820.15320.020699.8262
50.43490.13890.023499.8378
60.47680.13240.035299.8324
70.51510.13040.056199.8135
80.55070.13110.085799.7833
90.58400.13340.123799.7429
100.61540.13680.169899.6934
110.64520.14090.223599.6356
120.67360.14540.284599.5701
130.70080.15010.352599.4974
140.72690.15490.427099.4181
150.75220.15960.507799.3327

References

  1. Clancy, M.; Fuglie, K.O.; Heisey, P.U.S. Agricultural R&D in an Era of Falling Public Funding; Amber Waves; USDA-Economic Research Service: Washington, DC, USA, 2016. [Google Scholar]
  2. Fang, L.; Hu, R.; Mao, H.; Chen, S.J. How crop insurance influences agricultural green total factor productivity: Evidence from Chinese farmers. J. Clean. Prod. 2021, 321, 128977. [Google Scholar] [CrossRef]
  3. Kumbhakar, S.C.; Denny, M.; Fuss, M. Estimation and decomposition of productivity change when production is not efficient: A panel data approach. Econom. Rev. 2000, 19, 312–320. [Google Scholar] [CrossRef]
  4. Wang, H.; Cui, H.; Zhao, Q. Effect of green technology innovation on green total factor productivity in China: Evidence from spatial Durbin model analysis. J. Clean. Prod. 2021, 288, 125624. [Google Scholar] [CrossRef]
  5. Wang, S.J.; Huang, J.K.; Wang, X.B. Francis Tuan. Are China’s regional agricultural productivities converging: How and why? Food Policy 2019, 86, 101727. [Google Scholar] [CrossRef]
  6. Ota, T.; Kakinaka, M.; Kotani, K. Demographic effects on residential electricity and city gas consumption in the aging society of Japan. Energy Policy 2018, 115, 503–513. [Google Scholar] [CrossRef] [Green Version]
  7. Wang, H.C. Changing energy intensity of economies in the world and its decomposition. Energy Econ. 2013, 40, 637–644. [Google Scholar] [CrossRef]
  8. Chen, Y.; Fang, Z. Industrial electricity consumption, human capital investment and economic growth in Chinese cities. Econ. Model. 2018, 69, 205–219. [Google Scholar] [CrossRef]
  9. Rahman, M.M.; Hosan, S.; Karmaker, S.C.; Chapman, A.J.; Saha, B.B. The effect of remittance on energy consumption: Panel cointegration and dynamic causality analysis for South Asian countries. Energy 2020, 220, 119684. [Google Scholar] [CrossRef]
  10. Deichmann, U.; Reuter, A.; Vollmer, S.; Zhang, F. The relationship between energy intensity and economic growth: New evidence from a multi-country multi-sectorial dataset. World Dev. 2019, 124, 104664. [Google Scholar] [CrossRef]
  11. Hall, R.E.; Jones, C.I. Why do some countries produce so much more output per worker than others? Q. J. Econom. 1999, 114, 83–116. [Google Scholar] [CrossRef]
  12. Liu, Y.; Feng, C. What drives the fluctuations of “green” productivity in China’s agricultural sector? A weighted Russell directional distance approach. Resour. Conserv. Recycl. 2019, 147, 201–213. [Google Scholar] [CrossRef]
  13. Lin, B.; Chen, Z. Does factor market distortion inhibit the green total factor productivity in China? J. Clean. Prod. 2018, 197, 25–33. [Google Scholar] [CrossRef]
  14. Dokić, D.; Gavran, M.; Gregić, M.; Gantner, V. The impact of trade balance of agri-food products on the state’s ability to withstand the crisis. HighTech Innov. J. 2020, 1, 107–111. [Google Scholar] [CrossRef]
  15. Jin, S.; Ma, H.; Huang, J.; Hu, R.; Rozelle, S. Productivity, efficiency and technical change: Measuring the performance of China’s transforming agriculture. J. Prod. Anal. 2010, 33, 191–207. [Google Scholar] [CrossRef]
  16. Adnan, N.; Nordin, S.M.; Ali, M. A solution for the sunset industry: Adoption of green fertilizer technology amongst Malaysian paddy farmers. Land Use Policy 2018, 79, 575–584. [Google Scholar] [CrossRef]
  17. Ang, J.B.; Madsen, J.B.; Islam, M.R. The effects of human capital composition on technological convergence. J. Macroecon. 2011, 33, 465–476. [Google Scholar] [CrossRef]
  18. Cole, S. Age and Scientific Performance. Am. J. Sociol. 1979, 84, 958–977. [Google Scholar] [CrossRef]
  19. Levin, S.G.; Stephan, P.E. Research Productivity over the Life Cycle: Evidence for Academic Scientists. Am. Econ. Assoc. 1991, 81, 114–132. [Google Scholar]
  20. Benhabib, J.; Spiegel, M.M. Chapter 13 Human Capital and Technology Diffusion; Aghion, P., Steven, N., Eds.; Durlauf, Handbook of Economic Growth; Elsevier: Amsterdam, The Netherlands, 2005; Volume 1, pp. 935–966. [Google Scholar] [CrossRef]
  21. Nelson, R.R.; Phelps, E.S. Investment in Humans, Technological Diffusion and Economic Growth; Cowles Foundation Discussion Papers 189; Cowles Foundation for Research in Economics, Yale University: New Haven, CT, USA, 1965. [Google Scholar]
  22. Romer, P.M. Endogenous Technological Change. J. Political Econ. 1990, 98, 71–102. [Google Scholar] [CrossRef] [Green Version]
  23. Choi, K.-H.; Shin, S. Population aging, economic growth, and the social transmission of human capital: An analysis with an overlapping generations model. Econ. Model. 2015, 50, 138–147. [Google Scholar] [CrossRef]
  24. Bairoliya, N.; Miller, R. Demographic transition, human capital and economic growth in China. J. Econ. Dyn. Control 2021, 127, 104117. [Google Scholar] [CrossRef] [PubMed]
  25. Khor, N.; Pang, L.; Liu, C.; Chang, F.; Mo, D.; Loyalka, P.; Rozelle, S. China’s Looming Human Capital Crisis:Upper Secondary Educational Attainment Rates and the Middle-income Trap. China Q. 2016, 228, 905–926. [Google Scholar] [CrossRef]
  26. Fougère, M.; Mérette, M. Population ageing and economic growth in seven OECD countries. Econ. Model. 1999, 16, 411–427. [Google Scholar] [CrossRef]
  27. Fougère, M.; Harvey, S.; Mercenier, J.; Mérette, M. Population ageing, time allocation and human capital: A general equilibrium analysis for Canada. Econ. Model. 2009, 26, 30–39. [Google Scholar] [CrossRef]
  28. Čiutienė, R.; Railaitė, R. A Development of Human Capital in the Context of an Aging Population. Procedia Soc. Behav. Sci. 2015, 213, 753–757. [Google Scholar] [CrossRef] [Green Version]
  29. Zhang, J.; Zhang, J.; Lee, R. Rising longevity, education, savings, and growth. J. Dev. Econ. 2003, 70, 83–101. [Google Scholar] [CrossRef]
  30. Gradstein, M.; Kaganovich, M. Aging Population and Education Finance. J. Public Econ. 2003, 88, 2469–2485. [Google Scholar] [CrossRef]
  31. Ozcan, B.; Danish; Temiz, M. An empirical investigation between renewable energy consumption, globalization and human capital: A dynamic auto-regressive distributive lag simulation. Renew. Energy 2022, 193, 195–203. [Google Scholar] [CrossRef]
  32. Alvarado, R.; Deng, Q.; Tillaguango, B.; Méndez, P.; Bravo, D.; Chamba, J.; Alvarado-Lopez, M.; Ahmad, M. Do economic development and human capital decrease non-renewable energy consumption? Evidence for OECD countries. Energy 2021, 215, 119147. [Google Scholar] [CrossRef]
  33. Yao, Y.; Ivanovski, K.; Inekwe, J.; Smyth, R. Human capital and energy consumption: Evidence from OECD countries. Energy Econ. 2019, 84, 104534. [Google Scholar] [CrossRef]
  34. Bano, S.; Liu, L.; Khan, A. Dynamic influence of aging, industrial innovations, and ICT on tourism development and renewable energy consumption in BRICS economies. Renew. Energy 2022, 192, 431–442. [Google Scholar] [CrossRef]
  35. Zhang, Z.; Hao, Y.; Lu, Z.N.; Deng, Y. How does demographic structure affect environmental quality? Empirical evidence from China. Resour. Conserv. Recycl. 2018, 133, 242–249. [Google Scholar] [CrossRef]
  36. Willis, K.; Scarpa, R.; Gilroy, R.; Hamza, N. Renewable energy adoption in an ageing population: Heterogeneity in preferences for micro-generation technology adoption. Energy Policy 2011, 39, 6021–6029. [Google Scholar] [CrossRef]
  37. Tarazkar, M.H.; Dehbidi, N.K.; Ozturk, I.; Al-Mulali, U. The impact of age structure on carbon emission in the Middle East: The panel autoregressive distributed lag approach. Environ. Sci. Pollut. Res. 2021, 28, 33722–33734. [Google Scholar] [CrossRef]
  38. Sims, C.A. Comparison of interwar and postwar business cycle. Am. Econ. Rev. 1980, 1980, 250–257. [Google Scholar]
  39. Holtz-Eakin, D.; Newey, W.; Rosen, H.S. Estimating Vector Autoregressions with Panel Data. Econometrica. 1988, 56, 1371–1395. [Google Scholar] [CrossRef]
  40. Levin, A.; Lin, C.F.; Chu, C.S.J. Unit Root Tests in Panel Data: Asymptotic and Finite-Sample Properties. J. Econom. 2002, 108, 1–24. [Google Scholar] [CrossRef]
  41. Hadri, K. Testing for stationarity in heterogeneous panel data. Econom. J. 2001, 3, 148–161. [Google Scholar] [CrossRef]
  42. O’Connell, P.G.J. The overvaluation of purchasing power parity. J. Int. Econ. 1998, 44, 1–19. [Google Scholar] [CrossRef]
  43. Pesaran, M.H. General Diagnostic Tests for Cross Section Dependence in Panels. Camb. Work. Pap. Econ. 2004, 69, 1240. [Google Scholar] [CrossRef]
  44. Choi, I. Unit root tests for panel data. J. Int. Money Financ. 2001, 20, 249–272. [Google Scholar] [CrossRef]
  45. Phillips, P.C.B. Time Series Regression with a Unit Root. Econometrica 1987, 55, 277. [Google Scholar] [CrossRef]
  46. Phillips, P.C.B.; Perron, P. Testing for a Unit Root in Time Series Regression. Biometrika 1988, 75, 335. [Google Scholar] [CrossRef]
  47. Kao, C. Spurious regression and residual-based tests for cointegration in panel data. J. Econom. 1999, 90, 1–44. [Google Scholar] [CrossRef]
  48. Stock, J.H. Asymptotic Properties of Least Squares Estimators of Cointegrating Vectors. Econometrica 1987, 55, 1035. [Google Scholar] [CrossRef]
  49. Banerjee, A.; Dolado, J.J.; Hendry, D.; Smith, G. Exploring equilibrium relationships in econometrics through static models: Some Monte-Carlo evidence. Oxf. Bull. Econ. Stat. 1986, 48, 253–277. [Google Scholar] [CrossRef] [Green Version]
  50. Phillips, P.C.B.; Hansen, B.E. Statistical Inference in Instrumental Variables Regression with I(1) Processes. Rev. Econ. Stud. 1990, 57, 99. [Google Scholar] [CrossRef]
  51. Banerjee, A. Panel Data Unit Roots and Cointegration: An Overview. Oxf. Bull. Econ. Stat. 1999, 61, 607–629. [Google Scholar] [CrossRef]
  52. Dreger, C.; Reimers, H.E. Health Care Expenditures in OECD Countries: A Panel Unit Root and Cointegration Analysis; Social Science Electronic Publishing: Rochester, NY, USA, 2005. [Google Scholar] [CrossRef]
  53. Lanne, M.; Nyberg, H. Generalized forecast error variance decomposition for linear and nonlinear multivariate models. Oxf. Bull. Econ. Stat. 2016, 78, 595–603. [Google Scholar] [CrossRef] [Green Version]
  54. Dong, K.; Dong, X.; Jiang, Q. How does renewable energy consumption lower global CO2 emissions? Evidence from countries with different income levels. World Econ. 2019, 43, 1665–1689. [Google Scholar] [CrossRef]
  55. Vandenbussche, J.; Aghion, P.; Meghir, C. Growth, distance to frontier and composition of human capital. J. Econ. Growth 2006, 11, 97–127. [Google Scholar] [CrossRef]
  56. Minihan, E.S.; Wu, Z. Economic structure and strategies for greenhouse gas mitigation. Energy Econ. 2012, 34, 350–357. [Google Scholar] [CrossRef]
  57. Shimada, K.; Tanaka, Y.; Gomi, K.; Matsuoka, Y. Developing a long-term local society design methodology towards a low-carbon economy: An application to Shiga Prefecture in Japan. Energy Policy 2007, 35, 4688–4703. [Google Scholar] [CrossRef]
  58. Gittleman, M.; Raa, T.T.; Wolff, E.N. The vintage effect in TFP-growth: An analysis of the age structure of capital. Struct. Chang. Econ. Dyn. 2006, 17, 306–328. [Google Scholar] [CrossRef] [Green Version]
  59. Pais-Magalhães, V.; Moutinho, V.; Robaina, M. Is an ageing population impacting energy use in the European Union? Drivers, lifestyles, and consumption patterns of elderly households. Energy Res. Soc. Sci. 2022, 85, 102443. [Google Scholar] [CrossRef]
  60. Aslam, M.; Ahmad, E. Impact of ageing and generational effects on household energy consumption behavior: Evidence from Pakistan. Energies 2018, 11, 2003. [Google Scholar] [CrossRef] [Green Version]
  61. Estiri, H.; Zagheni, E. Age matters: Ageing and household energy demand in the United States. Energy Res. Soc. Sci. 2019, 55, 62–70. [Google Scholar] [CrossRef]
  62. Gao, F. Evolution trend and internal mechanism of regional total factor productivity in Chinese agriculture. J. Quant. Tech. Econ. 2015, 32, 3–19. [Google Scholar]
  63. Liu, Z. Analysis on the dynamic and influencing factors of agricultural total factor productivity in China. Chin. J. Agric. Resour. Reg. Plan. 2018, 39, 104–111. [Google Scholar]
  64. Ge, P.F.; Wang, S.J.; Huang, X.L. Measurement for China’s agricultural green TFP. China Popul. Resour. Environ. 2018, 28, 66–74. [Google Scholar]
  65. Naseem, A.; Spielman, D.J.; Omamo, S.W. Private-sector investment in R&D: A review of policy options to promote its growth in developing-country agriculture. Agribusiness 2010, 26, 143–173. [Google Scholar]
  66. Liu, F.; Lv, N. The threshold effect test of human capital on the growth of agricultural green total factor productivity: Evidence from China. Int. J. Electr. Eng. Educ. 2021. [Google Scholar] [CrossRef]
  67. Tang, C.F.; Tan, E.C. Exploring the nexus of electricity consumption, economic growth, energy prices and technology innovation in Malaysia. Appl. Energy 2013, 104, 297–305. [Google Scholar] [CrossRef]
  68. Irandoust, M. The renewable energy-growth nexus with carbon emissions and technological innovation: Evidence from the Nordic countries. Ecol. Indic. 2016, 69, 118–125. [Google Scholar] [CrossRef]
  69. Garau, G.; Lecca, P.; Mandras, G. The impact of population ageing on energy use: Evidence from Italy. Econ. Model. 2013, 35, 970–980. [Google Scholar] [CrossRef]
  70. Engbom, N. Firm and Worker Dynamics in an Aging Labor Market; Federal Reserve Bank of Minneapolis: Minneapolis, MN, USA, 2019. [Google Scholar]
  71. Park, C.-Y.; Shin, K.; Kikkawa, A. Demographic change, technological advance, and growth: A cross-country analysis. Econ. Model. 2022, 108, 105742. [Google Scholar] [CrossRef]
Figure 1. Method flow chart.
Agriculture 12 00715 g001
Figure 2. ARDL analysis result.
Agriculture 12 00715 g002
Figure 3. DOLS and FMOLS analysis results.
Agriculture 12 00715 g003
Figure 4. Inverse roots of A.R. characteristic polynomials.
Agriculture 12 00715 g004
Figure 5. Impulse responses of LNAGTFP, LNAGING and LNELECTRICITY, used to predict 15 years (blue), with a confidence interval of 95% (red).
Agriculture 12 00715 g005
Table 1. Cross-sectional dependence test results.
TestStatisticProb.
Breusch–Pagan LM2331.9030.0000
Pesaran scaled LM64.311030.0000
Pesaran CD22.045940.0000
Table 2. Panel unit root test results.
VariablesLevel First-Order Difference
InterceptIntercept and TrendInterceptIntercept and Trend
LLC test
lnagtfp0.99870.00020.00000.0000
lnaging0.96870.08450.00000.0000
lnelectricity0.00000.51460.00000.0000
Im, Pesaran and Shin test
lnagtfp1.00000.18610.00000.0000
lnaging1.00000.20290.00000.0000
lnelectricity0.00660.95890.00000.0000
ADF-Fisher Chi-square test
lnagtfp0.87870.00040.00000.0000
lnaging0.99880.10460.00000.0000
lnelectricity0.00000.21130.00000.0000
PP-Fisher Chi-square test
lnagtfp0.97110.00330.00000.0000
lnaging1.00000.46150.00000.0000
lnelectricity0.00000.50600.00000.0000
Table 3. Panel cointegration test results.
Null Hypothesist-StatisticsProbability
ADFNo co-integration−2.6621130.0039
Table 4. ARDL analysis results.
VariableCoefficientStd. Errort-StatisticProb.
Long-Run Equation
LNAGING0.91140.10069.06410.0000
LNELECTRICITY0.03180.02261.40980.1594
Short-Run Equation
COINTEQ01−0.22860.0293−7.79100.0000
D(LNAGING)−0.23060.0502−4.59290.0000
D(LNELECTRICITY)0.12400.07281.70440.0890
C0.37380.04937.58110.0000
Table 5. Benchmark results.
VariablesCoefficientS.E.t-StatisticProb.
FMOLS
LNAGING0.45300.07885.74970.0000
LNELECTRICITY0.09000.02293.92790.0001
DOLS
LNAGING0.33840.11702.89180.0042
LNELECTRICITY0.06840.03042.24990.0254
Publisher’s Note: MDPI stays neutral with regard to jurisdictional claims in published maps and institutional affiliations.

