
Design of Rice Straw Fiber Crusher and Evaluation of Fiber Quality

College of Engineering, Shenyang Agricultural University, Shenyang 110866, China
*
Author to whom correspondence should be addressed.
Agriculture 2022, 12(5), 729; https://0-doi-org.brum.beds.ac.uk/10.3390/agriculture12050729
Submission received: 22 April 2022
/
Revised: 19 May 2022
/
Accepted: 19 May 2022
/
Published: 21 May 2022
(This article belongs to the Topic Emerging Agricultural Engineering Sciences, Technologies, and Applications)
Abstract
:In the comprehensive development and utilization of crop straw, it is key to separate the fibers in the straw through a certain process or equipment. In order to obtain rice straw fiber material, the straw fiber crusher was designed using SOLIDWORKS software, and its grinding process was simulated using EDEM software to verify the feasibility of the machine principle and structural rationality. The grinding wheel speed, screw feed shaft speed, and grinding wheel clearance were used as test factors to design a three-factor, five-level test using Design Expert 13, obtaining a grinding wheel speed of 1250 r·min−1, a screw feed shaft speed of 40 r·min−1, and a wheel clearance 0.21 mm, which can achieve a theoretical kWh output of 45.8 kg/(kW·h) and a tensile index of 112.5 N·mg−1. We aimed to establish a model of the pore channel of the specimen, analyze the characteristics of the model within the unit area of different specimens, investigate the intrinsic relationship between the tensile index and the image pore channel coefficient of the straw fiber specimen, and to verify the feasibility and rationality of using the tensile index to evaluate the quality of straw fiber.
1. Introduction
With the support of policies and regulations on the comprehensive utilization of agricultural waste in China, the technology for the total utilization of straw resources across the country has been continuously improved and perfected. Based on a steady increase in straw fertilizer, feed, fuel, raw material, and base material utilization, the diversified, industrialized, and high-value utilization of straw off-site is also steadily developing [1]. As a new environmentally friendly material, straw fiber has a wide range of uses and is non-polluting, naturally degradable, widely available, and renewable [2]. Straw fiber is an important raw material for seedling mantles [3], biodegradable mulch, new cushioning and packaging materials [4,5], light construction materials, and household products [6]. In addition, after fermentation and decomposition, it can also be used as a substrate for cultivation. Due to its low bulk and relatively large pores, it is mainly used as a component of composite substrates [7].
The straw fiber seedling bowl has good water storage properties, and the walls are moderately intense. It is easy to transport the seedlings and plant them to be integrated. The straw can be decomposed naturally in the soil, is non-polluting, and has a specific fertilizing effect on the ground [8]. Biodegradable ground cover is an aliphatic polyester material synthesized by a unique production process using the toughness and intertwining properties of straw fibers, with the addition of film-forming agents and brightening agents. It has been used more often in ground cover, helping to maintain the stability of the soil structure, avoiding water loss, and having the function of promoting plant growth [9]. The new cushioning packaging material is made of straw fiber as the primary raw material, adding a foaming agent (sodium bicarbonate, etc.) and a binder through mixing, crosslinking, and foaming. It is environmentally friendly, recyclable, widely available, low cost, light, accessible to process, and easy to handle [10]. As a result, straw fiber preparation has also become a popular research topic.
Straw is mainly composed of cellulose, hemicellulose, lignin, and other components [11]. Currently, the chemical preparation method relies on specific chemical reagents to prepare the desired product, for example, through chemical reactions. It mainly combines the properties of the different components of the straw fiber with the use of suitable reagents to extract the desired features [12]. The advantages of this treatment method are the high efficiency of the preparation and the high quality of the product. Still, it can also lead to environmental pollution problems and relatively high costs [13,14,15]. The bio preparation method involves the straw being crushed and treated with the appropriate amount of microorganisms to break down the lignin. The advantage of this technology is that it does not require much equipment and generally only requires shredding equipment. However, there are still problems with the application. Firstly, the low efficiency of the straw treatment; secondly, the difficulty for the microorganisms to maintain a high rate of proliferation; thirdly, it leads to the formation of some impurities and therefore is still not widely used [16].
The physical preparation method is, in fact, mechanical. The process is implemented without any additives and allows for the extraction of fiber materials. The main physical preparation methods are steam blasting, extrusion, and electric grinding. The steam bursting method relies on special equipment containing particular steam that must meet the pressure and temperature requirements before the straw sample can be processed, with various chemical and physical effects to increase the crystallinity. When this condition is broken, a phenomenon similar to “bursting” occurs as the pressure drops dramatically, and in this way, the desired straw fiber is obtained. This method is a low-pollution way of producing straw fibers, but the long production times and the large size of the equipment are not conducive to a fast and efficient production of straw fibers [17,18,19,20,21]. The basic principle of extrusion is a low-pressure steam explosion, and the fibers produced have the same structure and composition as those obtained by steam explosion. This method relies on a particular extrusion machine, and in the process, the screw wears out, cannot be cleaned automatically, and consumes much energy [22,23,24]. The straw fibers are obtained using the electric grinding method. The fibers are continuously ground by the grinding disc, making them internally finely fibrous, soft, and plastic, enhancing the bonding and tensile properties between the fibers. This method is low in pollution but relatively high in energy consumption [25].
Straw fiber crushing differs from shredding in processing principles and crushing effects in physical–mechanical methods. Many types of crushers have been developed and put into production, and the technology is relatively mature, but none of them can obtain a satisfactory quality of straw fiber. The process of straw fiber pulverization is achieved by using abrasive wheels to rub, squeeze, and shear the material [26]. However, the shredding devices applicable to straw fiber shredding are deficient in terms of fiber shredding effect, mechanical structure, and power consumption. Conventional shredders cannot be adapted to the material properties of crop straw to obtain straw fibers that meet the requirements, and there are relatively few mechanical studies related to the physical methods of obtaining fibers from straw. In this study, a unique wet crop straw fiber crusher has been investigated through simulation and experimentation, resulting in easier fiber production, higher efficiency, higher fiber acquisition rates, and better fiber quality. It provides a reference for further development of straw products and related machinery.
2. Materials and Methods
2.1. Test Materials and Equipment
The experimental straw came from a farmer’s house in Longzi Village, Shilihe Town, Sujiatun District, Shenyang City, Liaoning Province. The variety was Jiufeng 9, the rice straw of the year. It was baled after natural drying in the field and crushed in the laboratory of Shenyang Agricultural University’s energy base by breaking the bale. The crusher was a 360-type multifunctional crusher produced by Shandong Taiyue Agricultural Machinery Co., Weifang, China. Other instruments and equipment included an electronic balance, feeler, photoelectric tachometer, electric blast drying oven, single-phase AC thyristor electronic governor, ultra-well-depth scanning microscope, and self-made straw fiber test sample mold.
2.2. Design and Simulation of Straw Fiber Crusher
2.2.1. Overall Design of Straw Fiber Crusher
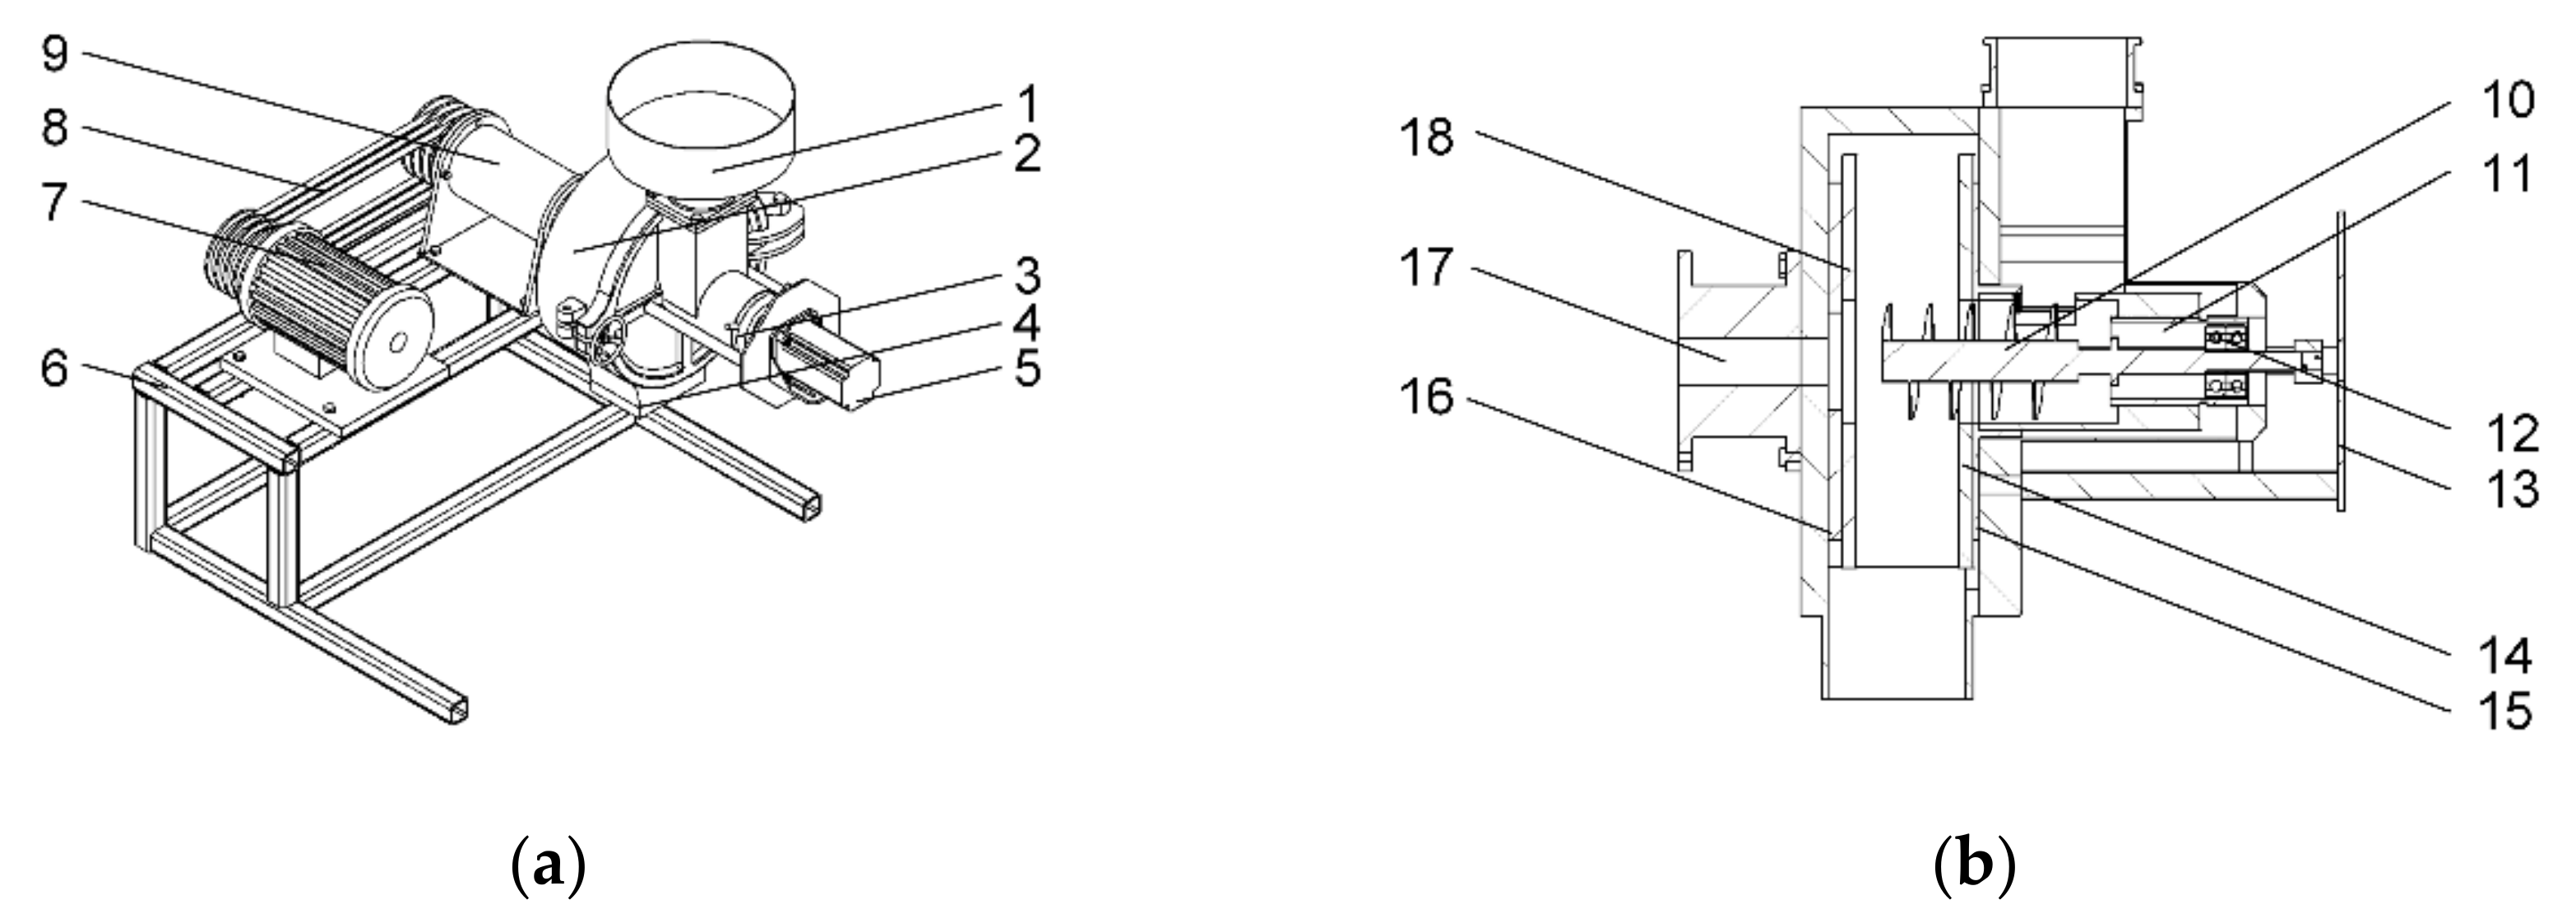
The straw fiber crusher’s basic structure was designed using SOLIDWORKS software, mainly consisting of a motor, grinding wheel, grinding wheel frame, grinding wheel gap adjustment device, spiral feeding shaft, etc. There are two motors: the spindle motor and the feeding speed control motor, as shown in Figure 1. After the gap is adjusted, the material is fed into the spiral feeding shaft (10) through the feed hopper (1), and the starter motor (7) transmits the power to the spindle (17) through the belt (8), which rotates and drives the left grinding wheel (18) fixed on the left grinding wheel frame (16) to rotate together. The starter motor (4) transmits the power to the screw feed shaft (10), which conveys the material to the crushing unit stably and continuously. The grinding wheel with concave and convex grooves uses the centrifugal principle to enhance the crushing effect on the straw material by shearing and squeezing so that the straw material is thoroughly crushed to achieve the purpose of crushing impact. The straw fiber is obtained from the discharge port (5).
2.2.2. Design of Grinding Wheel Clearance Adjustment Device
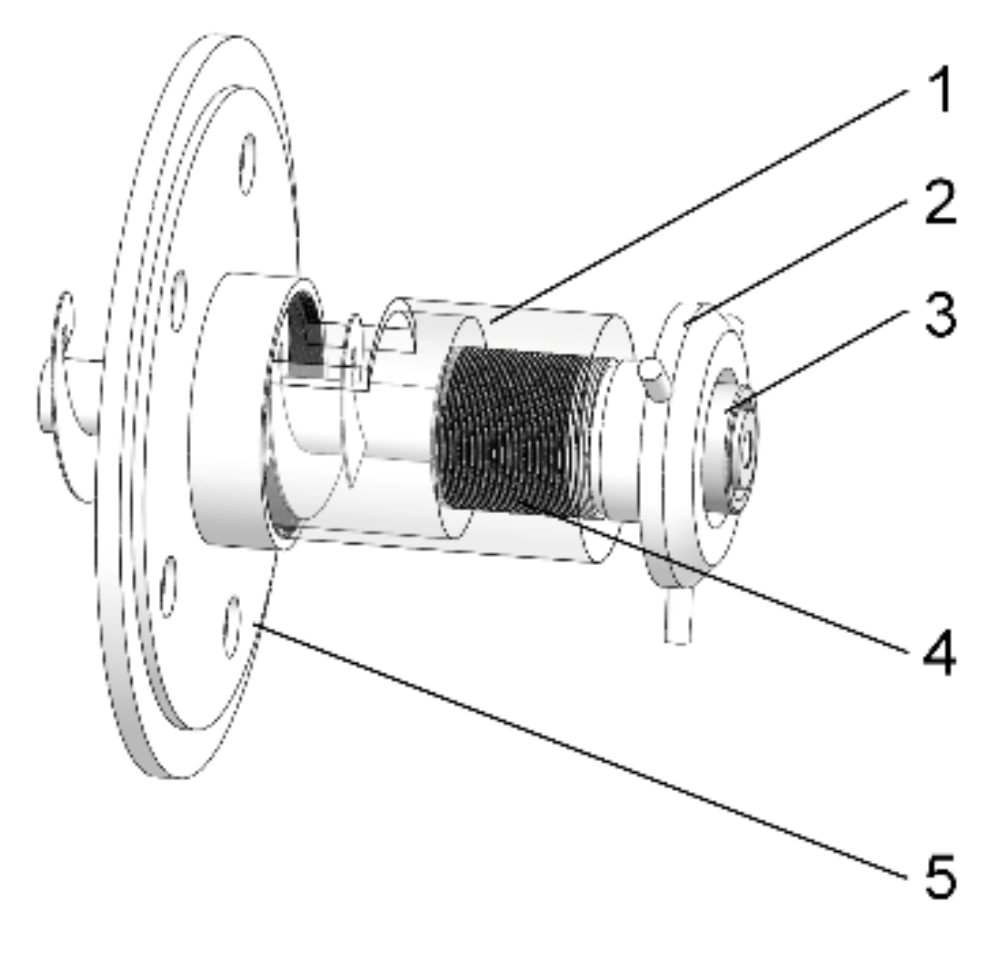
Straw materials require fine and moderate grinding, cutting, filing, and brushing, and the size of the grinding wheel clearance will have a significant impact on ensuring grinding quality. If the grinding wheel gap is too small, the phenomenon of touch grinding will occur, leading to grinding wheel wear, thus reducing the service life of the grinding wheel. The grinding wheel gap will affect the quality of the straw fiber. The grinding wheel gap adjustment device consists of a handle, a sleeve, a grinding wheel holder, and housing, as shown in Figure 2. The grinding wheel adjusting device uses the principle of a screw to drive the rotation of the small sleeve (3) by rotating the handle (2). The outer part of the small sleeve (3) and the inner part of the large sleeve (4) fit together by threads, and the screw changes the axial distance between the two grinding wheels to change the axial movement distance of the grinding wheel holder (5).
2.2.3. Construction of the Simulation Model
After the overall design of the straw fiber crusher was completed, the rationality of its design and the feasibility of material fiber crushing was verified. The process of straw fiber crushing was realized in a confined space, and conventional tests cannot visualize the movement of the material inside the closed container. They cannot analyze the material transport and crushing process. Therefore, using discrete element simulation, the trajectory of the particles can be analyzed accurately and efficiently. The movement of the material inside the vessel can be seen more visually and clearly through images to verify the rationality and feasibility of the device design [27,28]. The model parameters set for the simulation are shown in Table 1.
2.3. Straw Fiber Prepartion and Test Procedure
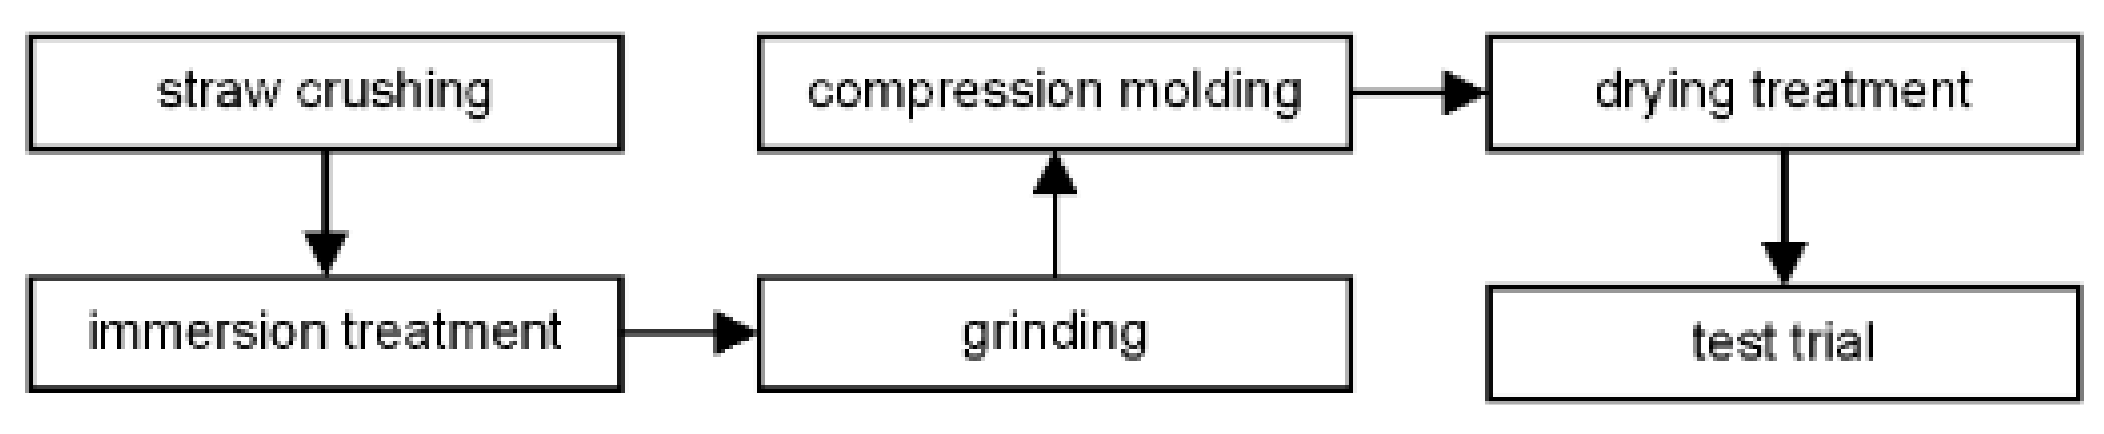
The straw fiber preparation in this study was entirely physical, with no chemical treatment process. In order to improve the quality of straw fiber, the straw fiber was pre-soaked for 12 h before crushing using the straw fiber; the specific straw fiber preparation and testing process is shown in Figure 4.
2.4. Selection of Experimental Factors
Based on the single-factor test, the Central Composite experimental design was carried out by determining the spindle grinding wheel speed, screw feeding shaft speed, and grinding wheel clearance as the test factors according to the design principle of Design-Expert 13. The factors and level codes are shown in Table 2. The grinding wheel speed was controlled by a frequency converter and measured by the photoelectric tachometer (Model: VICTOR6234P, range: 10~99,999 r/min, manufacturer: Shenzhen Yisheng Shengli Technology Co., Ltd., Shenzhen, China). Electronic speed regulator knob accompanying the AC motor (Model: DADR-4000, manufacturer: Shanghai Wenfu Electric Co., Ltd., Shanghai, China) controlled the spiral feed shaft speed. The adjustment of the grinding wheel clearance is realized by the feeler (Model: DL9504, range 0.02~1 mm, manufacturer: Deli Group Co., Ltd., Ningbo, China) with the grinding wheel clearance adjustment device.
2.5. Straw Fiber Evaluation Method
2.5.1. Straw Fiber Tensile Index
The evaluation indicators of straw fiber preparation are generally productivity, fiber yield, fiber aspect ratio, and tensile index [30,31]. The quality of straw fiber can be judged by visual observation. However, it is still not easy to evaluate with quantitative indicators, generally using the fiber aspect ratio, with the optical microscope method (GB/T10336-1989) to measure and calculate the fiber aspect ratio. This method is less efficient and less accurate. In addition, the standard has been replaced by the (GB/T10336-2002) polarized light method to determine the length of paper fibers. In this study, drawing on the Determination of Tensile Strength of Paper and Paperboard (GB/T453-1989), the prepared straw fibers were extruded with a mold and then dried, and then the specimens were prepared. Then, the tensile index was determined with a universal tensile tester to characterize the mechanical strength of the straw fibers. As determined by the test, within a specific range, the greater the aspect ratio of straw fiber, the better the quality and the greater the tensile index; these observations serve as an indirect evaluation of the quality of straw fiber. Here, we define the formula for the tensile index of the straw fiber specimen:
where
- Y is tensile strength index, N·m·g−1;
- F is pattern tensile strength, N;
- Ls is pattern width, cm;
- s is pattern thickness, cm;
- g is volumetric weight, g/cm3.
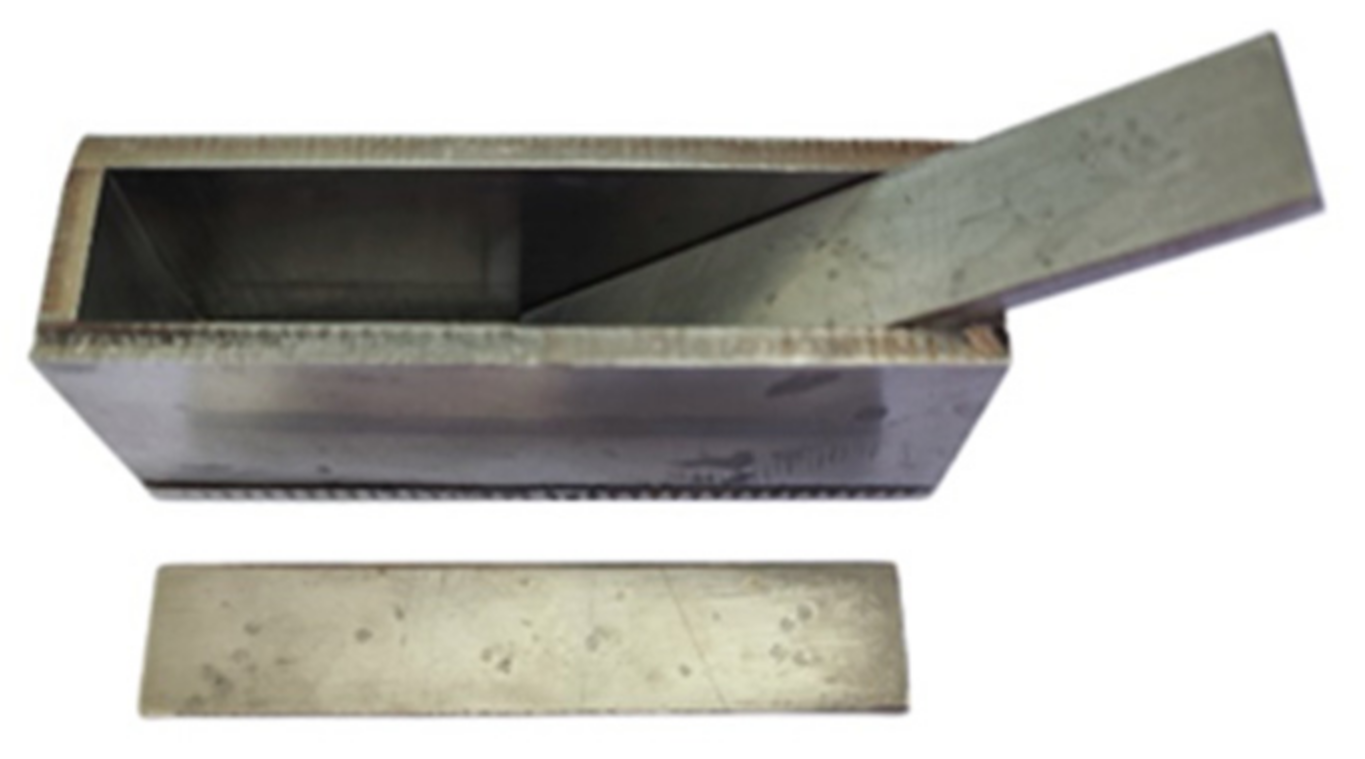
The processed straw fiber was put into the homemade mold; the mold is made of 304 stainless steel, welded by laser cutting, and the internal dimensions are 100 × 20 × 30 mm, as shown in Figure 5. We weighed the same mass of fiber on an electronic balance (Model: CP423S, measurement accuracy: 0.01 g, manufacturer: Beijing Sartorius Balance Company, Beijing, China). The bottom plate and the upper plate were filled with material, with a weight of 20 kg through the support block acting on the material. Water was drained naturally, holding pressure after 6 min to remove the sample. The sample was then placed in an electric blast drying oven (Model: 101-LES, manufacturer: Beijing Yongguangming Medical Instrument Co., Ltd., Beijing, China) to dry for more than 12 h, when the quality no longer changed and the moisture content was 20% below, conduct the tensile test. After the tensile test, we recorded the test results.
2.5.2. Straw Fiber Pore Channel Coefficient Ratio
The specimens prepared under different test conditions were cut with a blade and scanned with an ultra-well-depth scanning microscope (Model: VHX-5000, manufacturer: KYENCE (CHINA) Co., Ltd., Shanghai, China). The scanned images were binarized with MATLAB to show the pore channels according to gray levels. The specimens’ unit area and pore coefficient characteristics were analyzed to establish the connection between the tensile indices of fiber specimens of different masses and the image pore model, and the pore coefficient ratio was defined in conjunction with the pore model. The pore coefficient ratio is shown in Equation (2).
where
- P is specimen pore coefficient ratio;
- St is specimen image area, cm2;
- Sp is pore area of specimen, cm2.
3. Results and Analysis
3.1. Simulation Analysis of Straw Fiber Crushing Process
3.1.1. Particle Distribution during Straw Fiber Crushing
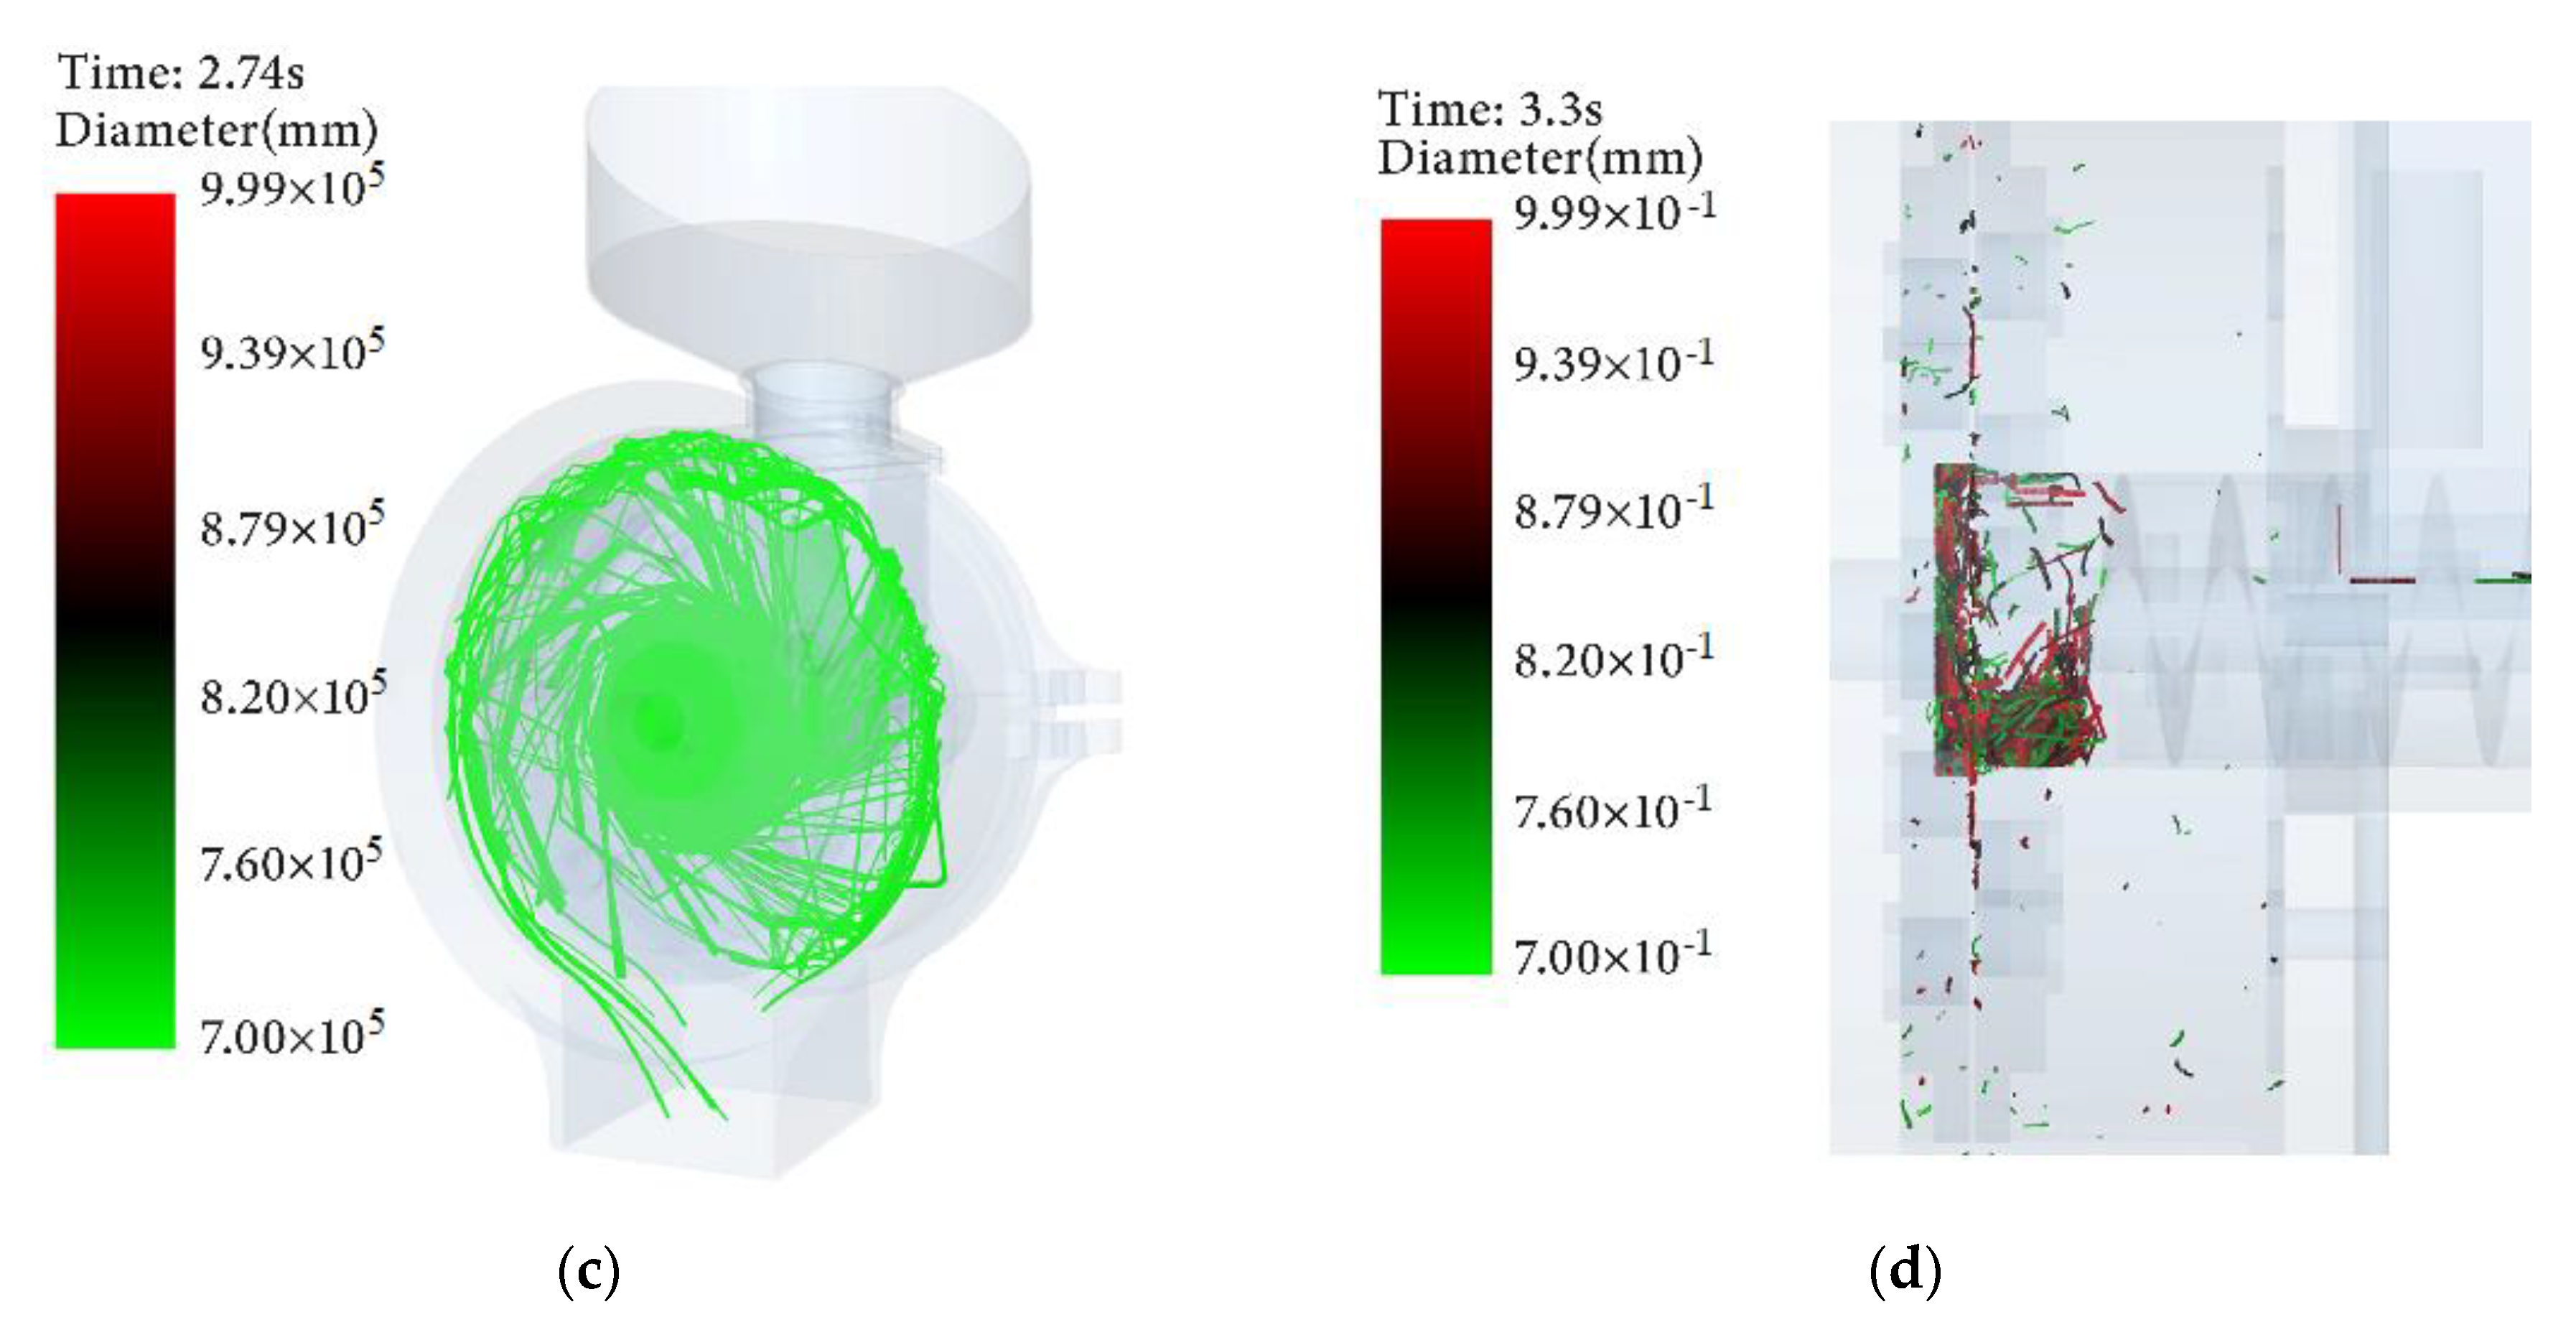
The results of the simulation are shown in Figure 6. Under the action of material screw shaft conveying, the straw material particles continuously move laterally within the conveying device and gradually fill into the crushing device under the action of screw thrust (as shown in Figure 6a) for the particle size distribution of the material particles at t = 2.9 s. The size of straw material particles is relatively large, so under the action of the grinding wheel, different trajectories are produced due to different force positions; this is coupled with the straw material particles having a specific space for movement and the friction between the straw material and the inner wall of the shell. The grinding wheel on the left side interacts with the grinding wheel on the right side; when the straw material is in contact with the grinding wheel in motion, frictional and centrifugal forces are generated due to the high-speed rotation of the grinding wheel, thus achieving the crushing effect. This process is repeated for some time until the straw material particles have been completely crushed, as shown in Figure 6b. At t = 2.74 s, the trajectory of the straw material particles is continuous, as shown in Figure 6c,d. It can be seen that the movement of the material is not affected by the direction of the fabric close to it, which indicates that the high-speed rotating grinding wheel strengthens the crushing effect on the straw material particles. The straw fiber crusher is reasonably designed, so it can realize the purpose of entirely crushing the material.
3.1.2. Particle Velocity Distribution during Straw Fiber Crushing
After 2.9 s and 3.3 s of the action of the grinding wheel, the images in Figure 7a,b show that the speed distribution of the material in the straw material crushing device is different. The material at the center of the grinding wheel moves at the fastest speed, and the straw material at other positions moves at a rate lower than the center of rotation. Thus, it can be seen that the material is moving axially in the crushing device, and the high-speed rotating grinding wheel enhances the machine’s crushing strength. Under the action of the grinding wheel, the movement speed of most materials will be infinitely close to the linear speed of the grinding wheel, thus forming a circular flow around the grinding wheel. As can be seen from the figure, the proportion of high-speed movement of the material is tiny, so the material in the center of the grinding wheel is strongly broken, and the speed of the material gradually becomes tinier under the action of the grinding wheel. When it reaches the highest point, under the effect of gravity, it falls to the bottom discharge to complete the crushing process.
3.2. Straw Fiber Crushing Test Results and Analysis
Referring to the national standard GB/T6971-2007 “feed crusher test method” in China, the degree output was selected as the efficiency evaluation index of the straw fiber crusher. The tensile index is the test’s evaluation index of straw fiber quality. The test results are shown in Table 3.
The regression analysis results of the degree of power yield are shown in Table 4. From the results of the analysis, it can be seen that the model designed with Central Composite has an F-value of 131.83, a p-value < 0.0001, and a correlation coefficient R2 value of 0.9841, indicating that the response surface model is significant. From the significance analysis of the two factors, it can be seen that the interaction of test factor A (grinding wheel speed) and test factor C (grinding wheel clearance) had a highly significant effect on the degree output (p = 0.0006 < 0.01), and the interaction of test factor B (spiral shaft speed) and test factor C (grinding wheel clearance) had a significant effect on the degree output (p = 0.0418 < 0.05), indicating that the larger the grinding wheel clearance, the higher the wheel gap, the greater the amount of material entering the grinding wheel, and thus, the higher the kW·h output. However, there is also a specific influence of the spiral shaft speed if it is slow: the feeding amount is not enough, thereby reducing the machine’s efficiency.
Quadratic polynomial regression was fitted to the kW·h output response value data to obtain a ternary quadratic regression equation with grinding wheel speed (A), spiral shaft speed (B), and grinding wheel clearance (C) as independent variables. In the equation, a larger coefficient indicates a more pronounced effect on the response value; the C factor has the most significant effect on the kW·h yield, followed by the A factor and then the B factor.
Y = 45.53 + 2.15A + 0.8194B + 3.38C − 0.075AB − 0.08AC − 0.375BC − 0.4506A2 − 0.1678B2 − 0.7512C2
3.2.1. Experimental Results and Analysis of Power Output in kW·h
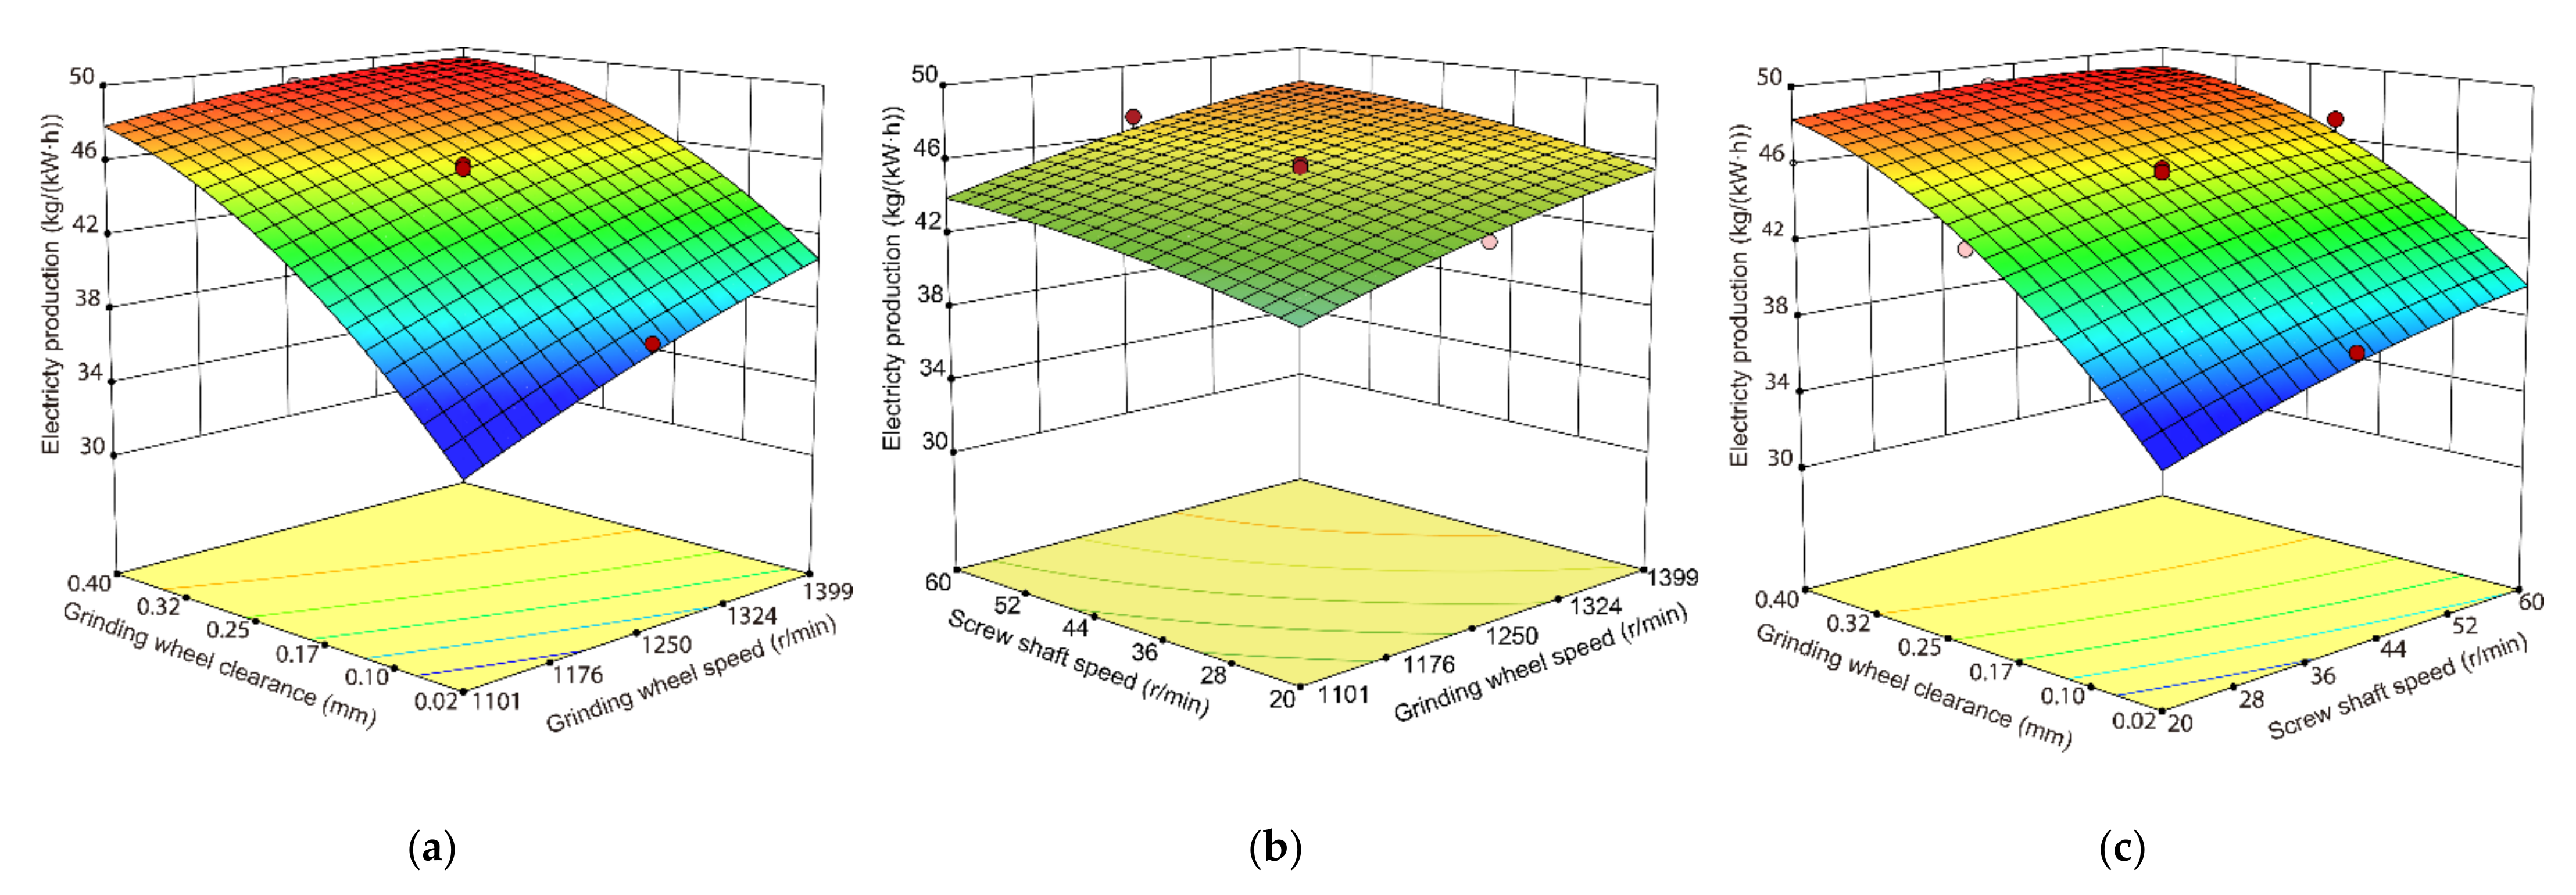
According to this ternary quadratic regression equation, the response surface is plotted in the statistical region. The zero level of one of the factors is selected to observe the interaction effect of the other two factors on the kW·h yield, respectively, as shown in Figure 8. It can be seen from the figure that the kWh output increases with the increase in wheel gap and increase in wheel speed, and the response surface changes significantly. In contrast, in Figure 8b, the kW·h output does not change significantly with the increases in spiral shaft speed and wheel speed, reflecting that too much material is being fed and cannot enter the wheel gap, so the kW·h output does not improve significantly.
3.2.2. Experimental Results and Analysis of Tensile Index of Straw Fiber
The regression analysis results of the straw fiber tensile index are shown in Table 5. The analysis results show that the F-value of the model designed with the Central Composite test is 21.81, with a p-value < 0.0001 and a correlation coefficient R2 value of 0.7667, indicating that the response surface model is significant. The interaction of the two factors did not affect the tensile index of the straw fiber. The effect of the test factor C grinding wheel clearance on the tensile index of straw fiber was highly significant, indicating that within a specific range, the smaller the grinding wheel clearance, the better the degree of straw fiber crushing and the better the quality of straw fiber obtained. However, too small a grinding wheel clearance will affect the degree of power production.
3.2.3. Experimental Optimization and Validation
According to the principle of response surface optimization, the three factors were optimized and analyzed using Design-Expert 13. The stable points of the software optimization results were (1250, 40, 0.21). The kWh yield reached the theoretical value of 45.8 kg/(kW·h); i.e., the grinding wheel speed was 1250 r·min−1, the spiral feed shaft speed was 40 r·min−1, and the grinding wheel clearance was 0.21 mm, which could maximize the kW·h yield and the tensile index of the straw fiber. The obtained tensile index of straw fiber could reach 112.5 N·m·g−1.
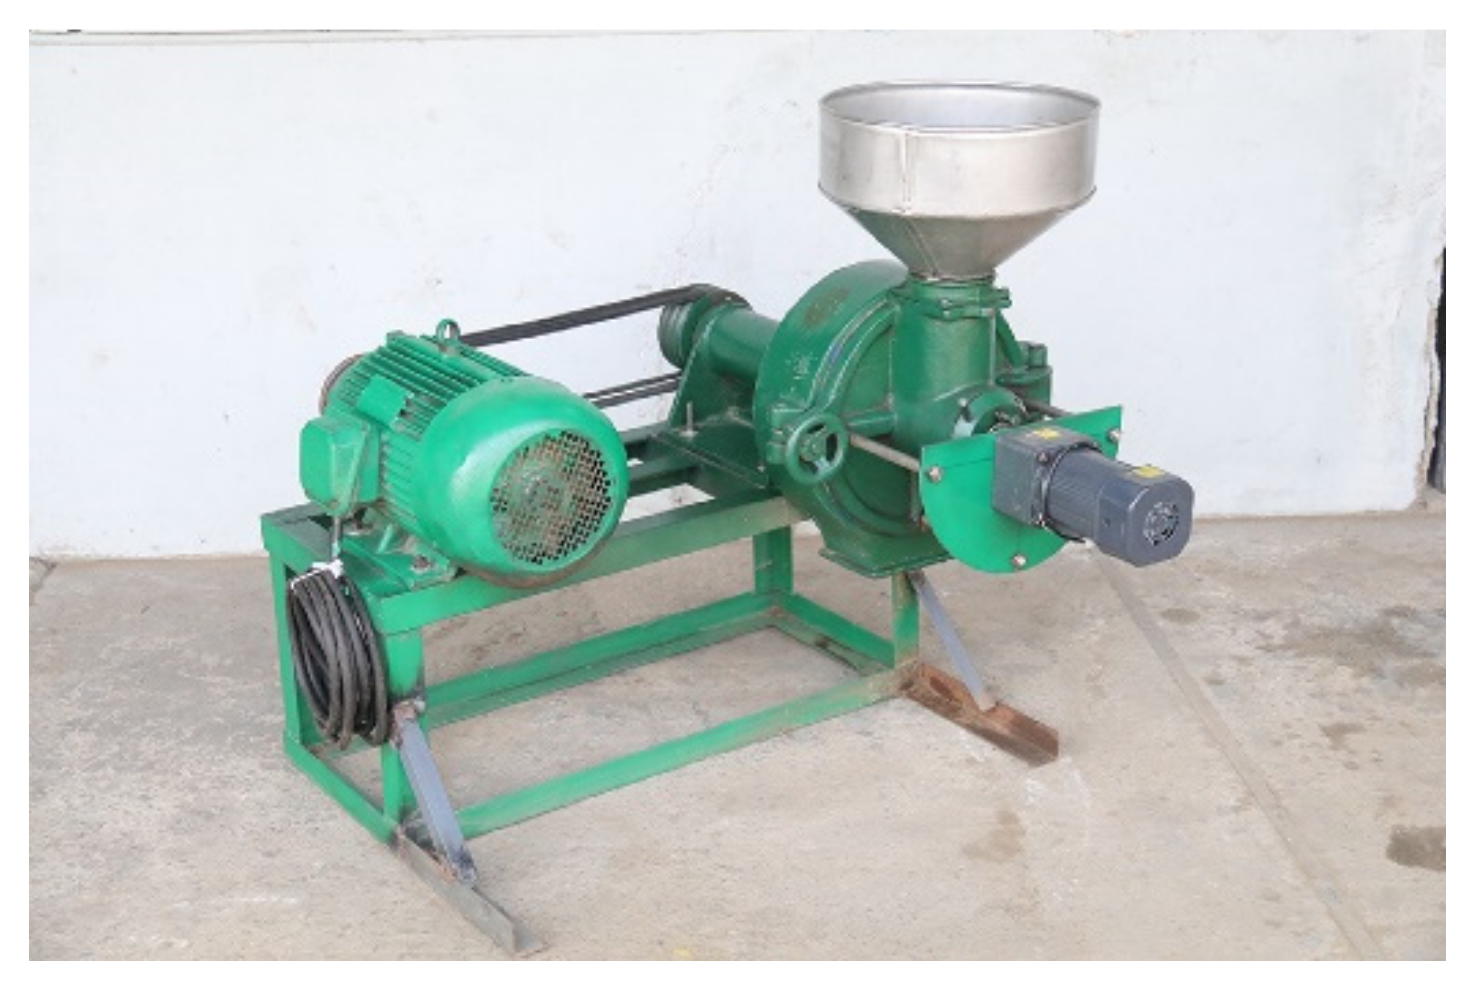
According to the design of the experimental prototype of the rice straw fiber crusher, as shown in Figure 9, the response surface optimization results were analyzed in a validation test. The mechanical parameters were adjusted to 1250 r·min−1 grinding wheel speed, 40 r·min−1 spiral feeding shaft speed, and 0.21 mm grinding wheel clearance. The average kW·h output was 41.6 kg/(kW·h) after five repetitions of the test, and the obtained average tensile index of the straw fiber was 110.45 N·m·g−1.
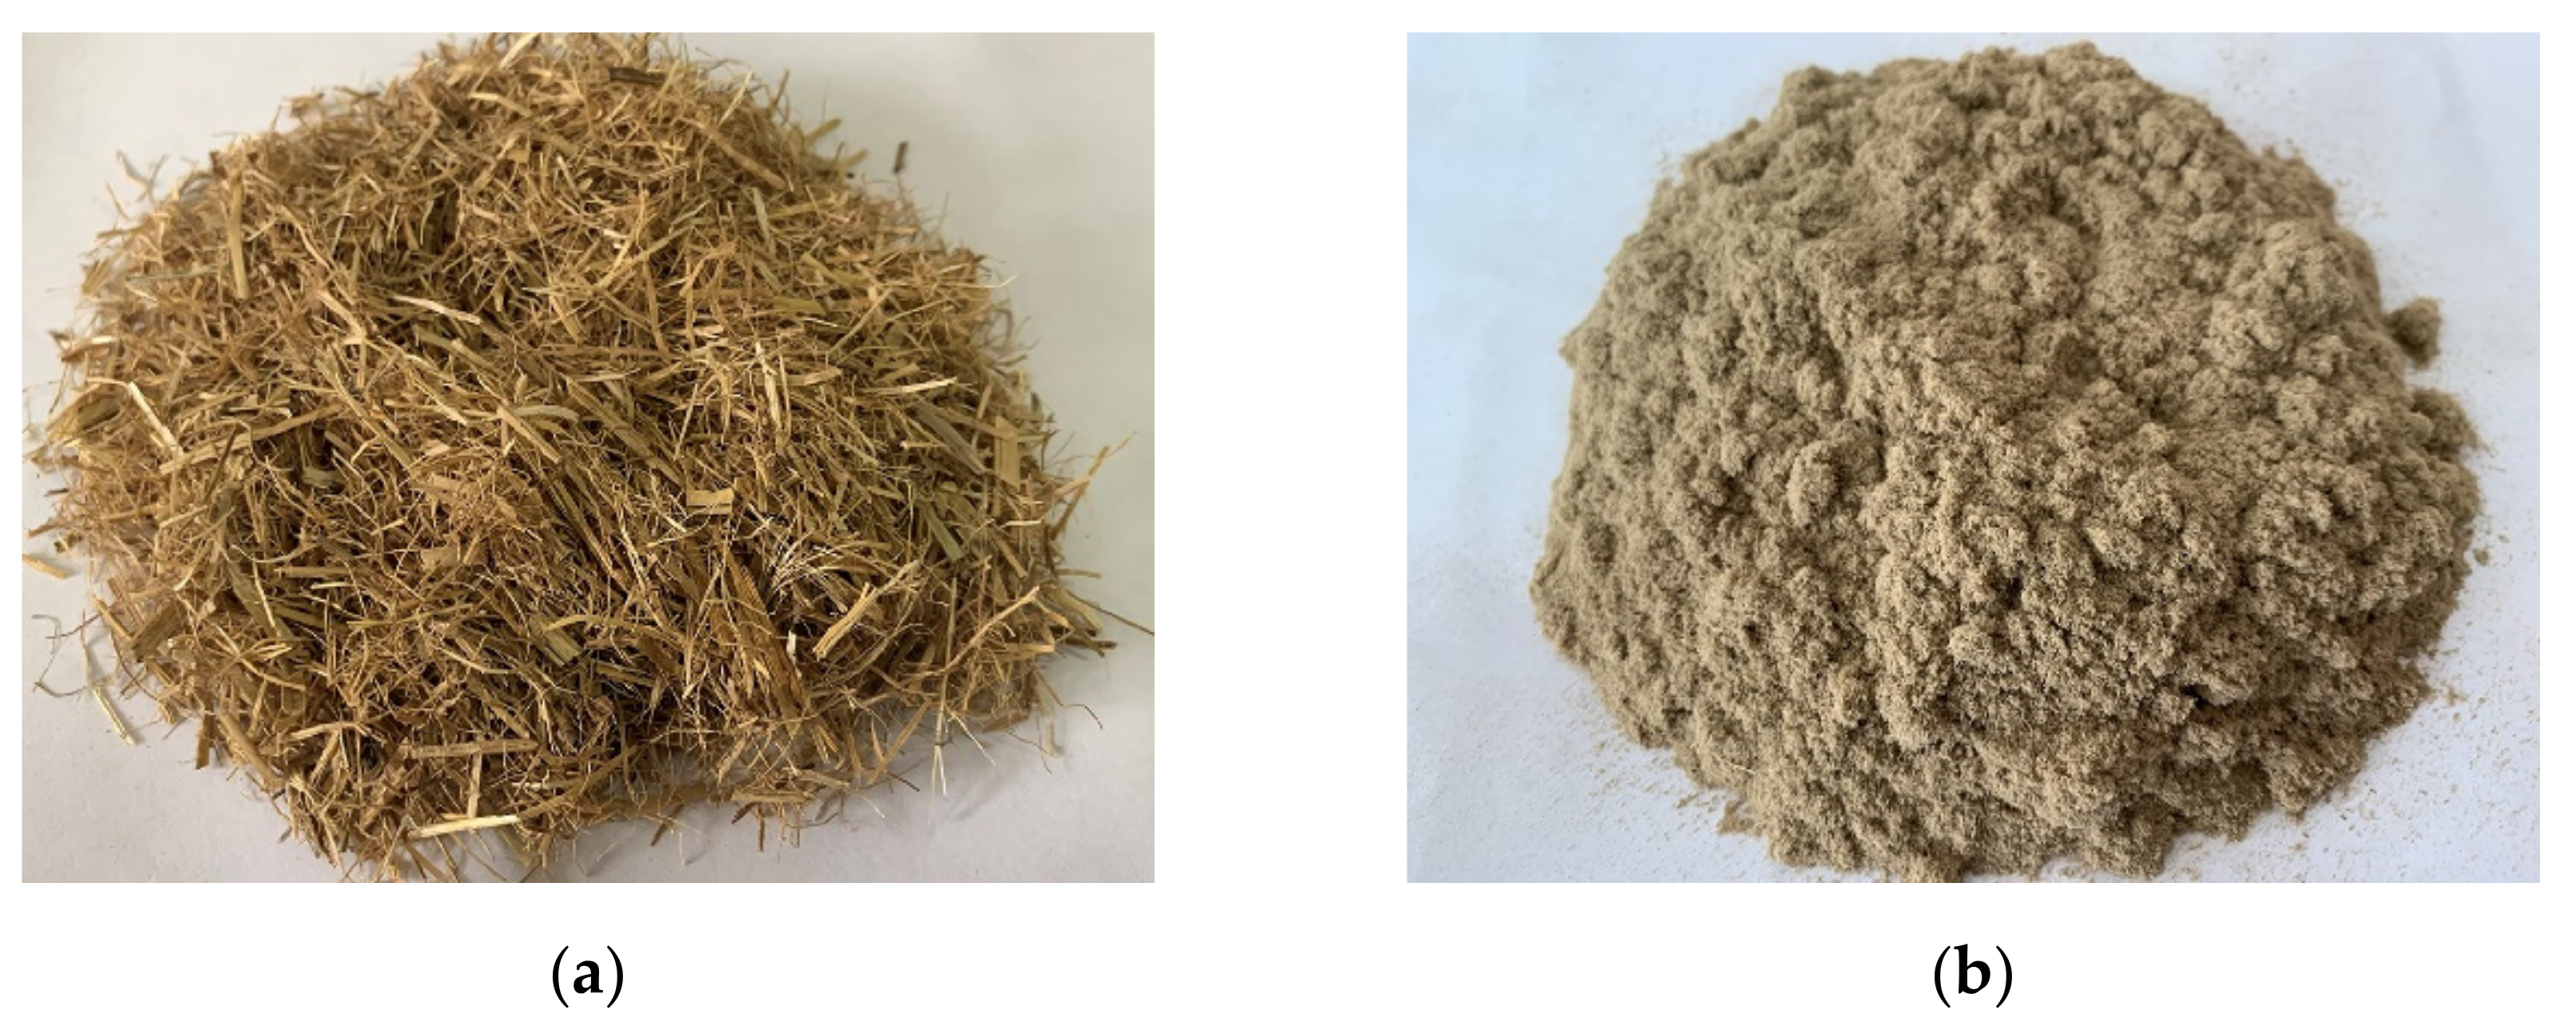
The optimized value of the average tensile index of straw fiber is close to the test value, and the reason for the large error in the kW·h yield is that some straw fibers will be attached to the inner wall of the machine cavity during the work, and the residue is more significant at the start, thus affecting the kWh yield, but when the machine continues to work steadily, this phenomenon is obviously reduced, and then this error is within a reasonable and controllable range. The machine can obtain the maximum power output and the highest tensile index when the grinding wheel speed is 1250 r·min−1, the spiral feed shaft speed is 40 r·min−1, and the grinding wheel clearance is 0.21 mm. The test sample machine crushed rice straw to obtain rice straw fiber, as shown in Figure 10’s before and after crushing contrast: before crushing rice straw for silk and fragmentation, after grinding rice straw fiber for powder and flocculent.
3.3. Straw Fiber Quality Evalution Analysis
3.3.1. Effect of Straw Fiber Tensile Index on Fiber Quality
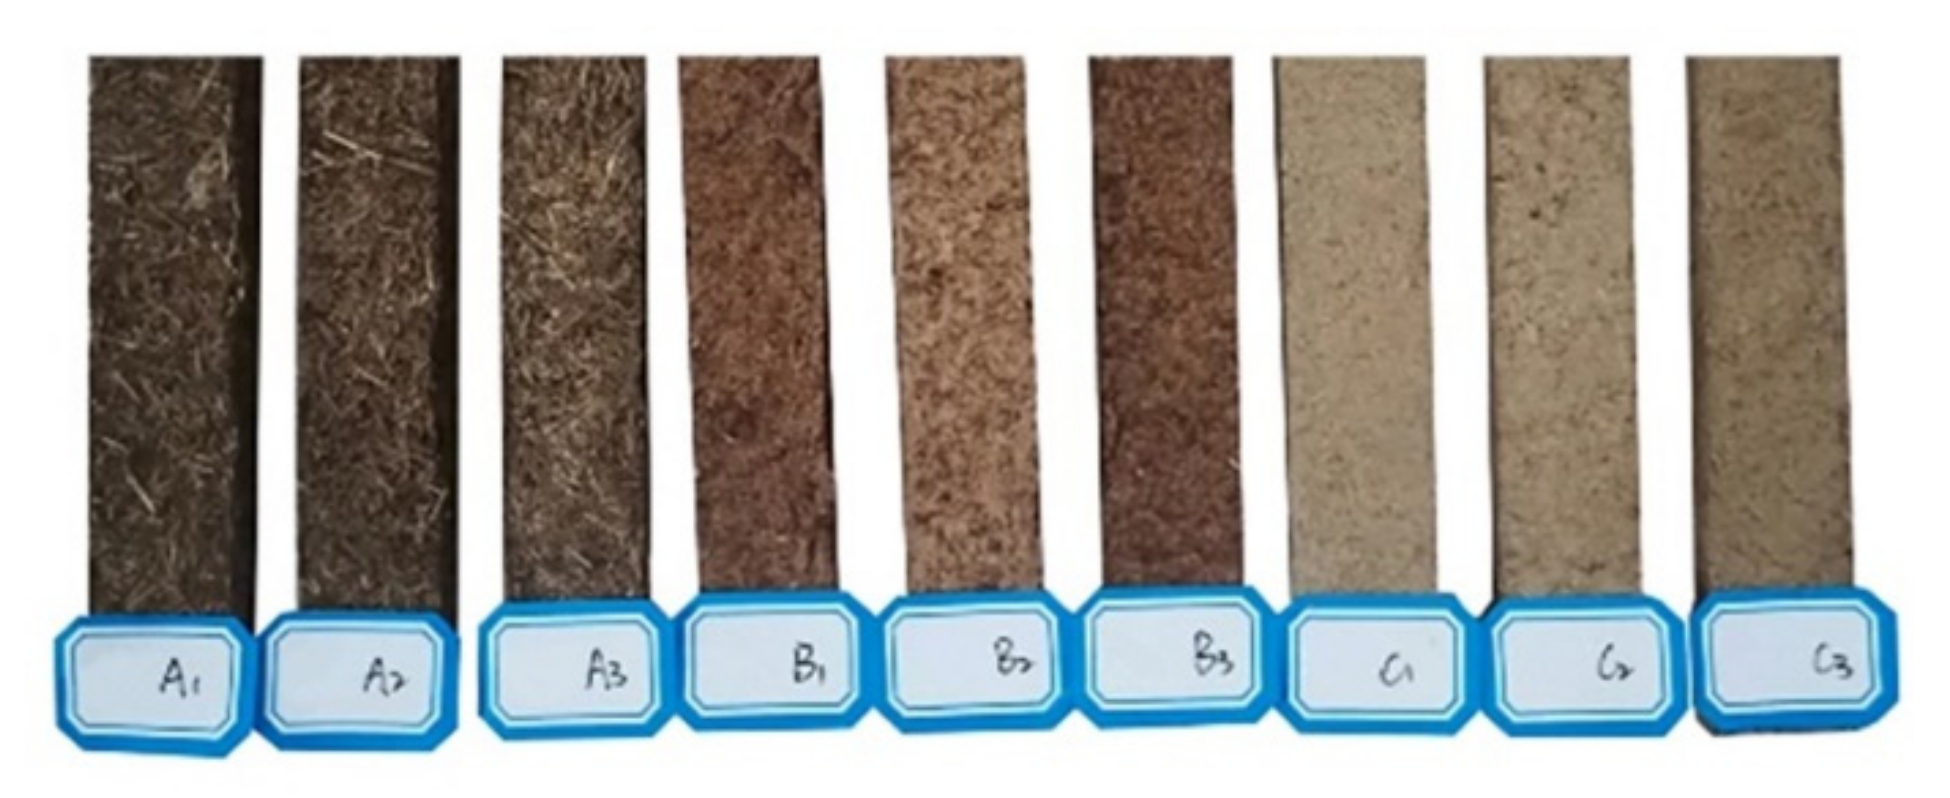
The straw fiber test specimen is shown in Figure 11. A total of three different sets of straw fiber specimens were produced. A constant grinding wheel speed of 1250 r·min−1 and a constant screw shaft speed of 40 r·min−1 were set. The straw fibers used in the A1, A2, and A3 specimens were obtained with a grinding wheel clearance of 0.40 mm. B1, B2, and B3 specimens were obtained with a grinding wheel clearance of 0.32 mm. The straw fibers used in C1, C2, and C3 specimens were obtained with a grinding wheel clearance of 0.21 mm. In order to avoid errors, the mean values for each group of indicators were taken for the analysis.
The calculated average straw fiber tensile index for Group A specimens was 70.2 N·m·g−1, the average straw fiber tensile index for Group B specimens was 85.9 N·m·g−1, and the average straw fiber tensile index for Group C specimens was 112.5 N·m·g−1. From the characterization of the test specimens, it can be seen that the surface of the test specimens made of Group A fibers is relatively rough, and the fiber particles are significant. The surface of the test specimens made of Group C fibers is rather delicate, and the fiber particles are small. The surface condition and particle size of Group B are in between. From this, it can be tentatively concluded that the fiber quality of the test specimens in group C is better than those of the test specimens in groups A and B.
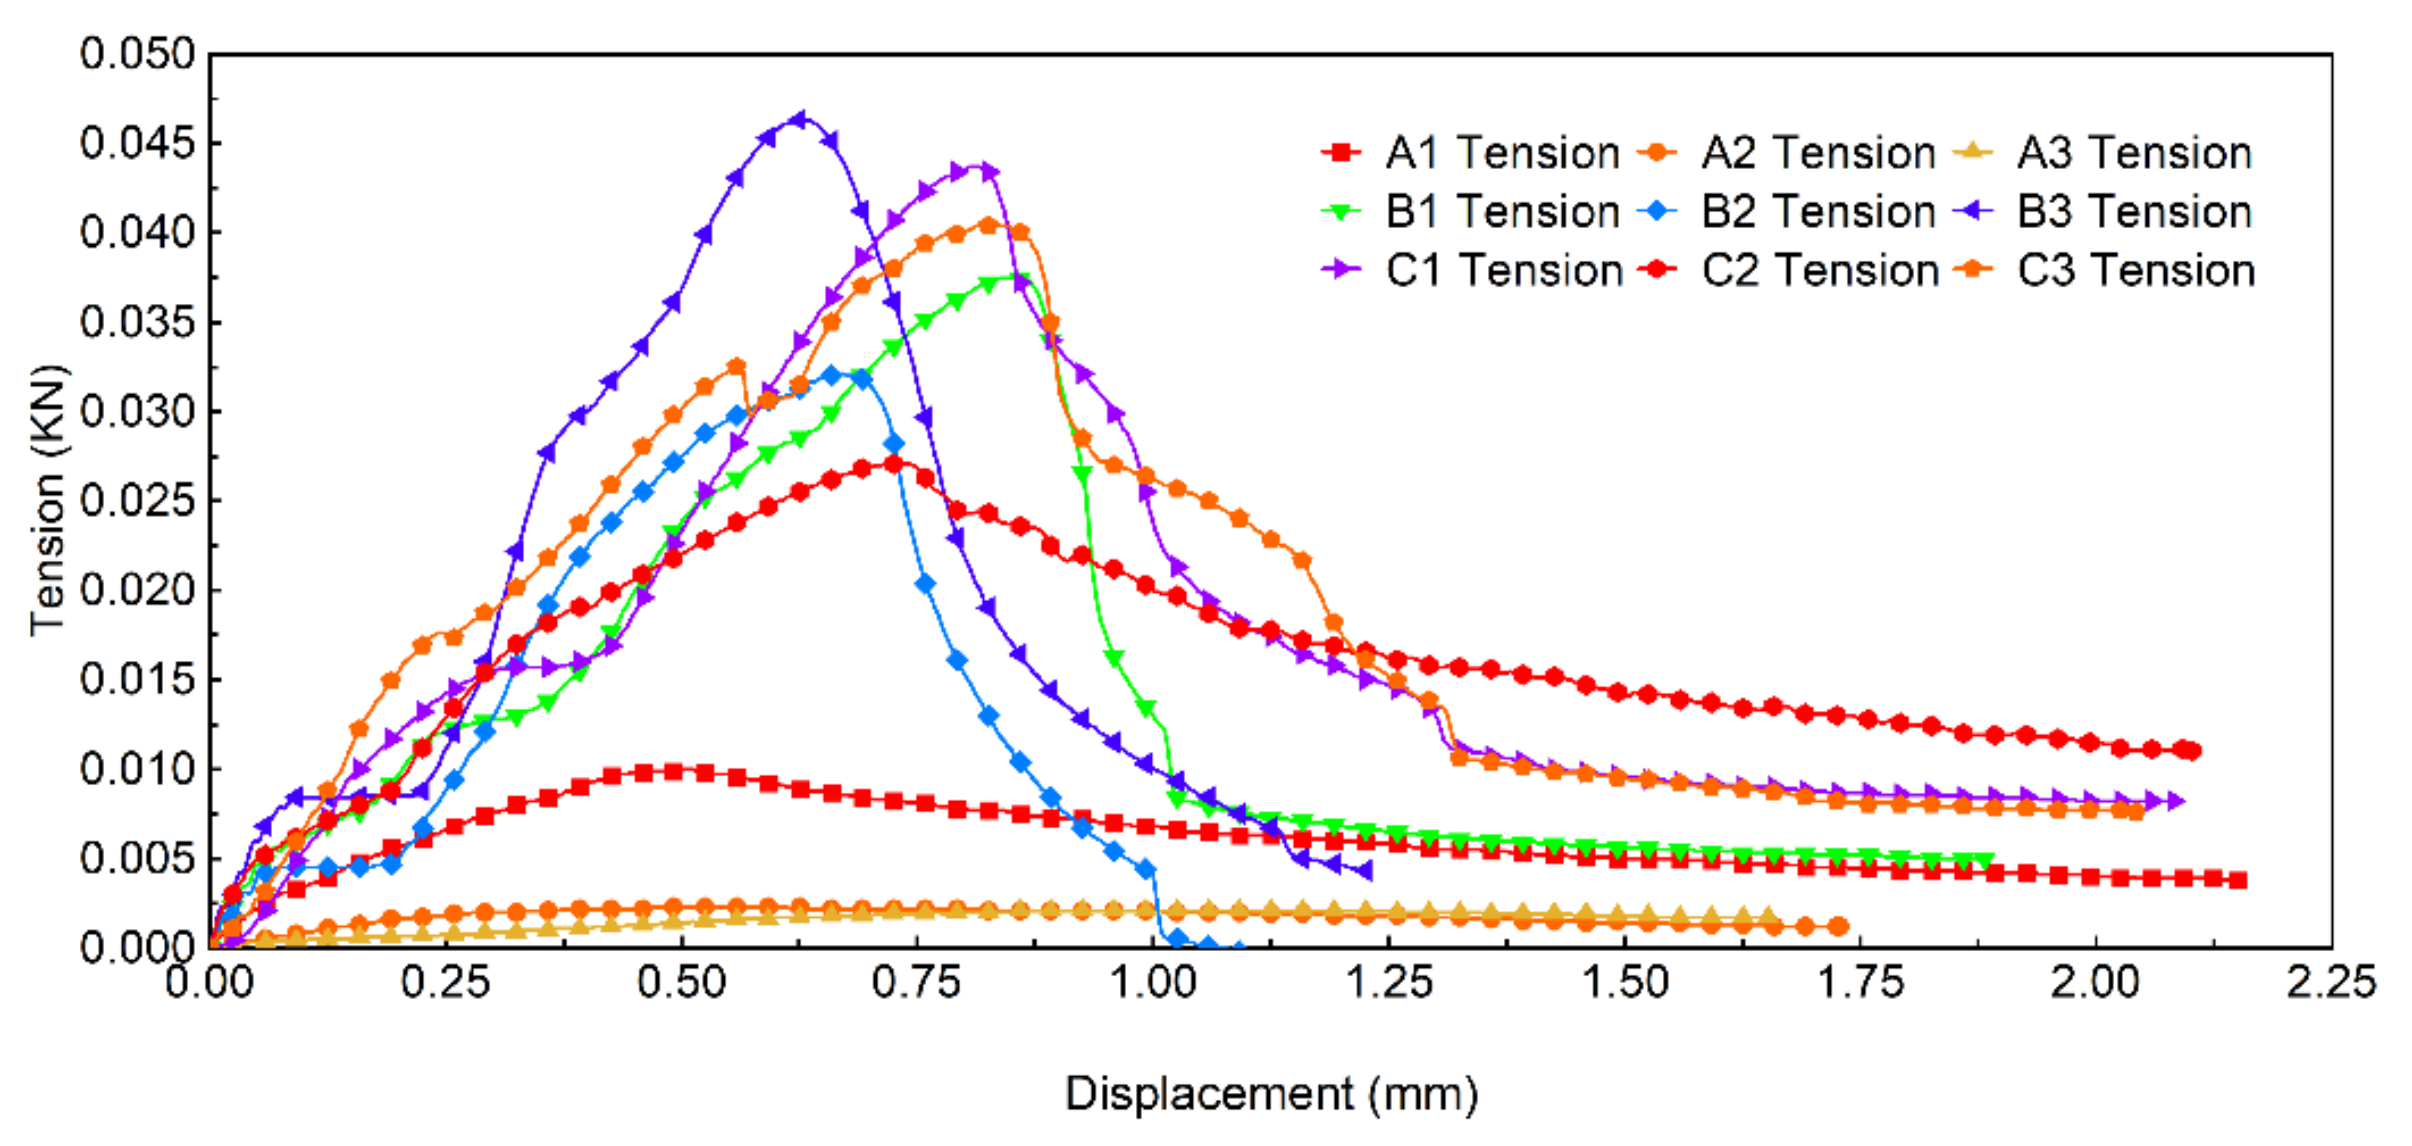
The relationship between tensile fracture force and displacement of a straw fiber specimen is shown in Figure 12.
The relationship between force and displacement at tensile fracture shows that the test sample of group A broke when the tensile displacement was 0.45~0.85 mm, and the average maximum tensile force it could bear was 0.0048 kN. The test sample of group B broke when the tensile displacement was 0.55~0.85 mm, and the average maximum tensile force is could bear was 0.0386 kN. The test sample of group C borke when the tensile displacement was 0.75~0.85 mm, and the average maximum tensile force it could bear was 0.0371 kN. When the bit tensile displacement was fixed at 0.80 mm, the average maximum tensile force on the test specimen in group A was 0.0073 kN, that for group B was 0.0244 kN, and that for group C was 0.0360 kN. Judging by the displacement of the straw test specimens and the maximum tensile force they could withstand, the quality of the fibers in group C was better than the quality of the fibers in groups A and B. The results show that the greater the tensile force that the straw test specimen can withstand when it is displaced, the better the toughness and strength of the straw fiber specimen, which means the better the quality of the straw fiber.
3.3.2. Effect of Pore Channel Coefficient Ratio on Fiber Quality
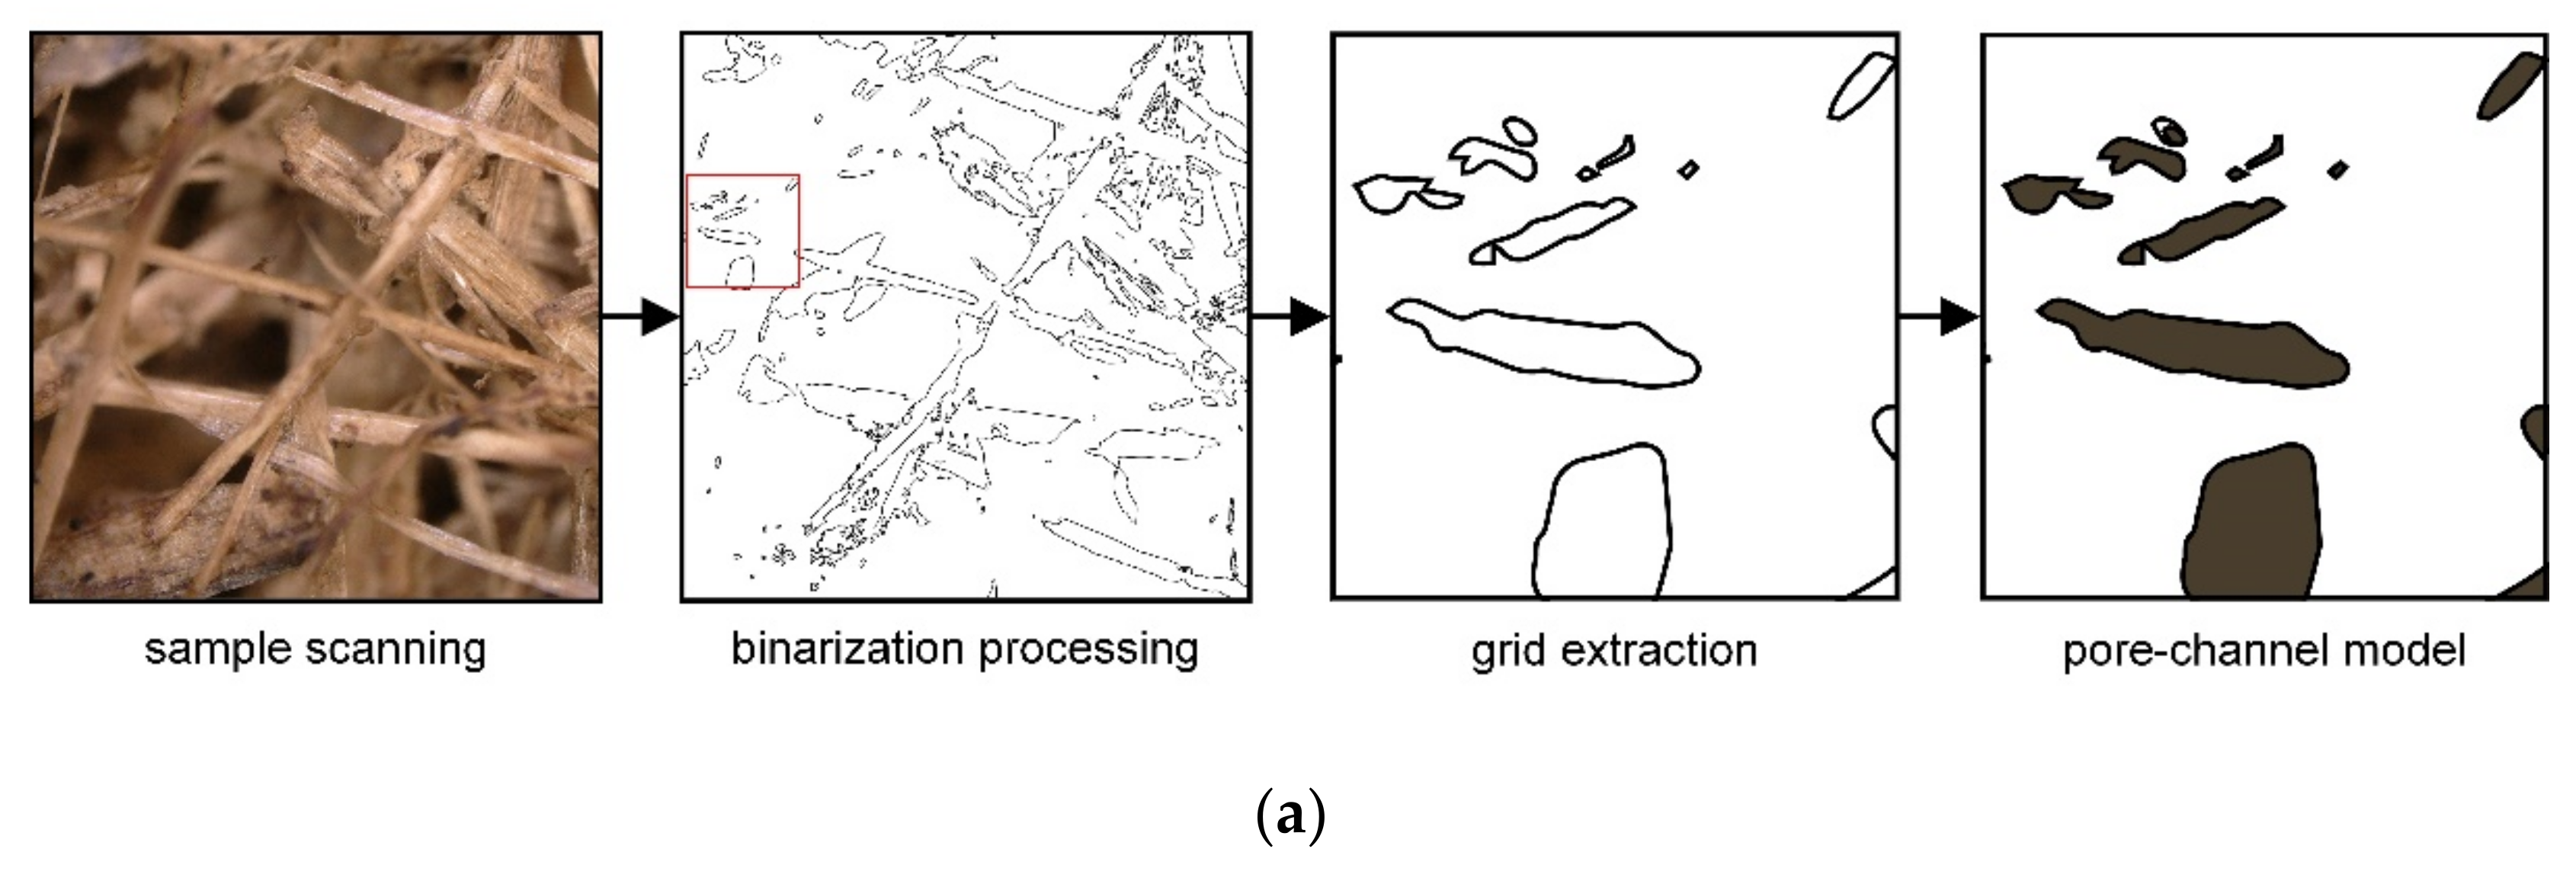
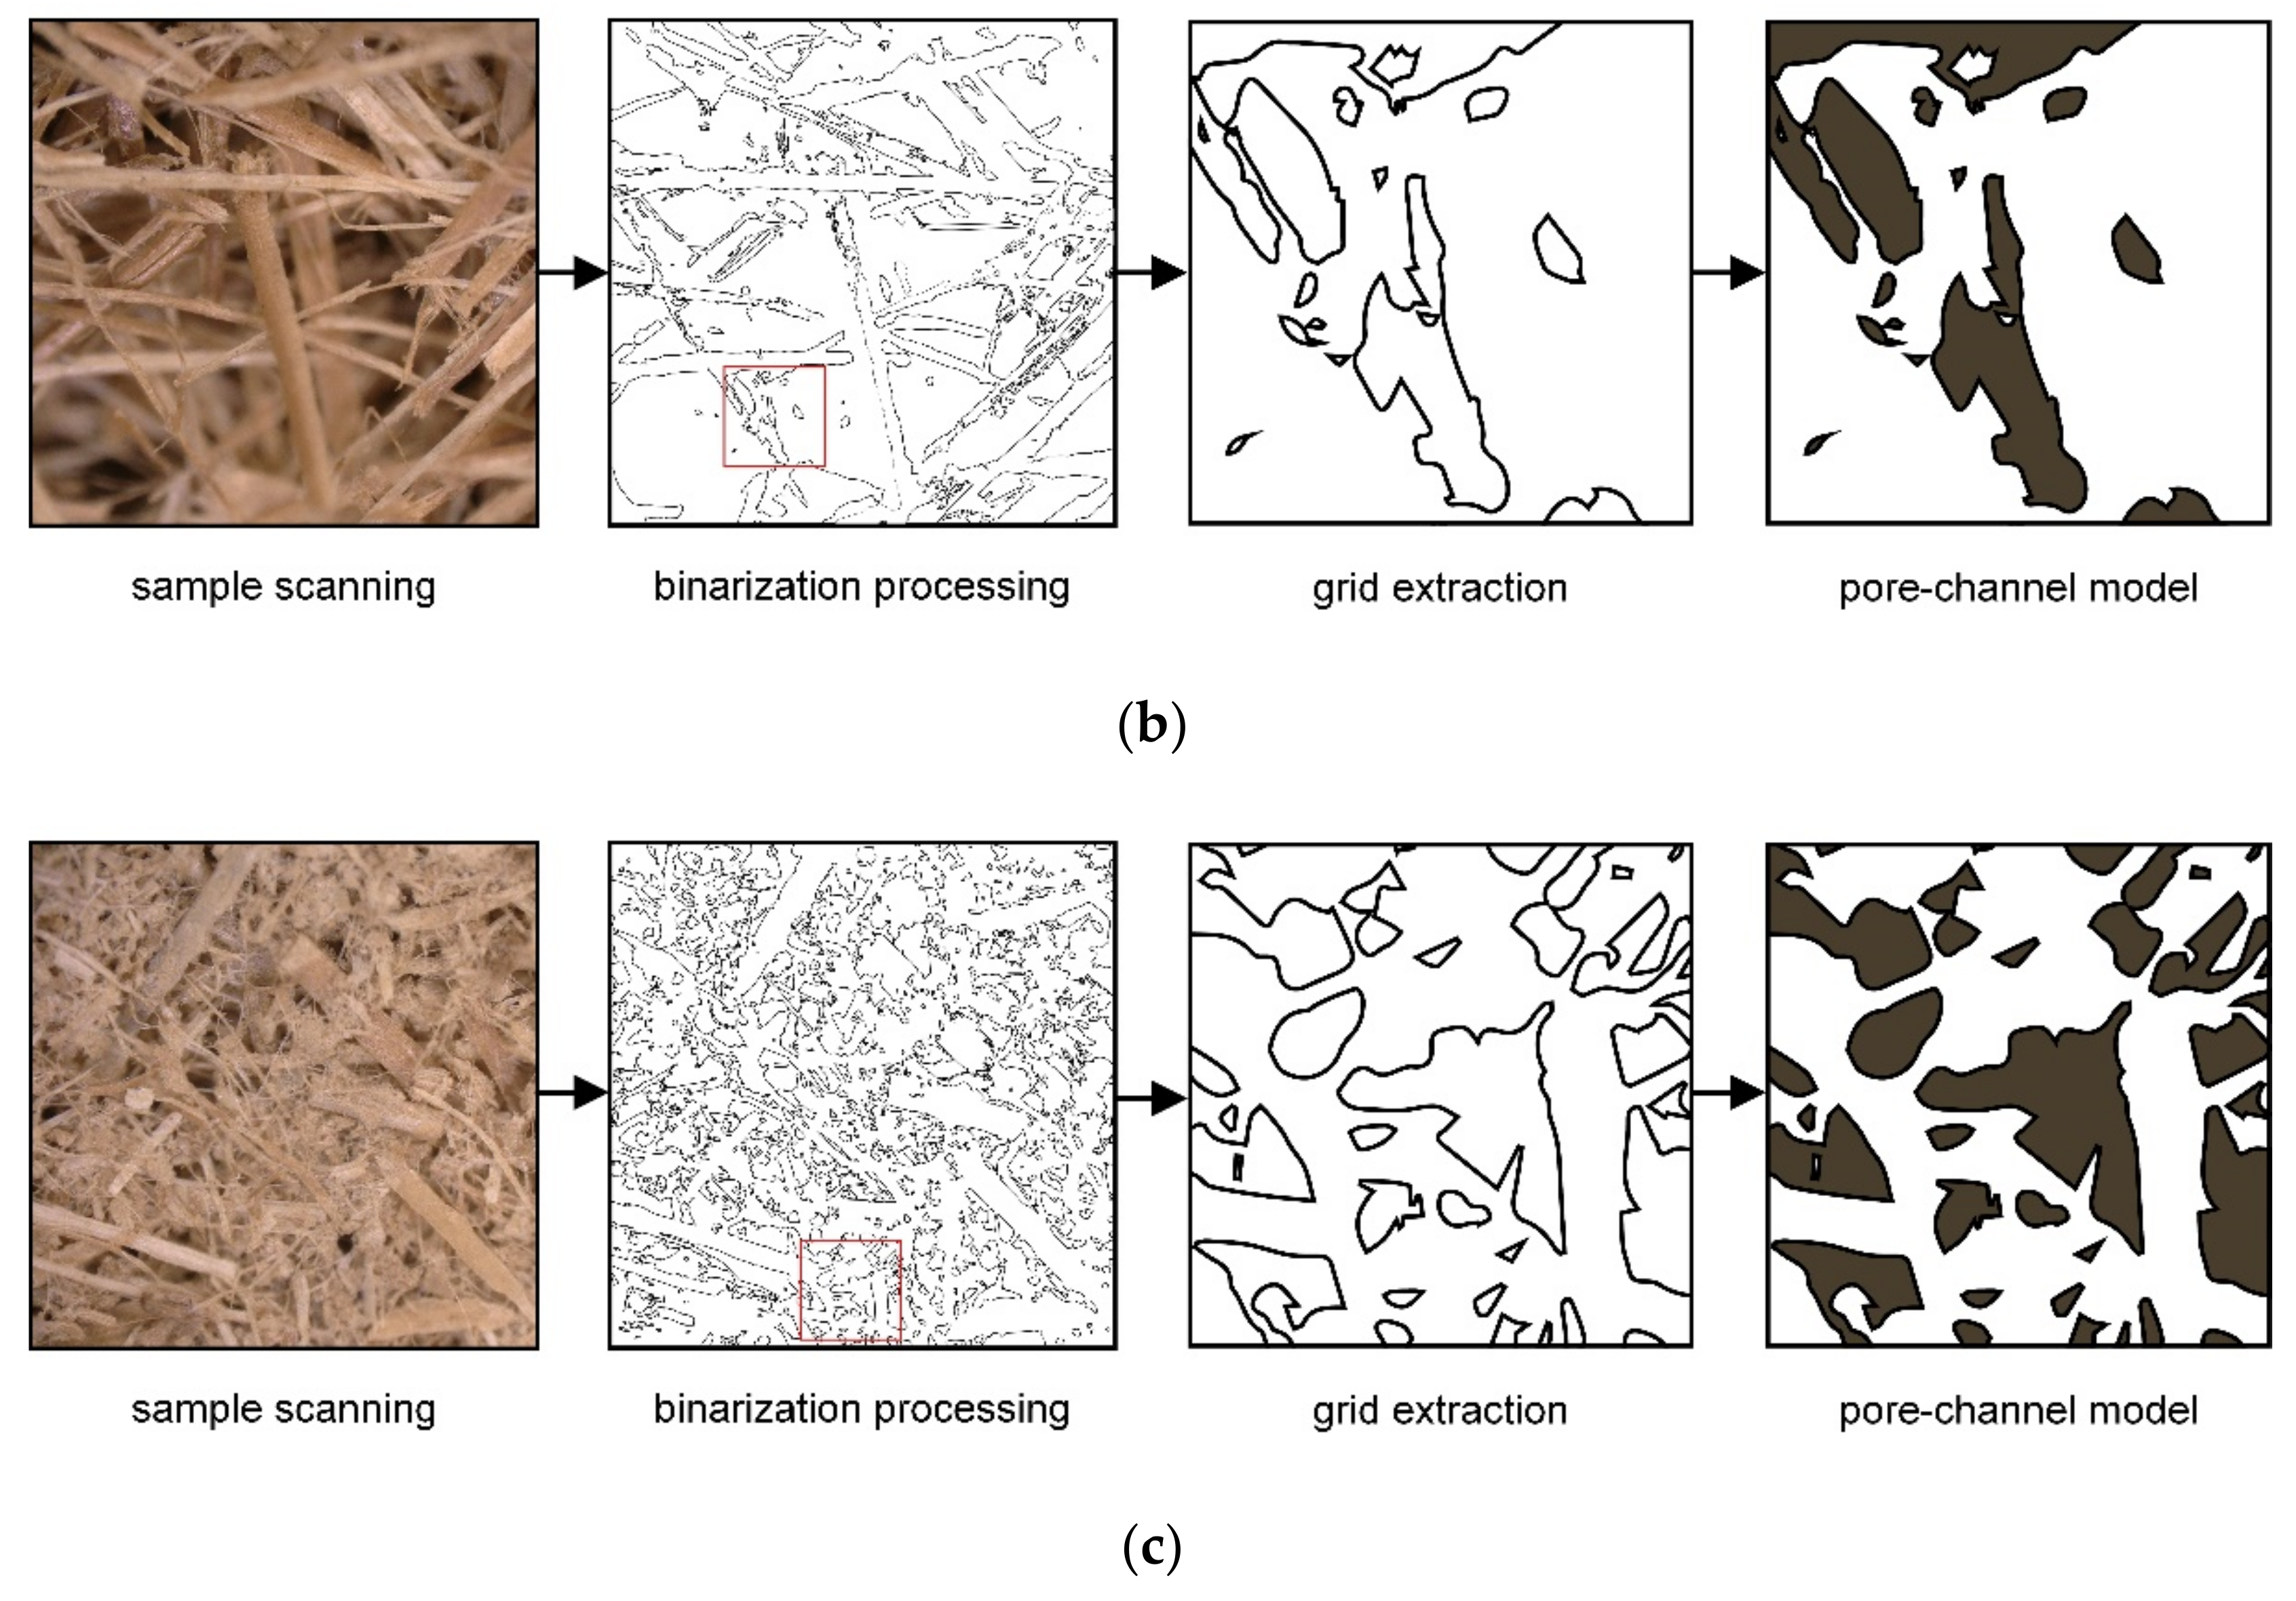
The pore channel model of the specimen established by image scanning of the specimen section, MATLAB image binarization processing, and mesh extraction is shown in Figure 13.
Figure 13 indicates that the larger the tensile index, the smaller the pore channel ratio in the image, the denser the specimen appearance, the tighter the internal fiber intertwining, indicating that the better the quality of straw fiber. Meanwhile, the smaller the tensile index, the larger the pore channel ratio in the image, the rougher the specimen appearance; the thread contains different proportions of coarse fibers or straw debris of different lengths, indicating that the straw fiber quality is poor. The pore coefficient ratios of different specimens were 75.7%, 62.2%, and 46.5% for Figure 13a–c pore models calculated by MATLAB. Therefore, it is feasible, reliable, convenient, and practical to evaluate the quality of straw fiber by using the tensile index of the specimen.
4. Discussion
At this stage, the use of machinery and equipment to make straw fibers mainly relies on the combined effect of multiple processes of machinery and equipment; its production process is relatively complex, usually with the combination of screw extrusion and steam blasting methods. To our knowledge, there is no purely mechanical physical method used to obtain straw fibers, so the design of the straw fiber crusher in this study is innovative. In addition, this study innovated a fast and accurate method for straw fiber quality inspection, which trials have scientifically justified.
Haitao Chen’s team has designed a new crop straw fiber-making machine and has continued to optimize it based on this machinery [32]. The new crop straw fiber-making machine adopts the structural form of a single-screw extrusion puffing machine. The wet base state of the straw material passes through the first part of the feeding section, the second part of the feeding section, the first ascending ring, the extruding section, the second ascending ring, and the blasting section in turn, and is finally discharged by the discharge port. Each part is subject to different extrusion and kneading effects. Finally, the machine reaches a specific compression ratio inside, and the temperature rises. The resulting high-temperature and high-pressure steam cause the rice straw sample to be under the action of a series of complex physical and chemical changes, and the cellulose crystallinity increases [33].
As with this design, the initial state of the straw material is wet based, and the feeding method takes the form of a spiral feed. The kneading action of the extrusion part of the new crop straw fiber-making machine is similar to the grinding step of the crushing process in this design. The difference is that the straw fiber crushing mechanism designed in this study has more potent physical effects of machinery in fiber extraction, and the process of fiber preparation is relatively simple. In this design, the process of making straw fibers is mainly based on the grinding action of the grinding wheel, where the straw material particles are extruded and rubbed against each other for a long time under the act of grinding to obtain the initial straw coarse fibers. The grinding wheel continues to grind, the coarse straw fibers are further sheared and squeezed, heat is generated internally, and expansion occurs. The swollen coarse straw fiber continues to be ground and finally broken down to a fine fibrous state, and the lignin is gradually separated to obtain the target straw fiber. The straw fiber crusher designed in this study reduces other cumbersome processes in producing straw fiber, making mechanical fiber acquisition more straightforward and more feasible.
Some innovative structural designs were carried out in this study. Still, some limitations largely constrained the straw fiber crusher’s continuous and efficient fiber production. The specific details are as follows:
First, the straw material needs to be initially crushed and soaked for a long time according to the requirements of the production process, and only after the material has softened can it be produced. At this point, the initial moisture content of the material is relatively large. If the material is not sufficiently soaked, blockages can occur, affecting the quality and yield of the straw fiber. The material blockage can only be cleaned and adjusted manually, which seriously affects the efficiency of the straw fiber crusher. Based on this situation, the material passability of the straw fiber crusher needs to be improved; how to design an automatic cleaning and adjustment device on the original machinery and equipment is also the direction of future research.
Second, the straw fiber crusher designed in this study is dedicated to the high-value use of rice straw as a single agricultural organic waste. Our next step will be to apply the straw fiber crusher to the fiber production of corn straw, wheat straw, and soybean straw. We hope to increase and improve the versatility and broad applicability of the straw fiber crusher through mechanical modernization and continuous optimization of the mechanical structure.
5. Conclusions
- (1)
- Through SOLIDWORKS software modeling and discrete element simulation, the designed straw fiber crusher principle is feasible, the structure is reasonable, and the straw can be prepared after straw soaking. Through the Central Composite experimental design of grinding wheel speed, spiral feed shaft speed, and grinding wheel clearance, the best parameters for the kW·h output and straw fiber quality are optimized as follows: a grinding wheel speed of 1250 r·min−1, a screw feed shaft speed of 40 r·min−1, a grinding wheel clearance of 0.21 mm. The power output reached 45.8 kg/(kW·h), and the obtained straw fiber tensile index could reach 112.5 N·m·g−1.
- (2)
- The response surface analysis of straw fiber crushing showed that the interaction of grinding wheel speed, screw feed shaft speed, and grinding wheel clearance had a significant effect on the kW·h output of the machine, in which the grinding wheel speed and grinding wheel clearance were the key factors to determine the kW·h output of the device. In contrast, the quality of straw fiber showed a strong correlation directly with the grinding wheel clearance, without interaction.
- (3)
- The specimen was scanned through the section image, MATLAB image binarization processing, grid extraction, local magnification, and other methods to establish the pore channel model and the relationship between the basis model pore channel coefficient ratio and the straw fiber specimen tensile index, proving that the technique of pressing the straw fiber into specimens to test the tensile index to evaluate the quality of straw fiber is feasible and reliable. The method is simple and easy to operate.
6. Patents
A patent has been applied for in China for the straw fiber crusher in this manuscript (Patent No. CN215087593U; Application No. CN2021205539589).
Author Contributions
Conceptualization, D.L. and Q.C.; methodology, J.W.; software, K.L.; validation, D.L., Q.C. and J.C.; data curation, J.W.; writing—original draft preparation, Q.C.; writing—review and editing, D.L.; visualization, Q.C.; supervision, D.L. All authors have read and agreed to the published version of the manuscript.
Funding
This research was supported by the National Natural Science Foundation of China (Grant No. 32171900), Department of Agriculture and Rural Affairs of Liaoning Province Northern Facilities Vegetables Whole-process Mechanized Research Base Construction Project.
Institutional Review Board Statement
Not applicable.
Data Availability Statement
The data presented in this study are available on request from the corresponding author.
Acknowledgments
The authors would like to thank to the National Natural Science Foundation of China and Department of Agriculture and Rural Affairs of Liaoning Province Northern Facilities Vegetables Whole-process Mechanized Research Base Construction Project for the support of this research. We also appreciate Shenyang Agricultural University for providing the test instruments and equipment as well as the test site. Moreover, we would like to thank Shenyang Mingtu Mechanical and Electrical Maintenance Co., Ltd. for the production of the test prototype. At the same time, we would like to thank Liaoning Yilin Industrial Co., Ltd. for the market promotion of the prototype product. In addition, the authors are grateful to the editor and the anonymous reviewers for their comments.
Conflicts of Interest
The authors declare no conflict of interest.
References
- Ren, J.Q.; Yu, P.X.; Xu, X.H. Straw Utilization in China-Status and Recommendations. Sustainability 2019, 11, 1762. [Google Scholar] [CrossRef] [Green Version]
- Ginni, G.; Kavitha, S.; Kannah, R.Y.; Bhatia, S.K.; Kumar, S.A.; Rajkumar, M.; Kumar, G.; Pugazhendhi, A.; Chi, N.T.L.; Banu, J.R. Valorization of Agricultural Residues: Different Biorefinery Routes. J. Environ. Chem. Eng. 2021, 9, 4. [Google Scholar] [CrossRef]
- Li, L.X.; Wang, C.; Zhang, X.Y.; Li, G.Y. Improvement and Optimization of Preparation Process of Seedling-Growing Bowl Tray Made of Paddy Straw. Int. J. Agric. Biol. Eng. 2014, 7, 13–22. [Google Scholar] [CrossRef]
- Zhang, S.C. Study on the Preparation Process of Rice Straw Fiberboard for Packaging. In Proceedings of the International Conference on Construction, Aerotropolis, Aviation and Environmental Engineering (ICCAE), Taoyuan, Taiwan, 12–25 November 2019. [Google Scholar]
- Rossi, G.; Conti, L.; Fiorineschi, L.; Marvasi, M.; Monti, M.; Rotini, F.; Togni, M.; Barbari, M. A New Eco-Friendly Packaging Material Made of Straw and Bioplastic. J. Agric. Eng. 2020, 51, 185–191. [Google Scholar] [CrossRef]
- Dahy, H. Efficient Fabrication of Sustainable Building Products from Annually Generated Non-Wood Cellulosic Fibres and Bioplastics with Improved Flammability Resistance. Waste Biomass Valorization 2019, 10, 1167–1175. [Google Scholar] [CrossRef]
- Jafarpour, M.; Jalalizand, A.; Eghbalsaied, S. High Fiber Media as the Most Efficient Substrates for Pleurotus Florida Culture. Arch. Biol. Sci. 2011, 63, 889–895. [Google Scholar] [CrossRef]
- Zhang, Y.; Zhu, Q.J.; Gao, S.; Liu, S.; Li, L.H.; Chen, H.T. Optimization of Technological Parameters of Straw Fiber-Based Plant Fiber Seedling Pot Raw Materials. Appl. Sci. 2021, 11, 7152. [Google Scholar] [CrossRef]
- Ming, X.L.; Li, Q.C.; Feng, J.L.; Jiang, W. Analysis and Optimization of Process Parameters of the Degradable Fiber Mulch Paper Made from Pineapple Leaf and Rice Straw by Response Surface Method. BioResources 2021, 16, 3454–3468. [Google Scholar] [CrossRef]
- Shi, J.Y.; Wang, G.Y. The Preparation and Performance of Biomass Cushioning Packaging Material Prepared by Sunflower Stalk Pith. In Proceedings of the International Conference of Environment Materials and Environment Management, Harbin, China, 24–25 July 2010. [Google Scholar]
- Thomsen, M.H.; Thygesen, A.; Thomsen, A.B. Hydrothermal Treatment of Wheat Straw at Pilot Plant Scale Using a Three-Step Reactor System Aiming at High Hemicellulose Recovery, High Cellulose Digestibility and Low Lignin Hydrolysis. Bioresour. Technol. 2008, 99, 4221–4228. [Google Scholar] [CrossRef]
- Periyasamy, S.; Karthik, V.; Senthil Kumar, P.S.; Isabel, J.B.; Temesgen, T.; Hunegnaw, B.M.; Melese, B.B.; Mohamed, B.A.; Vo, D.-V.N. Chemical, Physical and Biological Methods to Convert Lignocellulosic Waste into Value-Added Products. A Review. Environ. Chem. Lett. 2022, 20, 1129–1152. [Google Scholar] [CrossRef]
- Wang, Q.Q.; Zhu, Q.Q.; Xu, J.X.; Sun, J.Z. Combined Mechanical Destruction and Alkaline Pretreatment of Wheat Straw for Enhanced Enzymatic Saccharification. BioResources 2014, 9, 6841–6850. [Google Scholar] [CrossRef]
- Feng, N.J.; Fu, Y.; Wang, C.H.; Wu, Q. An Effective Modification with Mild Alkali Pretreatment for Enhancing the Biodegradation of Wheat Straw by Pycnoporus Sanguineus Nfzh-1. BioResources 2018, 13, 704–714. [Google Scholar] [CrossRef]
- Pan, M.Z.; Zhou, D.G.; Zhou, X.Y.; Lian, Z.N. Improvement of Straw Surface Characteristics Via Thermomechanical and Chemical Treatments. Bioresour. Technol. 2010, 101, 7930–7934. [Google Scholar] [CrossRef] [PubMed]
- Sun, E.H.; Zhang, Y.; Yong, C.; Qu, P.; Huang, H.Y.; Xu, Y.D. Biological Fermentation Pretreatment Accelerated the Depolymerization of Straw Fiber and Its Mechanical Properties as Raw Material for Mulch Film. J. Clean. Prod. 2021, 284, 9. [Google Scholar] [CrossRef]
- Li, B.; Chen, K.J.; Gao, X.; Zhao, C.; Shao, Q.J.; Sun, Q.; Li, H. Influence of Steam Explosion on Rice Straw Fiber Content. J. Bi-obased Mater. Bioenergy 2015, 9, 596–608. [Google Scholar] [CrossRef]
- Kellersztein, I.; Shani, U.; Zilber, I.; Dotan, A. Sustainable Composites from Agricultural Waste: The Use of Steam Explosion and Surface Modification to Potentialize the Use of Wheat Straw Fibers for Wood Plastic Composite Industry. Polym. Compos. 2019, 40, E53–E61. [Google Scholar] [CrossRef]
- Matsakas, L.; Nitsos, C.; Raghavendran, V.; Yakimenko, O.; Persson, G.; Olsson, E.; Rova, U.; Olsson, L.; Christakopoulos, P. A Novel Hybrid Organosolv: Steam Explosion Method for the Efficient Fractionation and Pretreatment of Birch Biomass. Biotechnol. Biofuels 2018, 11, 160. [Google Scholar] [CrossRef]
- Han, G.P.; Deng, J.; Zhang, S.Y.; Bicho, P.; Wu, Q.L. Effect of Steam Explosion Treatment on Characteristics of Wheat Straw. Ind. Crop. Prod. 2010, 31, 28–33. [Google Scholar] [CrossRef]
- Cui, L.; Liu, Z.; Si, C.L.; Hui, L.F.; Kang, N.; Zhao, T. Influence of Steam Explosion Pretreatment on the Composition and Structure of Wheat Straw. BioResources 2012, 7, 4202–4213. [Google Scholar]
- Xia, W.D.; Song, J.; Tarverdi, K.; Kang, Y.G. Wheat Straw and Wheat Flour Biocomposites Prepared by Extrusion Process. J. Biobased Mater. Bioenergy 2010, 4, 172–180. [Google Scholar] [CrossRef]
- Theng, D.; Arbat, G.; Delgado-Aguilar, M.; Ngo, B.; Labonne, L.; Evon, P.; Mutje, P. Comparison between Two Different Pretreatment Technologies of Rice Straw Fibers Prior to Fiberboard Manufacturing: Twin-Screw Extrusion and Digestion Plus Defibration. Ind. Crops Prod. 2017, 107, 184–197. [Google Scholar] [CrossRef] [Green Version]
- Evon, P.; Labonne, L.; Khan, S.U.; Ouagne, P.; Pontalier, P.Y.; Rouilly, A. Twin-Screw Extrusion Process to Produce Renewable Fiberboards. J. Vis. Exp. 2021, 167, e62072. [Google Scholar] [CrossRef] [PubMed]
- Gao, C.F.; Zhang, Y.; Cao, Y.Y.; Xiao, W.H.; Han, L.J. Effect of Ultrafine Grinding Pretreatment on the Cellulose Fibers and Nanocrystals from Wheat Straw. J. Biobased Mater. Bioenergy 2020, 14, 369–375. [Google Scholar] [CrossRef]
- Zhang, J.; Feng, B.; Guo, L.; Kong, L.Z.; Zhao, C.; Yu, X.Z.; Luo, W.J.; Kan, Z. Performance Test and Process Parameter Optimization of 9ff Type Square Bale Straw Crusher. Int. J. Agric. Biol. Eng. 2021, 14, 232–240. [Google Scholar] [CrossRef]
- Zhang, T.; Zhao, M.Q.; Liu, F.; Tian, H.Q.; Wulan, T.Y.; Yue, Y.; Li, D.P. A Discrete Element Method Model of Corn Stalk and Its Mechanical Characteristic Parameters. BioResources 2020, 15, 9337–9350. [Google Scholar] [CrossRef]
- Chen, L.Q.; Zhang, J.Q.; Kong, X.L. Genetic Optimal Design of Straw Crusher Based on Adams. In Proceedings of the International Conference on Manufacturing Engineering and Automation, Guangzhou, China, 7–9 December 2011. [Google Scholar]
- Yang, W.; Zhao, J.F.; Liu, X.Y.; Xi, L.Q.; Liao, J. Simulation and Test of “Separated Burying Device” of Green Manure Returning Machine Based on the EDEM Software. Agriculture 2022, 12, 569. [Google Scholar] [CrossRef]
- Saeed, H.A.M.; Liu, Y.; Lucia, L.A.; Chen, H.L. Evaluation of Sudanese Sorghum and Bagasse as a Pulp and Paper Feedstock. BioResources 2017, 12, 5212–5222. [Google Scholar] [CrossRef] [Green Version]
- Kamoga, O.L.M.; Kirabira, J.B.; Byaruhanga, J.K.; Godiyal, R.D.; Anupam, K. Characterisation and Evaluation of Pulp and Paper from Selected Ugandan Grasses for Paper Industry. Cell Chem. Technol. 2016, 50, 275–284. [Google Scholar]
- Zhang, Y.; Chen, H.T.; Liu, S.; Rokayya, S.; He, Y.Y. Optimization of Process Parameters for Preparing Straw Fiber from Corn Stalk Rind. BioResources 2020, 15, 923–934. [Google Scholar] [CrossRef]
- Miao, N. Optimization Research on the D-200 Crop Straw Fiber Extruder. Master’s Thesis, Northeast Agricultural University, Harbin, China, 2015. [Google Scholar]
Figure 1.
Schematic diagram of straw fiber crusher: 1. Feed hopper; 2. Shell; 3. Handle; 4. Speed control motor; 5. Outlet; 6. Frame; 7. Motor; 8. Belt; 9. Spindle support seat; 10. Screw feed shaft; 11. Sleeve; 12. Bearing; 13. Flange; 14. Right grinding wheel holder; 15. Right grinding wheel; 16. Left grinding wheel holder; 17. Spindle; 18. Left grinding wheel. (a) The whole frame; (b) Internal structure of the main body.

Figure 2.
Grinding wheel clearance adjustment device. 1. Housing; 2. Handle (Figure 2-2 and Figure 1a-3 are the same part); 3. Small sleeve; 4. Large sleeve; 5. Right grinding wheel holder (Figure 2-5 and Figure 1b-14 are the same part).

Figure 3.
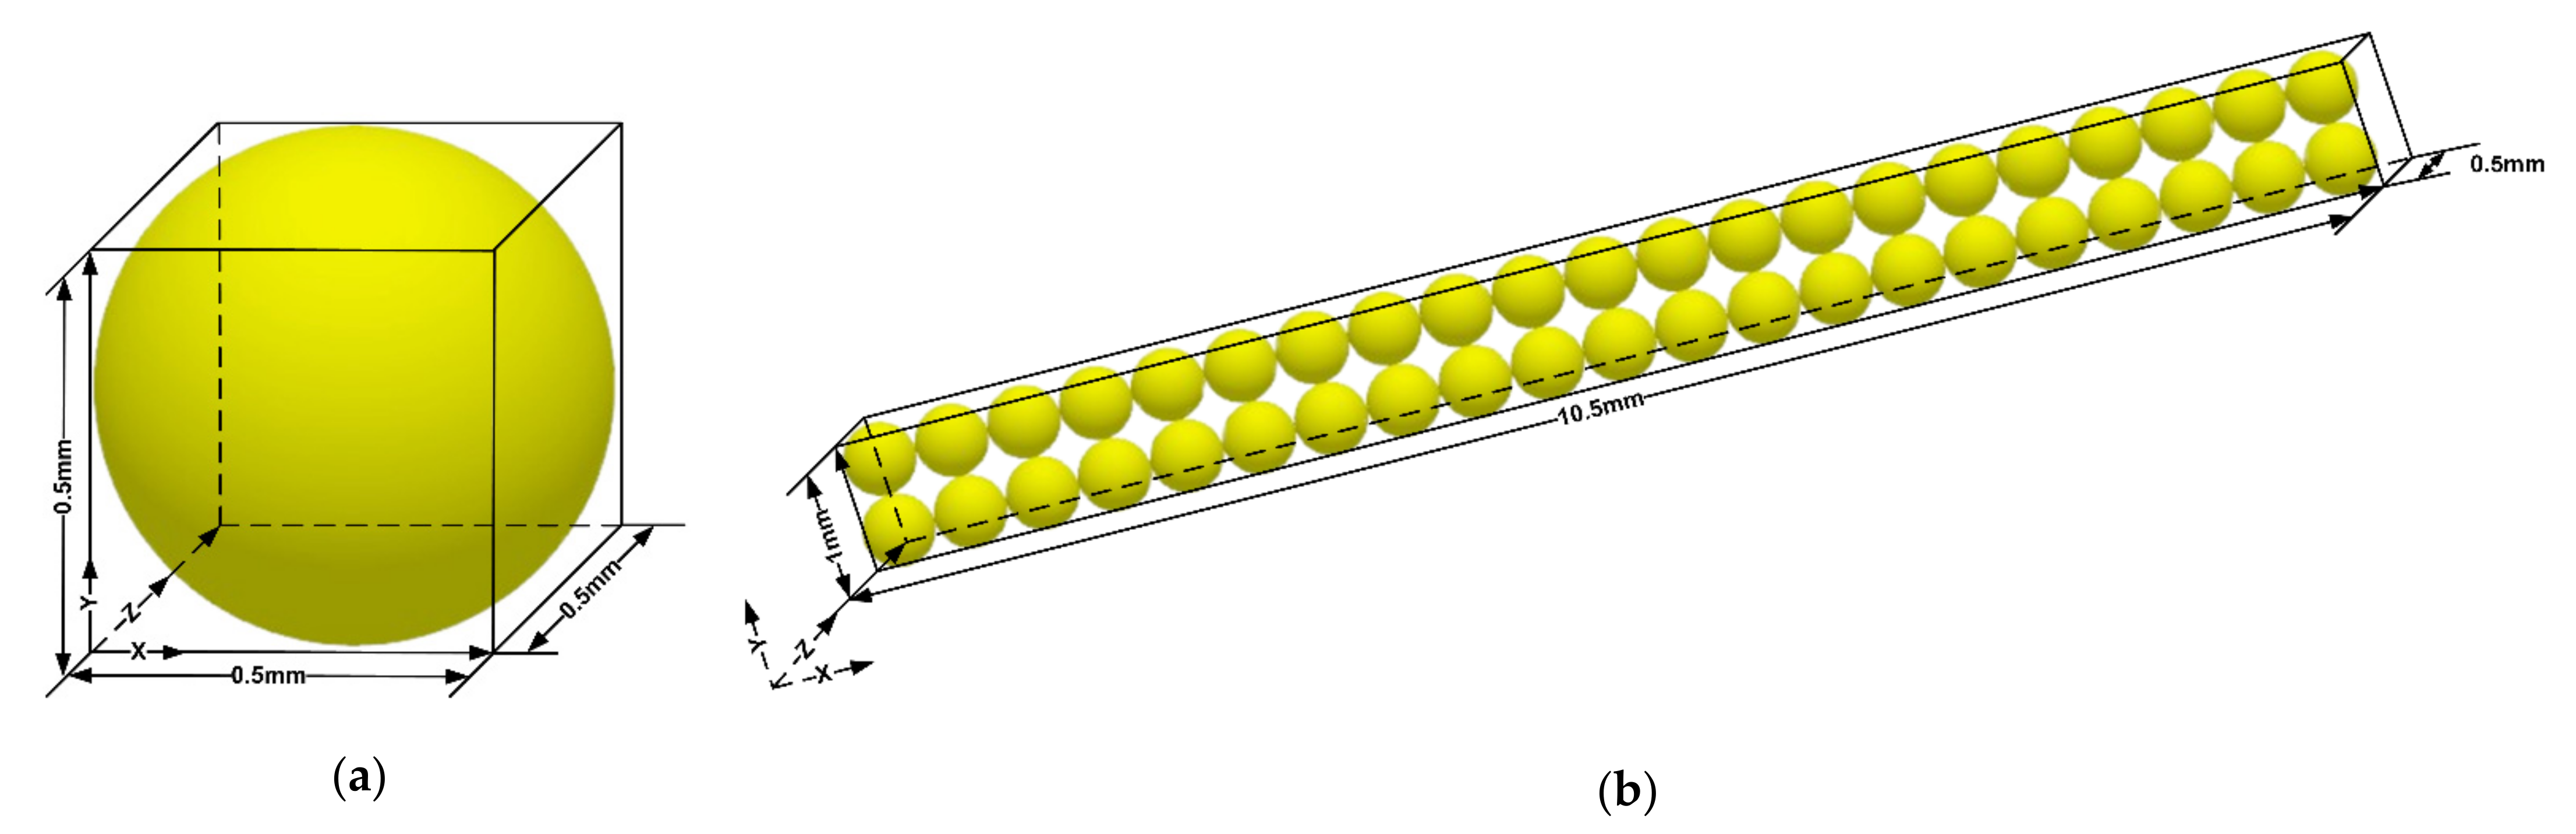
Straw fiber particle model. (a) Single spherical particles. (b) Lumpy particles.

Figure 4.
Flow chart of straw fiber preparation and test.

Figure 5.
Specimen preparation mold.

Figure 6.
Particle distribution diagram of the straw crushing. (a) T = 2.9 s particle size distribution; (b) T = 3.3 s particle size distribution; (c) T = 2.74 s particle distribution streamline graph; (d) T = 3.3 s cross-section diagram of particle distribution.
Figure 6.
Particle distribution diagram of the straw crushing. (a) T = 2.9 s particle size distribution; (b) T = 3.3 s particle size distribution; (c) T = 2.74 s particle distribution streamline graph; (d) T = 3.3 s cross-section diagram of particle distribution.


Figure 7.
Particle velocity distribution streamline. (a) T = 2.9 s particle velocity distribution streamline; (b) T = 3.3 s particle velocity distribution streamline.
Figure 7.
Particle velocity distribution streamline. (a) T = 2.9 s particle velocity distribution streamline; (b) T = 3.3 s particle velocity distribution streamline.

Figure 8.
Response surface analysis of the experimental factors on electricity production. (a) Effects of grinding wheel clearance and speed on the electricity production. (b) Effects of screw shaft speed and grinding wheel speed on the electricity production. (c) Effects of grinding wheel clearance and screw shaft speed on the electricity production.

Figure 9.
Rice straw fiber crusher test prototype.

Figure 10.
Rice straw fiber crushing before and after comparison. (a) Rice straw before crushing. (b) Rice straw fiber after crushing.
Figure 10.
Rice straw fiber crushing before and after comparison. (a) Rice straw before crushing. (b) Rice straw fiber after crushing.

Figure 11.
Straw fiber test specimen.

Figure 12.
Variation curve of force and displacement before and after sample breaking.

Figure 13.
The process of sample pore channel modeling. (a) Pore channel model establishing of the tensile index (70.2 N·m·g−1) sample. (b) Pore channel model establishing of the tensile index (85.9 N·m·g−1) sample. (c) Pore channel model establishing of the tensile index (112.5 N·m·g−1) sample.
Figure 13.
The process of sample pore channel modeling. (a) Pore channel model establishing of the tensile index (70.2 N·m·g−1) sample. (b) Pore channel model establishing of the tensile index (85.9 N·m·g−1) sample. (c) Pore channel model establishing of the tensile index (112.5 N·m·g−1) sample.


Table 1.
Simulation model parameters.
| Project | Parameter |
|---|---|
| Grain density (kg/m3) | 750 |
| Density of steel (kg/m3) | 7850 |
| Particle Poisson’s ratio | 0.4 |
| Poisson’s ratio of steel | 0.3 |
| Particle shear modulus (Pa) | 1 × 10⁶ |
| Steel shear modulus (Pa) | 1 × 10¹⁰ |
| Particle and particle recovery coefficient | 0.485 |
| Particle and steel recovery coefficient | 0.663 |
| Particle-to-particle static friction coefficient | 0.142 |
| Static friction coefficient between particles and steel | 0.526 |
| Particle-to-particle rolling friction coefficient | 0.078 |
| Coefficient of rolling friction between particles and steel | 0.419 |
| Normal stiffness coefficient (N·m−1) | 8.5 × 10⁹ |
| Tangential stiffness coefficient (N·m−1) | 8.2 × 10⁹ |
| Critical normal stress (Pa) | 8.1 × 10⁸ |
| Critical tangential stress (Pa) | 8.1 × 10⁸ |
| Bonding radius (mm) | 0.52 |
Table 2.
Table of factors and level codes.
| Code Value | Grinding Wheel Speed A/(r·min−1) | Screw Shaft Speed B/(r·min−1) | Grinding Wheel Clearance C/mm |
|---|---|---|---|
| −1.682 | 1000 | 20 | 0.02 |
| −1 | 1101 | 28 | 0.10 |
| 0 | 1250 | 40 | 0.21 |
| 1 | 1399 | 52 | 0.32 |
| 1.682 | 1500 | 60 | 0.40 |
Table 3.
Central composite test design and results.
| Number | Grinding Wheel Speed A/(r·min−1) | Screw Shaft Speed B/(r·min−1) | Grinding Wheel Clearance C/(mm) | Electricity Production Y1/(kg/(kW·h)) |
|---|---|---|---|---|
| 1 | 1250 | 40 | 0.21 | 45.2 |
| 2 | 1250 | 40 | 0.21 | 45.8 |
| 3 | 1000 | 40 | 0.21 | 40.6 |
| 4 | 1250 | 40 | 0.21 | 45.3 |
| 5 | 1250 | 20 | 0.21 | 43.3 |
| 6 | 1250 | 40 | 0.21 | 45.4 |
| 7 | 1250 | 40 | 0.40 | 48.9 |
| 8 | 1399 | 52 | 0.32 | 49.1 |
| 9 | 1101 | 28 | 0.32 | 46.1 |
| 10 | 1101 | 52 | 0.10 | 38.8 |
| 11 | 1101 | 28 | 0.10 | 36.5 |
| 12 | 1101 | 52 | 0.32 | 46.5 |
| 13 | 1500 | 40 | 0.21 | 48.2 |
| 14 | 1399 | 28 | 0.32 | 48.6 |
| 15 | 1250 | 40 | 0.02 | 38.2 |
| 16 | 1250 | 40 | 0.21 | 45.6 |
| 17 | 1250 | 60 | 0.21 | 47.1 |
| 18 | 1399 | 28 | 0.10 | 42.6 |
| 19 | 1399 | 52 | 0.10 | 44.2 |
| 20 | 1250 | 40 | 0.21 | 45.8 |
Table 4.
Results of regression analysis of variance of electricity production.
| Source | Sum of Squares | Degrees of Freedom | Mean Square Error | F Value | p Value |
|---|---|---|---|---|---|
| model | 245.17 | 9 | 27.24 | 131.83 | <0.0001 |
| A | 63.21 | 1 | 63.21 | 305.89 | <0.0001 |
| B | 9.17 | 1 | 9.17 | 44.38 | <0.0001 |
| C | 156.26 | 1 | 156.26 | 756.16 | <0.0001 |
| AB | 0.0450 | 1 | 0.0450 | 0.2178 | 0.6508 |
| AC | 5.12 | 1 | 5.12 | 24.78 | 0.0006 |
| BC | 1.13 | 1 | 1.13 | 5.44 | 0.0418 |
| A2 | 2.93 | 1 | 2.93 | 14.16 | 0.0037 |
| B2 | 0.4057 | 1 | 0.4057 | 1.96 | 0.1914 |
| C2 | 8.13 | 1 | 8.13 | 39.35 | <0.0001 |
| Residual | 2.07 | 10 | 0.2066 | - | - |
| Loss of quasi item | 1.74 | 5 | 0.3476 | 5.29 | 0.0457 |
| Pure error | 0.3283 | 5 | 0.0657 | - | - |
| Aggregate | 247.24 | 19 | - | - | - |
Note: R2 = 0.7407; corrected R2 = 0.5073; significant, p ≤ 0.05; not significant, p > 0.05.
Table 5.
Results of regression analysis of variance of tensile strength index.
| Source | Sum of Squares | Degrees of Freedom | Mean Square Error | F Value | p Value |
|---|---|---|---|---|---|
| model | 7702.54 | 3 | 2567.51 | 21.81 | <0.0001 |
| A | 28.60 | 1 | 28.60 | 0.2430 | 0.6288 |
| B | 12.76 | 1 | 12.76 | 0.1084 | 0.7463 |
| C | 7661.18 | 1 | 7661.18 | 65.09 | <0.0001 |
| residual | 1883.26 | 16 | 117.70 | - | - |
| Loss of quasi item | 1260.15 | 11 | 114.56 | 0.9193 | 0.5809 |
| Pure error | 623.11 | 5 | 124.62 | - | - |
| aggregate | 9585.80 | 19 | - | - | - |
Publisher’s Note: MDPI stays neutral with regard to jurisdictional claims in published maps and institutional affiliations. |
© 2022 by the authors. Licensee MDPI, Basel, Switzerland. This article is an open access article distributed under the terms and conditions of the Creative Commons Attribution (CC BY) license (https://creativecommons.org/licenses/by/4.0/).
Share and Cite
MDPI and ACS Style
Cheng, Q.; Wang, J.; Liu, K.; Chao, J.; Liu, D. Design of Rice Straw Fiber Crusher and Evaluation of Fiber Quality. Agriculture 2022, 12, 729. https://0-doi-org.brum.beds.ac.uk/10.3390/agriculture12050729
AMA Style
Cheng Q, Wang J, Liu K, Chao J, Liu D. Design of Rice Straw Fiber Crusher and Evaluation of Fiber Quality. Agriculture. 2022; 12(5):729. https://0-doi-org.brum.beds.ac.uk/10.3390/agriculture12050729
Chicago/Turabian StyleCheng, Qian, Jiaxin Wang, Kun Liu, Junqi Chao, and Dejun Liu. 2022. "Design of Rice Straw Fiber Crusher and Evaluation of Fiber Quality" Agriculture 12, no. 5: 729. https://0-doi-org.brum.beds.ac.uk/10.3390/agriculture12050729
Note that from the first issue of 2016, this journal uses article numbers instead of page numbers. See further details here.