
Biochars Derived from Gasified Feedstocks Increase the Growth and Improve Nutrient Acquisition of Triticum aestivum (L.) Grown in Agricultural Alfisols

Abstract
:1. Introduction
2. Results
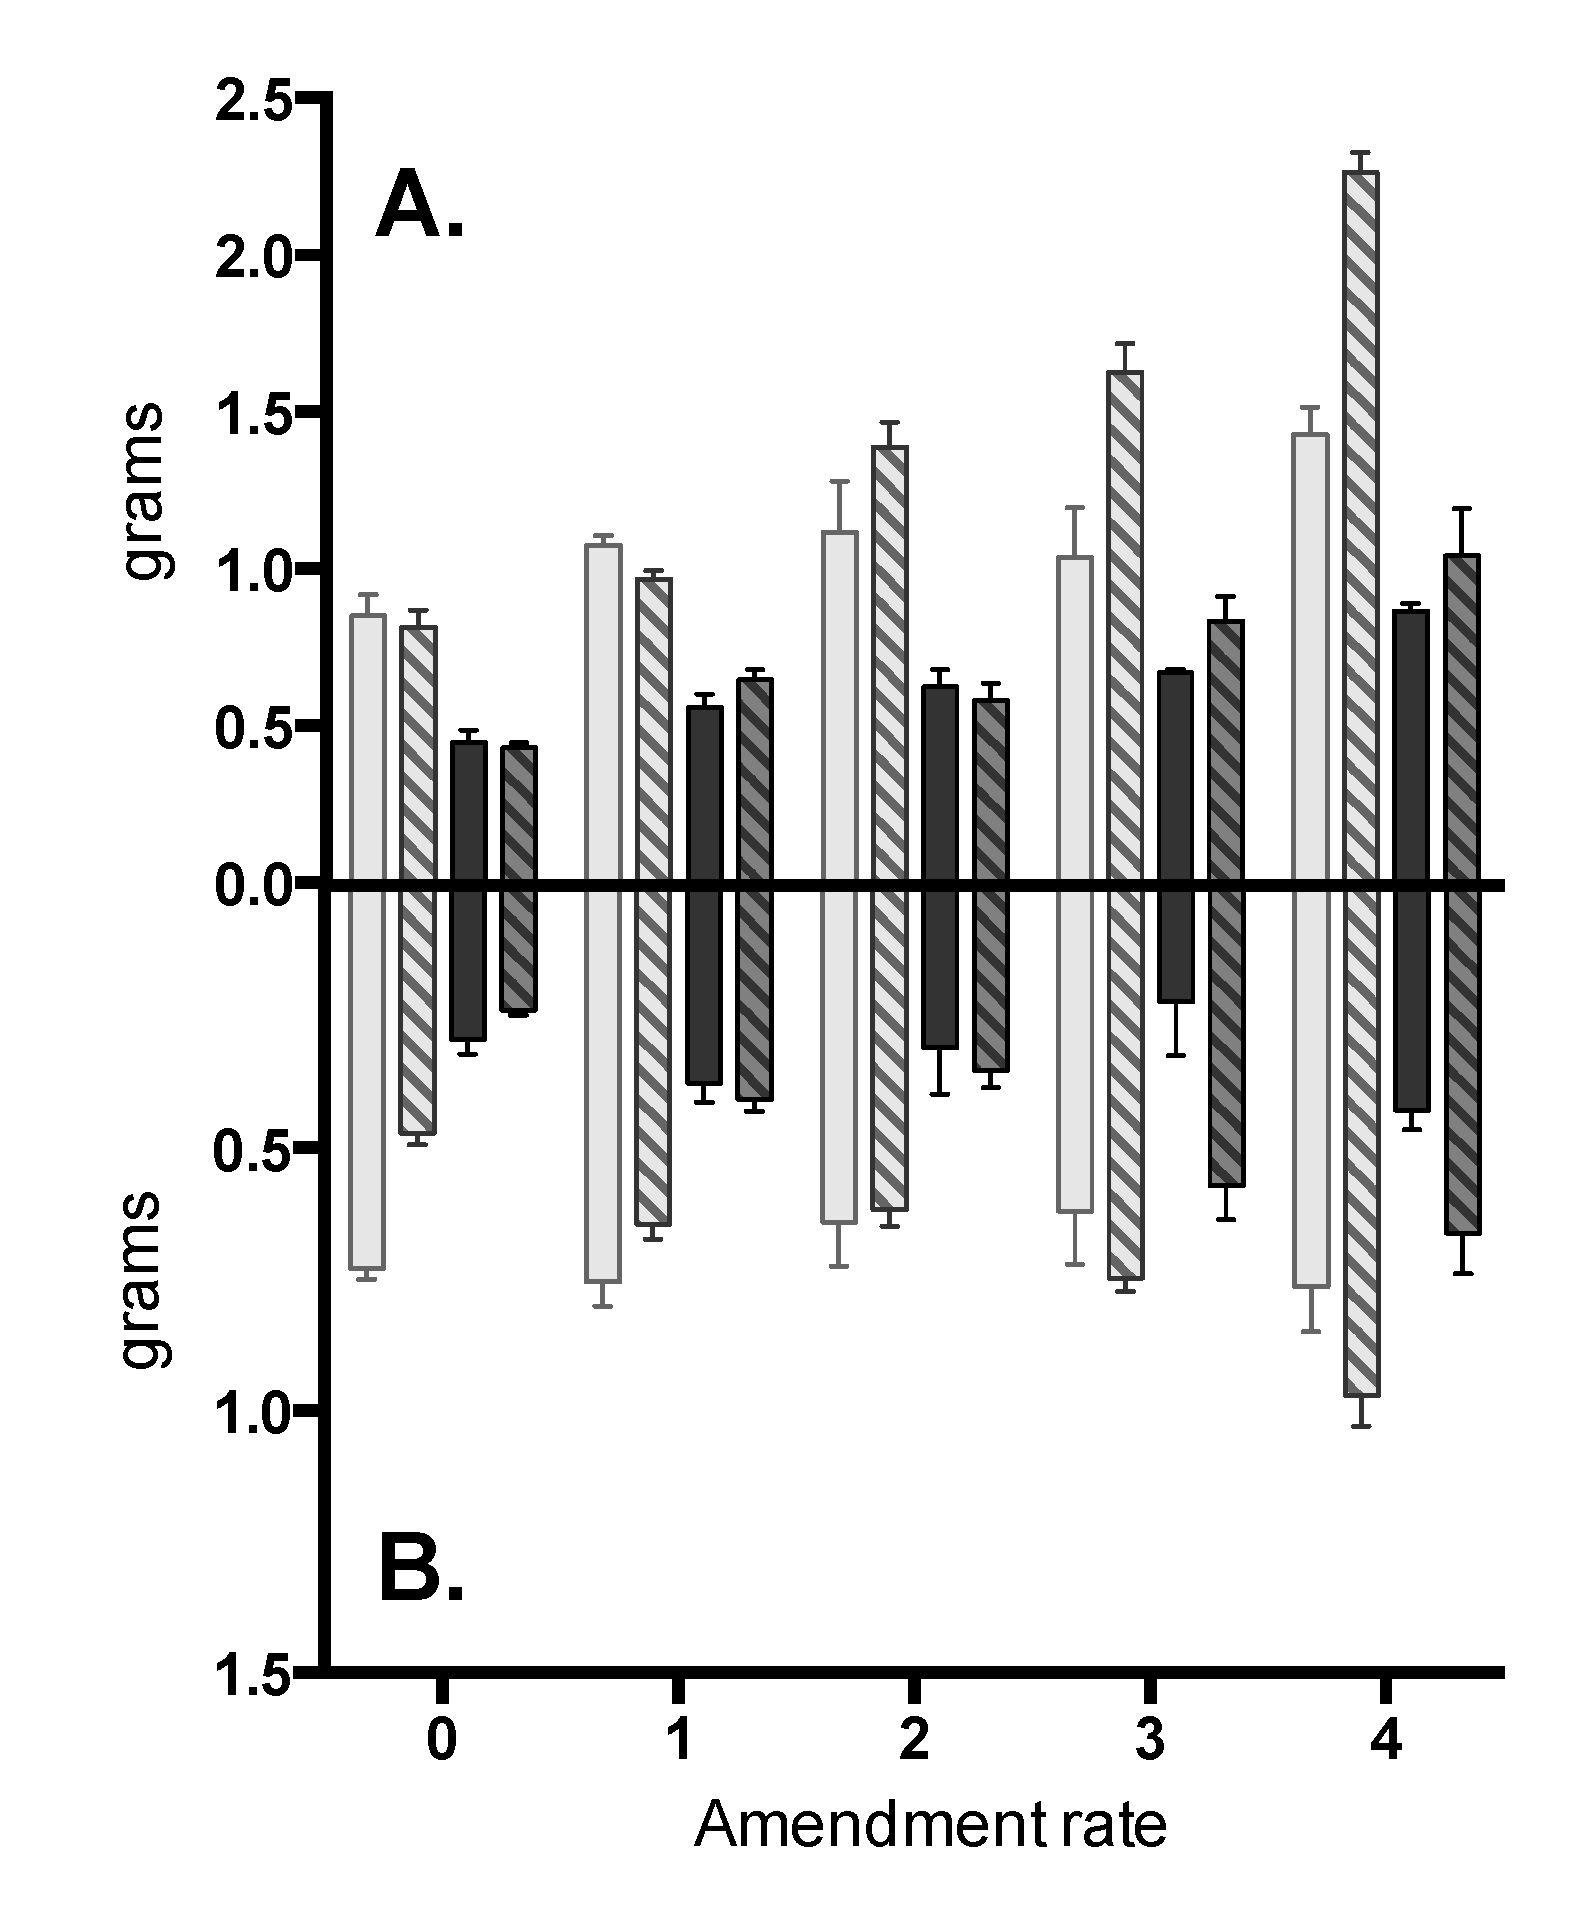
2.1. Plant Growth

| u | Biochar Type | Soil Type | KB Biochar Concentration | Wood Biochar Concentration | Biochar Type × Soil Source | Soil Type × KB Biochar Concentration | Soil Type × Wood Biochar Concentration | ||||||||
|---|---|---|---|---|---|---|---|---|---|---|---|---|---|---|---|
| Estimate | S. E. | Estimate | S. E. | Estimate | S. E. | Estimate | S. E. | Estimate | S. E. | Estimate | S. E. | Estimate | S. E. | Adj R2 | |
| Root mass | −0.037 | 0.049 | 0.361 * | 0.049 | 1.213 | 0.84 | 5.02 * | 0.84 | −0.137 | 0.069 | −0.955 | 1.188 | 0.689 | 1.188 | 0.7 |
| Shoot mass | 0.00 | 0.074 | 0.436 * | 0.074 | 4.80 * | 1.28 | 7.21 * | 1.28 | −0.053 | 0.105 | 1.07 | 1.81 | 10.8 * | 1.81 | 0.85 |
| Root Al | −430 * | 131 | 141 | 131 | −9411 * | 2248 | −3950 | 2248 | 136 | 185 | −3554 | 3179 | −5337 | 3179 | 0.44 |
| Root Ca | 288 * | 67 | 50.4 | 67.1 | 1272 | 1150 | 6495 * | 1150 | −84.7 | 94.9 | −651 | 1627 | −5532 * | 1627 | 0.6 |
| Root Fe | −315 * | 104 | 258 * | 104 | −4319 * | 1790 | 56.5 | 1790 | 169 | 148 | −4177 | 2531 | −6798 * | 2531 | 0.36 |
| Root K | −2013 * | 672 | −340 | 672 | 39564 * | 11528 | 23358 * | 11528 | 287 | 950 | −12726 | 16303 | −22913 | 16303 | 0.44 |
| Root Mg | 87.1 * | 36 | −36.4 | 36 | 3445 * | 617 | 4302 * | 617 | −50.3 | 50.8 | −2226 * | 873 | −3610 * | 873 | 0.64 |
| Root Na | 106 | 111 | −540 * | 111 | −11172 * | 1904 | −11498 * | 1904 | 121 | 157 | 7717 * | 2693 | 5137 | 2693 | 0.53 |
| Root Ni | 4.211 * | −0.973 | 3.628 * | −0.973 | −33.575 * | −16.683 | −130 * | −16.683 | −4.732* | −1.376 | −28.125 | −23.6 | 30.515 | −23.593 | 0.589 |
| Root P | −405 | 225 | −1162 * | 225 | 22,119 * | 3854 | 501 | 3854 | 577 | 318 | −200 | 5451 | −8946 | 5451 | 0.69 |
| Root S | −134 | 92.9 | −308 * | 92.9 | 963 | 1593 | −5498 * | 1593 | −73.7 | 131 | −4510 * | 2253 | −5413 * | 2253 | 0.72 |
| Root Zn | 22.3 * | 6.76 | −45.7 * | 6.76 | −199 | 116 | −750 * | 116 | −16.9 | 9.56 | 179 | 164 | 457 * | 164 | 0.7 |
| Shoot Al | 20.1 | 28.5 | 101 * | 28.5 | −535 | 488 | −396 | 488 | −25.8 | 40.3 | 417 | 690 | −604 | 690 | 0.3 |
| Shoot Ca | −574 * | 240 | −636 * | 240 | −30,750 * | 4110 | −22,400 * | 4110 | −51.5 | 339 | 14,040 * | 5813 | 9901 | 5813 | 0.56 |
| Shoot Fe | 14.2 | 23.3 | 74.3 * | 23.3 | −285 | 400 | −15 | 400 | 2.76 | 32.9 | 366 | 565 | −726 | 565 | 0.28 |
| Shoot K | 4180 * | 1010 | 584 | 1010 | 98,648 * | 17,322 | 74,325 * | 17,322 | −1967 | 1428 | −38,238 | 24498 | −76,180 * | 24,498 | 0.5 |
| Shoot Mg | 158 | 86.8 | −349 * | 86.8 | 4311* | 1488 | 6845 * | 1488 | −41.6 | 123 | 1159 | 2104 | −992 | 2104 | 0.6 |
| Shoot Na | −2.06 | 22.9 | −27.4 | 22.9 | −148 | 393 | −21.2 | 393 | −13.3 | 32.4 | 201 | 556 | 80.5 | 556 | 0.03 |
| Shoot Ni | −0.8 * | −0.137 | −0.522 * | −0.137 | −16.733 * | −2.355 | −4.064 | −2.355 | 0.632 * | −0.194 | 11.908 * | −3.33 | −0.98 | −3.33 | 0.44 |
| Shoot P | 628 * | 223 | −622 * | 223 | 11664 * | 3825 | 14426 * | 3825 | −387 | 315 | 9446 | 5410 | −8150 | 5410 | 0.56 |
| Shoot S | 849 * | 162 | −788 * | 162 | 3639 | 2786 | −14137 * | 2786 | −735 * | 230 | −7475 | 3940 | 5278 | 3940 | 0.73 |
| Shoot Zn | 3.14 | 3.24 | −10.8 * | 3.25 | 18.2 | 55.7 | 44.6 | 55.7 | 2.58 | 4.59 | 120 | 78.8 | −20.3 | 78.8 | 0.23 |


3. Discussion
4. Experimental Section
4.1. Experimental
4.2. Plant Analysis
4.3. Soil Analysis
4.4. Statistical Analysis
5. Conclusion
Supplementary Files
Supplementary File 1Acknowledgments
Conflict of Interest
References
- Banowetz, G.M.; Boateng, A.; Steiner, J.J.; Griffith, S.M.; Sethi, V.; El-Nashaar, H. Assessment of straw biomass feedstock resources in the Pacific Northwest. Biomass Bioenergy 2008, 32, 629–634. [Google Scholar] [CrossRef]
- Mueller-Warrant, G.W.; Banowetz, G.M.; Whittaker, G.W. Geospatial identification of optimal straw-to-energy conversion sites in the Pacific Northwest. Biofuels Bioprod. Biorefining 2010, 4, 385–407. [Google Scholar] [CrossRef]
- Biederman, L.A.; Stanley Harpole, W. Biochar and its effects on plant productivity and nutrient cycling: A meta-analysis. GCB Bioenergy 2013, 5, 202–214. [Google Scholar] [CrossRef]
- Novak, J.M.; Busscher, W.J.; Laird, D.L.; Ahmedna, M.; Watts, D.W.; Niandou, M.A.S. Impact of Biochar Amendment on Fertility of a Southeastern Coastal Plain Soil. Soil Sci. 2009, 174, 105–112. [Google Scholar] [CrossRef]
- Lehmann, J.; Joseph, S. Biochar for Environmental Management: Science and Technology; Earthscan: Sterling, VA, USA, 2012; pp. 127–146. [Google Scholar]
- Maestrini, B.; Herrmann, A.M.; Nannipieri, P.; Schmidt, M.W.I.; Abiven, S. Ryegrass-derived pyrogenic organic matter changes organic carbon and nitrogen mineralization in a temperate forest soil. Soil Biol. Biochem. 2014, 69, 291–301. [Google Scholar] [CrossRef]
- Rogovska, N.; Laird, D.; Cruse, R.M.; Trabue, S.; Heaton, E. Germination tests for assessing biochar quality. J. Environ. Qual. 2012, 41, 1014–1022. [Google Scholar] [CrossRef] [PubMed]
- Mozaffari, M.; Russelle, M.P.; Rosen, C.J.; Nater, E.A. Nutrient supply and neutralizing value of alfalfa stem gasification ash. Soil Sci. Soc. Am. J. 2002, 66, 171–178. [Google Scholar] [CrossRef]
- Banowetz, G.M.; El-Nashaar, H.; Steiner, J.J.; Gady, D. Non-Densified Biomass Gasification Method and Apparatus. US20110220846 A1, 15 September 2011. [Google Scholar]
- Griffith, S.M.; Banowetz, G.M.; Gady, D. Chemical characterization of chars developed from thermochemical treatment of Kentucky bluegrass seed screenings. Chemosphere 2013, 92, 1275–1279. [Google Scholar] [CrossRef] [PubMed]
- Mozaffari, M.; Rosen, C.J.; Russelle, M.P.; Nater, E.A. Chemical characterization of ash from gasification of alfalfa stems: Implications for ash management. J. Environ. Qual. 2000, 29, 963–972. [Google Scholar] [CrossRef]
- Trippe, K.M.; Griffith, S.M.; Banowetz, G.M.; Whitaker, G.W. Changes in Soil Chemistry following Wood and Grass Biochar Amendments to an Acidic Agricultural Production Soil. Agron. J. 2015. [Google Scholar] [CrossRef]
- Koenig, R.; Schroeder, K.; Carter, A.; Pumphery, M.; Paulitz, T.; Campbell, K.; Huggins, D. Soil acidity and aluminum toxicity in the Palouse Region of the Pacific Northwest. Available online: http://cru.cahe.wsu.edu/CEPublications/FS050E/FS050E.pdf (accessed on 15 July 2015).
- Ryan, P.R.; Kochian, L.V. Interaction between aluminum toxicity and calcium uptake at the root apex in near-isogenic lines of wheat (Triticum aestivum L.) differing in aluminum tolerance. Plant Physiol. 1993, 102, 975–982. [Google Scholar] [PubMed]
- Kochian, L.V. Cellular mechanisms of aluminum toxicity and resistance in plants. Annu. Rev. Plant Biol. 1995, 46, 237–260. [Google Scholar] [CrossRef]
- Sparling, D.W.; Lowe, T.P. Environmental Hazards of Aluminum to Plants, Invertebrates, Fish, and Wildlife; Springer: New York, NY, USA, 1996; pp. 1–127. [Google Scholar]
- Qian, L.; Chen, B. Interactions of aluminum with biochars and oxidized biochars: Implications for the biochar aging process. J. Agric. Food Chem. 2014, 62, 373–380. [Google Scholar] [CrossRef] [PubMed]
- Weng, L.P.; Wolthoorn, A.; Lexmond, T.M.; Temminghoff, E.J.M.; van Riemsdijk, W.H. Understanding the Effects of Soil Characteristics on Phytotoxicity and Bioavailability of Nickel Using Speciation Models. Environ. Sci. Technol. 2004, 38, 156–162. [Google Scholar] [CrossRef] [PubMed]
- Rees, F.; Simonnot, M.O.; Morel, J.L. Short-term effects of biochar on soil heavy metal mobility are controlled by intra-particle diffusion and soil pH increase. Eur. J. Soil Sci. 2014, 65, 149–161. [Google Scholar] [CrossRef]
- Genc, Y.; Tester, M.; McDonald, G.K. Calcium requirement of wheat in saline and non-saline conditions. Plant Soil 2010, 327, 331–345. [Google Scholar] [CrossRef]
- Kronzucker, H.J.; Coskun, D.; Schulze, L.M.; Wong, J.R.; Britto, D.T. Sodium as nutrient and toxicant. Plant Soil 2013, 369, 1–23. [Google Scholar] [CrossRef]
- Initiative, I.B. Standardized product definition and product testing guidelines for biochar that is used in soil. IBI biochar Stand. 2012. Availiable online: http://www.biochar-international.org/sites/default/files/IBI_Biochar_Standards_V2%200_final_2014.pdf (accessed on 14 August 2015). [Google Scholar]
- USDA-NRCS. Soil Series of Spokane County. In Official Soil Series Descriptions; USDA-NRCS, United States Department of Agriculture: Lincoln, NE, USA, 2006. Available online: http://www.nrcs.usda.gov/Internet/FSE_MANUSCRIPTS/washington/spokaneWA1968/spokaneWA1968.pdf (accessed on 14 August 2015). [Google Scholar]
- R Development Core Team. R: A Language and Environment for Statistical Computing; R Foundation for Statistical Computing: Vienna, Austria, 2014. [Google Scholar]
© 2015 by the authors; licensee MDPI, Basel, Switzerland. This article is an open access article distributed under the terms and conditions of the Creative Commons Attribution license (http://creativecommons.org/licenses/by/4.0/).
Share and Cite
Trippe, K.M.; Griffith, S.M.; Banowetz, G.M.; Whitaker, G.W. Biochars Derived from Gasified Feedstocks Increase the Growth and Improve Nutrient Acquisition of Triticum aestivum (L.) Grown in Agricultural Alfisols. Agriculture 2015, 5, 668-681. https://0-doi-org.brum.beds.ac.uk/10.3390/agriculture5030668
Trippe KM, Griffith SM, Banowetz GM, Whitaker GW. Biochars Derived from Gasified Feedstocks Increase the Growth and Improve Nutrient Acquisition of Triticum aestivum (L.) Grown in Agricultural Alfisols. Agriculture. 2015; 5(3):668-681. https://0-doi-org.brum.beds.ac.uk/10.3390/agriculture5030668
Chicago/Turabian StyleTrippe, Kristin M., Stephen M. Griffith, Gary M. Banowetz, and Gerald W. Whitaker. 2015. "Biochars Derived from Gasified Feedstocks Increase the Growth and Improve Nutrient Acquisition of Triticum aestivum (L.) Grown in Agricultural Alfisols" Agriculture 5, no. 3: 668-681. https://0-doi-org.brum.beds.ac.uk/10.3390/agriculture5030668