
Removing Gaseous NH3 Using Biochar as an Adsorbent


Abstract
:1. Introduction
2. Materials and Methods
2.1. Biochar
2.2. Activation of Biochar
2.3. Sample Handling/Preparation/Designation

| Symbols | Feedstock | Pyrolysis Temperature | Activation | Tested Condition |
|---|---|---|---|---|
| NA-WS500-AR | Wood Shaving | 500 °C | None | As Received |
| SA-WS500-AR | Wood Shaving | 500 °C | Steam | As Received |
| AA-WS500-AR | Wood Shaving | 500 °C | Acid | As Received |
| NA-WS500-VW | Wood Shaving | 500 °C | None | Virgin Washed |
| SA-WS500-VW | Wood Shaving | 500 °C | Steam | Virgin Washed |
| AA-WS500-VW | Wood Shaving | 500 °C | Acid | Virgin Washed |
| NA-WS500-US | Wood Shaving | 500 °C | None | Used Washed |
| SA-WS500-US | Wood Shaving | 500 °C | Steam | Used Washed |
| AA-WS500-US | Wood Shaving | 500 °C | Acid | Used Washed |
| NA-WS250-AR | Wood Shaving | 250 °C | None | As Received |
| SA-WS250-AR | Wood Shaving | 250 °C | Steam | As Received |
| AA-WS250-AR | Wood Shaving | 250 °C | Acid | As Received |
| NA-WS250-VW | Wood Shaving | 250 °C | None | Virgin Washed |
| SA-WS250-VW | Wood Shaving | 250 °C | Steam | Virgin Washed |
| AA-WS250-VW | Wood Shaving | 250 °C | Acid | Virgin Washed |
| NA-WS250-US | Wood Shaving | 250 °C | None | Used Washed |
| SA-WS250-US | Wood Shaving | 250 °C | Steam | Used Washed |
| AA-WS250-US | Wood Shaving | 250 °C | Acid | Used Washed |
| NA-CL480-AR | Wood Shaving | 480 °C | None | As Received |
| SA-CL480-AR | Wood Shaving | 480 °C | Steam | As Received |
| NA-CL480-VW | Wood Shaving | 480 °C | None | Virgin Washed |
| SA-CL480-VW | Wood Shaving | 480 °C | Steam | Virgin Washed |
| NA-CL480-US | Wood Shaving | 480 °C | None | Used Washed |
| SA-CL480-US | Wood Shaving | 480 °C | Steam | Used Washed |
| NA-CL250-AR | Wood Shaving | 250 °C | None | As Received |
| SA-CL250-AR | Wood Shaving | 250 °C | Steam | As Received |
| NA-CL250-VW | Wood Shaving | 250 °C | None | Virgin Washed |
| SA-CL250-VW | Wood Shaving | 250 °C | Steam | Virgin Washed |
| NA-CL250-US | Wood Shaving | 250 °C | None | Used Washed |
| SA-CL250-US | Wood Shaving | 250 °C | Steam | Used Washed |
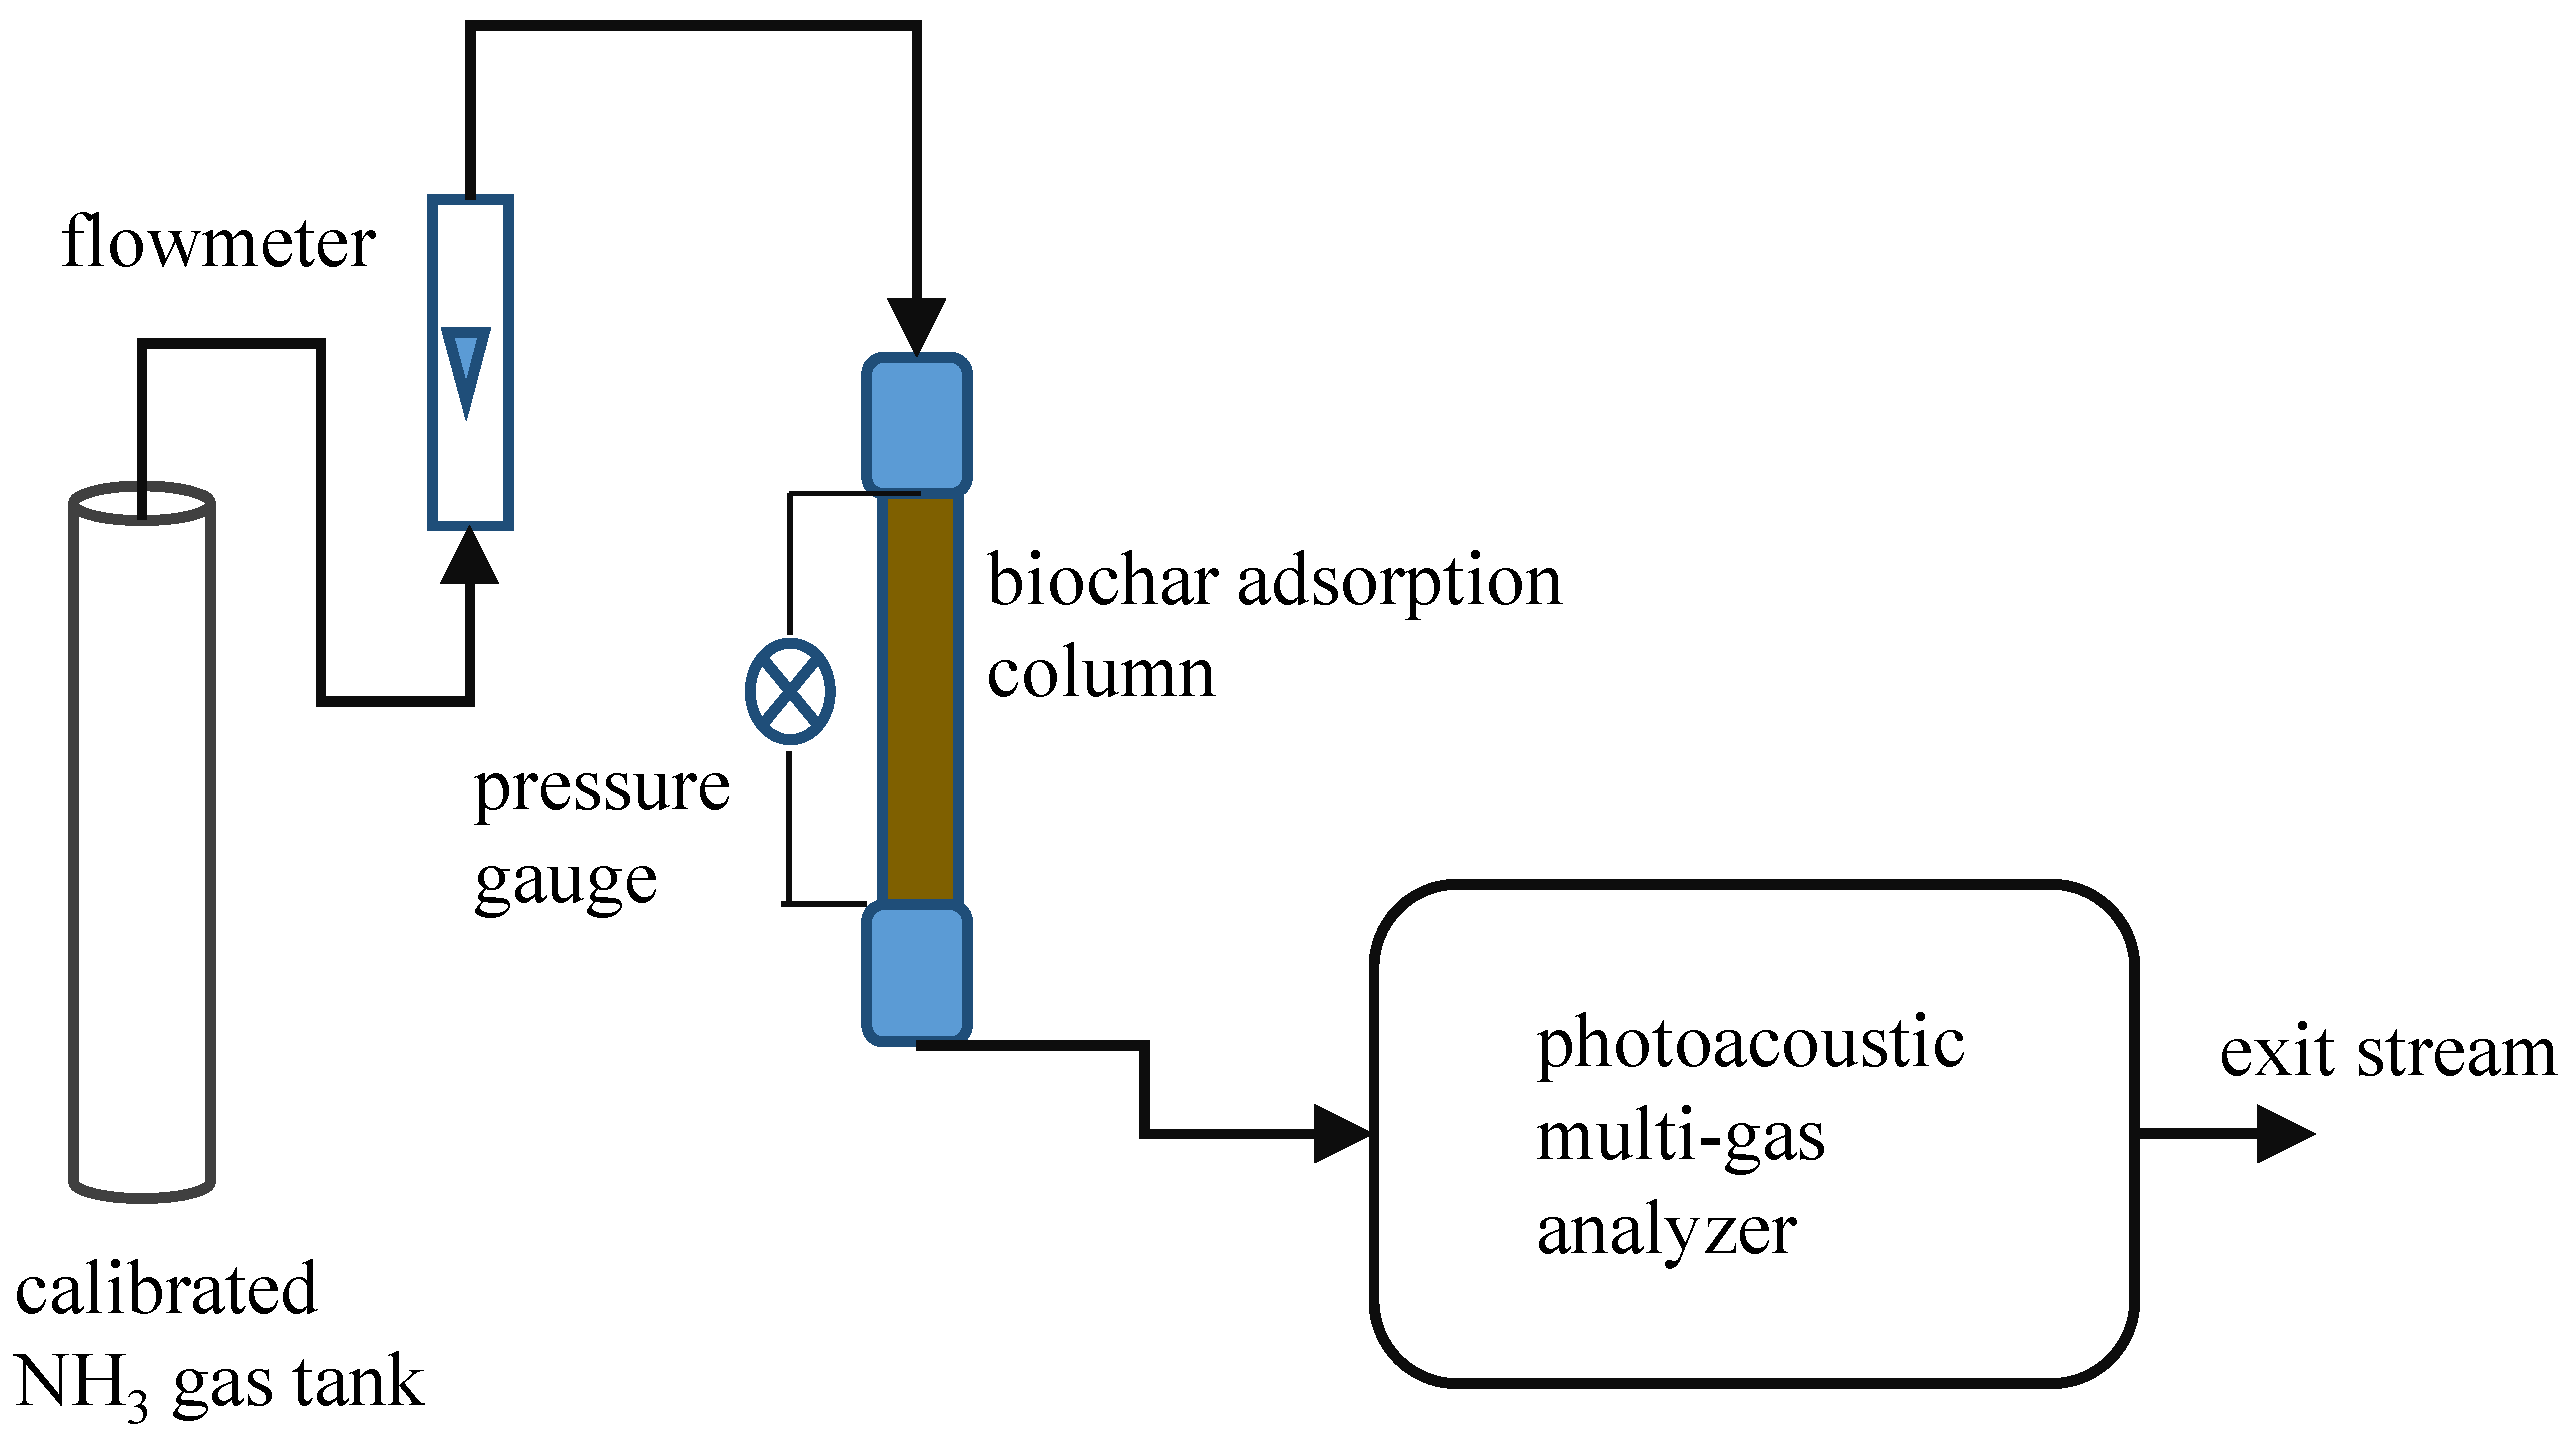
2.4. Adsorption Tests


2.5. Adsorption Capacity Estimation
2.6. Intrinsic and Bulk Density and Surface Area Measurements
2.7. Temperature Programmed Decomposition Analyses
2.8. Statistics
3. Results and Discussion
3.1. Biochar Characteristics
| Biochar | Bulk Density (g/cm3) | Intrinsic Density (g/cm3) | Surface Area (m2/g) |
|---|---|---|---|
| NA-WS500-AR | 0.23 ± 0.01 | 1.33 ± 0.05 | 0.88 ± 0.07 |
| SA-WS500-AR | 0.22 ± 0.00 | 1.99 ± 0.07 | 511 ± 1.4 |
| AA-WS500-AR | 0.20 ± 0.00 | 1.85 ± 0.08 | 538 ± 3.9 |
| NA-WS250-AR | 0.22 ± 0.00 | 1.44 ± 0.03 | 0.61 ± 0.12 |
| SA-WS250-AR | 0.19 ± 0.00 | 1.97 ± 0.04 | 573 ± 15 |
| AA-WS250-AR | 0.15 ± 0.01 | 1.80 ± 0.03 | 851 ± 7 |
| NA-CL480-AR | 0.28 ± 0.00 | 1.70 ± 0.07 | 4.50 ± 0.24 |
| SA-CL480-AR | 0.28 ± 0.01 | 1.97 ± 0.03 | 420 ± 40 |
| NA-CL250-AR | 0.24 ± 0.01 | 1.55 ± 0.01 | 1.40 ± 0.11 |
| SA-CL250-AR | 0.21 ± 0.01 | 2.22 ± 0.01 | 592 ± 0.93 |
| LSD0.05 | 0.01 | 0.08 | 25 |
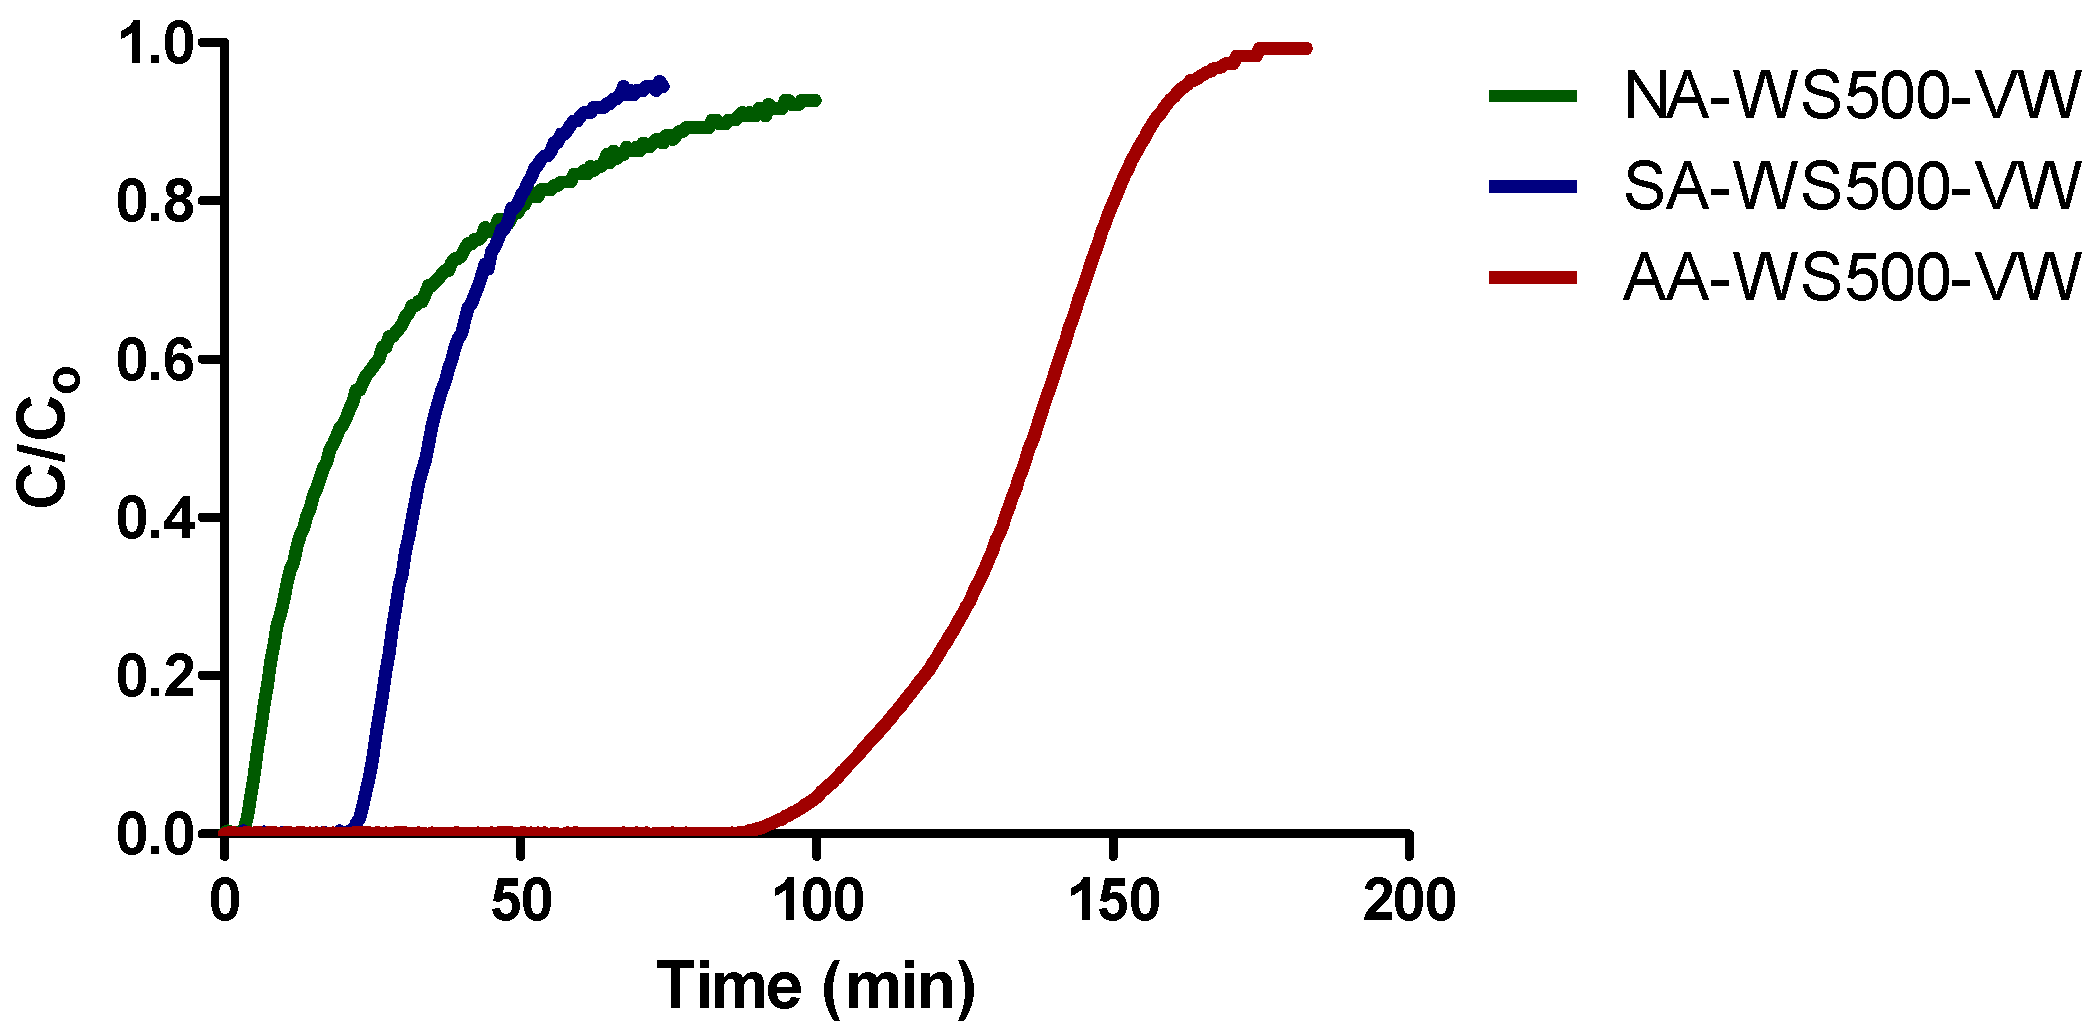
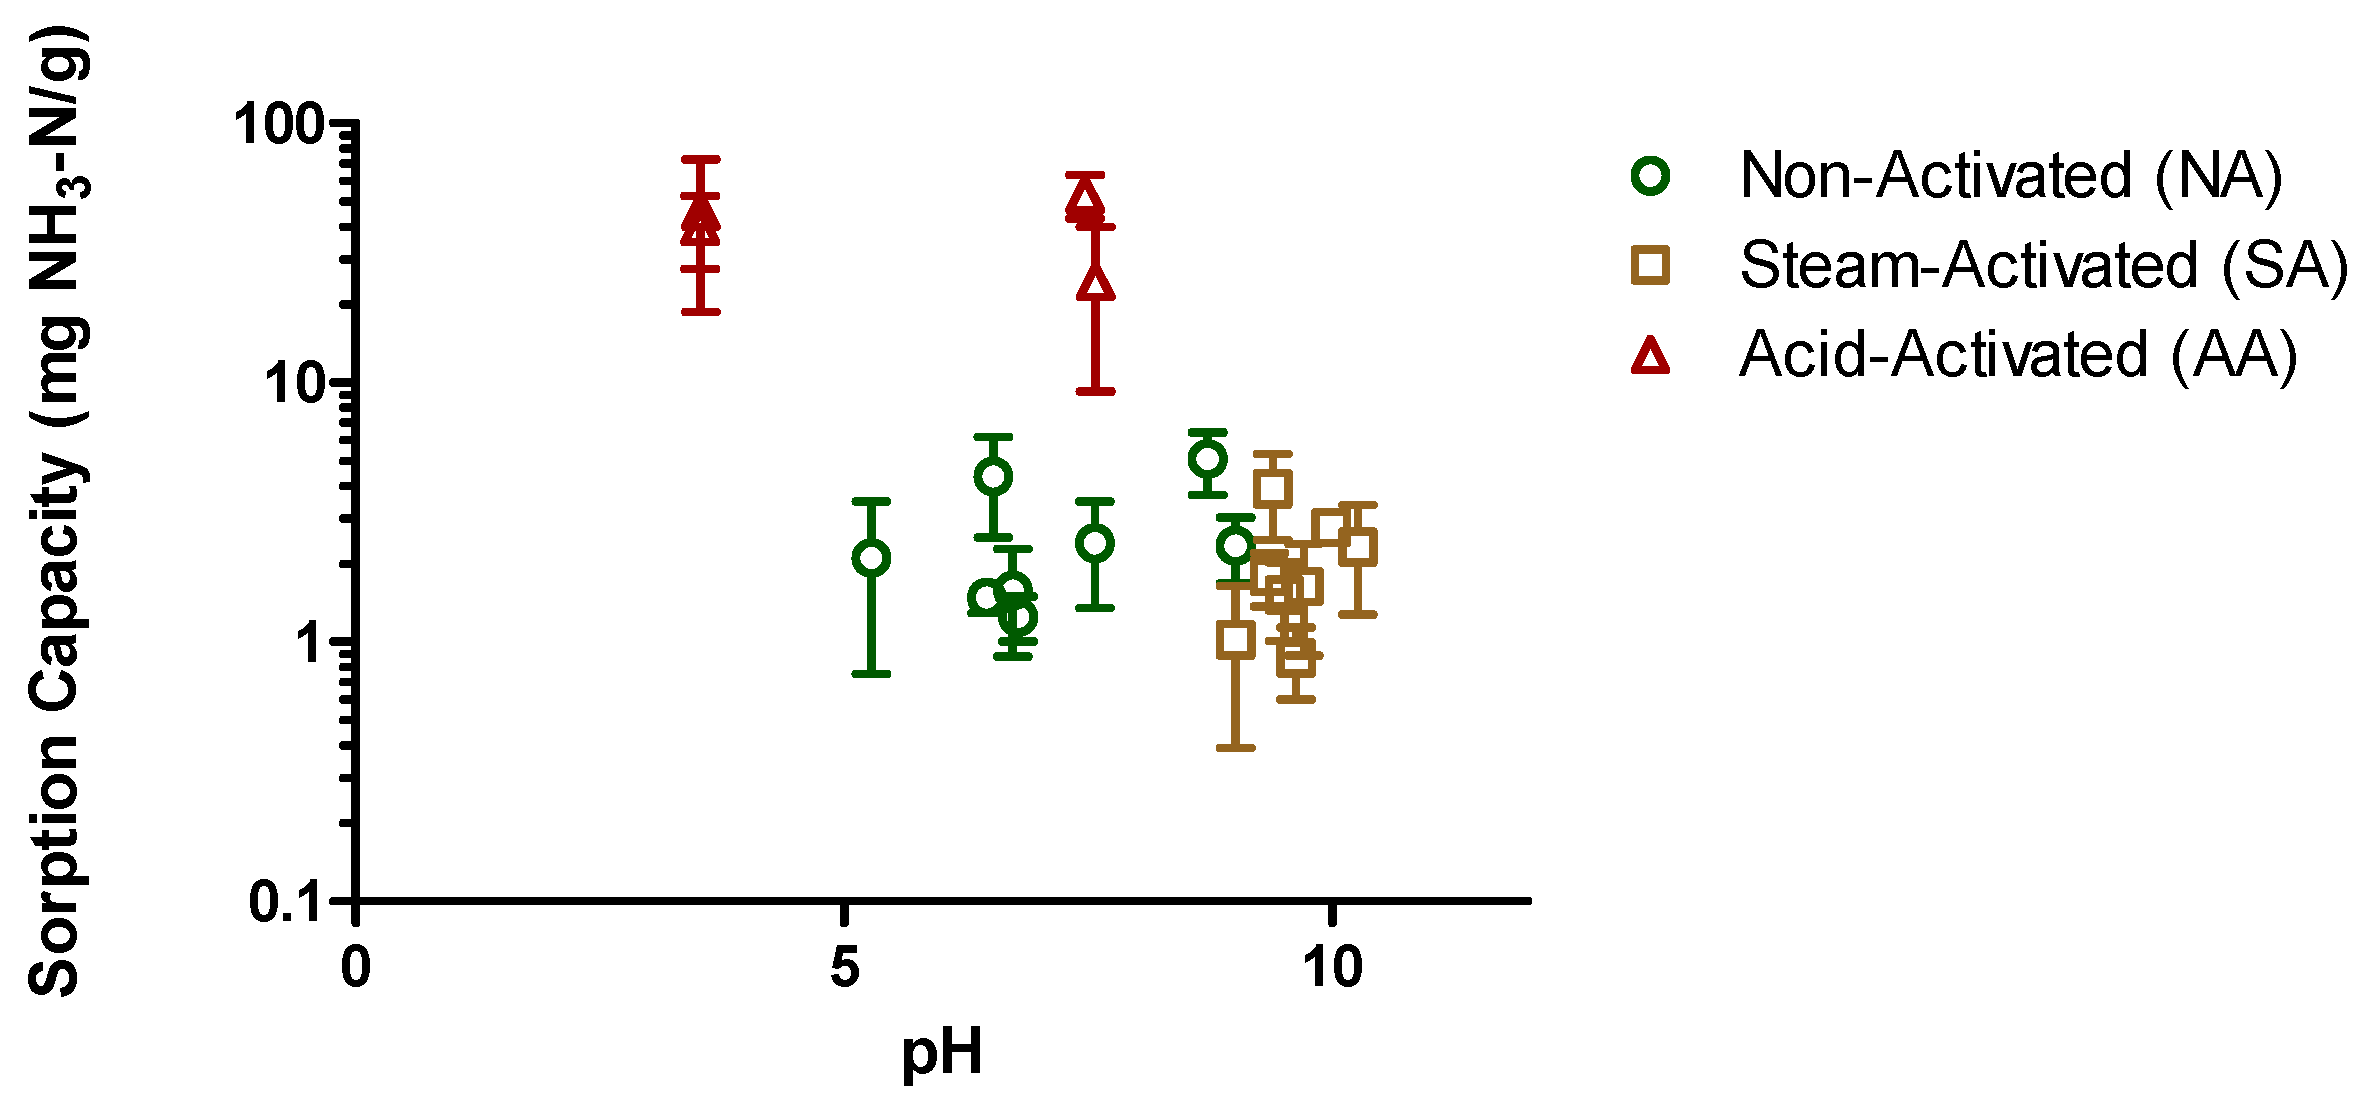
3.2. Ammonia Sorption Capacity of Biochar
| Biochar | As-Received (AR) | Virgin-Washed (VW) | Used-Washed (US) | LSD0.05 |
|---|---|---|---|---|
| NA-WS500 | 0.84 ± 0.10 | 1.25 ± 0.25 | 2.41 ± 1.06 | 1.26 |
| SA-WS500 | 0.63 ± 0.45 | 1.64 ± 0.75 | 1.79 ± 0.42 | 1.12 |
| AA-WS500 | 31.49 ± 16.11 | 40.11 ± 12.61 | 24.57 ± 15.33 | 29.50 |
| NA-WS250 | 2.47 ± 1.25 | 2.11 ± 1.36 | 4.36 ± 1.82 | 2.99 |
| SA-WS250 | 0.53 ± 0.31 | 0.87 ± 0.27 | 1.02 ± 0.63 | 0.87 |
| AA-WS250 | 51.86 ± 24.11 | 45.82 ± 26.99 | 53.09 ± 10.15 | 45.36 |
| NA-CL480 | 1.19 ± 0.03 | 2.35 ± 0.67 | 5.07 ± 1.38 | 1.77 |
| SA-CL480 | 0.44 ± 0.48 | 2.77 ± 0.16 | 1.52 ± 0.51 | 0.83 |
| NA-CL250 | 0.14 ± 0.21 | 1.48 ± 0.19 | 1.58 ± 0.70 | 0.87 |
| SA-CL250 | 0.20 ± 0.14 | 2.33 ± 1.05 | 3.90 ± 1.43 | 2.06 |
| LSD0.05 | 15.64 | 16.09 | 10.05 | - |

| Biochar | Virgin-Washed (VW) | Used-Washed (US) | † Significantly Different (p < 0.05)? |
|---|---|---|---|
| NA-WS500 | 6.78 ± 0.10 | 7.57 ± 0.55 | Y |
| SA-WS500 | 9.71 | 9.36 ± 1.25 | - |
| AA-WS500 | 3.53 ± 0.20 | 7.58 ± 1.27 | Y |
| NA-WS250 | 5.28 ± 0.05 | 6.53 ± 0.53 | Y |
| SA-WS250 | 9.63 ± 0.90 | 9.01 ± 0.67 | N |
| AA-WS250 | 3.54 ± 0.18 | 7.47 ± 0.29 | Y |
| NA-CL480 | 9.01 ± 1.06 | 8.72 ± 0.78 | N |
| SA-CL480 | 9.09 | 9.51 ± 1.42 | - |
| NA-CL250 | 6.46 ± 0.25 | 6.73 ± 0.31 | N |
| SA-CL250 | 10.26 ± 1.60 | 9.39 ± 1.22 | N |

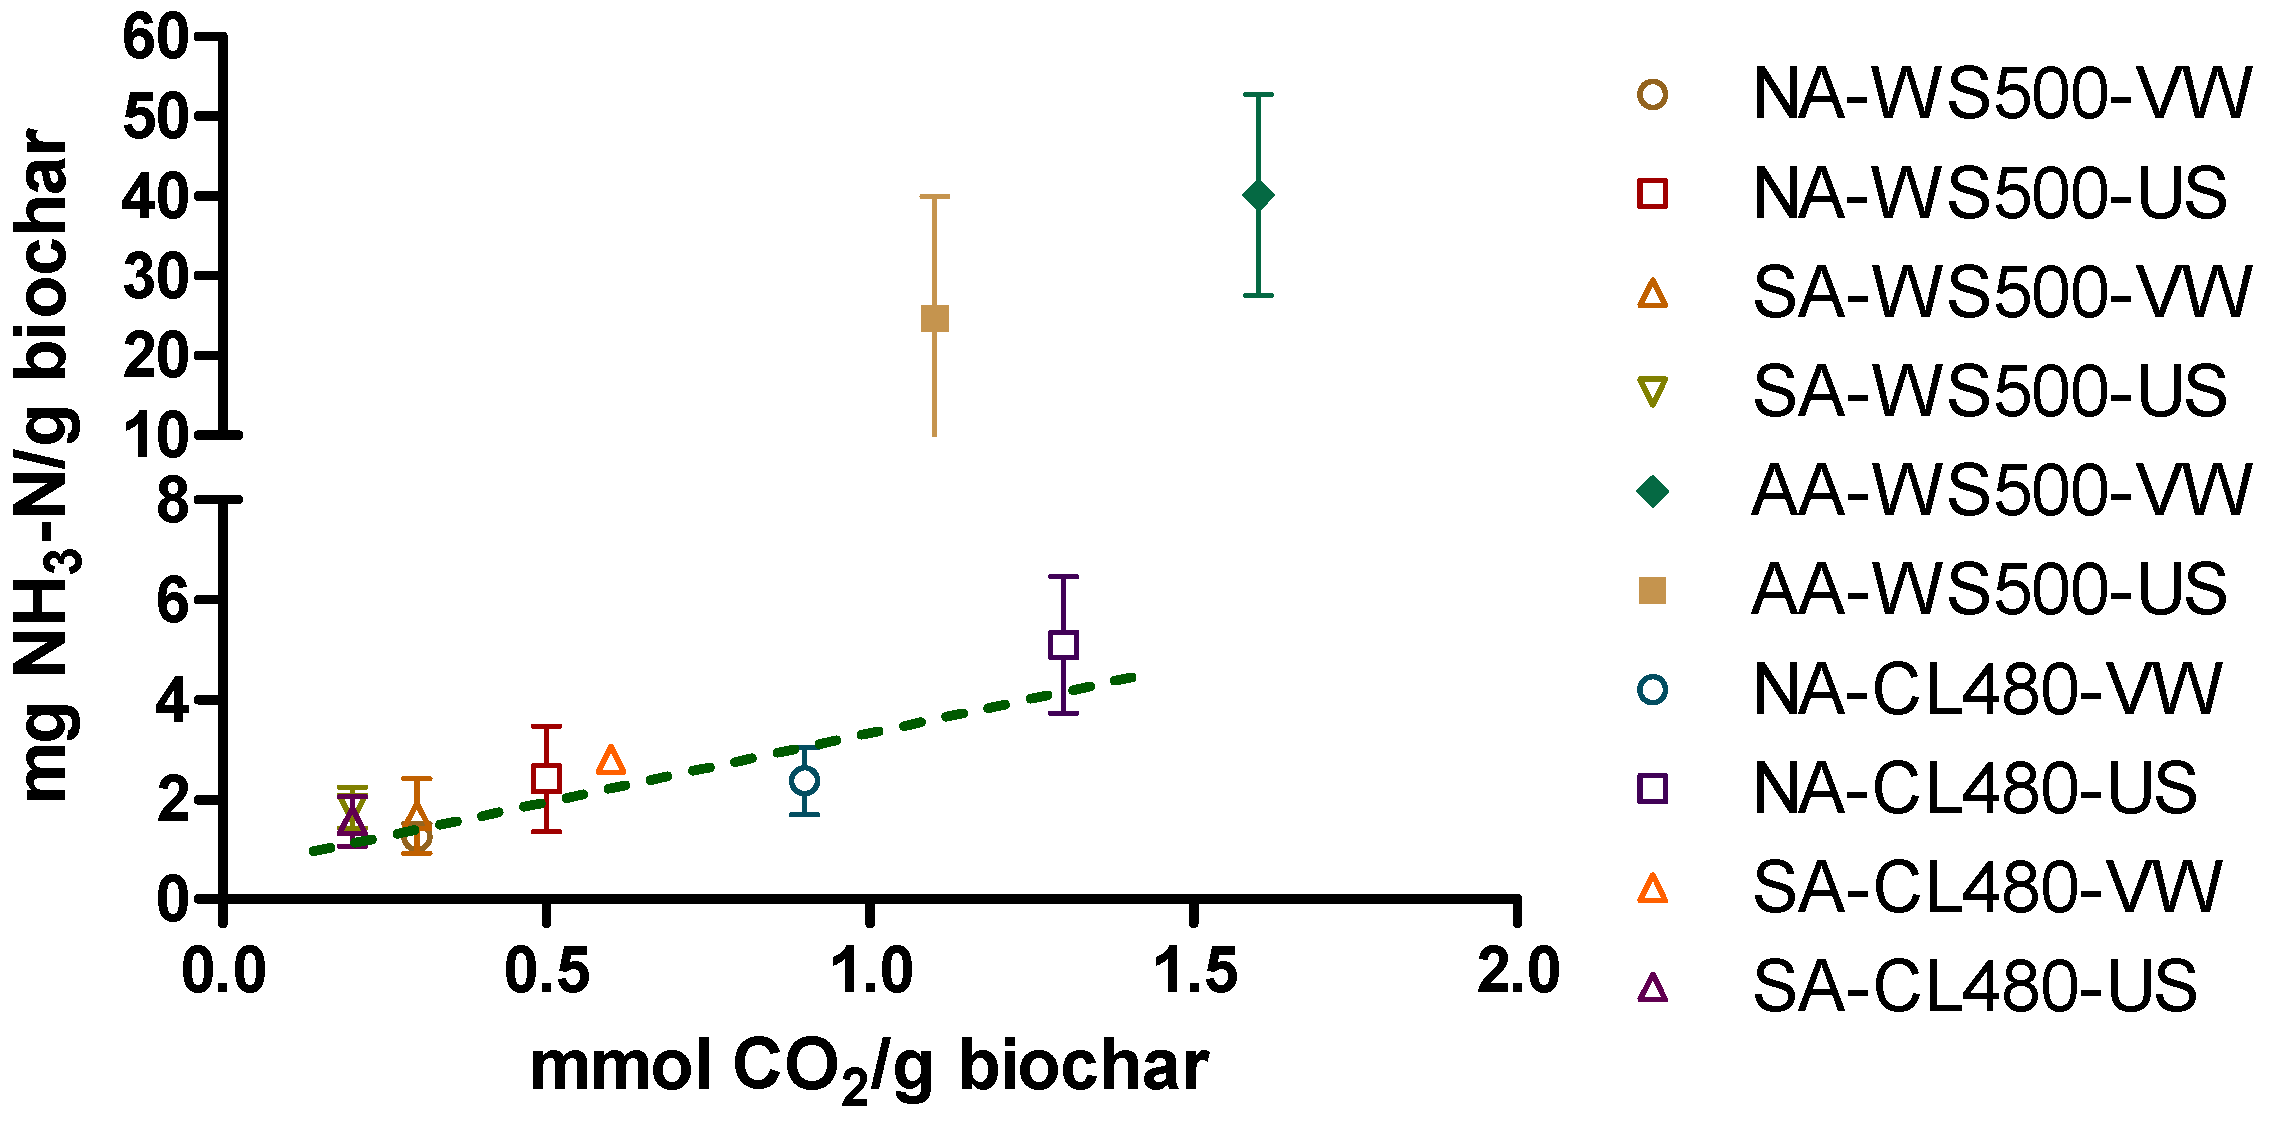
| Biochars | CO (mmol/g Biochar) | CO2 (mmol/g Biochar) | mg-NH3-N/g-Biochar |
|---|---|---|---|
| NA-WS500-VW | 1.2 | 0.3 | 1.25 |
| NA-WS500-US | 1.6 | 0.5 | 2.41 |
| SA-WS500-VW | 0.3 | 0.3 | 1.67 |
| SA-WS500-US | 0.7 | 0.2 | 1.83 |
| AA-WS500-VW | 5.0 | 1.6 | 40.15 |
| AA-WS500-US | 3.6 | 1.1 | 24.62 |
| NA-CL480-VW | 2.0 | 0.9 | 2.37 |
| NA-CL480-US | 3.1 | 1.3 | 5.09 |
| SA-CL480-VW | 1.6 | 0.6 | 2.80 |
| SA-CL480-US | 1.1 | 0.2 | 1.56 |
4. Conclusions
Acknowledgments
Author Contributions
Conflicts of Interest
References
- Phillips, J. Control and Pollution Prevention Options for Ammonia Emissions; Control Technology Center: Springfield, VA, USA, 1995. [Google Scholar]
- Helminen, J.; Helenius, J.; Paatero, E. Comparison of sorbents and isotherm models for NH3-gas separation by adsorption. Am. Inst. Chem. Eng. J. 2000, 46, 1541–1555. [Google Scholar] [CrossRef]
- Chung, Y.-C.; Lin, Y.-Y.; Tseng, C.-P. Removal of high concentration NH3 and coexistent H2S by biological activated carbon (BAC) biotrickling filter. Bioresour. Technol. 2005, 96, 1812–1820. [Google Scholar] [CrossRef] [PubMed]
- Goncalves, M.; Sanchez-Garcia, L.; de Oliveira Jardim, E.; Silvestre-Albero, J.; Rodriguez-Reinoso, F. Ammonia removal using activated carons: Effects of the surface chemistry in dry and moist conditions. Envion. Sci. Technol. 2011, 45, 10605–10610. [Google Scholar] [CrossRef] [Green Version]
- Rodrigues, C.C.; de Moraes, D., Jr.; da Nobrega, S.W.; Barboza, M.G. Ammonia adsorption in a fixed bed of activated carbon. Bioresour. Technol. 2007, 98, 886–891. [Google Scholar] [CrossRef] [PubMed]
- Kuo, S.-L.; Pedram, E.Q.; Hines, A.L. Analysis of ammonia adsorption on silica gel using the modified potential theory. J. Chem. Eng. Data 1995, 30, 330–332. [Google Scholar] [CrossRef]
- Asilian, H.; Mortazavi, S.; Kazemian, H.; Phaghiehzadeh, S.; Shahtaheri, S.; Salen, M. Removal of ammonia from air, using three Iranian natural zelites. Iran. J. Public Health 2004, 33, 45–51. [Google Scholar]
- Cantrell, K.; Hunt, P.G.; Uchimiya, M.; Novak, J.M.; Ro, K.S. Impact of pyrolysis temperature and manure source on physicochemical characteristics of biochar. Bioresour. Technol. 2012, 107, 419–428. [Google Scholar] [CrossRef] [PubMed]
- Ro, K.S.; Cantrell, K.B.; Hunt, P.G. High-temperature pyrolysis of blended animal manures for producing renewable energy and value-added biochar. Ind. Eng. Chem. Res. 2010, 49, 10125–10131. [Google Scholar] [CrossRef]
- Ro, K.S.; Hunt, P.G.; Jackson, M.A.; Compton, D.L.; Yates, S.R.; Cantrell, K.; Chang, S.C. Co-pyrolysis of swine manure with agricultural plastic waste: Laboratory-scale study. Waste Manag. 2014, 34, 1520–1528. [Google Scholar] [CrossRef] [PubMed]
- Libra, J.A.; Ro, K.S.; Kammann, C.; Funke, A.; Berge, N.D.; Neubauer, Y.; Titirici, M.M.; Fuhner, C.; Bens, O.; Kern, J.; et al. Hydrothermal carbonization of biomass residuals: A comparative review of the chemistry, processes and applications of wet and dry pyrolysis. Biofuels 2011, 2, 71–106. [Google Scholar] [CrossRef]
- Novak, J.M.; Spokas, K.A.; Cantrell, K.; Ro, K.S.; Watts, D.W.; Glaz, B.; Busscher, W.J.; Hunt, P.G. Effects of biochars and hydrochars produced from lignocellulosic and animal manure on fertility of a Mollisol and Entisol. Soil Use Manag. 2014, 30, 175–181. [Google Scholar] [CrossRef]
- Iyobe, T.; Asada, T.; Kawata, K.; Oikawa, K. Comparision of removal efficiencies fro ammonia and amine gases between woody charcoal and activated carbon. J. Health Sci. 2004, 50, 148–153. [Google Scholar]
- Taghizadeh-Toosi, A.; Clough, T.J.; Sherlock, R.R.; Condron, L.M. Biochar adsorbed ammonia is bioavailable. Plant Soil 2012, 350, 57–69. [Google Scholar] [CrossRef]
- Taghizadeh-Toosi, A.; Clough, T.J.; Sherlock, R.R.; Condron, L.M. A wood based low-temperature biochar captures NH3-N generated from ruminant urine-N, retaining its bioavailability. Plant Soil 2012, 353, 73–84. [Google Scholar] [CrossRef]
- Asada, T.; Ishihara, S.; Yamane, T.; Toba, A.; Yamada, A.; Oikawa, K. Science of bamboo charcoal: Study carbonizing temperature of bamboo charcoal and removal capability of harmful gases. J. Health Sci. 2002, 48, 473–479. [Google Scholar] [CrossRef]
- Kastner, J.R.; Miller, J.; Das, K.C. Pyrolysis conditions and ozone oxidation effects on ammonia adsorption in biocmass generated chars. J. Hazard. Mater. 2009, 164, 1420–1427. [Google Scholar] [CrossRef] [PubMed]
- Budavari, S.; O’Neil, M.; Smith, A.; Heckelman, P.; Obenchain, J. The Merck Index: An Encyclopedia of Chemicals, Drugs, and Biologicals, 12th ed.; Merck & Co., Inc.: Rahway, NJ, USA, 1996. [Google Scholar]
- Lima, I.M.; Ro, K.S.; Reddy, G.B.; Boykin, D.L.; Klasson, K.T. Efficacy of chicken litter and wood biochars and their activated counterparts in heavy metal cleanup from wastewater. Agriculture 2015, 5, 806–825. [Google Scholar] [CrossRef]
- Bohart, G.; Adams, E.Q. Some aspects of the behavior of charcoal with respect to chlorine. J. Am. Chem. Soc. 1920, 42, 523–544. [Google Scholar] [CrossRef]
- Aksu, A.; Gonen, F. Biosorption of phenol by immobilized activated sludge in a continuous packed bed: Prediction of breakthrough curves. Process Biochem. 2004, 39, 599–613. [Google Scholar] [CrossRef]
- Hutchins, R.A. New method simplifies design of activated-carbon systems. Chem. Eng. 1973, 80, 133–135. [Google Scholar]
- Ro, K.S.; McConnell, L.L.; Melvin, J.H.; Hunt, P.G.; Parker, D. Livestock air treatment using PVA-coated powdered activated carbon biofilter. Appl. Eng. Agric. 2008, 24, 791–798. [Google Scholar]
- Brewer, C.E.; Chuang, V.J.; Masiello, C.A.; Gonnermann, H.; Gao, X.; Dugan, B.; Driver, L.E.; Panzacchi, P.; Zygourakis, K.; Davies, C.A. New approaches to measuring biochar density and porosity. Biomass Bioenergy 2014, 66, 176–185. [Google Scholar] [CrossRef]
- Figueiredo, J.L.; Pereira, M.F.R. The role of surface chemistry in catalysis with carbons. Catal. Today 2010, 150, 2–7. [Google Scholar] [CrossRef]
© 2015 by the authors; licensee MDPI, Basel, Switzerland. This article is an open access article distributed under the terms and conditions of the Creative Commons Attribution license (http://creativecommons.org/licenses/by/4.0/).
Share and Cite
Ro, K.S.; Lima, I.M.; Reddy, G.B.; Jackson, M.A.; Gao, B. Removing Gaseous NH3 Using Biochar as an Adsorbent. Agriculture 2015, 5, 991-1002. https://0-doi-org.brum.beds.ac.uk/10.3390/agriculture5040991
Ro KS, Lima IM, Reddy GB, Jackson MA, Gao B. Removing Gaseous NH3 Using Biochar as an Adsorbent. Agriculture. 2015; 5(4):991-1002. https://0-doi-org.brum.beds.ac.uk/10.3390/agriculture5040991
Chicago/Turabian StyleRo, Kyoung S., Isabel M. Lima, Guidqopuram B. Reddy, Michael A. Jackson, and Bin Gao. 2015. "Removing Gaseous NH3 Using Biochar as an Adsorbent" Agriculture 5, no. 4: 991-1002. https://0-doi-org.brum.beds.ac.uk/10.3390/agriculture5040991