Sorption to Biochar Impacts β-Glucosidase and Phosphatase Enzyme Activities


1
Soil and Crop Sciences Department and Natural Resource Ecology Lab, Colorado State University, Fort Collins, CO 80521, USA
2
Chemistry and Biochemistry Department, California Polytechnic State University, Baker Center Building 180, San Luis Obispo, CA 93407, USA
*
Author to whom correspondence should be addressed.
Agriculture 2018, 8(10), 158; https://doi.org/10.3390/agriculture8100158
Submission received: 19 September 2018
/
Accepted: 9 October 2018
/
Published: 10 October 2018
(This article belongs to the Special Issue Biochar and Soil: What Is behind Its Impacts?)
Abstract
:Extracellular enzymes catalyze biogeochemical reactions in soil, cycling carbon and nutrients in agricultural systems. Enzymes respond quickly to soil management, including organic amendment inputs, such as biochar, a charcoal-like solid byproduct of bioenergy production. In a previous agricultural field trial, a pine biochar amendment caused an approximately 40% decrease in the enzyme activities of β-glucosidase (BG) and phosphatase (PHOS). The large surface area of the pine biochar has the potential to sorb nutrients and other organic molecules. To test if sorption caused decreased enzyme activity, we used a laboratory assay to quantify the activity of two sorbed enzymes: BG and acid PHOS, involved in the cycling of carbon and phosphorous. The enzymes were incubated with three solid phases: (1) the high surface area pine biochar, (2) the agricultural soil, and (3) a low surface area grass biochar, for an additional comparison. We quantified the sorbed enzymes at pH 6, 7, and 8, using a Bradford protein assay, and measured the immobilized enzyme activities via high-throughput fluorometric analysis. After sorption onto pine biochar, detectable BG and PHOS activity levels dropped by over 95% relative to the soil, supporting direct sorption as one mechanism that reduces enzyme activity in biochar amended soil. This laboratory assay demonstrated that sorption could account for the lack of priming of native soil organic matter and changes in soil phosphorous cycling after pine biochar addition.
1. Introduction
Agricultural amendment of soils with biochar, the solid co-product of bioenergy production, can have variable impacts on soil productivity and health [1,2,3,4]. Differences in pyrolysis times and temperatures create a wide variability in biochar surface area and charge, pore size distribution, pH, and chemical composition [3,5,6]. Due to these physiochemical differences, the impact of biochar on soil structure and biogeochemistry also varies widely. To assess the effect of biochar on soil function in agriculture, researchers can analyze the activity of microbial extracellular enzymes [7,8,9]. The extracellular proteins excreted by microbes break down macromolecules for uptake, catalyzing the rate-limiting steps of biochemical reactions [10,11,12]. The enzyme conformation, i.e., the specific structure, maintains the active site, shaped precisely to break down a specific substrate. Each enzyme acts most efficiently within a narrow optimal range of pH, temperature, and moisture levels. When the soil environment changes, the enzyme catalytic efficiency changes [13,14]. Due to this sensitivity, enzymes provide rapid indication of changes to soil quality, microbial activity, and nutrient cycling [11,15].
Biochar surfaces have a high potential to sorb organic molecules, including enzymes and substrate, thus altering enzyme activities [16,17]. Due to the varied nature of enzyme–solid phase interactions, impacts of biochar on enzyme activities remain nebulous. For example, in a single agricultural field trial, a 2.5% (w/w) addition of pine wood biochar increased activities of α-1,4-glucosidase, β-d-cellobiohydrolase, and β-1,4-N-acetylglucosaminidase, and significantly decreased β-1,4-glucosidase and phosphatase activities [18]. Of particular concern are the observed decreases in enzyme activities, which may reduce soil carbon and nutrient cycling. Specifically, the agricultural field trial found a 41% decrease in a glucose cycling hydrolytic enzyme, β-glucosidase (BG), and a 43% decrease in an organic phosphorus cycling enzyme, phosphatase (PHOS). Decreased enzyme activity in soil may relate to changes in soil structure and nutrient diffusion rates, to sorption of substrate, or to the direct sorption of the enzymes. These interactions require in-depth laboratory analysis before further interpretation of field results, especially if the enzymes sorb to biochar directly, resulting in loss of activity and cycling of critical crop nutrients. Management requires an understanding of the impact of biochar on extracellular enzymes before designing amendments that maximize, rather than impede, nutrient release.
Numerous studies on enzyme–soil mineral interactions reveal that sorption frequently occurs and can alter activity rates [19,20]. The sorption of enzymes, either adsorption to the solid phase surface or absorption into pore spaces, involves potential electrostatic, pH-controlled, hydrophobic, and physical interactions [21,22]. Depending on the mechanism, sorption to solid phases can either maintain the protein structure and functional active site [17,23], or alter the shape of the active site, reducing activity levels [21,24,25]. Certain biochars can stabilize [17] and increase activity for select enzymes [18,26]. However, more frequently, biochar exposure reduces enzyme activity, due to sorption of substrate [16,27,28], or direct interaction of the enzyme with biochar hydrophobicity and surface area [28,29,30]. Despite this growing research field, to our knowledge, no experiment directly quantifies the sorption and activity of biochar-immobilized enzymes in response to biochar surface properties.
This laboratory experiment tested the mechanisms behind previously reported field results: Does pine biochar directly sorb enzymes and, thus, account for the ~40% reduction in BG and PHOS activities? The assay explicitly measured enzyme sorption and subsequent activity after immobilization onto solid phases at three pH levels. This experiment tested the enzymes interacting with three solid phases: (1) the original sandy clay loam soil, (2) the pine biochar amended in the initial field experiment, and (2) a grass biochar, for further insight on different biochar physical properties. We quantified sorption via Bradford protein assay, followed by a fluorescence-based analysis of immobilized enzyme activities. The sorption of substrate was also tested with a similar activity assay. Based on previous in situ results from Foster et al. [18], we predicted that extracellular BG and PHOS would sorb onto pine biochar at similar rates, resulting in reduced activities relative to the soil and grass biochar. We predicted a higher percentage of PHOS sorption due to its smaller size, leading to lower PHOS activity than BG. Finally, we predicted higher sorption and lower activity would occur at the lowest assay pH, as the solid phases and enzymes approach their isoelectric points of zero charge.
2. Materials and Methods
2.1. Concentrated Enzymes
Two commercially available enzymes were selected to match the previous field study: β-glucosidase (BG) (from Aspergillus niger, Sigma-Aldrich 49291, St. Louis, MO, USA) and acid phosphatase (PHOS) (from sweet potato, Ipomoea batatas, Sigma-Aldrich P1435, St. Louis, MO, USA) (Table 1). The acid PHOS was selected rather than alkaline PHOS, to provide a comparison between enzymes with similar optimal pHs and maintain assay consistency. The enzymes were dissolved into 50 mM Tris at a concentration of 2 mg mL−1 for BG and 4 mg mL−1 for PHOS. These different concentrations were specifically chosen to meet detection limits of the Bradford protein assay (ThermoFisher Scientific, Waltham, MA, USA) and to help equalize the units of activity (U) present in each well per mg of enzyme (Table 1). The enzyme solutions were buffered to a pH of 6, 7, and 8. The highest pH was closest to the initial pH of the alkaline field soil, and the lower pH levels were closer to the optimum conditions for the two enzymes.
2.2. Solid Phases
Enzyme activity was quantified after sorption onto three air-dried and ground solid phases (Table 2). The pine biochar from the previous field experiment had a high surface area [18], so for contrast, we tested both the original sandy clay loam and a low surface area grass biochar. The soil was a mesic Aridic Haplustalfs [33], and reported in a previous field experiment as 51% sand, 20% silt, and 29% clay, with an organic carbon stock of 11.28 Mg ha−1 and a bulk density of 1.3 g cm−3 [34]. The grass biochar was produced at a lower pyrolysis temperature and had higher hydrophobicity than the pine biochar (Table 2). Hydrophobicity was measured on triplicate samples using water drop penetration time [35], and each sample given a relative rating based on infiltration time of either low (<15 s), medium (15–30 s), or high (>30 s). The solid phases were characterized by pH (1:1 in deionized water) and then by measuring their isoelectric points, the pH at which the surface charge, or zeta potential, equals zero. Briefly, the protocol of Asadi et al. [36] was followed, modified by first grinding the solid phases. The solid phase was suspended in a 0.01 M KNO3 solution with pH levels from 1 to 6 with dilute KOH or HNO3, bringing samples to a final concentration of 1.5 mg solid phase mL−1. Samples were analyzed on a NanoBrook Omni Zeta Potential Analyzer (Brookhaven Instruments Corp, Holtsville, NY, USA) to calculate a final average from ten runs. The soil possessed a negative zeta potential at pH 1, the lowest limit of the assay.
2.3. Enzyme Sorption Assay
To prepare the sorption assay, the three solid phases were air-dried and ground on a roller table into a powder. Five replicate 5 mg samples were weighed into microcentrifuge tubes, into which 100 μL of BG or PHOS enzyme solution was added. After vortexing, the mixed solution was incubated for one hour at ambient temperature (~25 °C). Incubation times longer than one hour resulted in measurements higher than the protein amount initially added, likely due to interference from other organic molecules coming from the solid phases. This background interference was measured for each solid phase and later subtracted from the final value. After centrifugation at 282× g for 3 min, 5 μL of supernatant was pipetted into a microplate with 250 μL of Coomassie reagent to conduct a colorimetric Bradford Protein Assay (ThermoFisher Scientific, Waltham, MA, USA). After ten minutes of reaction time, the plates were read at 595 nm with an Infinite M200 Microplate Reader (Tecan Trading AG, Männedorf, Switzerland). Each enzyme plate had a standard curve of six points prepared from the enzyme stock solution and the Coomassie reagent. The supernatant protein concentration measured by the Bradford assay was subtracted from the total protein added to calculate the quantity of enzyme immobilized according to the following:
Equation (1):
2.4. Enzyme Activity Assay
After completing the sorption experiment, we conducted a high-throughput fluorometric activity assay on the immobilized enzymes. Fluorometric assays are more accurate than colorimetric methods for enzyme activity to account for quenching with biochar [16]. Negative controls of the solid phases alone were run without added enzyme to determine the background activity. We also ran three positive controls, with enzyme only, to quantify the maximum activity of the free enzymes at pH 6, 7, and 8. This allowed analysis of activity at an alkaline pH as in the previous agricultural field experiment [18], as well as pH levels closer to the enzyme optimum (Table 1). Standard curves specific to each solid phase, enzyme, and pH were created to account for differences in fluorescence due to the assay conditions, including adsorption of reaction product to the solid phase. The grass biochar was only analyzed at pH 7 due to space constraints on the plate, thus, we could ensure the assay was completed on all samples with the exact experimental conditions.
To measure the immobilized enzyme activity, we first used 405 L of buffer to dilute the remaining 95 L enzyme and solid phase. This suspension was vortexed and pipetted into a deep-well plate. We added an additional 500 μL to the microcentrifuge tube to ensure all of the solid phase was transferred, confirmed visually. This rinse solution was also pipetted into the deep-well plate to capture any remaining solid phase, bringing each well to a 1000 μL final volume. The deep-well plate was then centrifuged for three minutes at 2900× g, and the supernatant was aspirated, leaving the solid phase and immobilized enzyme. Additional tests of number and volume of rinses demonstrated that the initial dilution effectively removed unbound enzyme, and further rinses started to remove the solid phase. Before the activity assay, another 800 μL of buffer was added to suspend the solid phase.
The assay measured maximum potential activity via release of fluorescent moieties from enzyme-specific substrate. Following the procedure of Bell et al. [8], 200 μL of a 200 μM fluorescent substrate was added to each well (4-methylumbelliferyl β-d-glucopyranoside for BG (Sigma Aldrich, M3633) and 4-methylumbelliferyl phosphate for PHOS (Sigma Aldrich, M8883, St. Louis, MO, USA). For each combination of pH, enzyme, and solid phase on the sample plate, there was a unique corresponding standard curve. The standard plates contained the sample suspension and the fluorogenic moiety 4-methylumbelliferone only, without the attached substrate. The standard curves were made at concentrations ranging from 0 to 200 mM and corrected for quenching due to the solid phase.
Both the sample and standard plates were allowed to react at ambient temperature (~25 °C) for 24 h. The longer assay time more closely simulated field conditions, accounting for any desorption or stabilization of the enzyme as might occur naturally. Controls showed that no uncatalyzed hydrolysis of the reactant or degradation of the product occurred over this time period. Fluorescence was read at 365 nm excitation and 450 nm emission on an Infinite M200 Microplate Reader (Tecan Trading AG, Männedorf, Switzerland). The gain was optimized and adjusted for each solid phase and standard curve, as the pine biochar quenched the standard curves more than the soil samples.
To analyze the activity data, we calculated catalytic efficiency using the following:
Equation (2):
This equation incorporates the amount of immobilized enzyme present in the well by multiplying the amount of enzyme added and the percent of sorbed enzyme. The rate was calculated per the entire assay period to more accurately reflect the experimental conditions.
2.5. Assay of Substrate Stability and Sorption
We ran an additional assay to test if the substrate sorption to the solid phases impacted activity levels. We allowed the substrate to interact with each solid phase for 24 h and then conducted a modified activity assay. Separately, we vortexed 5 mg of the three solid phases with 300 μL of the 200 μM BG and PHOS substrate and 4-methylumbelliferone fluorescent standard in 50 mM Tris buffer at pH 6, 7, and 8, in the same conditions as the previous assays. There also were controls with substrate only and no solid phase. The slurries incubated for 24 h, as in the previous assays, to test the stability of the compounds through the incubation period. The slurries were then centrifuged for three minutes at 2900× g and 100 μL of each supernatant was moved to a deep plate well with an additional 400 μL of buffer and 50 μL of enzyme (2 mg mL−1 BG and 4 mg mL−1 PHOS). This volume of enzyme matched the ratio of substrate to enzyme in previous activity assays. The standard curves and fluorescence readings were carried out exactly as the initial assays (Section 2.3) with a standard curve for each solid phase, pH, and enzyme combination. The solid phase specific standard curves accounted for the adsorption of reaction products in the assay.
2.6. Statistics
For the enzyme sorption data, a two-way analysis of variance (ANOVA) examined the effect of enzyme type with the three solid phases (soil, pine, and grass biochars). Then, a subsequent three-way ANOVA tested the interactive effects of enzyme type, pH, and only two solid phases (soil and pine biochar). Tukey post-hoc adjustments were used to make pairwise comparisons for significant interactions at the α = 0.05 level. To achieve normality, the enzyme sorption data were transformed by log (x + 1).
A nonparametric Kruskal–Wallis test analyzed the difference in sorbed enzyme activities between the two enzymes, solid phases, and pH levels. Again, the grass biochar only was compared at pH 7, so the effect of pH was only tested with the soil and pine biochar samples. The final activity values are presented without subtraction of the background activity, because this added unnecessary variability after error propagation, and did not change interpretation of results.
All statistical analyses were conducted using R software version 3.3.3 (R Core Team, 2017). The sorption data analyses used the lm, aov, and TukeyHSD functions. The nonparametric activity analysis implemented the kruskal.test function with a Dunn test for multiple comparisons from the FSA package [37], with false discovery rate adjusted p-values.
3. Results
3.1. Enzyme Sorption
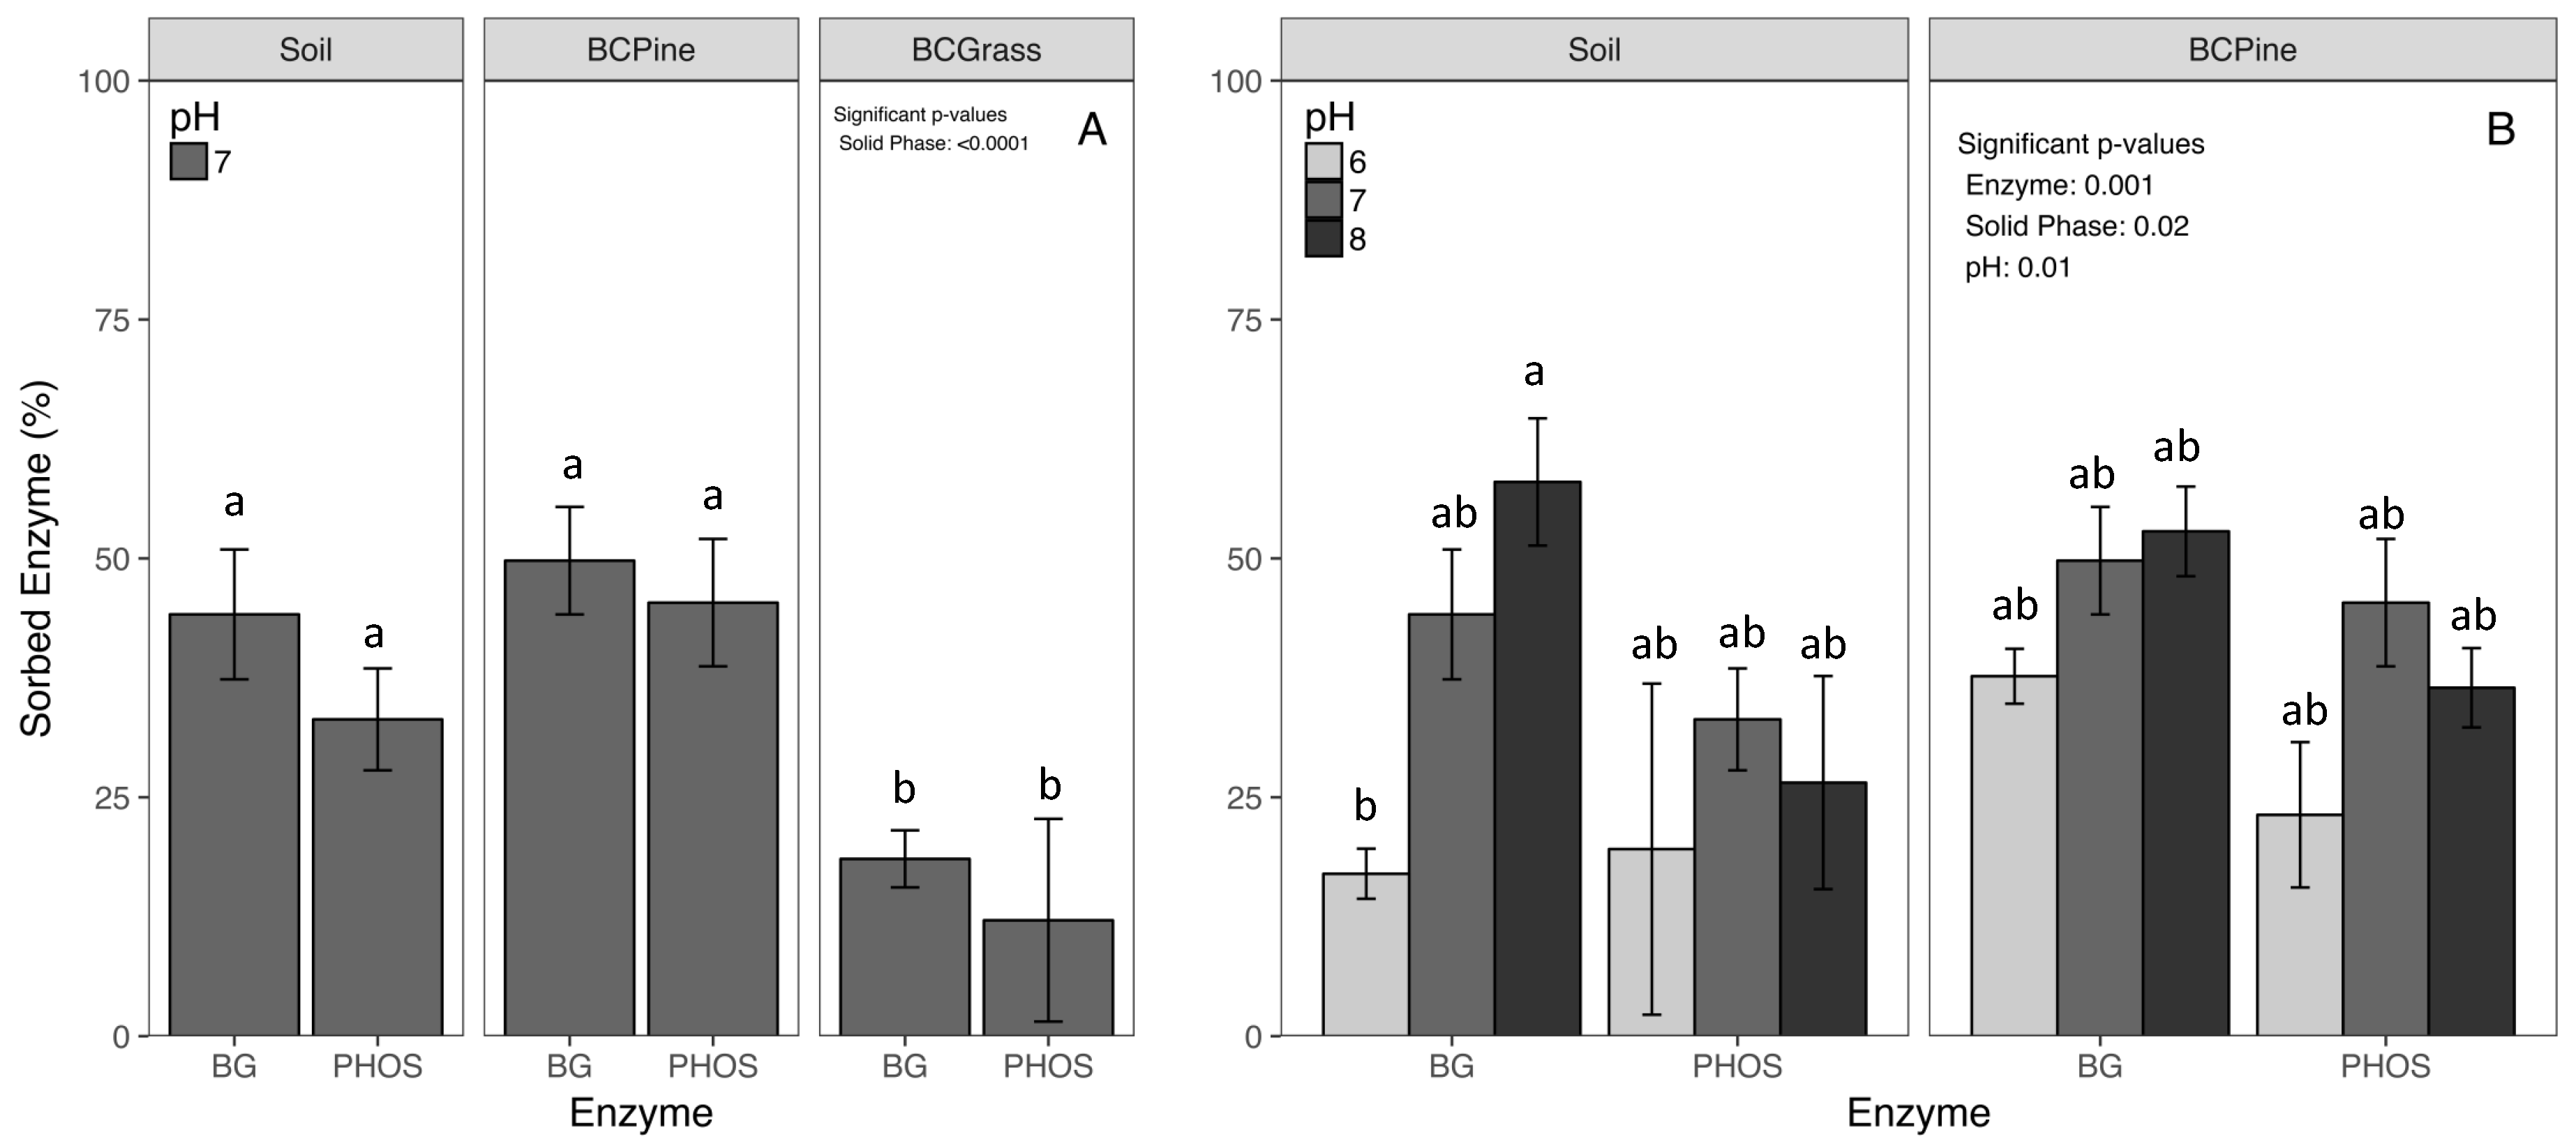
Across all three solid phases, the Bradford protein assay revealed average enzyme sorption of 33.9%, and statistically similar values for BG and PHOS (p = 0.07, Table S1, Figure 1). The pine biochar sorbed significantly more enzyme (47.5%) than the grass biochar at pH 7 (15.3%) (p < 0.01, Table S1, Figure 1A). However, the pine biochar sorbed nearly the same amount of enzyme as the soil (38.6%) (p = 0.20, Figure 1). The pH level significantly impacted sorption (p < 0.05, Table S2, Figure 1B). Sorption was approximately 19% lower at pH 6 than pH 7 and 8 (p < 0.01). The highest sorption occurred with BG to soil at pH 8 and the lowest sorption occurred with BG to soil at pH 6 (p = 0.10, Figure 1B).
3.2. Enzyme Activity
In the activity assay, we detected a small amount of background activity (<2 nmols) from the biochars, and a larger amount in the soil (PHOS = 6.7 nmols and BG = 2.8 nmols) at pH 8. However, subtraction of this background did not alter the interpretation of results; thus, initial values are presented in Figure 2. After standard curve calculations were applied, all negative activity rates were set to zero. The exact quantity of substrate degraded (nmols) by the two enzymes adsorbed to solid phases, and free enzymes are presented in Table S3.
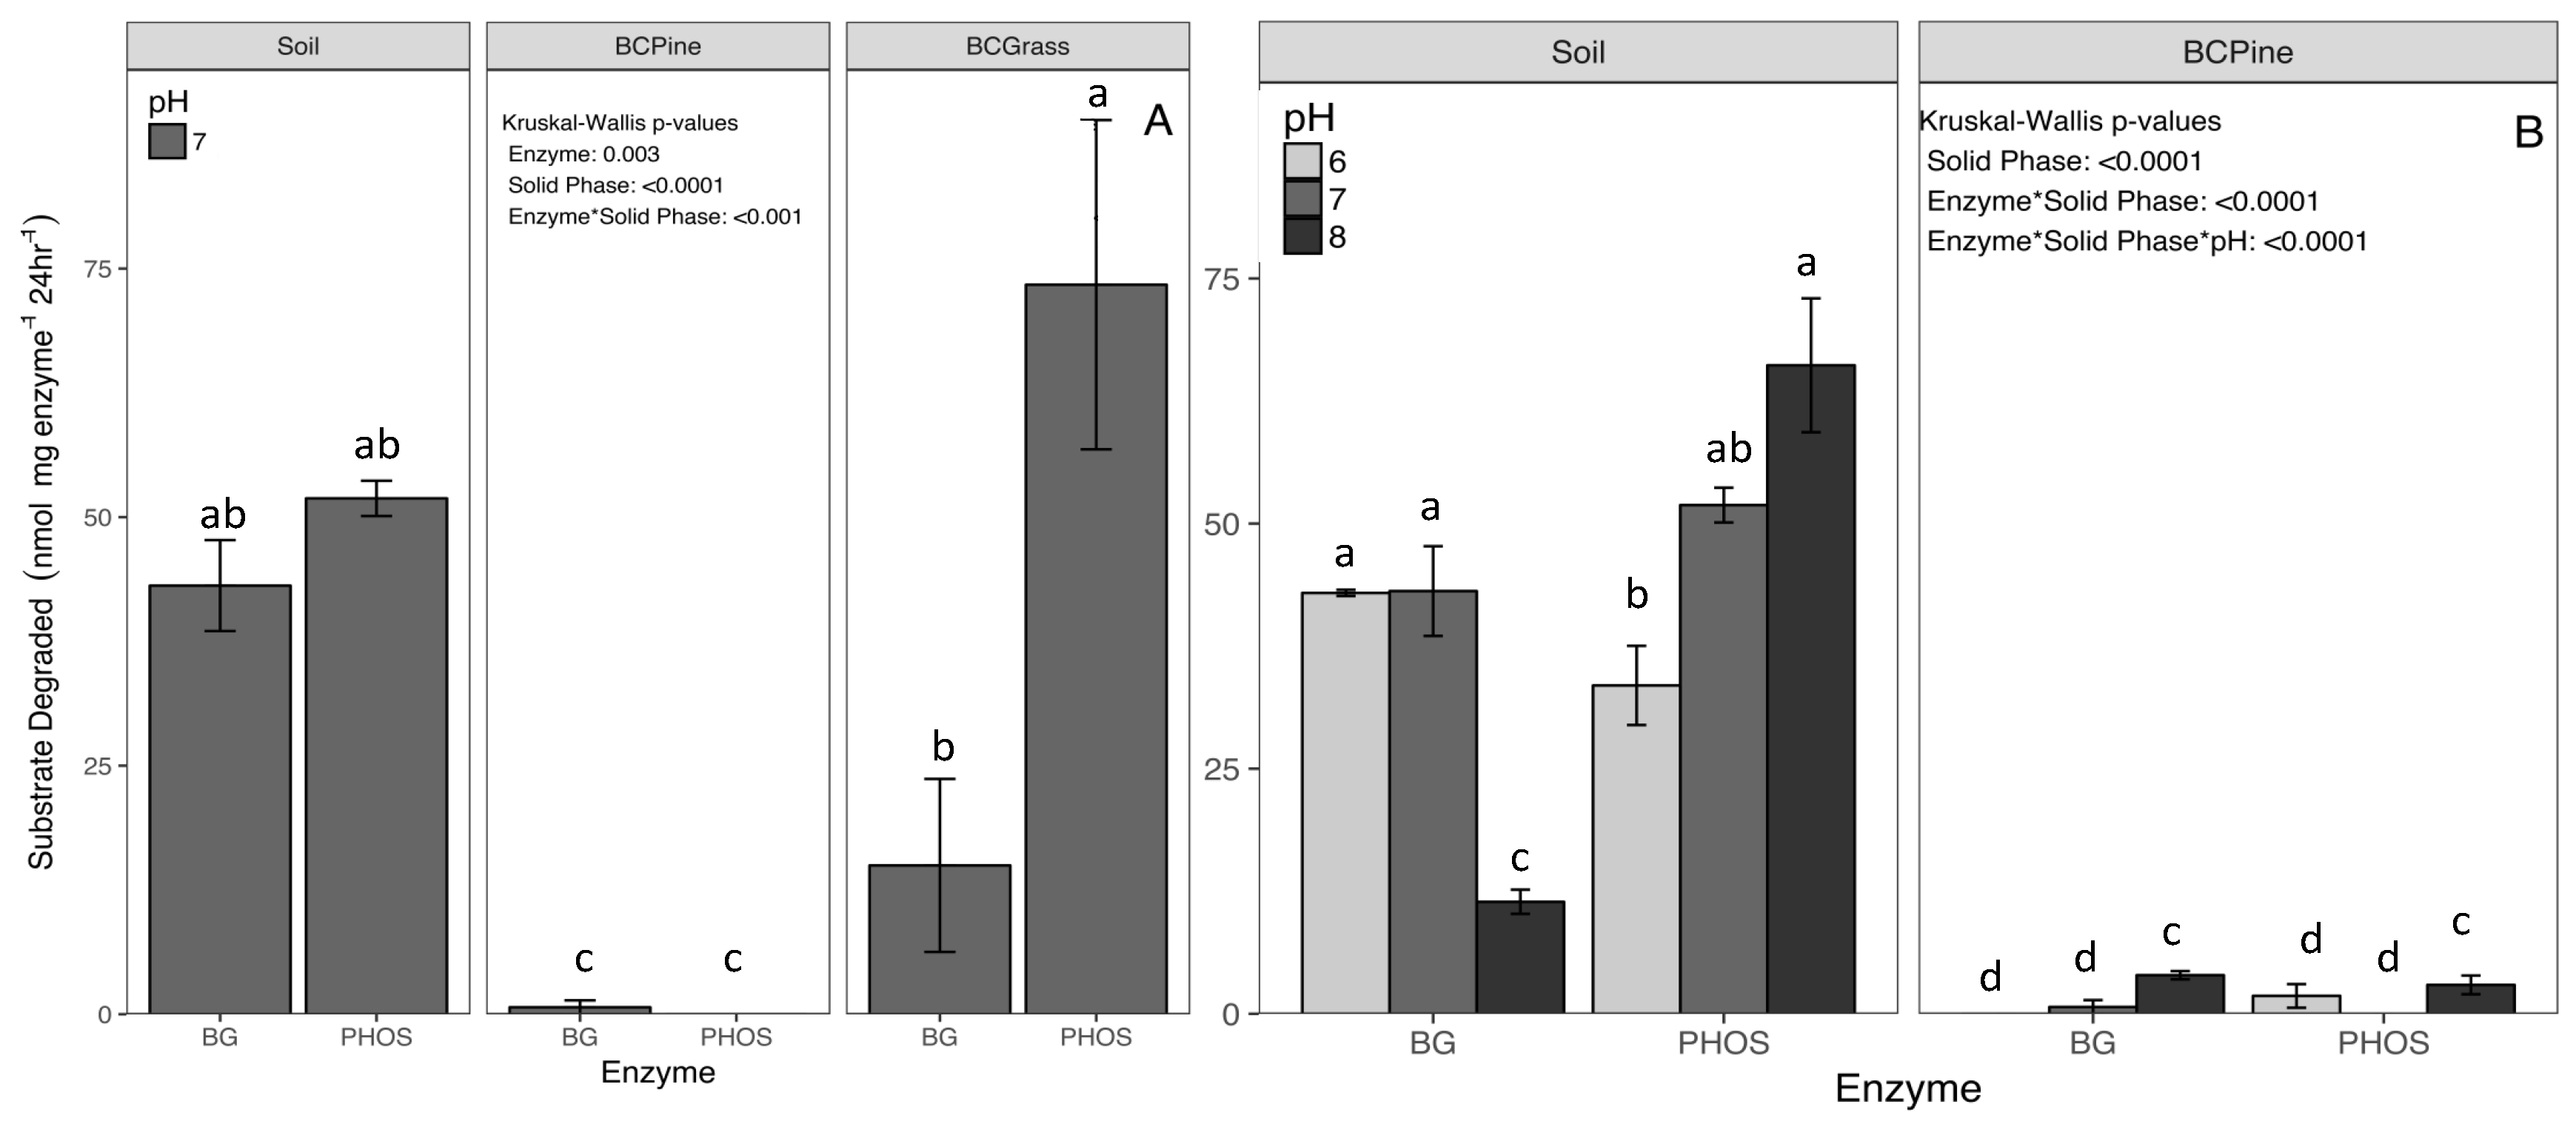
The amount of substrate degraded depended primarily upon the solid phases (p < 0.0001) and their interaction with enzyme and pH level (p < 0.001, Figure 2.). Overall, pine biochar immobilization decreased enzyme activity to less than 1 nmol mg enzyme−1 24 h−1 at pH 7. The enzymes maintained activity levels of 48 nmols mg enzyme−1 when sorbed to soil, and 44 nmols mg enzyme−1 24 h−1 when sorbed to grass biochar at pH 7 (p < 0.001, Figure 2A). The amount of substrate degraded by PHOS averaged over all pH levels was higher than that of BG during the 24 h assay (+ 5 nmols mg enzyme−1 24 h−1, p < 0.001, Figure 2B). When adsorbed to grass biochar there was a decrease in BG activity to 15.0 nmols mg enzyme−1 24 h−1, relative to soil (43.1 nmols mg enzyme−1 24 h−1). By contrast, the grass biochar-sorbed PHOS activity was 73.4 nmols mg enzyme−1 24 h−1, 41% higher than the soil PHOS activity (51.9 nmols mg enzyme−1 24 h−1) (Figure 2A).
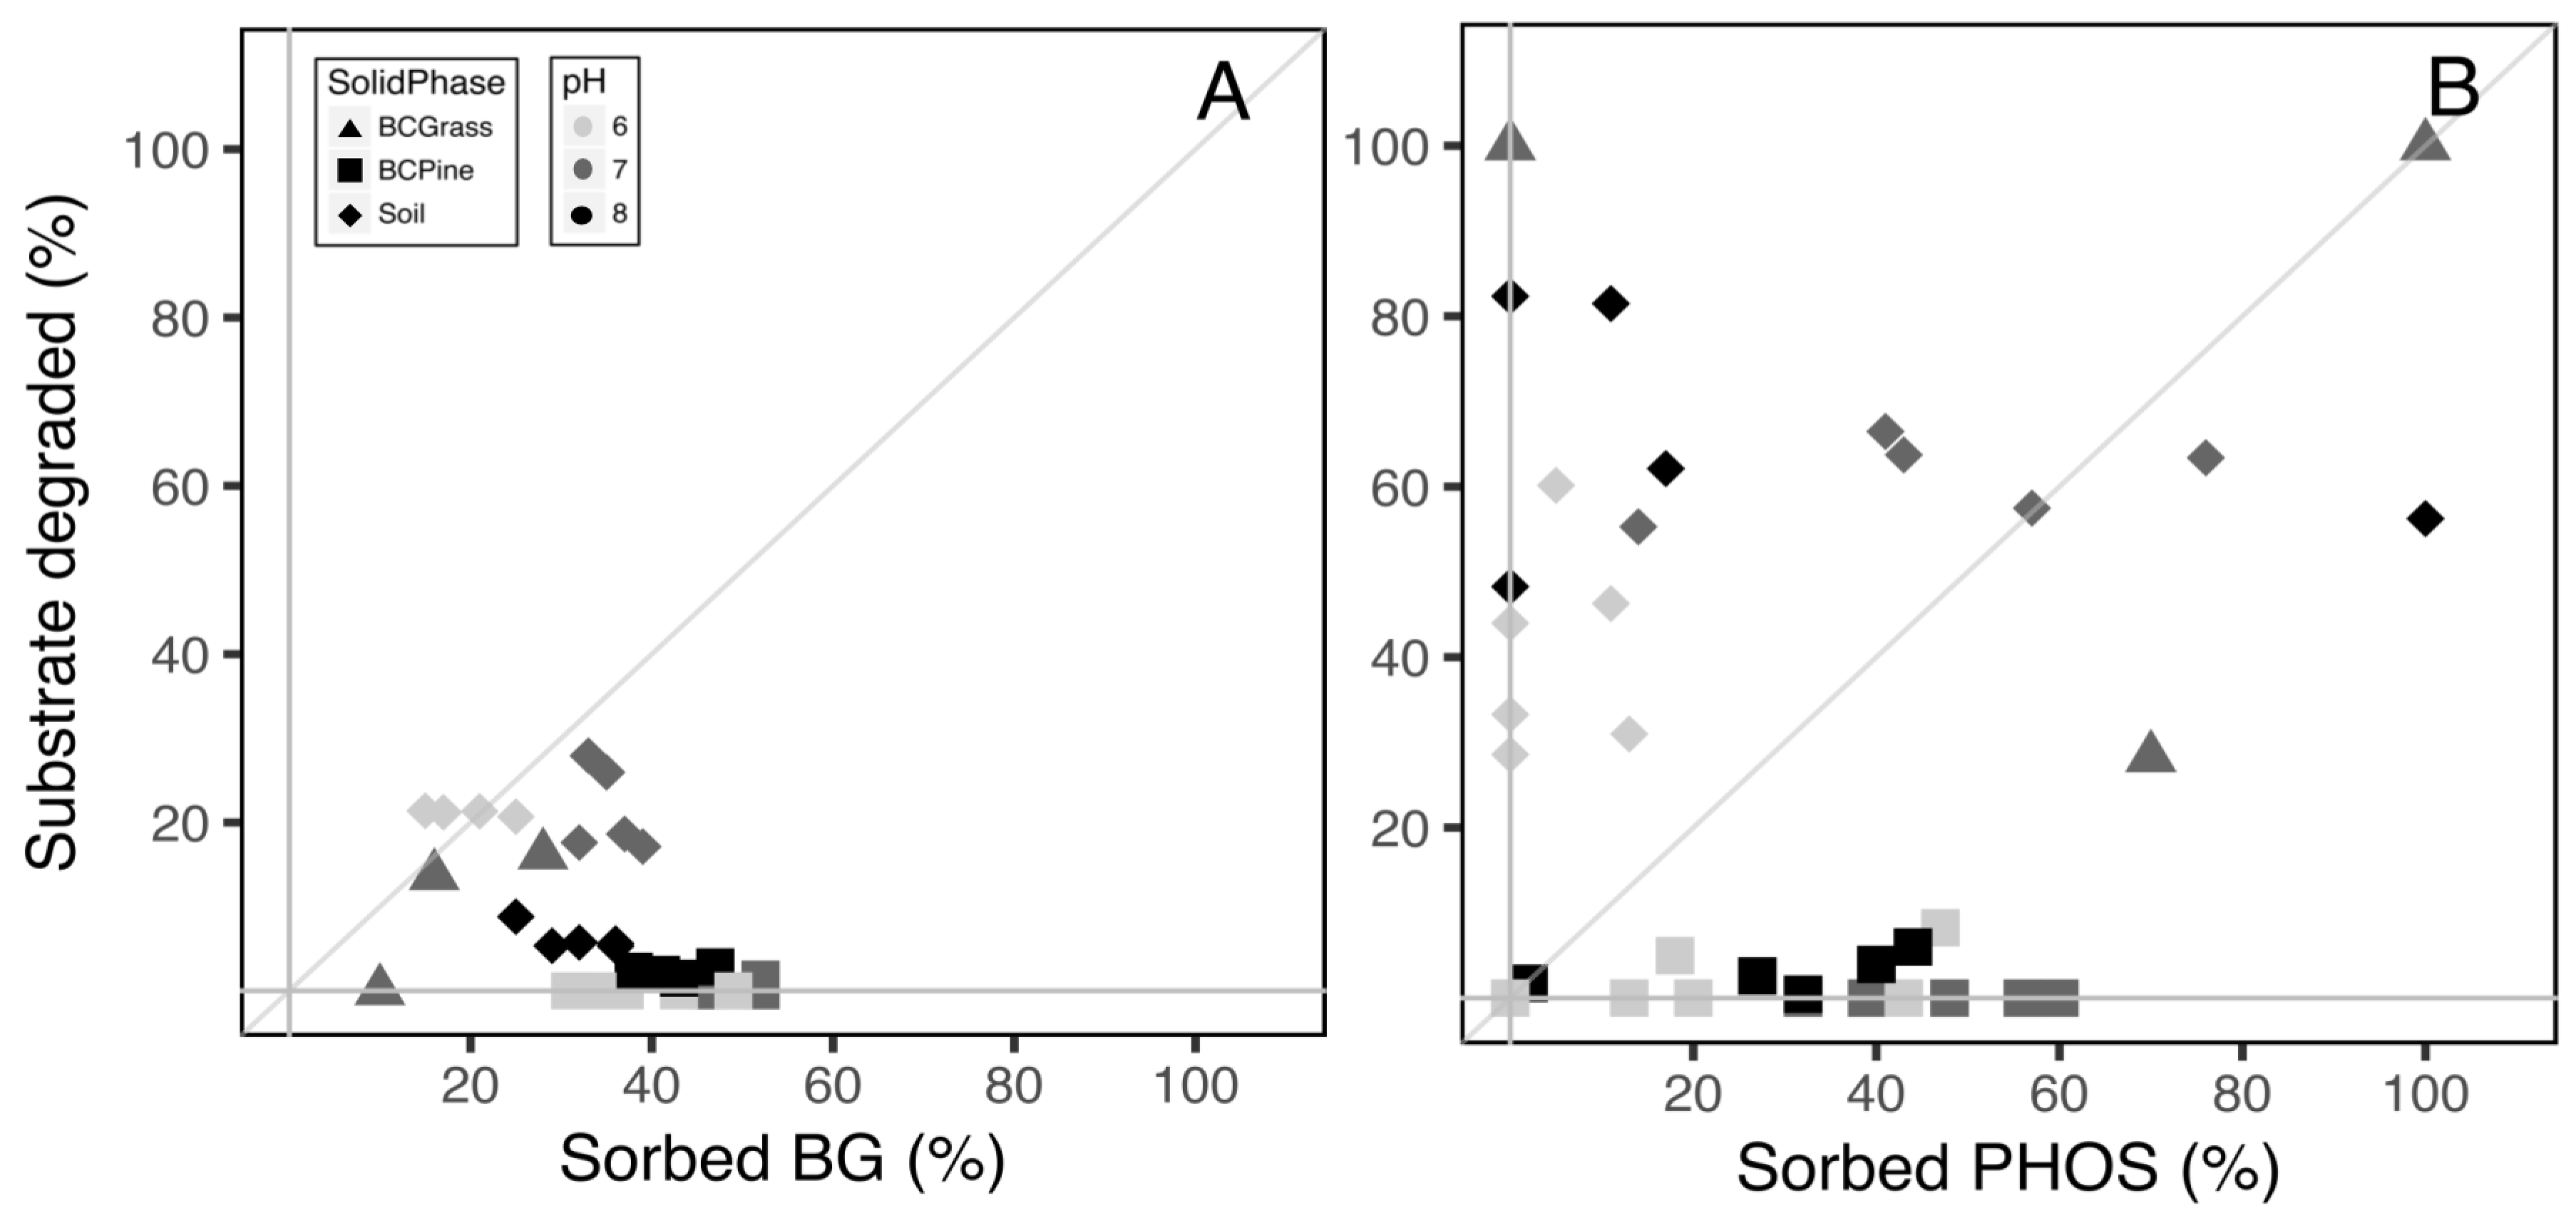
To further examine these patterns and to contrast the two enzymes, we plotted the initial data of percent sorption versus the percent of substrate degraded (Figure 3A,B). The percent of substrate degraded was calculated by taking the nmols mg enzyme−1 24 h−1 and dividing by the 40 nmols of substrate added to each well. An activity of 100% indicates all the substrate was degraded in the well. The diagonal 1:1 line represents when the sorbed enzymes degraded the expected quantity of substrate, related to the quantity of enzymes remaining in the well (% sorption). These figures show the higher efficiency of PHOS, with more points along or above the dotted 1:1 line. There was low activity of BG at pH 8 on soil and pine biochar (black diamonds and squares (Figure 3A), and low activity of both enzymes immobilized on the pine biochar (squares, Figure 3A,B).
3.3. Assay of Substrate Stability and Sorption
The substrate sorption assay with specific standard curves and plate runs showed only slight differences due to the solid phases in interaction with pH (p = 0.0965) (data not shown). Pairwise comparisons revealed no significant differences between the controls without solid phase versus the soil, pine, or grass biochar. The enzyme activity rates with the solid phase-exposed substrate did vary in response to pH and enzyme. The activity at pH 6 was lower than pH 7 or 8 (p < 0.015) and PHOS activity was lower than BG activity rates (p = 0.0319).
4. Discussion
4.1. Enzyme Sorption
The enzyme type, solid phase, and pH all influenced the amount of sorption. Both enzymes sorbed to all of the solid phases. The similar sorption between soil and pine biochar could be due the diameter of the biochar pores. One third of the pine biochar surface area occurred within pore spaces with an average width of 4.51 nm (Table 1), smaller than the enzymes tested in this study [25]. This result indicates that enzyme sorption depends on biochar pore size and does not merely correlate with surface area alone [17].
The relatively similar enzyme sorption onto the three solid phases (15–43%) could relate to the negative surface charges of the solid phases and enzymes. As the assay was run at pH 6–8, higher than the isoelectric point of the solid phases (Table 2), each surface had a negative charge, resulting in similar sorption capacities. This also helps to explain the relatively similar sorption onto pine biochar, despite its much larger surface area. An enzyme will sorb more to a negatively charged mineral surface when the enzyme is at its isoelectric point, and possesses no charge [24,38]. This was observed previously with a wood biochar and BG at a pH of 5, close to its isoelectric point [27]. In this experiment, the pH levels were above the isoelectric points of the enzymes to better match the initial field conditions. Above the isoelectric points for BG (4) and PHOS (5.2), both enzymes possessed negative charges [30] and, thus, similar sorption rates occurred. Surprisingly, the decrease in negative surface charge at low pH was not observed across our range of pH from 6 to 8. Another consideration is that the measured pH of the bulk solution may be higher than the pH precisely at the solid phase surface. This may explain why the lab incubation resulted in a more variable pattern, with the lowest sorption at pH 6, a finding that contradicted our prediction based on enzyme surface charge.
Though the grass biochar also possessed a negative charge, the low surface area and high hydrophobicity likely caused lower sorption rates than the soil and pine biochar. Lower temperature biochars are often more hydrophobic [29]; the grass biochar used in this study would repel hydrated amino acid sidechains (especially for BG), as previously observed with clay minerals [38]. To tease apart the exact mechanism involved in sorption, future research must consider the exact hydrogen ion concentration at the solid phase surface, and both electrostatic and hydrophobic interactions of enzymes and biochar.
4.2. Enzyme Activity
Prior research shows that depending on the environment, biochar–enzyme interactions can increase [39,40], decrease [15,18,30], or have no effect on catalytic capacity [15]. Field results depend on specific enzymes [16,17,18], biochar application rate [39,41], soil type [16], and indirect effects on soil physiochemical properties, such as pH of the soil solution [38], sorption of inorganic and organic chemicals [42], water retention, and pore structure [43]. By simplifying the system, this lab assay quantified the loss of over 95% of BG and 97% of PHOS activity after sorption to pine biochar. This can help to explain the decreased enzyme activities measured in our previous pine biochar agricultural field experiment [18].
The decline in enzyme activities resulted primarily from direct sorption. Simultaneously, a small amount of substrate sorption also occurred, particularly onto the pine biochar. Therefore, we do not exclude the possibility of BG substrate adsorption to the pine biochar as one mechanism for reduced activity rates, as the polar glucose substrate may readily adsorb to negatively charged solid phases. The phosphate substrate, in contrast, contains both the hydrophobic fluorescent moiety and the negative phosphate group, so the reduced phosphatase activity is likely only due to direct sorption of the enzyme. Previous laboratory incubations also revealed that biochar can sorb the reaction products of colorimetric enzyme assays [28]. Since we used a fluorometric assay, with solid phase-matched standard curves, this provided a more accurate quantification of enzyme activity with biochar. Although the standard curves for pine biochar were lower than the others, producing slightly negative values (Table S3), each curve fit the data with an R2 between 0.94 and 0.99. Since we detected fluorescence of the 4-methylumbelliferyl for the standard curve, the reduced activity on pine biochar in the final assay was not merely due to quenching of the fluorescent product. However, other factors may also have influenced enzyme activity and require further study, including the solid phase interaction with enzyme cofactors, allosteric regulators [16], and inhibiting compounds such as phenols and polyphenols [27].
As the primary mechanism for reduced activity, direct sorption of enzymes could cause either a conformational change in the enzyme active site or rotation of the active site toward the biochar surface [44]. Further physical properties of the pine biochar, such as pore size distribution, could have caused reduced enzyme activities due to the substrate diffusing into micropores too small for enzymes to access (4.51 nm, Table 1) [25]. By contrast, the grass biochar had larger mean pore size diameter (19.12 nm) that would allow more substrate diffusion and thus enzyme access and activity. The grass biochar also had a higher range of activity, with levels over 100% (Figure 3B). If the active site faced outwards and maintained its morphology, the enzymes could be stabilized and remain active. This immobilization can serve as protection for enzymes against stress on low-surface area biochar [17], and may explain why samples with low sorption rates maintained high activity (Figure 3B). We must also consider the high background interference during the Bradford assay could cause artificially low detectable sorption.
The patterns of enzyme efficiency at different pH levels did not follow our predictions of higher sorption and, thus, low activity at lower pH levels. The pattern of lower BG efficiency at higher pH likely relates to increasing distance from the enzyme optimal pH (Figure 2B, Table 2). With PHOS, the increase of activity rate with higher pH matches the increase in substrate degraded by the free enzyme (Table S3), which may be a simple outcome of heterogeneity between the small amounts of solid phase used in each well for the assay. To delve further into this question, the surface functional groups of distinct biochars require in-depth characterization.
This lab assay explicitly tested if the high surface area pine biochar sorbed enzymes more readily than the other solid phases, finding that this sorption to pine biochar did impact enzyme activity. The observed decrease in activity corroborates patterns observed with biochar priming native soil organic matter: less priming occurs with additions of high temperature wood biochar, and higher C mineralization of native soil organic matter occurs with low temperature grass biochar [45]. With the complexity of these enzyme–solid phase interactions, the exact conditions of the laboratory assay require careful consideration when predicting field responses. This experiment highlights how biochar physical properties interact with specific enzymes to alter activity rates.
5. Conclusions
The decreased activity of pine biochar-immobilized enzymes explains previous in situ findings of reduced BG and PHOS activities in an amended agricultural soil. This lab experiment found that exposure to high pyrolysis temperature pine biochar reduced the activity of BG and PHOS enzymes by over 95% relative to soil. To our knowledge, the activity level of enzymes directly sorbed onto biochar surfaces has never before been tested. The enzyme interaction with the pine biochar differed from the low-temperature grass biochar, in agreement with previous research that biochar type, as well as specific enzyme, affects the amount of sorption and activity rates. Comparing two biochars, our results suggest that surface area and pore size distribution are key indicators of potential biochar–enzyme interactions. This experiment explicitly tested the enzyme activity levels after sorption, rather than enzymes or substrate exposed to biochar; thus, it provides one explanation for the negative priming of native organic matter observed after wood biochar addition.
Supplementary Materials
The following are available online at https://0-www-mdpi-com.brum.beds.ac.uk/2077-0472/8/10/158/s1.
Author Contributions
For research articles with several authors, a short paragraph specifying their individual contributions must be provided. The following statements should be used “Conceptualization, E.J.F. (Erika J. Foster), E.J.F. (Emily J. Fogle), and M.F.C.; Methodology, E.J.F. (Erika J. Foster) and E.J.F. (Emily J. Fogle); Formal Analysis E.J.F. (Erika J. Foster), E.J.F. (Emily J. Fogle), and M.F.C.; Investigation, E.J.F. (Erika J. Foster) and E.J.F. (Emily J. Fogle); Resources, E.J.F. (Erika J. Foster) and M.F.C.; Data Curation, E.J.F. (Erika J. Foster); Writing—Original Draft Preparation, E.J.F. (Erika J. Foster); Writing—Review and Editing, E.J.F. (Erika J. Foster), E.J.F. (Emily J. Fogle), M.F.C.; Visualization, E.J.F. (Erika J. Foster); Supervision, E.J.F. (Emily J. Fogle) and M.F.C.; Funding Acquisition, E.J.F. (Erika J. Foster) and M.F.C.
Funding
This research was funded by the Colorado State University Graduate Degree Program in Ecology Small Grant (No. 1670980), the United States Department of Agriculture Natural Resources Conservation Service Conservation and Innovation Grant Decision Support Tools, Drought Tolerance, and Innovative Soil and Water Management Strategies to Adapt Semi-arid Irrigated Cropping Systems to Drought (No. 69-3A75-14-61), and National Institute of Food and Agriculture Agricultural Research Initiative Pre-Doctoral Fellowship (No. 12110438).
Acknowledgments
The authors acknowledge the helpful comments from Xianping Tan and Charlotte Alster. The laboratory work was performed at the Colorado State University EcoCore Analytical Facility.
Conflicts of Interest
The authors declare no conflict of interest.
References
- Atkinson, C.J.; Fitzgerald, J.D.; Hipps, N.A. Potential mechanisms for achieving agricultural benefits from biochar application to temperate soils: A review. Plant Soil 2010, 337, 1–18. [Google Scholar] [CrossRef]
- Biederman, L.A.; Harpole, W.S. Biochar and its effects on plant productivity and nutrient cycling: A meta-analysis. GCB Bioenergy 2013, 5, 202–214. [Google Scholar] [CrossRef]
- Lehmann, J. Bio-energy in the black. Front. Ecol. Environ. 2007, 5, 381–387. [Google Scholar] [CrossRef] [Green Version]
- Jeffery, S.; Verheijen, F.G.A.; van der Velde, M.; Bastos, A.C. A quantitative review of the effects of biochar application to soils on crop productivity using meta-analysis. Agric. Ecosyst. Environ. 2011, 144, 175–187. [Google Scholar] [CrossRef]
- Enders, A.; Hanley, K.; Whitman, T.; Joseph, S.; Lehmann, J. Characterization of biochars to evaluate recalcitrance and agronomic performance. Bioresour. Technol. 2012, 114, 644–653. [Google Scholar] [CrossRef] [PubMed]
- Lehmann, J.; Joseph, S. Biochar for Environmental Management: An Introduction. Sci. Technol. 2009, 1, 1–12. [Google Scholar]
- Alkorta, I.; Aizpurua, A.; Riga, P.; Albizu, I.; Amézaga, I.; Garbisu, C. Soil Enzyme Activities as Biological Indicators of Soil Health. Rev. Environ. Health 2003, 18, 65–73. [Google Scholar] [CrossRef] [PubMed]
- Bell, C.W.; Fricks, B.E.; Rocca, J.D.; Steinweg, J.M.; McMahon, S.K.; Wallenstein, M.D. High-throughput fluorometric measurement of potential soil extracellular enzyme activities. J. Vis. Exp. 2013, 81, e50961. [Google Scholar] [CrossRef] [PubMed]
- Allison, S.D. Cheaters, diffusion and nutrients constrain decomposition by microbial enzymes in spatially structured environments. Ecol. Lett. 2005, 8, 626–635. [Google Scholar] [CrossRef]
- Burns, R.G.; DeForest, J.L.; Marxsen, J.; Sinsabaugh, R.L.; Stromberger, M.E.; Wallenstein, M.D.; Weintraub, M.N.; Zoppini, A. Soil enzymes in a changing environment: Current knowledge and future directions. Soil Biol. Biochem. 2013, 58, 216–234. [Google Scholar] [CrossRef]
- Caldwell, B.A. Enzyme activities as a component of soil biodiversity: A review. Pedobiologia (Jena) 2005, 49, 637–644. [Google Scholar] [CrossRef]
- Makoi, J.H.J.R.; Ndakidemi, P.A. Selected soil enzymes: Examples of their potential roles in the ecosystem. Afr. J. Biotechnol. 2008, 7, 181–191. [Google Scholar]
- Alster, C.; Koyama, A.; Johnson, N.G.; Wallenstein, M.D.; von Fischer, J.C. Temperature sensitivity of soil microbial communities: An application of macromolecular rate theory to microbial respiration. J. Geophys. Res. Biogeosci. 2016, 121, 1420–1433. [Google Scholar] [CrossRef] [Green Version]
- Sinsabaugh, R.L.; Lauber, C.L.; Weintraub, M.N.; Ahmed, B.; Allison, S.D.; Crenshaw, C.; Contosta, A.R.; Cusack, D.; Frey, S.; Gallo, M.E.; et al. Stoichiometry of soil enzyme activity at global scale. Ecol. Lett. 2008, 11, 1252–1264. [Google Scholar] [CrossRef] [PubMed] [Green Version]
- Paz-Ferreiro, J.; Gascó, G.; Gutiérrez, B.; Méndez, A. Soil biochemical activities and the geometric mean of enzyme activities after application of sewage sludge and sewage sludge biochar to soil. Biol. Fertil. Soil. 2012, 48, 511–517. [Google Scholar] [CrossRef]
- Bailey, V.L.; Fansler, S.J.; Smith, J.L.; Bolton, H. Reconciling apparent variability in effects of biochar amendment on soil enzyme activities by assay optimization. Soil Biol. Biochem. 2011, 43, 296–301. [Google Scholar] [CrossRef]
- Elzobair, K.A.; Stromberger, M.E.; Ippolito, J.A. Stabilizing effect of biochar on soil extracellular enzymes after a denaturing stress. Chemosphere 2016, 142, 114–119. [Google Scholar] [CrossRef] [PubMed] [Green Version]
- Foster, E.J.; Hansen, N.; Wallenstein, M.; Cotrufo, M.F. Biochar and manure amendments impact soil nutrients and microbial enzymatic activities in a semi-arid irrigated maize cropping system. Agric. Ecosyst. Environ. 2016, 233, 404–414. [Google Scholar] [CrossRef]
- Burns, R.G. Enzyme activity in soil: Location and a possible role in microbial ecology. Soil Biol. Biochem. 1982, 14, 423–427. [Google Scholar] [CrossRef]
- Nannipieri, P.; Kandeler, E.; Ruggiero, P. Enzyme activities and microbiological and biochemical processes in soil. In Enzymes in the Environment: Activity, Ecology, and Applications; Marcel Dekker: New York, NY, USA, 2002. [Google Scholar]
- Quiquampoix, H.; Servagent-noinville, S. Enzyme adsorption on soil mineral surfaces and consequences for catalytic activity. In Enzymes in the Environment: Activity, Ecology, and Applications; Burns, R.G., Dick, R.P., Eds.; Marcel Dekker: New York, NY, USA, 2002. [Google Scholar]
- Sandhya, C.; Nampoothiri, K.M.; Pandey, A. Microbial Enzymes and Biotransformations; Humana Press: Totowa, NJ, USA, 2005. [Google Scholar]
- Sarkar, J.M.; Leonowicz, A.; Bollag, J.M. Immobilization of enzymes on clays and soils. Soil Biol. Biochem. 1989, 21, 223–230. [Google Scholar] [CrossRef]
- Datta, R.; Anand, S.; Moulick, A.; Baraniya, D.; Pathan, S.I.; Rejsek, K.; Vranova, V.; Sharma, M.; Sharma, D.; Kelkar, A.; et al. How enzymes are adsorbed on soil solid phase and factors limiting its activity: A review. Int. Agrophys. 2017, 31, 287–302. [Google Scholar] [CrossRef]
- Quiquampoix, H.; Burns, R.G. Interactions between proteins and soil mineral surfaces: Environmental and health consequences. Elements 2007, 3, 401–406. [Google Scholar] [CrossRef]
- Wu, F.; Jia, Z.; Wang, S.; Chang, S.X.; Startsev, A. Contrasting effects of wheat straw and its biochar on greenhouse gas emissions and enzyme activities in a Chernozemic soil. Biol. Fertil. Soil. 2013, 49, 555–565. [Google Scholar] [CrossRef]
- Lammirato, C.; Miltner, A.; Kaestner, M. Effects of wood char and activated carbon on the hydrolysis of cellobiose by β-glucosidase from Aspergillus niger. Soil Biol. Biochem. 2011, 43, 1936–1942. [Google Scholar] [CrossRef]
- Swaine, M.; Obrike, R.; Clark, J.M.; Shaw, L.J. Biochar alteration of the sorption of substrates and products in soil enzyme assays. Appl. Environ. Soil Sci. 2013. [Google Scholar] [CrossRef]
- Keiblinger, K.M.; Liu, D.; Mentler, A.; Zehetner, F.; Zechmeister-Boltenstern, S. Biochar application reduces protein sorption in soil. Org. Geochem. 2015, 87, 21–24. [Google Scholar] [CrossRef]
- Lammirato, C.; Miltner, A.; Wick, L.Y.; Kästner, M. Hydrolysis of cellobiose by -glucosidase in the presence of soil minerals—Interactions at solid-liquid interfaces and effects on enzyme activity levels. Soil Biol. Biochem. 2010, 42, 2203–2210. [Google Scholar] [CrossRef]
- Watanabe, T.; Sato, T.; Yoshioka, S.; Koshijima, T.; Kuwahara, M. Purification and properties of Aspergillus niger beta-glucosidase. Eur. J. Biochem. 1992, 209, 651–659. [Google Scholar] [CrossRef] [PubMed]
- Durmus, A.; Eicken, C.; Sift, B.H.; Kratel, A.; Kappl, R.; Hüttermann, J.; Krebs, B. The active site of purple acid phosphatase from sweet potatoes (Ipomoea batatas): Metal content and spectroscopic characterization. Eur. J. Biochem. 1999, 260, 709–716. [Google Scholar] [CrossRef] [PubMed]
- National Cooperative Soil Survey. Fort Collins Series. Available online: https://soilseries.sc.egov.usda.gov (accessed on 1 October 2018).
- Abulobaida, M. The Effect of Irrigaiton and Cropping Systems on Soil Carbon and Nitrogen Stocks and Organic Matter Aggregation in Semi-Arid Lands. Ph.D. Thesis, Colorado State University, Fort Collins, CO, USA, 2014. [Google Scholar]
- Vogelmann, E.S.; Prevedello, J.; Awe, G.O.; Reinert, D.J. Soil hydrophobicity: Comparative study of usual determination methods. Cienc. Rural 2015, 45, 260–266. [Google Scholar] [CrossRef]
- Asadi, A.; Huat, B.B.K.; Hanafi, M.M.; Mohamed, T.A.; Shariatmadari, N. Role of organic matter on electroosmotic properties and ionic modification of organic soils. Geosci. J. 2009, 13, 175–181. [Google Scholar] [CrossRef] [Green Version]
- Ogle, D.H. FSA: Fisheries Stock Analysis, R Package Version 0.8.20. Available online: https://cran.r-project.org (accessed on 1 October 2018).
- Baron, M.H.; Revault, M.; Servagent-Noinville, S.; Abadie, J.; Quiquampoix, H. Chymotrypsin Adsorption on Montmorillonite: Enzymatic Activity and Kinetic FTIR Structural Analysis. J. Colloid Interface Sci. 1999, 214, 319–332. [Google Scholar] [CrossRef] [PubMed]
- Oleszczuk, P.; Jośko, I.; Futa, B.; Pasieczna-Patkowska, S.; Pałys, E.; Kraska, P. Effect of pesticides on microorganisms, enzymatic activity and plant in biochar-amended soil. Geoderma 2014, 214, 10–18. [Google Scholar] [CrossRef]
- Du, Z.; Wang, Y.; Huang, J.; Lu, N.; Liu, X.; Lou, Y.; Zhang, Q. Consecutive biochar application alters soil enzyme activities in the winter wheat—Growing season. Soil Sci. 2014, 179, 75–83. [Google Scholar] [CrossRef]
- Wang, X.; Song, D.; Liang, G.; Zhang, Q.; Ai, C.; Zhou, W. Maize biochar addition rate influences soil enzyme activity and microbial community composition in a fluvo-aquic soil. Appl. Soil Ecol. 2015, 96, 265–272. [Google Scholar] [CrossRef]
- Shindo, H.; Watanabe, D.; Onaga, T.; Urakawa, M.; Nakahara, O.; Huang, Q. Adsorption, activity, and kinetics of acid phosphatase as influenced by selected oxides and clay minerals. Soil Sci. Plant. Nutr. 2002, 48, 763–767. [Google Scholar] [CrossRef] [Green Version]
- Sopeña, F.; Bending, G.D. Impacts of biochar on bioavailability of the fungicide azoxystrobin: A comparison of the effect on biodegradation rate and toxicity to the fungal community. Chemosphere 2013, 91, 1525–1533. [Google Scholar] [CrossRef] [PubMed]
- Leprince, F.; Quiquampoix, H. Extracellular enzyme activity in soil: Effect of pH and ionic strength on the interaction with montmorillonite of two acid phosphatases secreted by the ectomycorrhizal fungus Hebeloma cylindrosporum. Eur. J. Soil Sci. 1996, 47, 511–522. [Google Scholar] [CrossRef]
- Zimmerman, A.R.; Gao, B.; Ahn, M.Y. Positive and negative carbon mineralization priming effects among a variety of biochar-amended soils. Soil Biol. Biochem. 2011, 43, 1169–1179. [Google Scholar] [CrossRef]
Figure 1.
(A) The enzymes (β-Glucosidase (BG) or Acid Phosphatase (PHOS)) sorbed to the three solid phases (Soil, Pine Biochar (BC Pine), and Grass Biochar (BC Grass) at pH 7). Percent sorption was calculated as the difference between the total enzyme added and the amount in the supernatant divided by the total enzyme added (Equation 1). (B) The percent of enzyme sorbed to soil and pine biochar at three pH levels. All results are means ± 1 standard error (n = 5). Significant differences (p < 0.05) are labeled as lowercase letters from the Tukey adjusted comparisons.

Figure 2.
(A) The calculated activity rates for two enzymes, β-Glucosidase (BG) and Acid Phosphatase (PHOS) sorbed to the three solid phases (Soil, Pine Biochar (BC Pine), and Grass Biochar (BCGrass). (B) The activity of the two enzymes at three pH levels after sorption to soil and Pine Biochar. Results are means ± 1 SE (n = 5). Significant differences (p < 0.05) are labeled as lowercase letters based on Dunn test for multiple comparison.

Figure 3.
Percent sorption and activity plotted for two enzymes (A) β-Glucosidase (BG) and (B) Acid Phosphatase (PHOS), at three pH levels pH (6 = light gray, 7 = dark gray, 8 = black) with three solid phases Soil (diamonds), Pine Biochar (BC Pine, squares), and Grass Biochar (BCGrass, triangles). The percent activity was calculated as nmols mg enzyme−1 24 h−1 divided by the 40 nmols of substrate added. The diagonal 1:1 line represents when the sorbed enzymes degraded the expected amount of substrate. The solid gray lines represent zero sorption or activity level.


Table 1.
Characteristics of the two commercial enzymes.
| Enzyme | Abbrev. | Source | Expected Activity (U/mg) c | Optimal pH | Isoelectric Point pH | Atomic Weight (kDa) |
|---|---|---|---|---|---|---|
| β-Glucosidase | BG | Aspergillus niger | ≥0.75 | 4.0 | 4 a | 240 a |
| Acid Phosphatase | PHOS | Sweet potato | 0.5–3.0 | 4.8 | 5.2 b | 110–112 b |
a Watanabe et al. (1992) examined an isoform of BG from Aspergillus niger [31]. b Durmus et al. (1999) examined an isoform of acid PHOS from sweet potato [32]. The commercial enzymes used in this experiment may have contained multiple isoforms of the enzyme. c Each unit (U) of enzyme degrades 1.0 µmol of p-nitrophenyl substrate (either phosphate or β-d glucopyranoside), per minute, at the optimal pH and 37 °C.
Table 2.
Physical properties of three solid phases, with the pH and hydrophobicity measured in triplicate, and BET surface area and isoelectric point measured on a single sample.
Table 2.
Physical properties of three solid phases, with the pH and hydrophobicity measured in triplicate, and BET surface area and isoelectric point measured on a single sample.
| Solid Phase | Description | pHH20 | BET Surface Area (m2 g−1) | BET Average Pore Width (nm) | Isoelectric Point (pH) | Hydrophobicity (seconds) |
|---|---|---|---|---|---|---|
| Soil | Irrigated sandy clay loam | 8.7 | 27.5 | 6.16 | <1 | Low (7.7) |
| Pinewood Biochar | Max pyrolysis temperature: 400–700 °C a | 9.2 | 232.7 | 4.51 | 1–2 | Medium (22) |
| Grass Biochar | Max pyrolysis temperature: 300 °C | 9.9 | 6.3 | 19.12 | 1 | High (>300) |
a This range is reported due to variability in the commercial bioenergy and biochar co-production.
© 2018 by the authors. Licensee MDPI, Basel, Switzerland. This article is an open access article distributed under the terms and conditions of the Creative Commons Attribution (CC BY) license (http://creativecommons.org/licenses/by/4.0/).
Share and Cite
MDPI and ACS Style
Foster, E.J.; Fogle, E.J.; Cotrufo, M.F. Sorption to Biochar Impacts β-Glucosidase and Phosphatase Enzyme Activities. Agriculture 2018, 8, 158. https://0-doi-org.brum.beds.ac.uk/10.3390/agriculture8100158
AMA Style
Foster EJ, Fogle EJ, Cotrufo MF. Sorption to Biochar Impacts β-Glucosidase and Phosphatase Enzyme Activities. Agriculture. 2018; 8(10):158. https://0-doi-org.brum.beds.ac.uk/10.3390/agriculture8100158
Chicago/Turabian StyleFoster, Erika J., Emily J. Fogle, and M. Francesca Cotrufo. 2018. "Sorption to Biochar Impacts β-Glucosidase and Phosphatase Enzyme Activities" Agriculture 8, no. 10: 158. https://0-doi-org.brum.beds.ac.uk/10.3390/agriculture8100158
Note that from the first issue of 2016, this journal uses article numbers instead of page numbers. See further details here.