Influence of Land Use and Land Cover on Hydraulic and Physical Soil Properties at the Cerrado Agricultural Frontier


Department of Agricultural Engineering, Federal University of Viçosa (UFV), Viçosa, MG 36570-900, Brazil
*
Author to whom correspondence should be addressed.
Agriculture 2019, 9(1), 24; https://0-doi-org.brum.beds.ac.uk/10.3390/agriculture9010024
Submission received: 31 December 2018
/
Revised: 11 January 2019
/
Accepted: 15 January 2019
/
Published: 21 January 2019
Abstract
:Western Bahia is one of the most active agricultural frontiers in the world, which raises concern about its natural resources conservation, especially regarding water availability. This study evaluated the influence of five different land uses and land covers on physical and hydraulic soil properties, and developed pedotransfer functions to derive regional hydraulic properties. Significant changes between physical and hydraulic soil properties under agricultural areas and under natural vegetation cover were found, reinforcing that agricultural activity may influence the soil water balance. Cerrado and Forest formation areas have higher infiltration rates () compared to managed areas, with average values of 16.29 cm h−1, and 14.47 cm h−1, while irrigated croplands, rainfed croplands and pasture areas have much smaller infiltration rates, with equal to 3.01 cm h−1, 6.22 cm h−1 and 5.01 cm h−1, respectively. Our results suggest that the agriculture practices do not directly affect the vertical nature of hydrological flowpath, except in the case of intensive irrigated agriculture areas, where reduction can lead to erosive processes favoring organic matter losses, and decreases in productivity and soil quality. Impacts of land use change on hydraulic and physical soil properties are a reality in the Cerrado agriculture frontier and there is an urgent need to monitor how these changes occur over time to develop effective mitigation strategies of soil and water conservation.
1. Introduction
In the last decade, the rapid expansion of agribusiness in the Cerrado led to a new Brazilian agricultural frontier known as MATOPIBA (acronym for the states Maranhão, Tocantins, Piauí and Bahia), which have raised concerns about the natural resources conservation [1,2], especially regarding to the water availability [3,4,5].
In MATOPIBA, Western Bahia stands out by the agricultural expansion, representing 49% of the total agricultural area [6] with 1.8 million hectares in 2015, which is equivalent to an increase of 352% since 1985 [7,8]. The irrigated croplands alone had an increase of 526% between 1985 and 2002, with a simultaneous decrease of Cerrado, seasonal forest and transition vegetation areas by 881,483 ha, 66,417 ha and 269,592 ha, respectively [9]. In fact, the region also stands out for its high productivity records, reaching to 7.4 million tons of soybean, cotton and maize crops in the 2016/2017 harvest [10], confirming the potential of the agribusiness and the systematic dependence of the water availability and natural resources. Although Western Bahia is located above the Urucuia Aquifer and is drained by the Grande, Corrente and Carinhanha basins, there is a major concern about the regional water availability and the impacts of the agricultural activities on Cerrado biome [1,2,5].
The effects of land use change on soil physical proprieties are broadly known, especially when considered conversion of tropical forest to pasture or croplands [11,12,13]. Changes in soil bulk density, penetration resistance, porosity, near-surface hydraulic conductivity [14,15,16], infiltrability and saturated hydraulic conductivity [13,17] are described as possible consequences of the land use change.
In Cerrado, these effects have been studied in the last decade [18,19,20], and received a greater focus due to the advancement of the agricultural frontier from Southern Amazonia to MATOPIBA [5,20]. Soil compaction [21,22], erosion [23], and decreased permeability and water infiltration rates [22,24] are some effects of land use change that affects the physical and hydraulic soil properties causing damage on soil aeration, and soil water dynamics in Cerrado. However, most of these studies are based on few data and do not allow spatial generalizations. Remote sensing and modeling techniques have been used to broadly study the influence of land use on the water balance [5,25,26,27], in the dynamic of vegetation [1,7] and climate [28,29,30,31], and show that the replacement of native vegetation by croplands alters in Cerrado the amount of water recycled to the atmosphere at a large-scale [5], affecting the regional climate dynamics [28,29,30,31]. The results of these simulations, however, are very sensitive to the soil physical and hydraulic parameterizations in the model.
Thus, the knowledge of the hydraulic and physical soil properties contribute to development of powerful tools as hydrological and dynamic vegetation models, and remote sensing techniques to estimate the water recharge, the soil water availability, the cropland productivity, or the influence of extreme precipitation scenarios in the Cerrado agricultural frontier. Moreover, the hydraulic and physical soil properties are fundamental to make inferences about the soil quality and sustainability, allowing the development of alternatives that can prioritize the water and soil conservancy and preserve the remaining native vegetation while ensuring the increase of agricultural production.
The main goal of this study was to evaluate how land use and land cover affect the hydraulic and physical soil properties at the Cerrado agricultural frontier. In addition, we developed pedotransfer functions to derive hydraulic properties for use in dynamic vegetation models.
2. Methods
2.1. Study Area
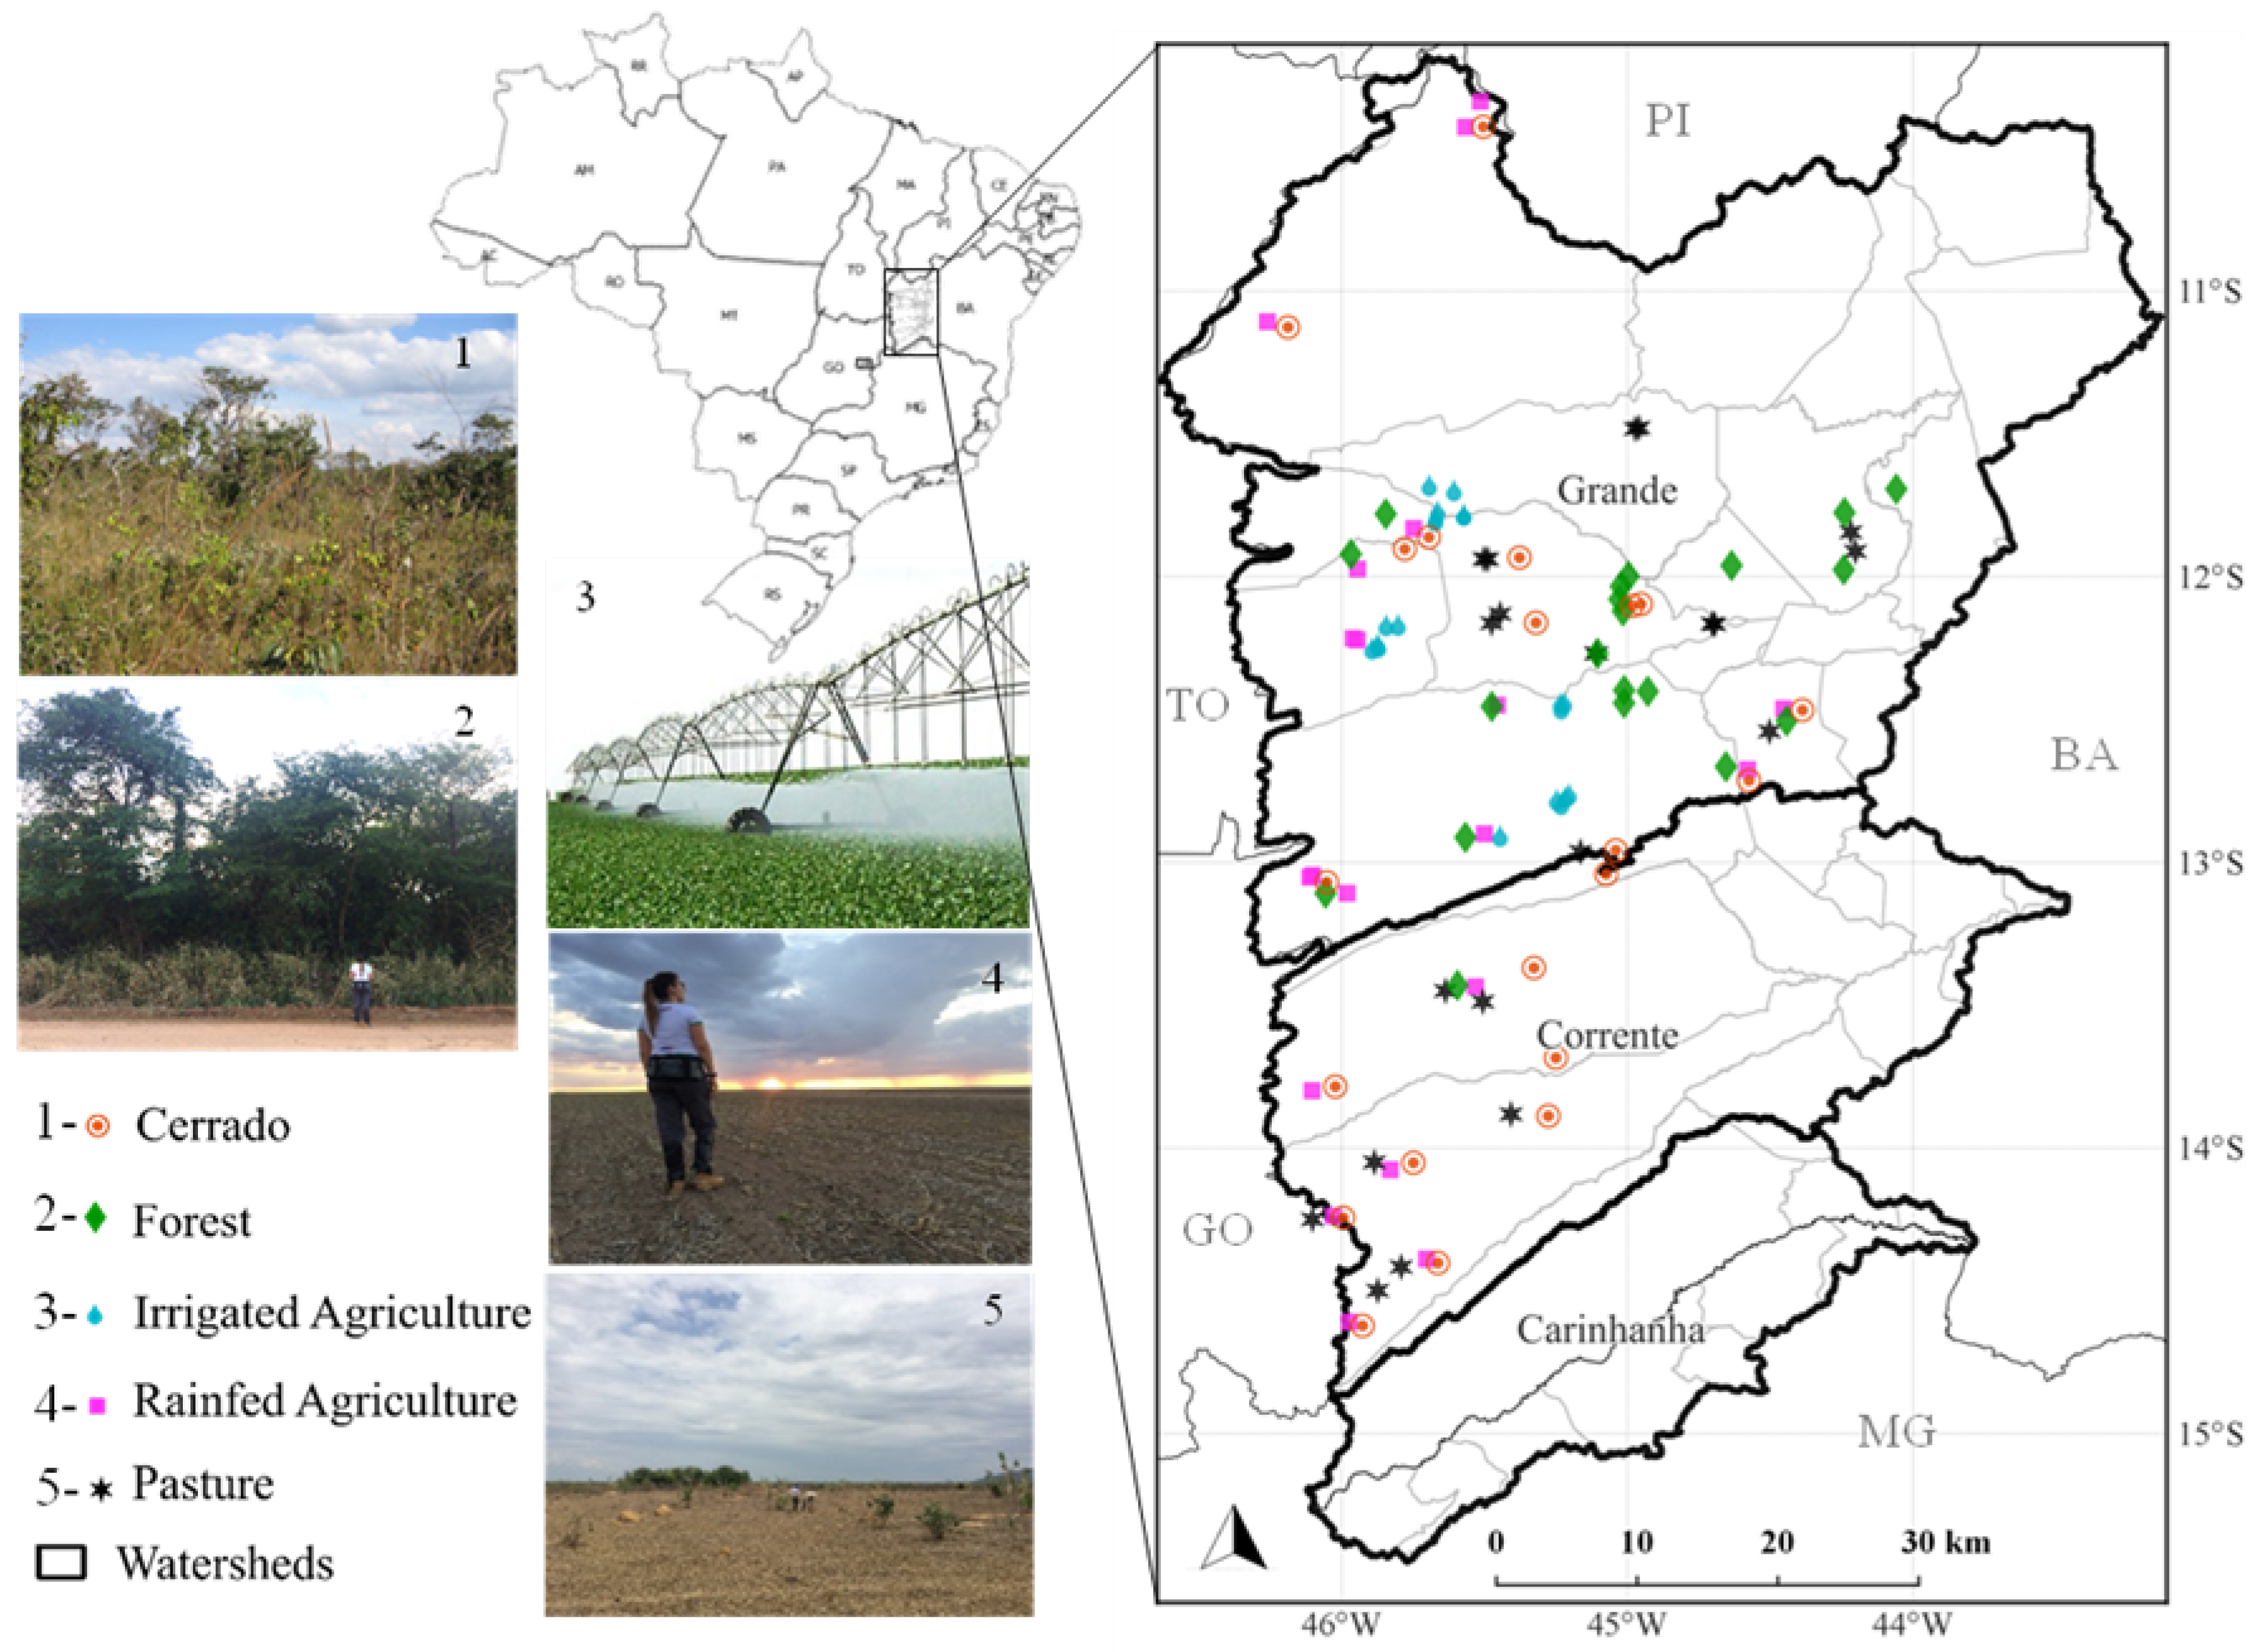
The study area of this work is the Western Bahia located on the geological formation of the Urucuia Group (Upper Cretaceous), which is one of the main areas of agricultural expansion in the Cerrado biome. This region is drained by three important rivers, Grande, Correntes and Carinhanha, with an area of 131,168.59 km2 (Figure 1). Marked by the arrival of migrant rural producers from the southern region in 1990, Western Bahia is today one of the largest producers of soybean in MATOPIBA and the largest producer of cotton in Brazil.
In this region, the physiognomy vegetation is predominantly Cerrado stricto sensu, with predominance of the tree–shrub stratum [32]. The soils are acidic with low fertility, but located at flat or mildly hilly areas. Thus, the use of high level technology and the chemical inputs allows the correction of fertility providing favorable conditions to expansion and intensification of agriculture. The soil granulometry is predominantly sandy and has medium texture, classified as Latossolos (57%), Neossolos (29.6%) and Cambissolos (7%), according to the Brazilian soil classification system [33].
The regional climate is tropical humid according to Köppen [32], and presents two well-defined seasons, dry (October to April) and rainy (May to September). The average annual temperature is 24 C and the average annual rainfall is 1400 mm in the extreme west, gradually decreasing to 800 mm in the east.
2.2. Soil Sampling Design
Soil samples were collected in Western Bahia in two field campaigns in 2017 for five land use and land cover classes (LULCC): (1) Cerrado formations (CDO); (2) forest formations (FOR); (3) rainfed agriculture (RAG); (4) irrigated agriculture (IRR); and (5) pasture (PAST) (Figure 1).
Each class was sampled at 20 sampling points following the criteria: opening year of the agriculture or pasture area between 1990 and 2017, and logistical access to farms, including road conditions and permission to enter the farm by the farmer. In some cases, CDO and the FOR areas were sampled along the road between farms in natural vegetation areas rather than inside the farms. In total, 700 samples were collected considering 5 LULCCs × 20 sample points × 7 depth levels. At each sampling point, undisturbed samples were collected for 0–5, 5–10, 10–15, 15–20, 30, 50 and 70 cm of depth using an Uhland soil sampler, with metal cylinders of 100 cm3 volume. The 100 samples of 0–5 cm of depth were used to calculate the saturated hydraulic conductivity (), soil water content at 10 kPa and 1500 kPa (, ), texture (coarse sand fraction (), fine sand (), and silt (), total porosity (), microporosity (), macroporosity (), and soil particle density (), while all layers (0–5, 5–10, 10–15, 15–20, 30, 50 and 70 cm) were used to calculate the soil bulk density ().
2.3. Measuring Methods
The of soils was determined via the constant head permeameter method [34]. The constant water flow that flowed through the soil sample was measured and applied into the equation for direct calculation of . For textural analysis and particle density, samples were dried in the open air, and sieved in a 100-mesh sieve. Soil fractions (, , and ) were separated according to Ruiz [35], using the sieve method for the sand fraction (0.05–2 mm) and the pipette method to determine the silt (0.002–0.05 mm) and clay (<0.002 mm) fraction.The soil water retention curve (SWRC) was measured using a sand tension table at the matric potentials of 1 and −6 kPa, and a Richards chamber with porous plates, at matric potentials of 10, 50, 100, 500 and −1500 kPa [36]. The centrifuge method was used to measure the soil water content at matric potential of 30 kPa. The SWRC was measured for 0–5 cm layer for all LULCC, and also for 5–20 cm layer in IRR areas. and analyses were carried out using methods described by CLAESSEN et al. [37]. The was determined by water content in a volumetric ring under 0.6 m of water column tension, and the soil was estimated by the difference between total soil porosity and soil microporosity.
2.4. Pedotransfer Model
2.4.1. Adjustment of Soil Water retention Curve
The Campbell and Norman [38] soil model was fitted to soil water content data using Equation (1).
where is the soil water matric potential in kPa, is the air entry matric potential in kPa, is the volumetric water content cm3 cm−3, is the saturated volumetric water content cm3 cm−3, and b is the empirical Campbell parameter, related to the particle size distribution. It is strongly dependent on soil texture [39] and is considered an index for soil pore-size distribution [40]. This model was chosen due to its minimal set of parameters necessary to describe the soil hydraulic properties, favoring its implementation in regional and global scales, and it has been widely used in modeling studies [41,42].
A linear regression with log-transformed data was used in the equation , to determine the and the empirical value of b Campbell parameter, where a is the intercept of the soil water retention in the log-log system and b represents the slope.
The linear least squares method was used to adjust the and b Campbell constant for each sample. Then, the raw data were also used to develop the pedotransfer functions.
2.4.2. Development of Pedotransfer Functions
The pedotransfer functions (PTFs) were developed using the soil physic proprieties and the SWRC for 100 undisturbed samples collected in the 0–5 cm soil layer. Initially, we tested the normal distribution for , , , , , , and properties using Shapiro–Wilk statistic test considering = 0.05. The properties that are normally distributed were used to develop the PTF through multiple regression, while the predictors not normally-distributed, such as , , , and , were excluded from analysis.
To develop and validate the pedotransfer function, the observed data for water retention curve data and physical properties were separated into two groups, where the first one contained 75% of the data (calibration group) and the second 25% of the data (validation group). The samples of calibration and validation groups were randomly chosen. Between these two groups the average of soil physical properties were not significantly different at = 0.05 according to the Student t test, except for in the forest formations areas FOR. However, for hydraulic proprieties ( and b), a significant difference was found between b Campbell parameter used in Calibration and Validation Group for CDO and FOR classes.
A multiple linear regression model was adjusted for each hydraulic Campbell parameters (, b, , , and ) using the soil physical properties measurements as predictors (Equation (2)):
where y is one of the five hydraulic parameters (, b, , , and ), is the soil bulk density in g cm−3, is the total soil porosity in cm3 cm−3, and represents the coarse sand fraction in percent. The stepwise method with 5% of significance was chosen to select the most important variables for determination of y through the backward and forward mechanism. This stepwise method uses the Akaike criterion to eliminate collinear variables, excluding non-informative variables of the final model [43].
2.5. Data Analysis
We tested the homoscedastic and normality of residuals applying the Shapiro–Wilk test [44] for all soil physical properties, and used the Tukey Cramer method to compare the soil physical properties among LULCC classes. The soil physical properties that were normally distributed (i.e., , , and , with p-values greater than 0.05 in the Shapiro–Wilk test) were applied to the analysis of variance and were used for the development of pedotransfer function.The t-test was used to compare the average of the 75% of soil properties used for the development and 25% used for the validation of pedotransfer function (0–5 cm layer), and for the comparisons of the differences for each soil layers among LULCC. All data analyses were carried out using R software [43].
3. Results
3.1. Soil Physical and Hydraulic Properties
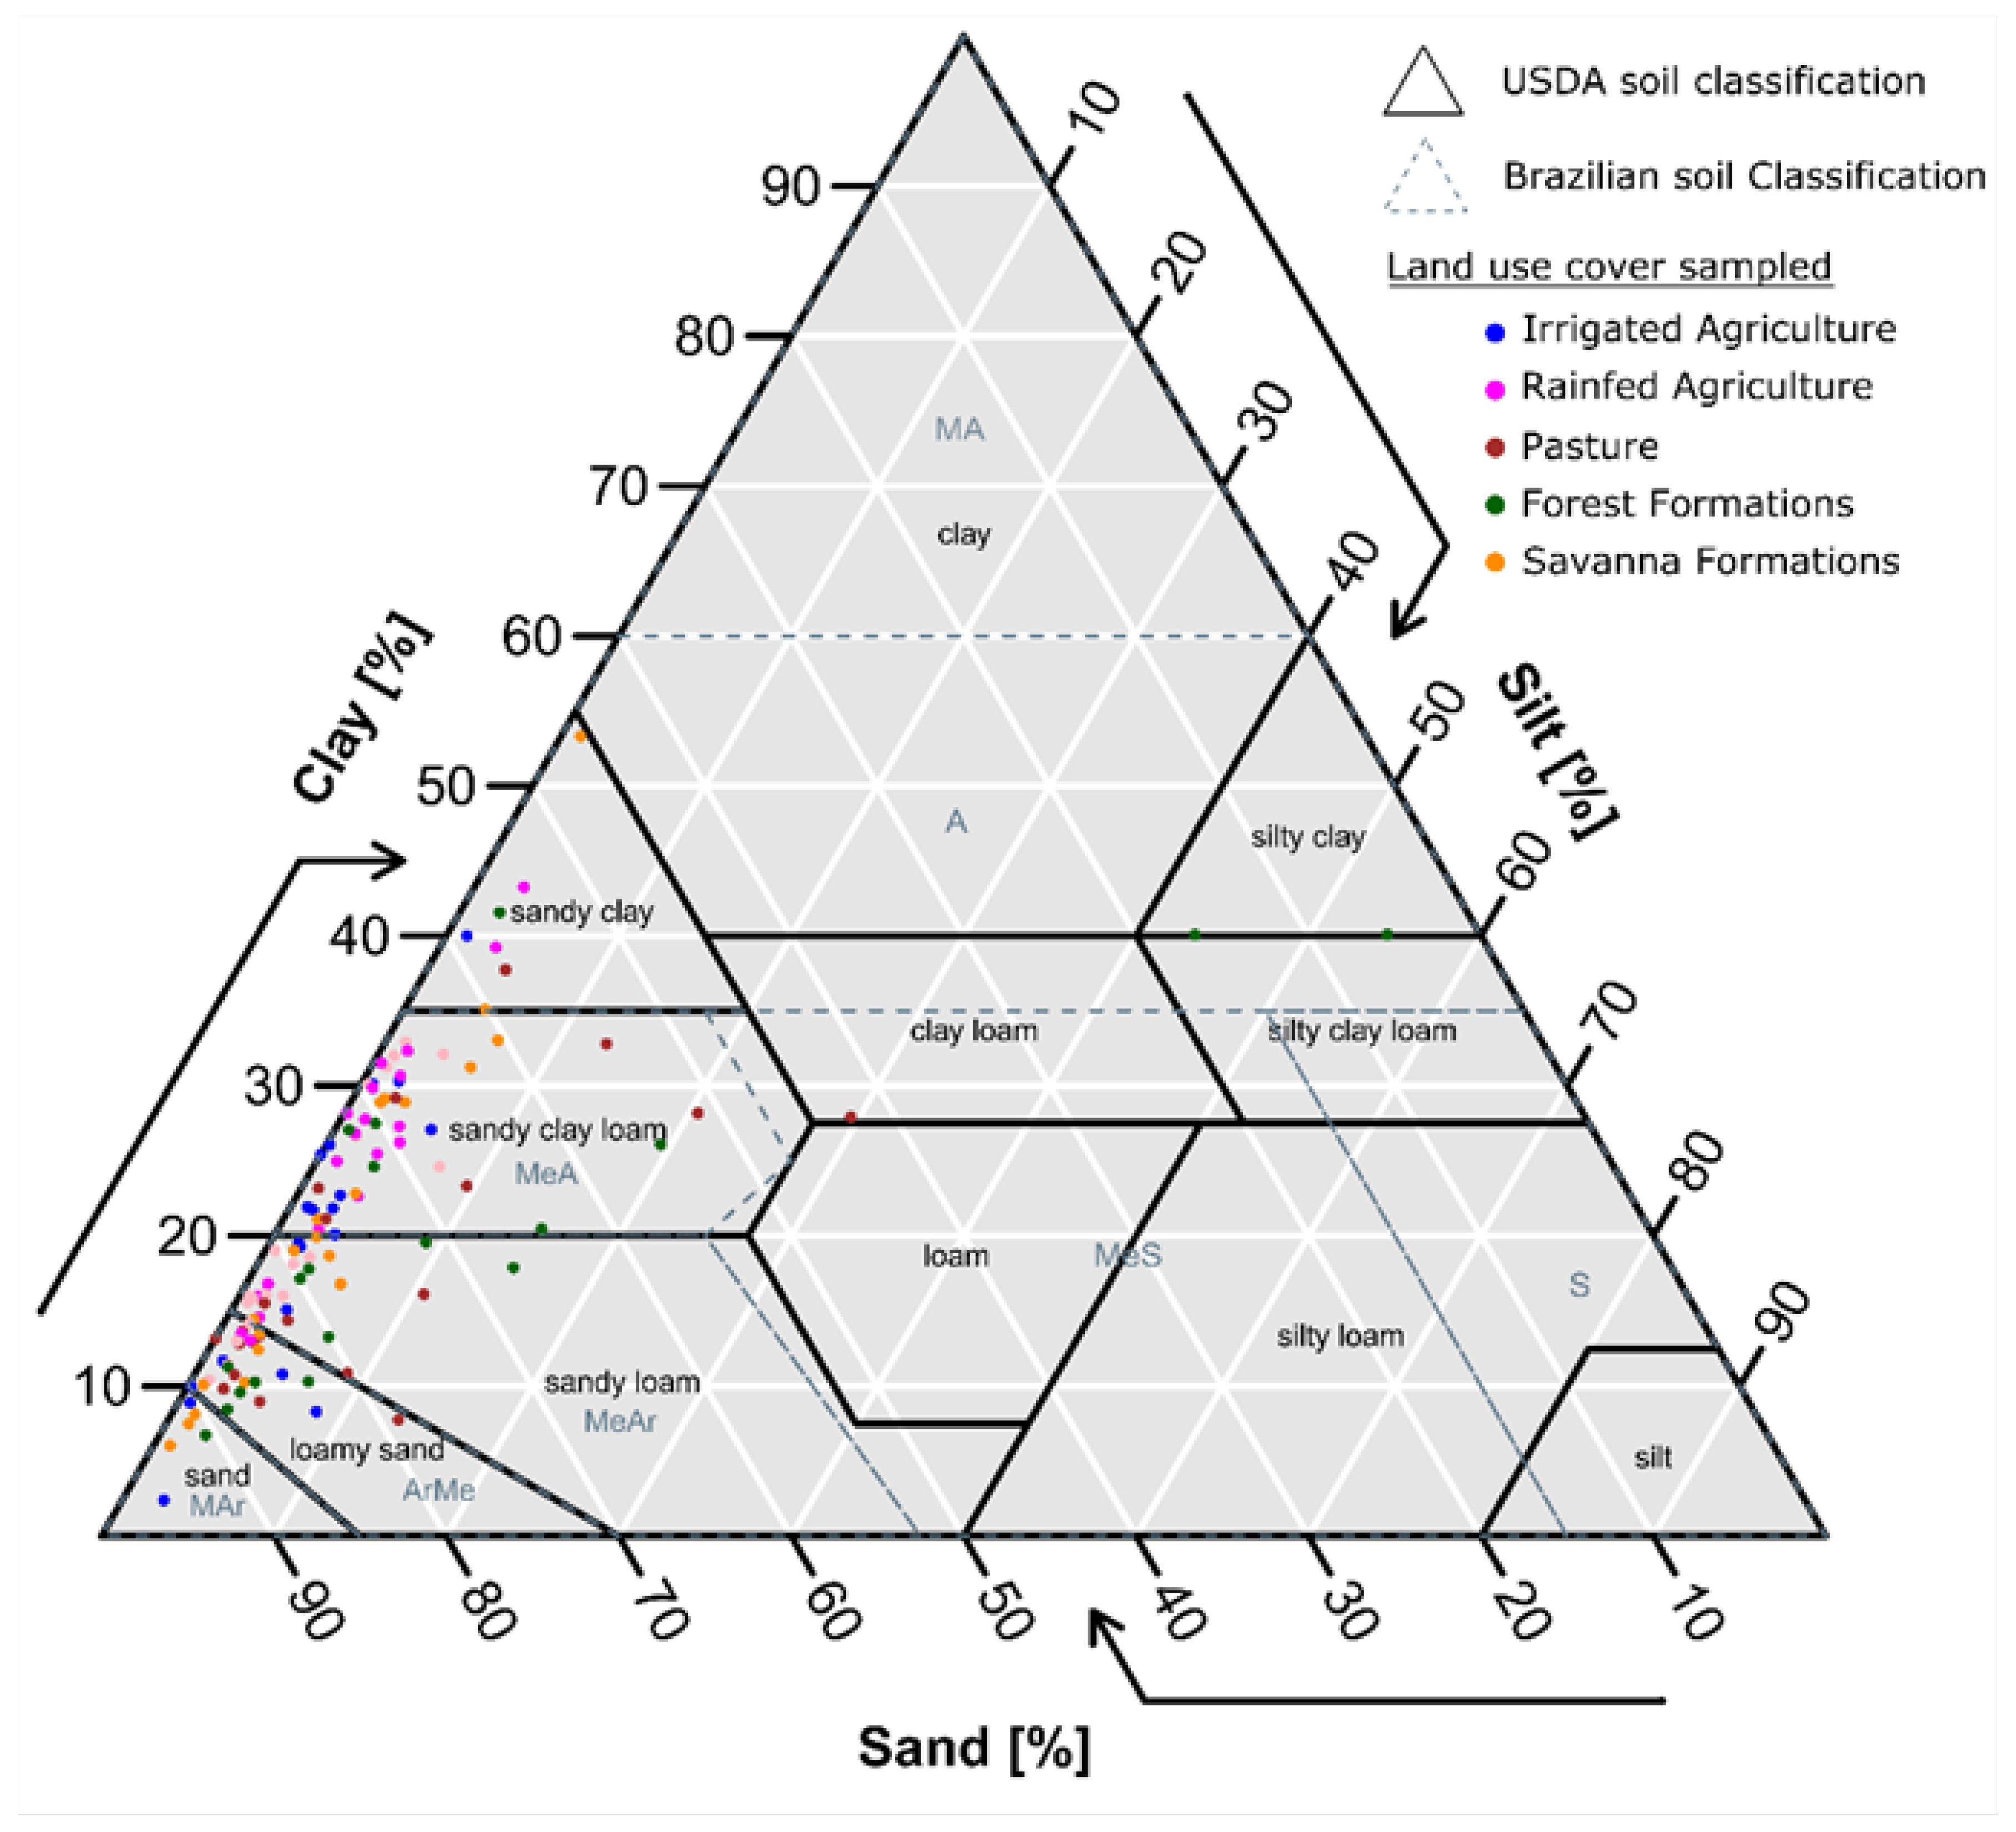
Most of the soil samples were sandy clay loams (40%), followed by 23.3% of sandy loams and 23.3% of loamy sands. The 13.4% of remaining samples were distributed among sandy clay, sand and silt clay classes (Figure 2). In the Brazilian soil classification system (SiBCS), these samples presented a similar distribution along the soil classes, with predominance of 40% of the samples in MeA (Médio argilosa), and 56% divided equally between MeAr (Médio Arenosa) and ArMe (Arenosa Média) classes, highlighting the predominance of sandy soils in the region (Figure 2). The average sand content ranged between 69.47% and 85.79% within the predominant soil classes, while the average clay content ranged between 11.29% and 26.87%.
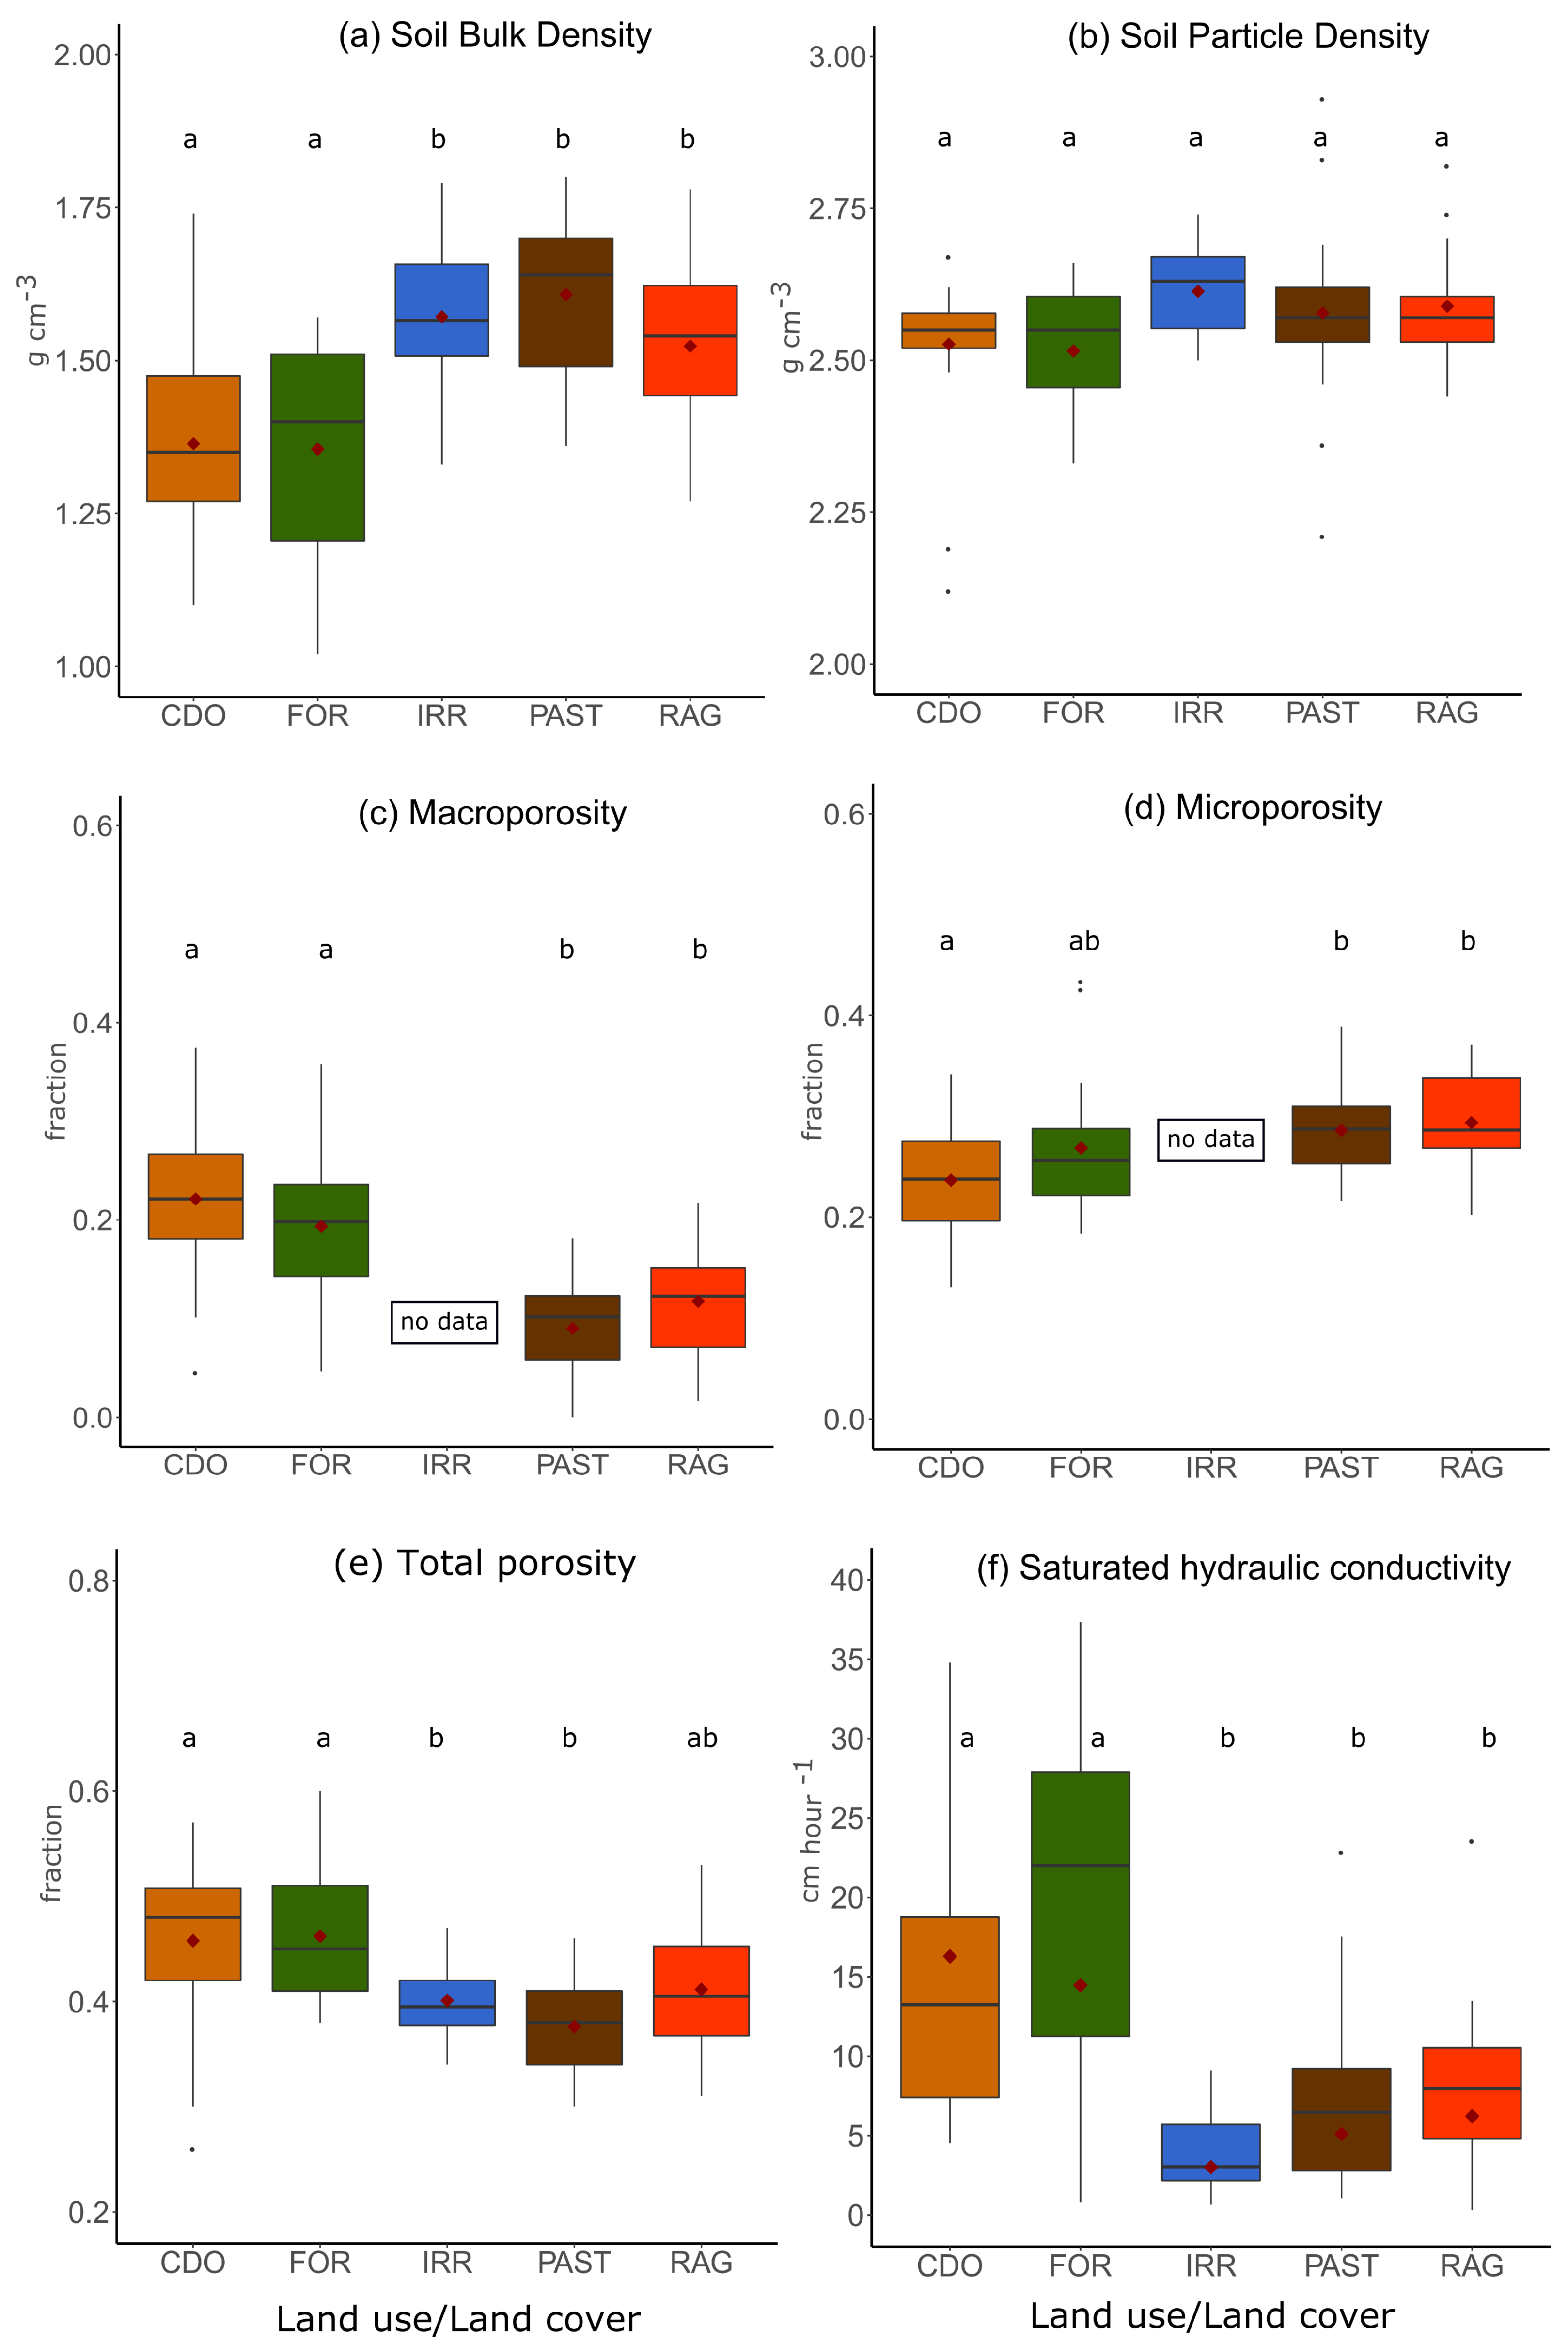
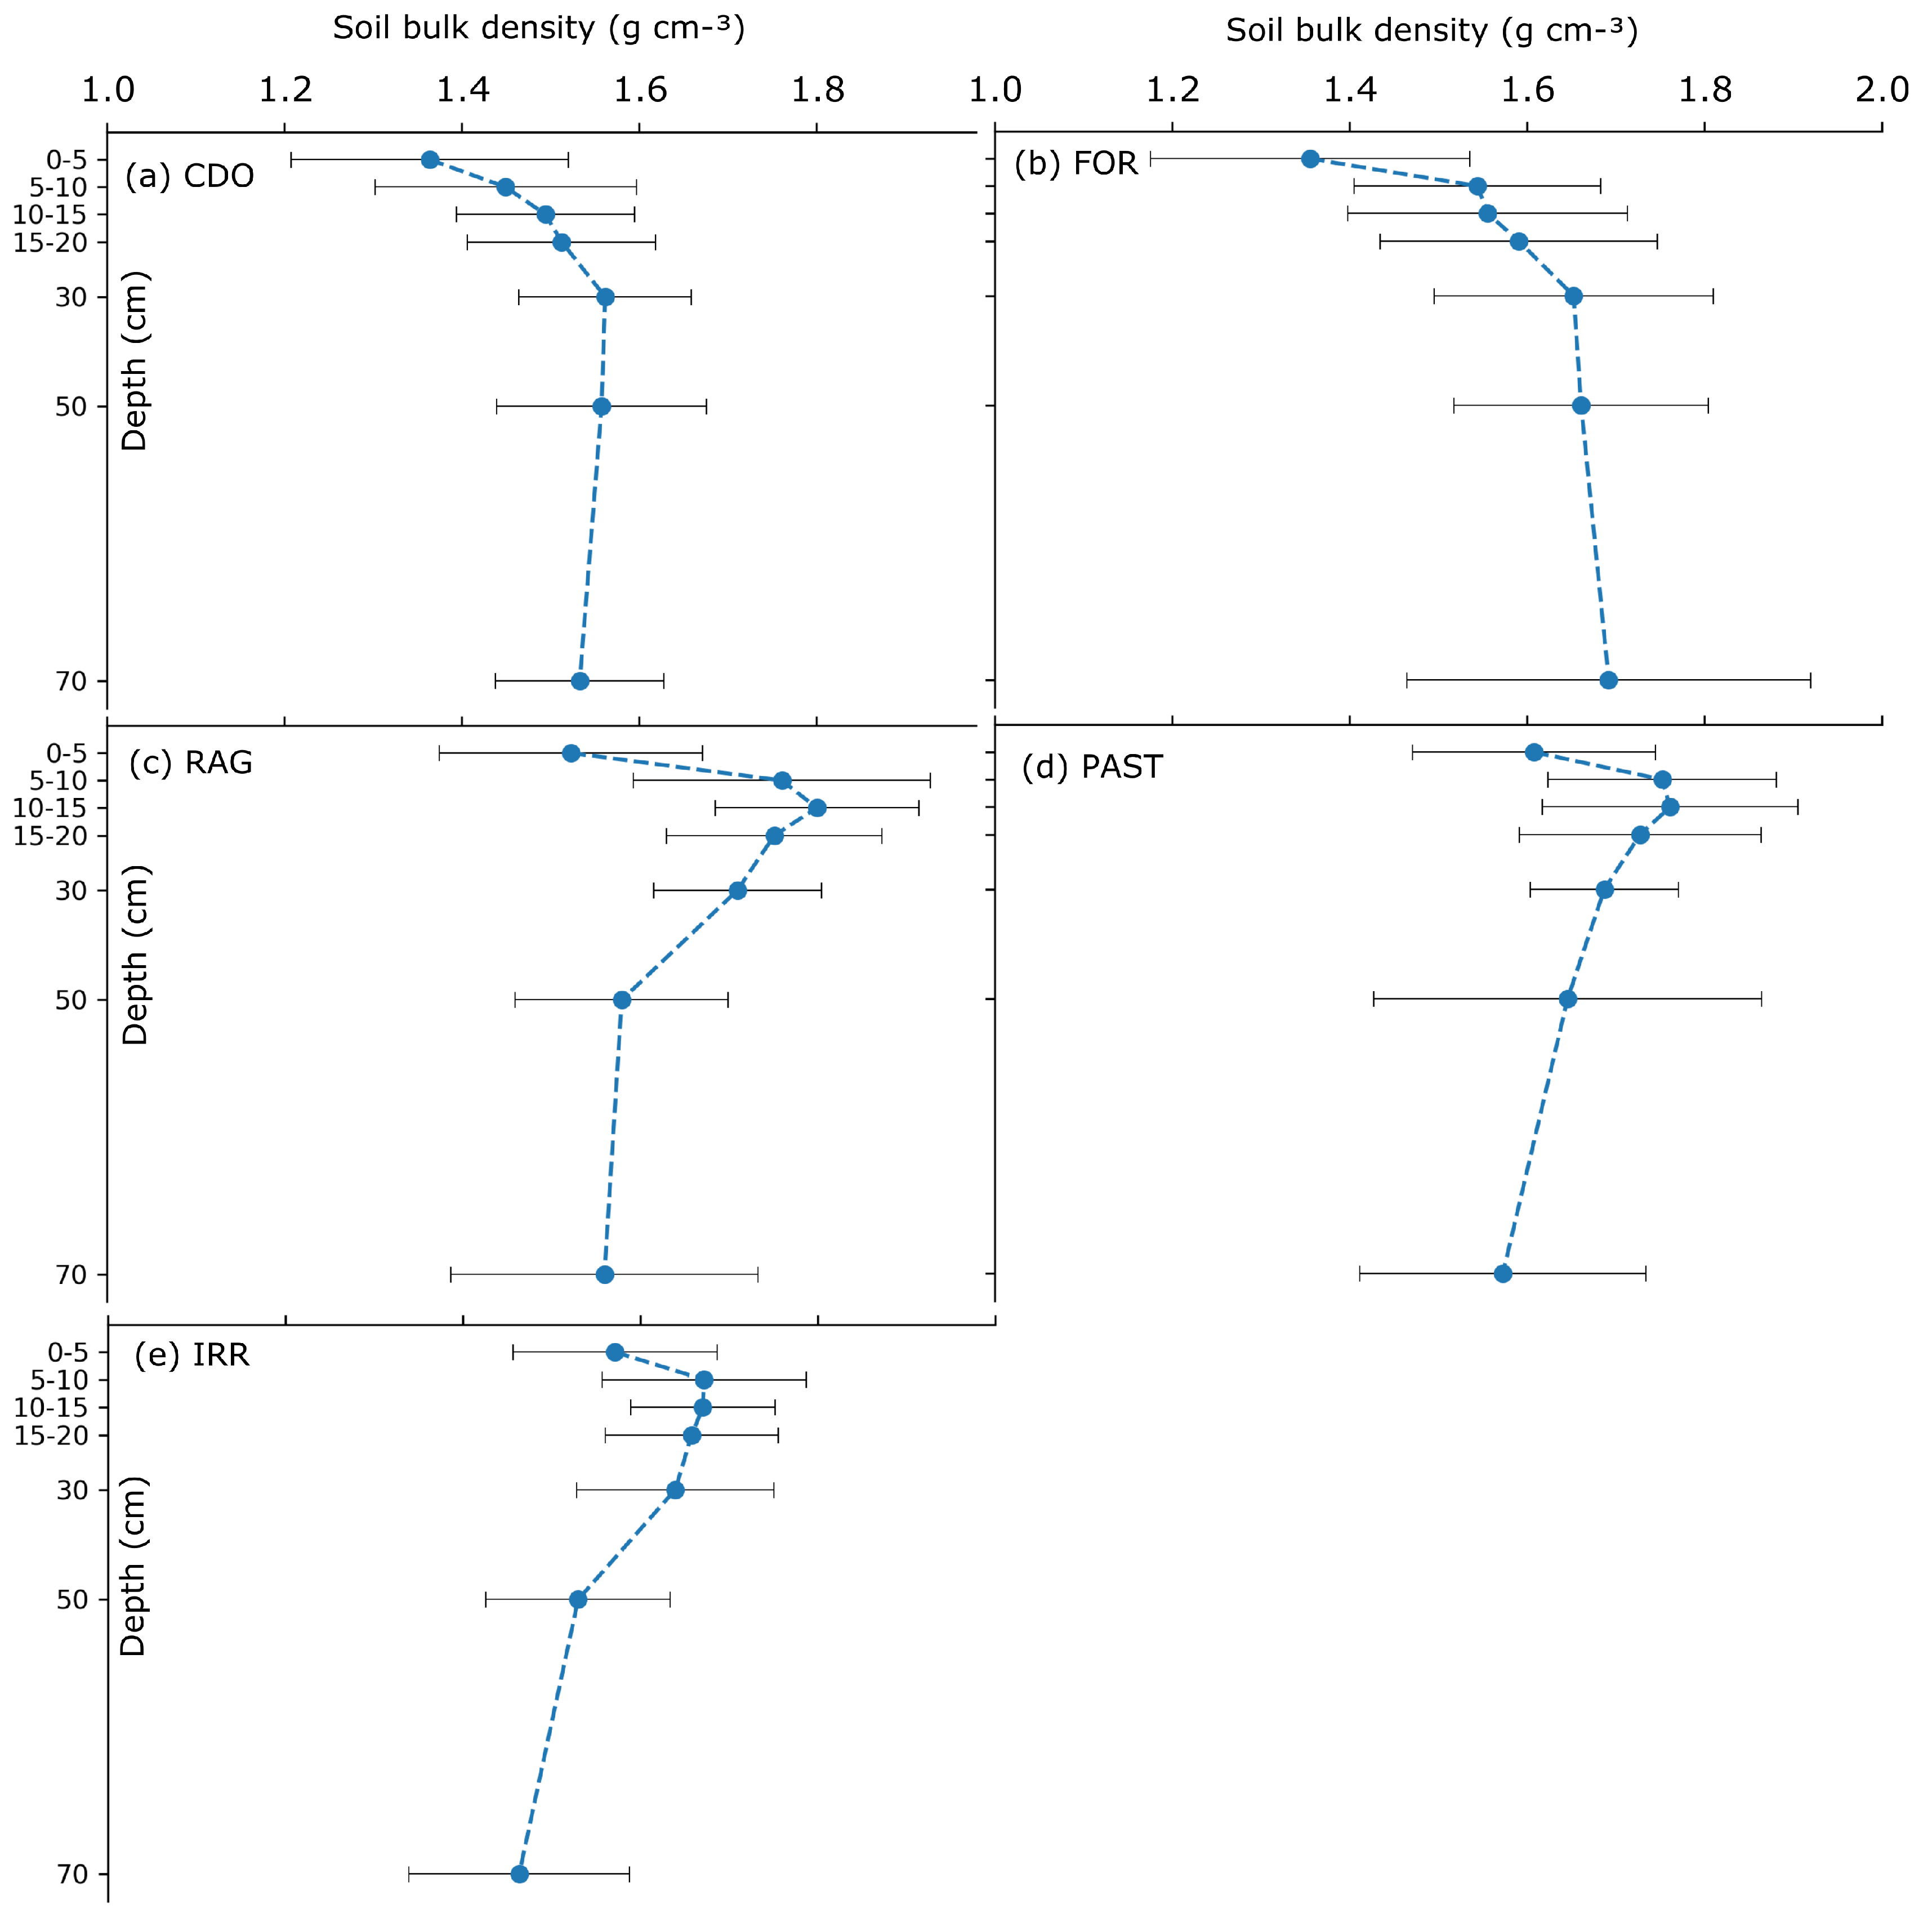
The results of average soil bulk density () suggest a compacted soil surface for agriculture land use, ranging between 1.52 and 1.61 g cm−3 (Figure 3a and Table 1). Under natural land cover, FOR and CDO, the was lower and statistically different from agricultural areas with average ≤ 1.36 g cm−3 (Figure 3a and Table 1). Along the soil profile, the soil showed an increase trend from 0–5 cm to 30 cm for all LULCCs (Figure 4). This increase of in the subsurface layers is higher in areas under managed soil, than in FOR and CDO soils with values above 1.65 g cm−3 (Figure 4).
The particles density () ranged between 2.5 g cm−3 and 2.65 g cm−3 for all LULCCs, showing no statistical differences according to the Tukey Cramer test. The soil total porosity () ranged between 26% and 60%, with average of 43% for all samples collected (Table 1 and Figure 3b). The compaction pattern found in was also observed in , with reduction of the in agriculture land use compared to CDO and FOR areas. In natural ecosystems, ranged between 26% and 57% for CDO and between 38% and 60% for FOR, while in agriculture systems the total soil porosity ranged between 30% and 53% (Figure 3e). Average CDO and FOR was greater than 45%, while under agriculture land use were smaller than 41% (Table 1).
The soil compaction decreased in PAST and RAG areas, reducing the soil capacity to drain excess water after a heavy precipitation—lower values. The reduction of contributed to an increase of , which may alter the soil aeration and roots growing conditions. The in managed areas ranged between 9% and 12%, while were above 25%. Although the values of and of the IRR class were not measured, significant differences were found for total soil porosity in relation to CDO and FOR (Figure 3e).
Soils under natural vegetation cover had a higher infiltration rates () compared to managed areas, with mean values of 16.29 cm h−1 for CDO, and 14.47 cm h−1 for FOR, while among the agriculture land uses, average infiltration rates were much smaller, ranging from 3.01 cm h−1 in irrigated croplands to 6.22 cm h−1 in RAG (Table 1 and Figure 3f).
All LULCCs showed low volumetric water content at the field capacity (−10 kPa), varying from 0.17 cm3 cm−3 to 0.27 cm3 cm−3. Although LULCCs present different values of field capacity () and wilt point (), the average difference between and for each LULCC is typically around 0.06 cm3 cm−3, highlighting the low water retention capacity for these soils (Table 1).
Table 1 shows all hydraulic and physical properties for the Campbell and Norman model. Soils under natural vegetation presented lower air entry potential than soils under agriculture or pasture, with average values equal to 0.71 kPa for CDO and 0.87 kPa for FOR. The highest values of air entry matric potential were found in soils under pasture ( = 1.80 kPa) and irrigated agriculture ( = 1.46 kPa), which are associated to higher compaction (Table 1 and Figure 3). The Campbell b parameter average values ranged between −4.06 and −5.30, which are similar to literature values for sandy, loamy sand and sandy loam soils.
3.2. Pedotransfer Functions
All PTFs used to estimate , b, , , and for soils under PAST and RAG were significant at = 0.05. The PTFs for IRR, CDO, and FOR showed significance only for a few parameters (Table 2). was significant in all LULCC, while b was significant only in CDO, PAST and RAG. The PTFs for were not significant for any LULCCs, except PAST and RAG. PTFs were significant only for CDO, PAST and RAG, while , PTFs were significant for FOR, PAST and RAG (Table 2).
The PTF performance to estimate of the was generally good, showing the maximum adjustment in FOR areas with r = 0.98, followed by PAST (r = 0.93), RAG (r = 0.84) and IRR (r = 0.84) (Table 2). The lowest correlation was found for CDO areas with r = 0.55. For this LUC, the average used for calibration and validation were significantly different, which may have contributed to the lower performance in estimate.
For the Campbell b parameter, the performance of the PTF estimative showed poor correlation for CDO, IRR, and PAST, with correlations 0.36, −0.69 and 0.24, respectively. However, for RAG and FOR areas, the PTFs showed r > 0.70 agreement between the estimated and observed Campbell b parameter (Table 2).
The soil water content represented by , and also had a poor correlation for IRR and RAG agriculture LUs with r < 0.20. In CDO, FOR and PAST, the estimated parameters had a correlation >0.45. The worst correlations were for for all LULCCs with negative r values.
4. Discussion
The sand fraction is predominant in the granulometric composition of the soils, the clay content varies between 10% and 41% and the silt fraction presents the lower values, typically below 4% (Figure 2). This granulometric composition is the result of the high rate of weathering during the genesis of these soils and the soil source material—in this case, the sandstones of the Urucuia Formation [45,46,47,48].
The general trends showed higher values of and lower values of in agriculture areas compared to native vegetation, revealing that soils under agricultural land use are slightly compacted in Western Bahia. This is in line with Fontana et al. [48], who found in agriculture areas in the region of Luis Eduardo Magalhães equal or above 1.52 g cm−3. Cunha et al. [46] also found increased in different crop areas with different periods of cultivation, demonstrating that duration of land use also has an influence on soil structure. Naturally, the Cerrado Western Bahia soils present a cohesive sub-surface horizon [46,48,49,50], making it more susceptible to compaction by grazing, mechanization and management applied at the soil surface. This transitional or subsurface horizon was observed and characterized by a slight increase in , generally within 10–30 cm [48]. Indeed, our results show the natural cohesive sub-surface in the CDO and FOR areas (Figure 4b), and the intensification of the increase of in agriculture land uses. The in RAG was twice as high in the 10–15 cm layer in relation to the 0–5 cm surface layer. In IRR areas, there was also an increase in in these layers, although with less intensity than observed in RAG areas (Figure 4).
In Western Bahia, where the irrigated and rainfed croplands have a key role in the development of agriculture, this natural sub-surface horizon cohesion might be a concern factor for the maintenance of the rates of infiltration, the permeability and the water availability to the croplands and recharge of the aquifer. In general, a reduction of , and an increase of may be occurring due to a combination of agricultural implements used to remove the natural vegetation cover and the applied agriculture management, consequently reducing values.
During the fieldwork, the farmers reported that, after removing the Cerrado, it is mandatory to use the conventional tillage system, with the plowing, complemented by the subsoilers and scarifiers, to break any physical impediments. According to our interviews, after the conversion to agriculture, most farmers adopt a planting cycle system, where for the four years after the removal of Cerrado, the no-till system is applied and in the fifth year the conventional tillage system is used, characterizing a mixed management. However, we do not have enough long-term data to claim that this management is the best practice to adopt in order to avoid cohesive sub-surfaces [51,52], but we evaluated the effects of surface and subsurface compaction in hydraulic properties in IRR areas (Table 3). In these areas, where there are two or more crops planted per year, and the traffic of machinery is more intense, at the 15–20 cm layer is 1.67 g cm−3, significantly higher than at the surface (0–5 cm) layer (1.57 g cm−3) (Table 3), which is a vertical pattern similar to all the other LULCCs (Figure 4). While the difference in between surface and subsurface layers is significant, it is not sufficient to influence the hydraulic parameters, such as , , and (Table 3), although and are significantly different in the vertical.
The spatial variability of Ksat in soils under natural vegetation was also extremely high. In CDO, Ksat varied between 224.35 cm h−1 and 1.14 cm h−1, while, in FOR, it varied between 376.69 cm h−1 and 4.86 cm h−1. For Cerrado areas in the MATOPIBA, other studies have found in the range between 403.8 cm h−1 [48] and 5.26 cm h−1 [20].
In this study, the variability of in the natural areas can be explained by the higher heterogeneity of the soils, and, consequently, different accumulation of organic matter, litter, tree density, the soil fauna, source material and root systems acting on the soils structures. Despite the soil compaction, the average for agriculture areas can be considered higher when compared to for latossolos under conventional tillage system in Goiás, = 0.535 cm h−1 [53]. For other agriculture areas, in the Cerrado biome, the values presented in the literature range between 5.41 cm h−1 [20], and 15.47 cm h−1 [48]. Likely, the use of rotation among maize, soybean, cotton and other croplands, in addition to the mixed management in Western Bahia, contribute to the maintenance of the high rates of in agriculture land uses areas even with the presence of soil compaction.
5. Conclusions
This study analyzed hydraulic and physical soil properties in Western Bahia at a local scale and in different land uses and land covers. Significant changes were found between some soil properties in agricultural areas and natural vegetation cover, indicating that agricultural activity can influence the soil properties.
The agriculture land use increased soil bulk density at soil surface and subsurface, reducing the by an order of magnitude in relation to Cerrado and Forest areas, and also decreasing the soil porosity. Despite the reduction, still ranges between 30 mm h−1 and 62 mm h−1, which are still considered high hydrological infiltration rates. Thus, our results reveal that in Western Bahia the agriculture land use areas do not affect directly the vertical nature of hydrological flowpath for visited areas, but, in the case of very intense precipitation events, the reduction may lead to erosive processes favring nutrient and soil losses. In Western Bahia, however, the farmers are very interested in adopting sustainable practices that preserve the soil quality, investing in state-of-the-art technology, increasing the intervals of soil revolving and implementing crop rotation system.
Nonetheless, one must be careful to not extrapolate these results for all Western Bahia region, since we do not know how irrigated agriculture, rainfed agriculture, and pasture influence the hydraulic and physical properties in the long-term, and how the management (conventional tillage or no-tillage) can influence these properties in loamy/sand soils.
In the literature, several studies monitoring physical soil properties show that reduced tillage practices have promising results for soil moisture conservation and for crops growth. However, the number of scientific studies remains low for the Cerrado agricultural frontier. We emphasize that the impacts of land use change on hydraulic and physic soil properties are a reality in MATOPIBA and there is an urgent need to monitor how these changes occur over time in order to develop effective mitigation strategies of soil and water conservation.
Author Contributions
Experiment design, M.H.C.; data collection, E.A.D.; formal analysis, E.A.D.; data curation, M.H.C.; writing—original draft preparation, E.A.D.; writing—review and editing, E.A.D. and M.H.C.; visualization, E.A.D.; supervision, M.H.C.; project administration, M.H.C.; funding acquisition, M.H.C.
Funding
This study was financed in part by the Coordenação de Aperfeiçoamento de Pessoal de Nível Superior—Brasil (CAPES)—Finance Code 001 and PRODEAGRO (grant 011/2016).
Acknowledgments
We thank the Associação de Agricultores e Irrigantes da Bahia (AIBA-team) for all logistical support and the opportunity to know the Western Bahia region. For dedicated help during fieldwork, we would like to thank Glauciana, Jonatas, Jales, Samuel, Anderson, Sérgio, Eneas, Liliane, Lucas Lima and José Domingos and several other short-term helpers. In particular, we would to thank all farmers who welcomed our team on to their farms.
Conflicts of Interest
The authors declare no conflict of interest. The funders had no role in the design of the study, in the collection, analyses, or interpretation of data; in the writing of the manuscript, or in the decision to publish the results.
References
- De Oliveira, S.N.; de Carvalho Júnior, O.A.; Gomes, R.A.T.; Guimarães, R.F.; McManus, C.M. Landscape-fragmentation change due to recent agricultural expansion in the Brazilian Savanna, Western Bahia, Brazil. Reg. Environ. Chang. 2017, 17, 411–423. [Google Scholar] [CrossRef]
- Nunes de Oliveira, S.; Abílio de Carvalho Júnior, O.; Trancoso Gomes, R.A.; Fontes Guimarães, R.; McManus, C.M. Deforestation analysis in protected areas and scenario simulation for structural corridors in the agricultural frontier of Western Bahia, Brazil. Land Use Policy 2017, 61, 40–52. [Google Scholar] [CrossRef]
- Brannstrom, C.; Jepson, W.; Filippi, A.M.; Redo, D.; Xu, Z.; Ganesh, S. Land change in the Brazilian Savanna (Cerrado), 1986-2002: Comparative analysis and implications for land-use policy. Land Use Policy 2008. [Google Scholar] [CrossRef]
- Batistella, M.; Valladares, G.S. Farming expansion and land degradation in Western Bahia, Brazil. Biota Neotrop. 2009. [Google Scholar] [CrossRef]
- Spera, S.A.; Galford, G.L.; Coe, M.T.; Macedo, M.N.; Mustard, J.F. Land-use change affects water recycling in Brazil’s last agricultural frontier. Global Chang. Biol. 2016, 22, 3405–3413. [Google Scholar] [CrossRef] [PubMed]
- Filho, A.C.; Costa, K. A Expansão da Soja no Cerrado—Caminhos Para a Ocupação Territorial, Uso do Solo e Produção Sustentável; Technical Report; AGROICONE: São Paulo, Brazil, 2016. [Google Scholar]
- Sano, E.E.; dos Santos, C.C.M.; da Silva, E.M.; Chaves, J.M. Fronteira agrícola do oeste baiano: Considerações sobre os aspectos temporais e ambientais. Geociencias 2011, 30, 479–489. [Google Scholar]
- AIBA. Anuário Agropecuário do Oeste da Bahia Safra 2014/2015; AIBA: Barreiras, Brazil, 2015; p. 64. [Google Scholar]
- Batistella, M.; Guimarães, M.; de Miranda, E.E.; Vieira, H.R.; Valladares, G.S.; Mangabeira, J.A.d.C.; de Assis, M.C. Monitoramento da expansão agropecuária na reião Oeste da Bahia. Embr. Monit. Satél. 2002, 20, 41. [Google Scholar]
- AIBA. Anuário Agropecuário do Oeste da Bahia Safra 2016/2017; AIBA: Barreiras, Brazil, 2017; p. 53. [Google Scholar]
- Elsenbeer, H.; Newton, B.E.; Dunne, T.; De Moraes, J.M. Soil hydraulic conductivities of latosols under pasture, forest and teak in Rondonia, Brazil. Hydrol. Process. 1999. [Google Scholar] [CrossRef]
- Muller, M.M.L.; Guimarães, M.D.F.; Desjardins, T.; Martins, P.F.D.S. Degradação de pastagens na Região Amazônica: Propriedades físicas do solo e crescimento de raízes. Pesquisa Agropec. Bras. 2001, 36, 1409–1418. [Google Scholar] [CrossRef]
- Scheffler, R.; Neill, C.; Krusche, A.V.; Elsenbeer, H. Soil hydraulic response to land-use change associated with the recent soybean expansion at the Amazon agricultural frontier. Agric. Ecosyst. Environ. 2011, 144, 281–289. [Google Scholar] [CrossRef] [Green Version]
- Lal, R. Deforestation and land-use effects on soil degradation and rehabilitation in western Nigeria 1. Soil physical and hydrological properties. Land Degrad. Dev. 1996, 7, 19–45. [Google Scholar] [CrossRef]
- De Moraes, J.F.; Volkoff, B.; Cerri, C.C.; Bernoux, M. Soil properties under Amazon forest and changes due to pasture installation in Rondônia, Brazil. Geoderma 1996, 70, 63–81. [Google Scholar] [CrossRef]
- Zimmermann, B.; Elsenbeer, H.; De Moraes, J.M. The influence of land-use changes on soil hydraulic properties: Implications for runoff generation. For. Ecol. Manag. 2006, 222, 29–38. [Google Scholar] [CrossRef]
- Horel, Á.; Tóth, E.; Gelybó, G.; Kása, I.; Bakacsi, Z.; Farkas, C. Effects of Land Use and Management on Soil Hydraulic Properties. Open Geosci. 2015, 7. [Google Scholar] [CrossRef] [Green Version]
- De Almeida, V.P.; Alves, M.C.; Da Silva, E.C.; De Oliveira, S.A. Rotação de culturas e propriedades físicas e químicas em latossolo vermelho de cerrado sob preparo convencional e semeadura direta em adoção. Rev. Bras. Cienc. Solo 2008, 32, 1227–1237. [Google Scholar] [CrossRef]
- De Faria, A.F.G.; dos Santos, A.C.; dos Santos, T.M.; Batistella Filho, F. Influência do manejo do solo nas propriedades químicas e físicas em topossequência na bacia do rio Araguaia, Estado do Tocantins. Rev. Bras. Cienc. Solo 2010, 34, 517–524. [Google Scholar] [CrossRef] [Green Version]
- Filizola, H.F.; Fontana, A.; Donagemma, G.K.; de Souza, M.D.; Bortolon, E.S.O.; Bortolon, L. Qualidade física de solos influenciada pelo uso e manejo na região de Guaraí-TO. Bol. Pesquisa Desenvol. 2017, 72, 35. [Google Scholar]
- Bonetti, J.d.A.; Paulino, H.B.; de Souza, E.D.; Carneiro, M.A.C.; Caetano, J.O. Soil physical and biological properties in an integrated crop-livestock system in the Brazilian Cerrado. Pesquisa Agropec. Bras. 2018, 53, 1239–1247. [Google Scholar] [CrossRef]
- Nóbrega, R.L.B.; Guzha, A.C.; Torres, G.N.; Kovacs, K.; Lamparter, G.; Amorim, R.S.S.; Couto, E.; Gerold, G. Effects of conversion of native cerrado vegetation to pasture on soil hydro-physical properties, evapotranspiration and streamflow on the Amazonian agricultural frontier. PLoS ONE 2017, 12, e0179414. [Google Scholar] [CrossRef] [PubMed]
- Anache, J.A.; Flanagan, D.C.; Srivastava, A.; Wendland, E.C. Land use and climate change impacts on runoff and soil erosion at the hillslope scale in the Brazilian Cerrado. Sci. Total Environ. 2018, 622–623, 140–151. [Google Scholar] [CrossRef]
- Hunke, P.; Mueller, E.N.; Schröder, B.; Zeilhofer, P. The Brazilian Cerrado: assessment of water and soil degradation in catchments under intensive agricultural use. Ecohydrology 2015, 8, 1154–1180. [Google Scholar] [CrossRef]
- Dias, L.C.P.; Macedo, M.N.; Costa, M.H.; Coe, M.T.; Neill, C. Effects of land cover change on evapotranspiration and streamflow of small catchments in the Upper Xingu River Basin, Central Brazil. J. Hydrol. Reg. Stud. 2015, 4, 108–122. [Google Scholar] [CrossRef] [Green Version]
- Moreira, V.S.; Candido, A.; Roberti, D.R.; Webler, G.; Diaz, M.B.; Gon, G.; Gonçalves, D.; Pousa, R.; Degrazia, A. Influence of Soil Properties in Different Management Systems: Estimating Soybean Water Changes in the Agro-IBIS Model. Earth Interact. 2018, 22. [Google Scholar] [CrossRef]
- Przeździecki, K.; Zawadzki, J.; Cieszewski, C.; Bettinger, P. Georgia and South Carolina using the triangle method. Silva Fennica 2017, 51, 1–19. [Google Scholar]
- Wang, J.; Chagnon, F.J.F.; Williams, E.R.; Betts, A.K.; Renno, N.O.; Machado, L.A.T.; Bisht, G.; Knox, R.; Bras, R.L. Impact of deforestation in the Amazon basin on cloud climatology. Proc. Natl. Acad. Sci. USA 2009, 106, 3670–3674. [Google Scholar] [CrossRef] [Green Version]
- Malhado, A.C.M.; Pires, G.F.; Costa, M.H. Cerrado conservation is essential to protect the Amazon rainforest. Ambio 2010, 39, 580–584. [Google Scholar] [CrossRef]
- Coe, M.T.; Marthews, T.R.; Costa, M.H.; Galbraith, D.R.; Greenglass, N.L.; Imbuzeiro, H.M.; Levine, N.M.; Malhi, Y.; Moorcroft, P.R.; Muza, M.N.; et al. Deforestation and climate feedbacks threaten the ecological integrity of south-southeastern Amazonia. Philos. Trans. R. Soc. Lond. Ser. B Biol. Sci. 2013, 368, 20120155. [Google Scholar] [CrossRef]
- Pires, G.F.; Costa, M.H. Deforestation causes different subregional effects on the Amazon bioclimatic equilibrium. Geophys. Res. Lett. 2013, 40, 3618–3623. [Google Scholar] [CrossRef] [Green Version]
- IBGE. Manual Técnico da Vegetação Brasileira (Manuais Técnicos em Geociências n. 1); Fundação Instituto Brasileiro de Geografia e Estatística (IBGE): Rio de Janeiro, RJ, Brazil, 1992.
- Dos Santos, H.G.; Jacomine, P.K.T.; dos Anjos, L.H.C.; de Oliveira, V.A.; Lumbreras, J.F.; Coelho, M.R.; de Almedia, J.A.; de Araujo Filho, J.C.; de Oliveria, J.B.; Cunha, T.J.F. Brazilian Soil Classification System, 5th re ed.; EMBRAPA Solos: Brasília, DF, Brazil, 2018. [Google Scholar]
- Youngs, E. Hydraulic Conductivity of Saturated Soils. In Soil Analysis: Physical Methods; Marcel Dekker Inc.: New York, NY, USA, 1991; pp. 161–207. [Google Scholar]
- Ruiz, H.A. Incremento da exatidão da análise granulométrica do solo por meio da coleta da suspensão (silte + argila). Rev. Bras. Cien. Solo 2005, 29, 297–300. [Google Scholar] [CrossRef]
- Richards, L.A.; Fireman, M. Pressure-plate apparatus for measuring moisture sorption and transmission by soils. Soil Sci. 1943, 56, 395–404. [Google Scholar] [CrossRef]
- ClassenL, M.E.C.; Barreto, W.D.O.; Paula, J.L.D.; Duarte, M.N. Manual de Métodos de Análise de Solo; EMBRAPA; Centro Nacional de Pesquisa de Solos: Rio de Janeiro, Brazil, 1997; Volume 2, pp. 7–9. [Google Scholar]
- Campbell, G.S.; Norman, J.M. An Introduction to Environmental Biophysics, 2nd ed.; Springer: New York, NY, USA, 1998; Volume 6, p. 474. [Google Scholar]
- Clapp, R.B.; Hornberger, G.M. Empirical equations for some soil hydraulic properties. Water Resour. Res. 1978, 14, 601–604. [Google Scholar] [CrossRef]
- Moldrup, P.; Olesen, T.; Komatsu, T.; Schjønning, P.; Rolston, D. Tortuosity, Diffusivity, and Permeability in the Soil Liquid and Gaseous Phases. Soil Sci. Soc. Am. J. 2001, 65, 613. [Google Scholar] [CrossRef]
- Van Looy, K.; Bouma, J.; Herbst, M.; Koestel, J.; Minasny, B.; Mishra, U.; Montzka, C.; Nemes, A.; Pachepsky, Y.A.; Padarian, J.; et al. Pedotransfer Functions in Earth System Science: Challenges and Perspectives. Rev. Geophys. 2017, 55, 1199–1256. [Google Scholar] [CrossRef] [Green Version]
- Pittaki-Chrysodonta, Z.; Moldrup, P.; Knadel, M.; Iversen, B.V.; Hermansen, C.; Greve, M.H.; de Jonge, L.W. Predicting the Campbell Soil Water Retention Function: Comparing Visible–Near-Infrared Spectroscopy with Classical Pedotransfer Function. Vadose Zone J. 2018, 17. [Google Scholar] [CrossRef]
- R Core Team. R: A Language and Environment for Statistical Computing; R Foundation for Statistical Computing: Vienna, Austria, 2018. [Google Scholar]
- Wilk, M.B.; Shapiro, S.S. An Analysis of Variance Test for Normality. Biometrika 1965, 52, 591–611. [Google Scholar]
- Jacomine, P.K.T.; Cavalcanti, A.C.; Ribeiro, M.R.; Montenegro, J.O.; Burgos, N.; Filho, T.F.R.d.M.; Formiga, R.A. Levantamento exploratório - Reconhecimento de solos da margem esquerda do Rio São Francisco da Bahia. Bol. Técnico EMBRAPA Rec. 1976, 38, 1–439. [Google Scholar]
- Cunha, T.J.F.; Macedo, J.R.; Ribeiro, L.P.; Palmieri, F.; de Freitas, P.L.; Aguiar, A.d.C. Impacto do manejo convencional sobre propriedades físicas e substâncias húmicas de solos sob cerrado. Ciênc. Rural 2001. [Google Scholar] [CrossRef]
- Fontana, A.; de Oliveira, A.P. Levantamento e caracterização de solos frágeis no Município de Luís Eduardo Magalhães, BA. In Solos Frágeis: Caracterização, Manejo e Sustentabilidade; de Castor, S.S., Hernani, L.C., Eds.; EMBRAPA Solos: Brasília, DF, Brazil, 2015; Chapter 3. [Google Scholar]
- Fontana, A.; Teixeira, W.G.; Balieiro, F.d.C.; de Moura, T.P.A.; de Menezes, A.R.; Santana, C.I. Características e atributos de Latossolos sob diferentes usos na região Oeste do Estado da Bahia. Pesquisa Agropec. Bras. 2016. [Google Scholar] [CrossRef]
- Giarola, N.F.B.; Silva, A.P.; Tormena, C.; Souza, L.S.; Ribeiro, L.P. Similaridades entre o caráter coeso dos solos e o comportamento hardsetting: Estudo de caso. Revista Bras. Ciênc. Solo 2001, 25, 239–247. [Google Scholar] [CrossRef]
- Giarola, N.F.B.; Silva, A.P.D. Conceitos sobre solos coesos e hardsetting. Sci. Agric. 2002, 59, 613–620. [Google Scholar] [CrossRef] [Green Version]
- Stone, L.F.; Silveira, P.M. Efeitos do sistema de preparo e da rotação de culturas na porosidade e densidade do solo. Rev. Bras. Ciênc. Solo 2001, 25, 395–401. [Google Scholar] [CrossRef] [Green Version]
- Santos, G.G.; Marchão, R.L.; da Silva, E.M.; da Silveira, P.M.; Becquer, T. Qualidade física do solo sob sistemas de integração lavoura-pecuária. Pesquisa Agropec. Bras. 2011, 46, 1339–1348. [Google Scholar] [CrossRef] [Green Version]
- Da Silva, N.F.; Nobre, F.; de Carvalho, R.C.; Filho, F.R.C.; Teixeira, M.B.; Joaquim, J. Características físico-hídricas de um latossolo sob diffrentes sistemas de manejo. Rev. Bras. Agric. Irrigada 2014, 8, 375–390. [Google Scholar]
Figure 1.
Study area and location of the soil samples collected considering different land use and land cover in Western Bahia.
Figure 1.
Study area and location of the soil samples collected considering different land use and land cover in Western Bahia.

Figure 2.
Average soil texture fractions for 0–5 cm layer in Western Bahia according to the USDA soil classification and to the Brazilian soil classification system—SiBCS.
Figure 2.
Average soil texture fractions for 0–5 cm layer in Western Bahia according to the USDA soil classification and to the Brazilian soil classification system—SiBCS.

Figure 3.
Soil hydraulic and physical properties considering 0–5 cm depth for different LULCCs in Western Bahia.In the box plots, the lower limit of the box indicates the 25th percentile, the black line within the box marks the median, the red point within the box marks the mean, and the upper limit of the box indicates the 75th percentile. Bars above and below the box indicate the confidence interval. The samples are distributed in Cerrado areas (CDO), n = 22; Forest formations (FOR), n = 19; Irrigated agriculture (IRR), n= 20; Pasture (PAST), n = 21; and Rainfed agriculture (RAG), n = 20. Different letters means that averages are statistically different according to Tukey Cramer test at = 0.05.

Figure 4.
Profile average of soil bulk density standard deviation for different land use and land cover classes. The total samples are 714 distributed in: Cerrado areas (CDO), n = 22; Forest formations (FOR), n = 19; Irrigated agriculture (IRR), n= 20; Pasture (PAST), n = 21; and Rainfed agriculture areas (RAG), n = 20, multiplied by 7 depths.


Table 1.
Average soil physical parameters for 0–5 cm layer under different land use cover in the Western of Bahia used in this study.
Table 1.
Average soil physical parameters for 0–5 cm layer under different land use cover in the Western of Bahia used in this study.
| LULCC | b | ||||||||
|---|---|---|---|---|---|---|---|---|---|
| CDO | 0.71 | −4.18 | 1.36 | 16.29 | 2.53 | 0.4813 | 0.1274 | 0.0848 | 0.0425 |
| FOR | 0.87 | −5.10 | 1.35 | 14.47 | 2.52 | 0.4619 | 0.1789 | 0.1109 | 0.0680 |
| IRR | 1.46 | −4.26 | 1.57 | 3.01 | 2.61 | 0.3991 | 0.1494 | 0.0858 | 0.0636 |
| PAST | 1.80 | −5.00 | 1.61 | 5.10 | 2.58 | 0.3762 | 0.1663 | 0.1052 | 0.0611 |
| RAG | 1.20 | −5.30 | 1.52 | 6.22 | 2.59 | 0.4108 | 0.1719 | 0.1177 | 0.0542 |
: soil air potential entry, kPa; b: Campbell parameter; : soil bulk density, g cm−3; : saturated hydraulic conductivity, cm h−1; : soil particle density, g cm−3; : soil total porosity, fraction; : volumetric moisture at 10 kPa, cm3 cm−3; : volumetric moisture at 1500 kPa, cm3 cm−3; : volumetric moisture available to plants, cm3 cm−3
Table 2.
Pedotransfer functions for Western Bahia.
| Pedotransfer Function—PTF | Validation | ||||
|---|---|---|---|---|---|
| y | Equation | R2 | F | p-Value | r |
| IRR—Irrigated Agriculture | |||||
| 3.5824 − 1.2283 − 7.7754 | 0.59 | 8.60 | 0.005 | 0.84 | |
| b | −3.7421 − 1.6219 | 0.17 | 2.71 | 0.123 | −0.69 |
| −0.8328 + 3.2159 | 0.06 | 1.95 | 0.186 | −0.008 | |
| 0.86625 − 0.01727 − 0.21859 − 0.85690 | 0.08 | 0.31 | 0.816 | 0.29 | |
| 0.5624 − 0.1561 − 0.5720 | 0.11 | 0.67 | 0.528 | 0.20 | |
| CDO—Cerrado formations | |||||
| 1.6879 − 0.5922 − 3.6247 | 0.63 | 10.91 | 0.002 | 0.55 | |
| b | −6.204 + 3.530 | 0.16 | 2.71 | 0.122 | 0.36 |
| 1.7913 − 1.2343 | 0.16 | 3.58 | 0.081 | −0.15 | |
| 0.46082 − 0.18014 | 0.27 | 5.09 | 0.041 | 0.80 | |
| 0.24049 − 0.10555 | 0.18 | 3.08 | 0.101 | 0.68 | |
| PAST—Pasture | |||||
| 4.4995 − 1.5082 − 5.1395 | 0.51 | 6.33 | 0.013 | 0.93 | |
| b | −12.938 + 6.370 + 12.937 | 0.59 | 8.53 | 0.05 | 0.24 |
| 4.4227 + 1.5955 − 2.7828 | 0.50 | 7.96 | 0.006 | 0.58 | |
| 0.59324 − 0.14310 + 0.18177 | 0.73 | 15.64 | 4.54 × 10⁻⁴ | 0.93 | |
| 0.17058 − 0.14580 | 0.56 | 16.47 | 0.001 | 0.45 | |
| FOR—Forest Formations | |||||
| 2.5457 − 0.8746 − 5.3052 | 0.53 | 6.19 | 0.016 | 0.98 | |
| b | −36.460 + 7.915 + 11.956 + 26.145 | 0.59 | 4.81 | 0.025 | 0.74 |
| −0.6224 + 1.2973 + 2.7719 | 0.18 | 2.48 | 0.130 | −0.76 | |
| 1.42937 − 0.28125 − 0.46640 − 1.00496 | 0.53 | 3.67 | 0.051 | 0.79 | |
| 1.24529 − 0.21743 − 0.43746 − 0.99032 | 0.68 | 7.30 | 0.007 | 0.84 | |
| RAG—Rainfed Agriculture | |||||
| 11.351 − 4.110 − 12.448 | 0.47 | 5.30 | 0.022 | 0.84 | |
| b | −36.157 + 10.086 + 7.275 + 35.835 | 0.86 | 23.03 | 4.80 × 10⁻⁵ | 0.73 |
| −0.1303 + 1.6849 | 0.21 | 4.82 | 0.047 | −0.28 | |
| 2.84267 − 0.26601 − 0.97267 −2.40257 | 0.80 | 14.60 | 37.5 × 10⁻⁵ | −0.33 | |
| 1.30028 − 0.20449 − 0.40620 − 1.12476 | 0.76 | 11.76 | 0.001 | 0.42 | |
r: Pearson correlation coefficient.
Table 3.
Hydraulic and soil physical properties for irrigated land use in different depths.
| Depth | b | ||||||||
|---|---|---|---|---|---|---|---|---|---|
| 0–5 | 1.46 a | −4.26 a | 1.574 a | 3.00 a | 2.612 a | 0.397 a | 0.169 a | 0.0858 a | 0.0840 a |
| 15–20 | 0.03 b | −4.16 a | 1.665 b | 3.07 a | 2.662 a | 0.374 a | 0.172 b | 0.0902 a | 0.0818 a |
ab Values significantly different according to the t Student test at = 0.05 are followed by different letters. : soil air potential entry, kPa; b: Campbell parameter; : soil bulk density, g cm−3; : saturated hydraulic conductivity, cm h−1; : soil particle density, g cm−3; : soil total porosity; fraction; : volumetric moisture at 10 kPa, cm3 cm−3; : volumetric moisture at 1500 kPa, cm3 cm−3; : volumetric moisture available to plants, cm3 cm−3.
© 2019 by the authors. Licensee MDPI, Basel, Switzerland. This article is an open access article distributed under the terms and conditions of the Creative Commons Attribution (CC BY) license (http://creativecommons.org/licenses/by/4.0/).
Share and Cite
MDPI and ACS Style
Dionizio, E.A.; Costa, M.H. Influence of Land Use and Land Cover on Hydraulic and Physical Soil Properties at the Cerrado Agricultural Frontier. Agriculture 2019, 9, 24. https://0-doi-org.brum.beds.ac.uk/10.3390/agriculture9010024
AMA Style
Dionizio EA, Costa MH. Influence of Land Use and Land Cover on Hydraulic and Physical Soil Properties at the Cerrado Agricultural Frontier. Agriculture. 2019; 9(1):24. https://0-doi-org.brum.beds.ac.uk/10.3390/agriculture9010024
Chicago/Turabian StyleDionizio, Emily Ane, and Marcos Heil Costa. 2019. "Influence of Land Use and Land Cover on Hydraulic and Physical Soil Properties at the Cerrado Agricultural Frontier" Agriculture 9, no. 1: 24. https://0-doi-org.brum.beds.ac.uk/10.3390/agriculture9010024
Note that from the first issue of 2016, this journal uses article numbers instead of page numbers. See further details here.