Article

Differential Response of Sugar Beet to Long-Term Mild to Severe Salinity in a Soil–Pot Culture

by
Md. Tahjib-UI-Arif
1,2,*,
Abdullah Al Mamun Sohag
1,
Sonya Afrin
2,
Kazi Khayrul Bashar
3,
Tania Afrin
4,
A.G.M. Sofi Uddin Mahamud
5,
Mohammed Arif Sadik Polash
6,
Md. Tahmeed Hossain
1,
Md. Abu Taher Sohel
7,
Marian Brestic
8,9 and
Yoshiyuki Murata
2
1
Department of Biochemistry and Molecular Biology, Faculty of Agriculture, Bangladesh Agricultural University, Mymensingh-2202, Bangladesh
2
Graduate School of Environmental and Life Science, Okayama University, Kita-ku, Okayama 700-8530, Japan
3
Bangladesh Jute Research Institute, Manik Mia Avenue, Dhaka-1207, Bangladesh
4
Graduate Training Institute, Bangladesh Agricultural University, Mymensingh-2202, Bangladesh
5
Food Biochemistry Laboratory, Department of Biochemistry and Molecular Biology, Faculty of Agriculture, Bangladesh Agricultural University, Mymensingh-2202, Bangladesh
6
Department of Crop Botany, Faculty of Agriculture, Bangladesh Agricultural University, Mymensingh-2202, Bangladesh
7
Agronomy and Farming System Division, Bangladesh Sugar Crop Research Institute, Pabna 6620, Bangladesh
8
Department of Plant Physiology, Faculty of Agrobiology and Food Resources, Slovak University of Agriculture, 94976 Nitra, Slovakia
9
Department of Botany and Plant Physiology, Faculty of Agrobiology, Food and Natural Resources Czech University of Life Sciences, 16500 Prague, Czech Republic
*
Author to whom correspondence should be addressed.
Submission received: 20 July 2019 / Revised: 23 September 2019 / Accepted: 26 September 2019 / Published: 13 October 2019

Abstract

:
Attempts to cultivate sugar beet (Beta vulgaris spp. vulgaris) in the sub-tropical saline soils are ongoing because of its excellent tolerance to salinity. However, the intrinsic adaptive physiology has not been discovered yet in the sub-tropical climatic conditions. In this study, we investigated morpho-physiological attributes, biochemical responses, and yield of sugar beet under a gradient of salinity in the soil–pot culture system to evaluate its adaptive mechanisms. Results exhibited that low and high salinity displayed a differential impact on growth, photosynthesis, and yield. Low to moderate salt stress (75 and 100 mM NaCl) showed no inhibition on growth and photosynthetic attributes. Accordingly, low salinity displayed simulative effect on chlorophyll and antioxidant enzymes activity which contributed to maintaining a balanced H2O2 accumulation and lipid peroxidation. Furthermore, relative water and proline content showed no alteration in low salinity. These factors contributed to improving the yield (tuber weight). On the contrary, 250 mM salinity showed a mostly inhibitory role on growth, photosynthesis, and yield. Collectively, our findings provide insights into the mild–moderate salt adaptation strategy in the soil culture test attributed to increased water content, elevation of photosynthetic pigment, better photosynthesis, and better management of oxidative stress. Therefore, cultivation of sugar beet in moderately saline-affected soils will ensure efficient utilization of lands.

1. Introduction

Among various abiotic stressors, the phenomenon of global soil salinization is intensifying daily due to the ongoing climate change-induced sea-level rise, extensive irrigation practices with saline water, and large-scale soil erosion [1,2]. It has attracted significant attention due to its deleterious effects on growth, biomass accumulation, and productivity of crop plants [3]. Some estimations show that the global population will touch 9600 million by 2050 [4]. Therefore, about a 70% increase in food production is required within 30 years. But, the salinization problem contributes to a loss of 12 billion US dollar per year [5,6,7], which ultimately undermines the goal of meeting global food security [8]. Salinity stress provokes a wide array of responses in plants via affecting its morpho-physiological, biochemical, and molecular processes. It causes ionic imbalance, such as excessive Na+ and Cl ions accumulation which causes inhibition of the metabolic enzymes [9,10,11,12,13,14,15,16].
Having an inhibitory role, salinity generates osmotic stress which results in decreased leaf turgor by hampering water movement across the plant and decrease stomatal conductance (Gs) by stomata closure [17,18,19]. Plants accumulate compatible solutes or osmolytes, such as proline, in the cytosol when exposed to osmotic stress to cope with the decreased water potential. It is well-defined that the accumulation of proline enhances with salt stress. Moreover, a higher increase in proline accumulation is a marker of osmotic stress in plants, and it was previously shown that the salt-tolerant crop species accumulate a lower amount of proline than that of sensitive species [20,21,22]. However, the stomatal closure restricts transpiration rate (E) and CO2 availability in the leaves. As a result, the intercellular CO2 concentration (Ci) declines and causes altered leaf biochemistry which negatively affects the net CO2 assimilation rate (A) under long-term stress conditions. Moreover, under different saline environments, Gs and A decrease concurrently which triggers the change in intrinsic water use efficiency (WUE) of plants [13,17,18]. Furthermore, under lower CO2 concentrations in leaves, ribulose-1,5-bisphosphate carboxylase/oxygenase favored O2 as a substrate over CO2 that ultimately leads to the formation of reactive oxygen species (ROS), such as superoxide radical (O2), singlet oxygen (1O2), and hydrogen peroxide (H2O2) [23,24]. It has also been reported that a minimal amount of ROS (H2O2 and/or hydroxyl radical) acts as a signaling molecule [25]. However, an excessive amount of ROS displays deleterious effects on plant growth and productivity by causing the photoinhibition of PSII (photosystem II), degrading the photosynthetic pigments, oxidizing lipid molecules, and inhibiting gene expression, etc. [19,24,26,27,28,29]. To scavenge the deleterious ROS, plants evolved with efficient detoxification mechanisms, such as non-enzymatic and enzymatic antioxidants, throughout evolution. The non-enzymatic antioxidants are tocopherols, ascorbate, phenolics, and glutathione, and enzymatic antioxidants are superoxide dismutase (SOD), peroxidase (POX), catalase (CAT), as well as the enzymes of the ascorbate–glutathione cycles that detoxify ROS [30,31,32,33,34]. Elevation of these enzymatic and non-enzymatic antioxidants has been reported in many salt-tolerant plant species, such as Jatropha curcas [35], Solanum lycopersicum [36], and Calendula officinalis [37] suggestive of a potential function of antioxidants in alleviating salinity-induced oxidative damage in plant cells.
Sugar beet (Beta vulgaris spp. vulgaris), a member of Chenopodiaceae, is considered as the second most important sugar crop globally after sugar cane (Saccharum officinarum L.) having a growth period of about half of sugarcane [38,39]. In addition, the sugar content of the sugar beet is relatively higher than sugar cane. Furthermore, sugar beet requires less water for its cultivation process than sugar cane [39]. For the production of one kilogram of sugar from sugarcane, about 4.0 m3 water is required, whereas, for the production of the same quantity of sugar from sugar beet, about 1.4 m3 water is required [38]. Sugar beet is a deep rooting crop and shows relatively higher tolerance to water stress caused by either soil moisture depletion or soil salinity [38,40]. Over time, table beet, fodder beet, red beet, and sugar beet have been evolved from sea beet which can be cultivated in a wide range of climatic conditions including saline prone regions [41,42]. Estimations show that the yield components of sugar beet are enhanced by irrigation with various concentrations of saline water [43,44]. However, Ghoulam et al. [45], Dadkhah [46], and Wang et al. [47] described the unfavorable effects of salt stress on growth and yield of sugar beet.
Bangladesh is encompassed by a colossal coastal and offshore area which covers 2.85 million hectares. From that massive area, a 0.83 million hectare region is severely devastated by salinity which is 30% of the entire cultivable land of Bangladesh. Estimation shows that the extent of salt-affected areas has increased by nearly 26.0% in the coastline of Bangladesh in the last 35 years [8,48]. Moreover, the soil salinity in the dry season is three times higher than that of the rainy season, and it is possible to minimize the salinity level of the surface soil by intensifying crop production during this time [49]. Therefore, as a moderate salt-tolerant crop together with its short life cycle compared with sugarcane, sugar beet can be considered as one of the most promising crops to cultivate in Bangladesh, especially in the coastal belt where salt-affected land is increasing daily. Taking into account all these facts, the present experiment was designed to investigate the possibility of sugar beet var. HI-0473 cultivation in saline soils. Therefore, the objectives of this study are (i) to investigate the response of growth, yield, and photosynthetic attributes of sugar beet exposed to different levels of soil salinity, and (ii) to measure the extent of ROS accumulation and the activities of ROS scavenging antioxidants under salinity stress.

2. Materials and Methods

2.1. Plant Growth, Environment, and Treatments

This experiment was conducted during the 2017 to 2018 growing season in the net house of the Department of Biochemistry and Molecular Biology, Bangladesh Agricultural University which is located in a sub-tropical climate with mild winter and hot summer. The sugar beet (var. HI-0473) seeds were collected from the Bangladesh Sugar Crop Research Institute, Pabna, Bangladesh. The disinfected seeds were planted in earthen pots having 23.5 cm height and 25.5 cm diameter (upper) and filled with 8.0 kg soil. The texture of the soil was silty loam including the following characteristics: pH, 6.12; electrical conductivity (EC), 0.25 dSm−1; cation exchange capacity, 8.2%; exchangeable Na+, 0.38 meq 100 g−1 soil; exchangeable K+, 0.15 cmol kg−1 soil; total nitrogen, 0.12%, and organic matter, 1.19%. The soil was formulated by mixing the following manures and fertilizers to each pot: 366 mg urea, 1.38 g triple superphosphate, 836 mg potassium nitrate, 363 mg gypsum, and 400 g cow dung. To maintain sufficient nitrogen supply during the lifespan, urea was applied in three installments at 30-day intervals.
At the 60th day after planting, sugar beet plants were treated with 0 mM NaCl (control, C), 75 mM NaCl (S75), 100 mM NaCl (S100), 150 mM NaCl (S150), and 250 mM NaCl (S250) stress by adding 0 g, 57.0 g, 76.0 g, 114.0 g, and 190.0 g NaCl, respectively [50]. The desired amounts of NaCl were dissolved in 3.0 L water and applied in the corresponding pot three times at 3-day intervals (each time 1000 mL solution). In the case of 0 mM NaCl treatment, the same amount of tap water was applied. The pot was a closed system, and to maintain the salinity stress, no leaching of water from the pots was ensured. From the 75th day, plants were irrigated with 750 mL distilled water at 4 to 5-day intervals. The experiment was continued until the 155th day, whereas at the 120th day, leaves samples were collected for different biochemical analyses. This research was executed in a randomized complete block design with three replications, and each replicate represented a pot with 4 sugar beet plants.

2.2. Measurement of Growth Performances and Yield

At the 155th day, sugar beet tubers were harvested after removing the soil from the base of the plants and the shoot length (SL), shoot fresh weight (SFW), and tuber fresh weight (TFW) were determined according to Afrin et al. [51]. The shoots were packed in a paper envelope and kept in the oven for 7 days at 70 °C. When shoots were desiccated fully, shoot dry weight (SDW) was measured.

2.3. Measurement of Plant Photosynthetic Capacity

A portable photosynthetic machine (LCi-SD System, ADC Bioscientific Ltd., Hoddesdon, UK) was used to estimate the CO2 assimilation rate (A), stomatal conductance (Gs), transpiration rate (E), and intercellular CO2 concentration (Ci) in the fully expanded 4th and 5th leaf from the top of each sugar beet plant. The following conditions were maintained: CO2 concentration, 400 μmol mol−1; leaf temperature, 28 °C; photosynthetic photon flux, 400 μmol m−2 s−1; flow rate, 200 mL min−1; the area inside the leaf chamber, 5.8 mm3 and time, 10.00 AM to 12.00 AM. These photosynthetic and gas exchange associated parameters were evaluated on three different plants per replicate at the 119th day.

2.4. Calculation of Instantaneous Carboxylation Efficiency and Water Use Efficiency (WUE)

Instantaneous carboxylation efficiency (A/Ci) and instantaneous WUE (A/E) were calculated as the ratio between A and Ci, and the ratio between A and E, respectively [52].

2.5. Determination of Total Chlorophyll Content, Relative Water Content, and Proline Content

Total chlorophyll (Chl) content of different salt-treated sugar beet leaves was extracted from 0.05 g of the 4th fresh leaves from the top at 60 days after salt treatment following the method of Afrin et al. [51] and determined following the protocol established by Lichtenthaler [53].
The relative water content (RWC) of sugar beet leaves was determined on the 120th day according to Tahjib-Ul-Arif et al. [54], and the proline content was determined according to the method described by Zhang and Huang [55].

2.6. Determination of H2O2, Malondialdehyde and Ascorbate Content

The H2O2 content of 120-day old sugar beet plant leaves was determined following the method of Velikova et al. [56], and Malondialdehyde (MDA) content was determined according to the method of Zhang and Huang [55].
The ascorbate content of sugar beet plants was determined by homogenizing leaf samples, and 2.0 mL of the leaf homogenate was mixed with 1.0 mL 10% trichloroacetic acid and centrifuged at 5500× g for 10 min at 4 °C [57]. Then 0.2 mL of supernatant was taken in a test tube and after 10 times dilution with ddH2O, 0.2 mL folin chiocaltu reagent (10 times diluted) was added to it. After vigorous shaking on a vortex, the absorption was taken at 760 nm in a UV-VIS spectrophotometer (Shimadzu, UV-1201, Kyoto, Japan). Ascorbate content was calculated by preparing a standard curve.

2.7. Determination of Enzymatic Antioxidant Activity

The activities of CAT, ascorbate peroxidase (APX), and POX antioxidant enzymes of 120-day old plants were determined using 0.05 g fresh 4th leaves. The leaf samples were homogenized in a cold mortar-pestle with 1.0 mL of 50 mM potassium phosphate buffer (pH 8.0) and immediately centrifuged at 11500× g for 10 min at 4 °C temperature. The supernatant was used for enzyme assay using a UV-VIS spectrophotometer (Shimadzu, UV-1201, Kyoto, Japan). The CAT (EC: 1.11.1.6) activity was determined from the decrease in absorbance per minute at 240 nm wavelength due to the consumption of H2O2 [58]. The APX (EC: 1.11.1.11) and POX (EC: 1.11.1.7) activity were assessed following the method of Nakano and Asada [59].

2.8. Statistical Analysis

The one-way analysis of variance was performed using Minitab 17.0. Different letters indicate the statistically significant differences between treatments at p < 0.05, according to the Tukey’s honestly significant difference tests. Data provided in the tables and figures are means ± standard errors of three individual replications for each treatment. The heatmap and clustering analysis were prepared from normalized mean values using the MetaboAnalyst 4.0 (www.metaboanalyst.ca) [60]. Hierarchical cluster analysis was conducted using the Euclidean distance algorithm. The principal component analysis (PCA) was carried out using the OriginLab 10.0 software (OriginLab, Northampton, MA, USA).

3. Results

3.1. Effects of the Concentrations of Saline Water on Growth and Yield of Sugar Beet

The impact of salt stress on the growth and yield of sugar beet was assessed by studying some growth-related traits, such as SL, SFW, SDW, and TFW, after imposition of saline water for a period of 95 days (Table 1). The SL of the sugar beet plants markedly reduced by 39.0% under 250 mM salt stress but displayed no significant variation under 75 mM, 100 mM, and 150 mM NaCl when compared with that of control plants. The SFW was elevated by 50.54%, 47.40%, and 11.42% under 75 mM, 100 mM, and 150 mM salt stress, respectively, whereas it declined by 21.98% at 250 mM NaCl stress relative to that of control plants. Consequently, SDW of sugar beet was increased by 40.15%, 21.21%, and 18.94% under 75 mM, 100 mM, and 150 mM salt stress, respectively, whereas it displayed no significant decrease under 250 mM salt stress when compared with control plants (Table 1). Most importantly, TFW (yield, the tuber production) of sugar beet plant remained unchanged under 100 mM and 150 mM salt stress, whereas it reduced significantly by 13.77% at 250 mM saltwater relative to that of non-saline condition. It should be pointed out that TFW markedly increased by 27.97% under 75 mM salt stress over the control plants (Table 1).

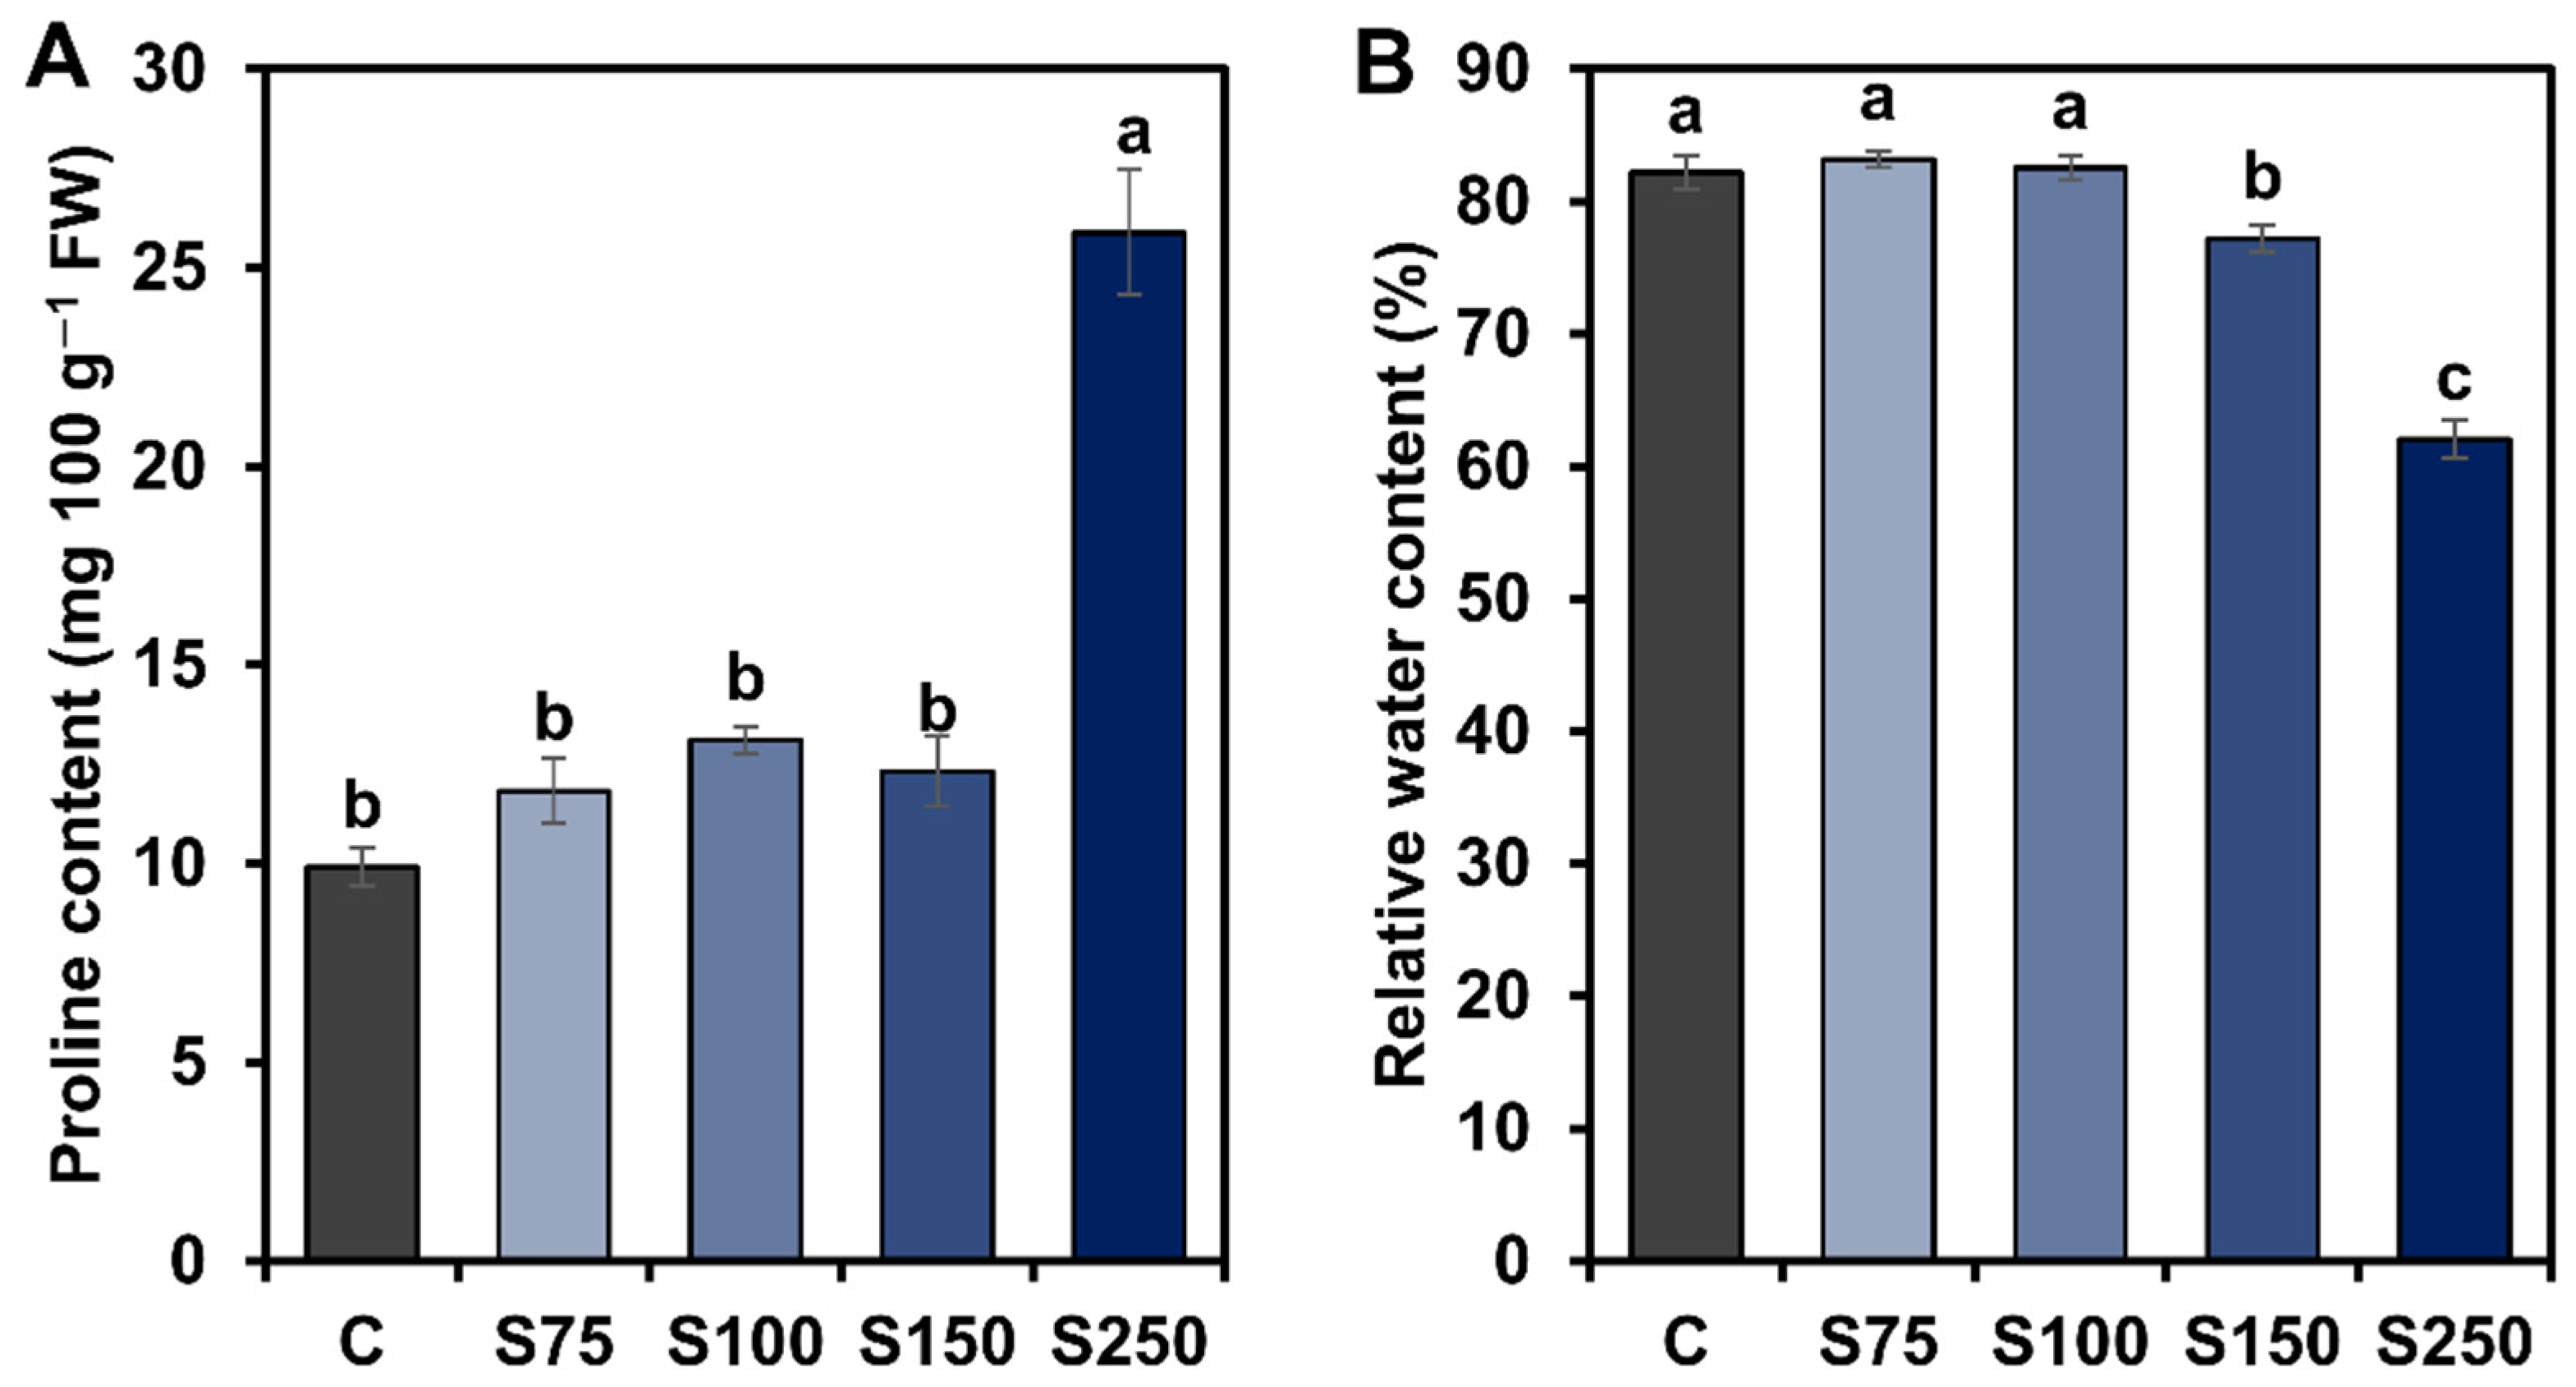
3.2. Effects of the Concentrations of Saline Water on RWC and Proline Content

To figure out the water content and osmolyte related mechanisms in sugar beet plant, we measured RWC and proline content under several concentrations of saline water (Figure 1). Leaf RWC of salt-stressed sugar beet plants displayed no significant change at 75 mM and 100 mM saline water treatments whereas it significantly dropped by 6.11% and 24.53% at 150 mM and 250 mM saline water treatments, respectively. Unlike RWC, proline content exhibited a distinct increase of 161.15% under 250 mM NaCl stress.

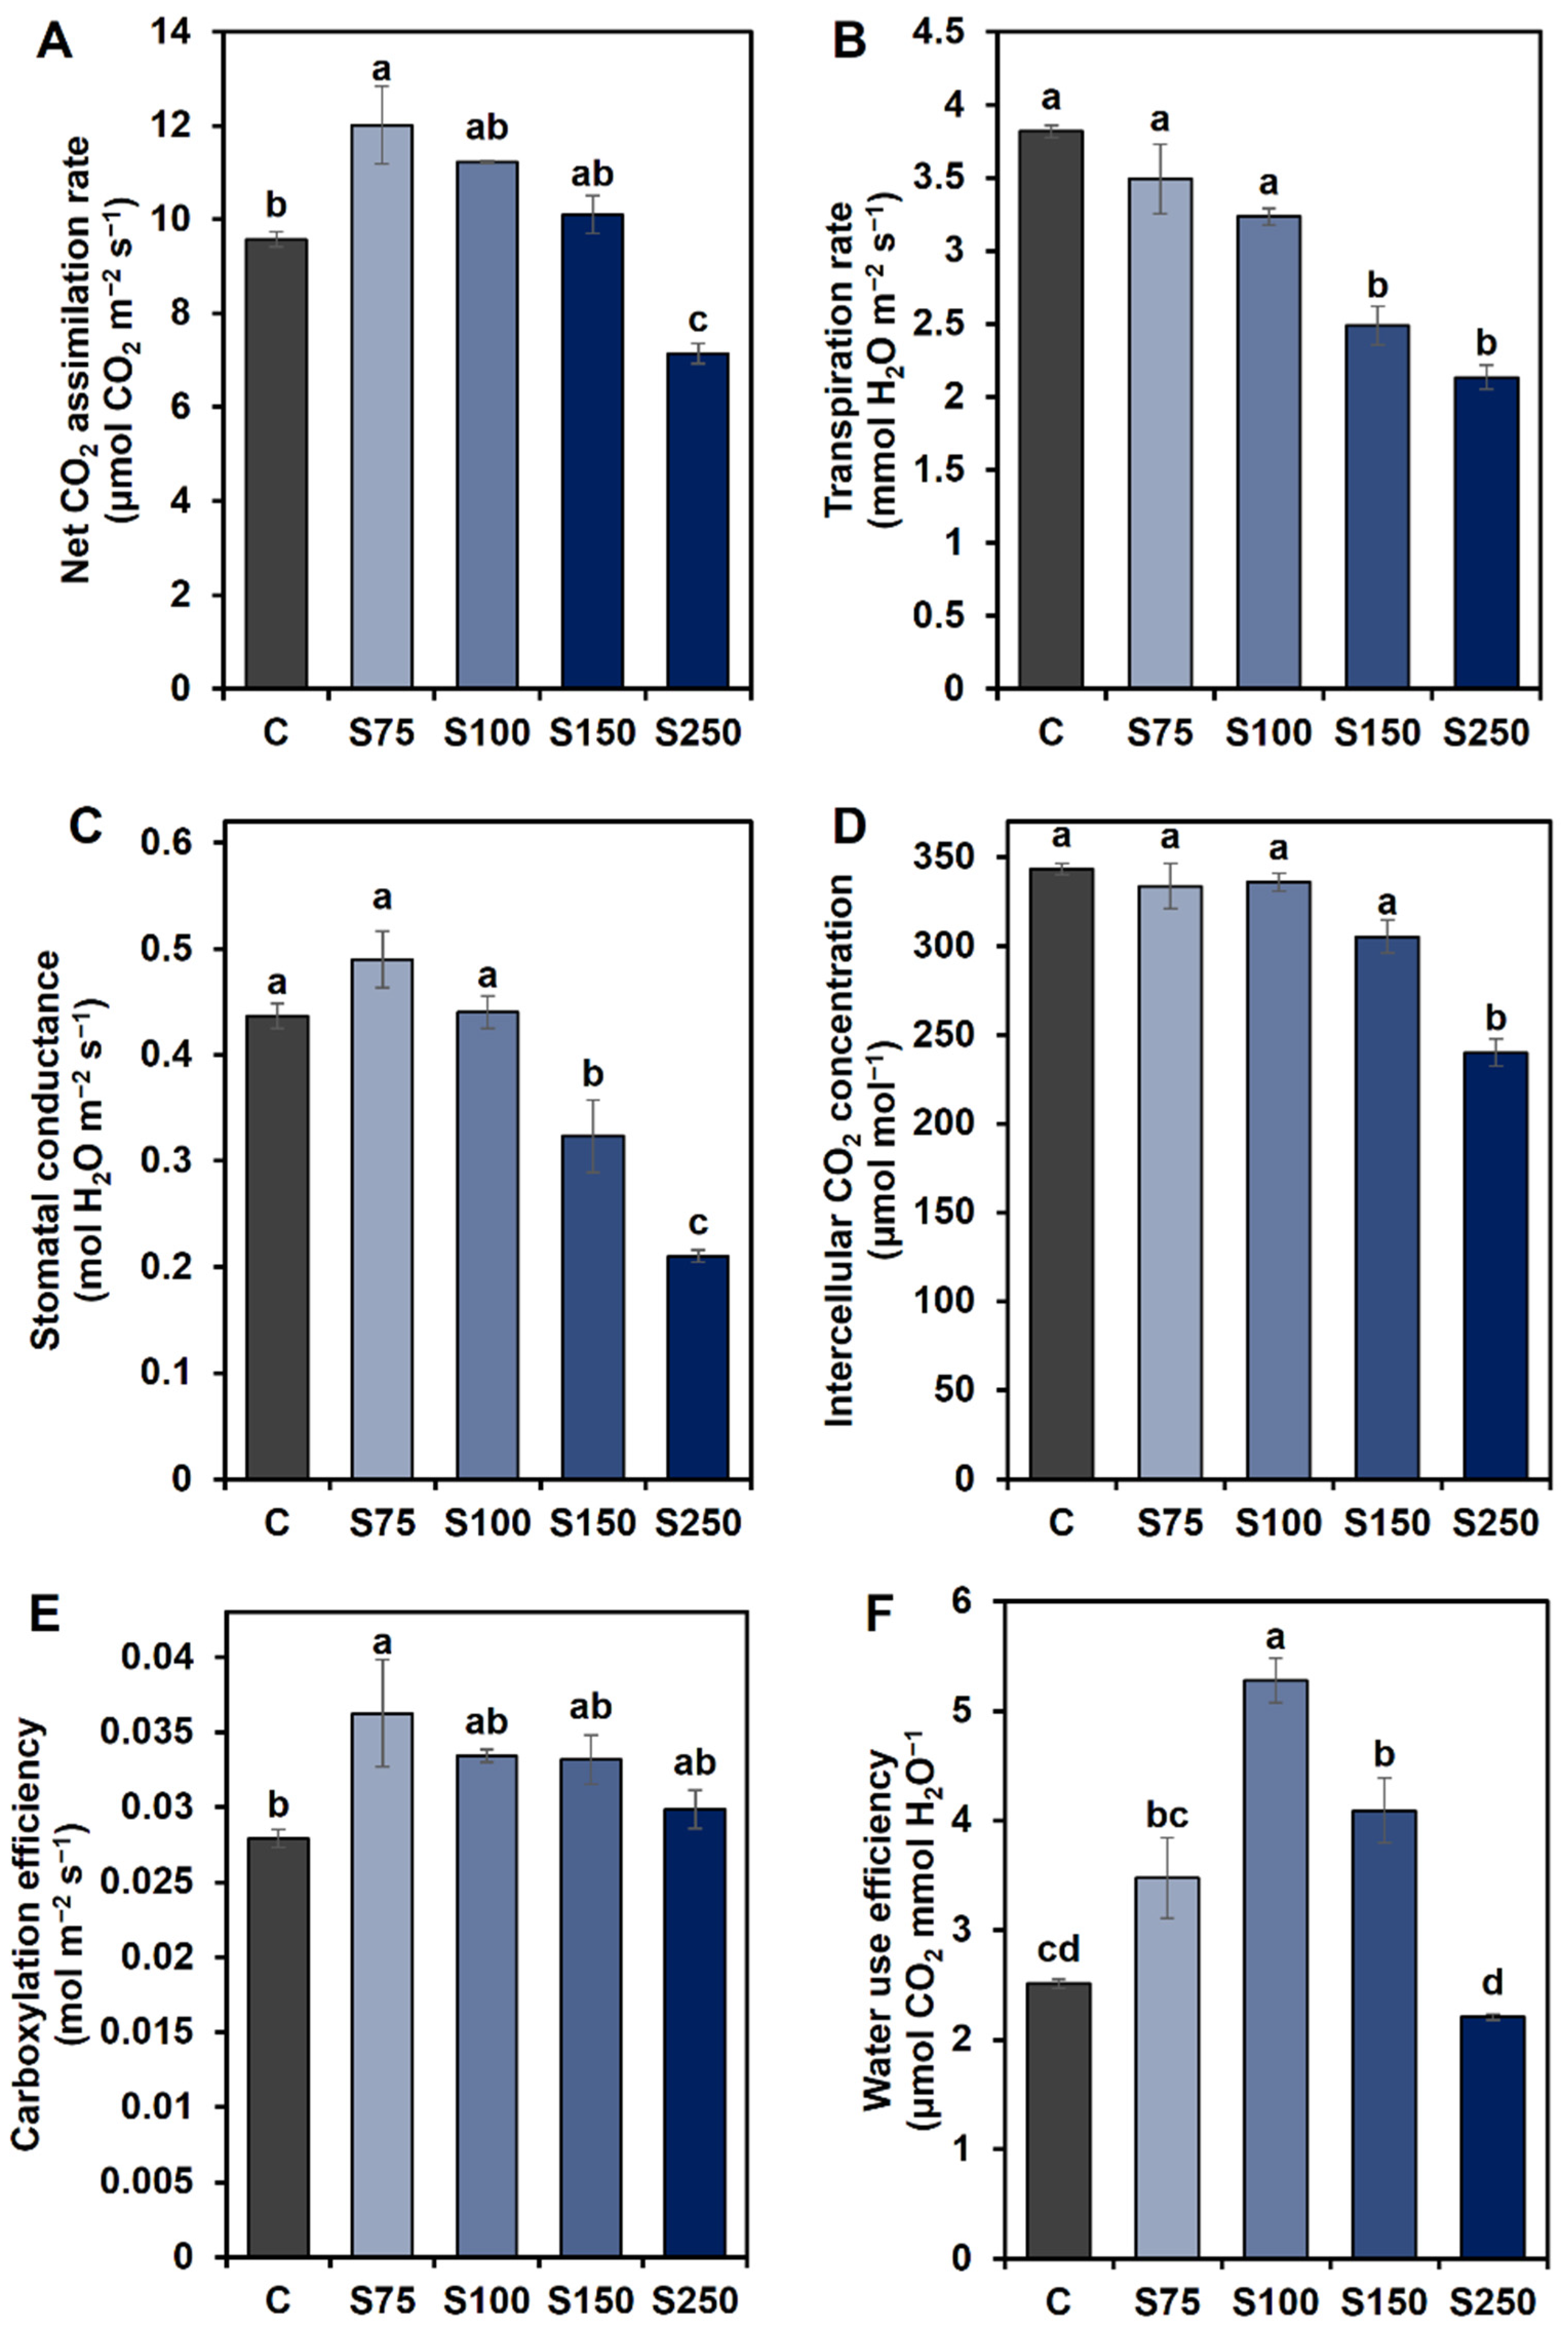
3.3. Effects of the Concentrations of Saline Water on Photosynthetic Attributes of Sugar Beet Plants

The effects of several concentrations of saline water imposition on photosynthesis and gas exchange related attributes of sugar beet plants were evaluated by measuring net CO2 assimilation rate (A), transpiration rate (E), stomatal conductance (Gs), intercellular CO2 concentration (Ci), instantaneous carboxylation efficiency (A/Ci), and water use efficiency (WUE) (Figure 2). Net CO2 assimilation rate (A) significantly increased by 25.49% under 75 mM saline water treatment but decreased notably by 25.33% at 250 mM saline water treatment and displayed no significant change under 100 mM and 150 mM saline water treatments (Figure 2A). Transpiration rate (E) exhibited no significant change when subjected to 75 mM and 100 mM saline water but decreased gradually by 34.91% and 44.09% under 150 mM and 250 mM salt stress conditions, respectively (Figure 2B). Similarly, Gs and Ci declined by 50.0% and 30.09%, respectively, at 250 mM salt stress, whereas it showed no significant changes under 75 mM, 100 mM, and 150 mM salt stress in comparison with that of control sugar beet plant (Figure 2C,D).
A/Ci was increased by 29.75% at 75mM saline water treatment while WUE was increased by 38.50%, 110.32%, and 63.01% subjected to 75 mM, 100 mM, and 150 mM saline water treatments, respectively (Figure 2E,F).

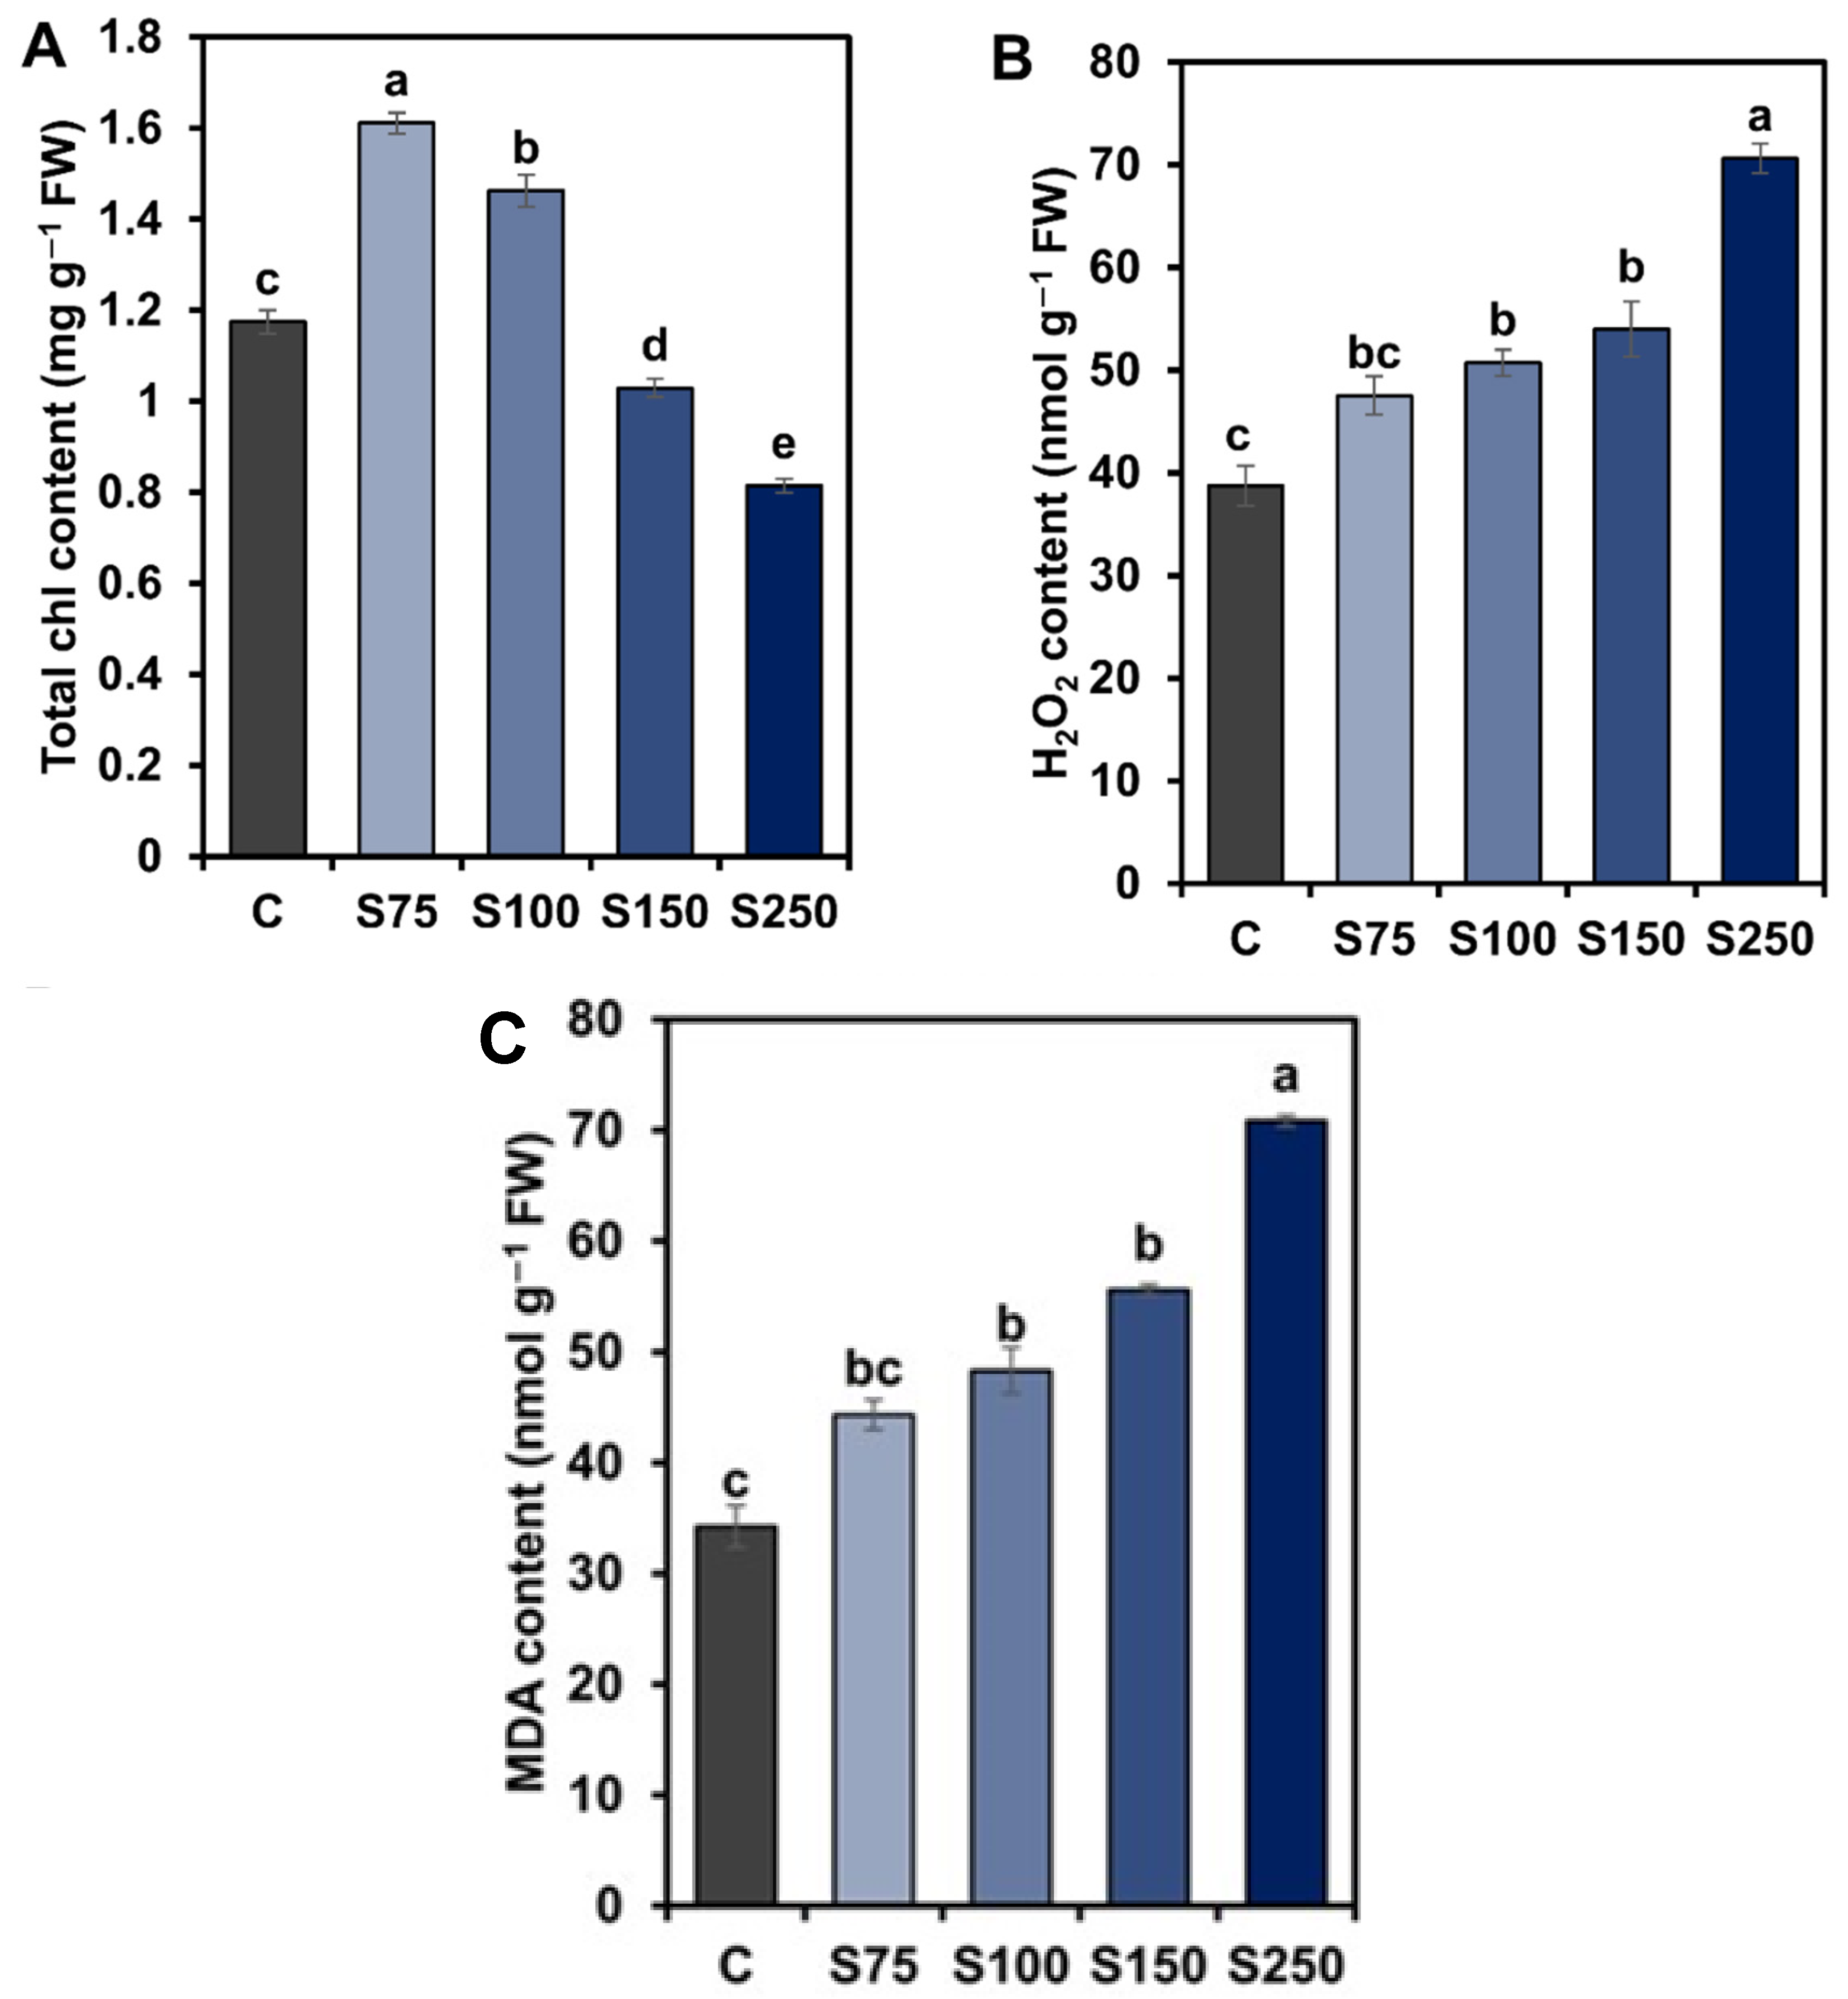
3.4. Alteration of Leaf Total Chl Content, H2O2, and MDA Content by Salt Stress

The impacts of long-term salinity on photosynthetic pigments, cell membrane integrity, and salinity-induced oxidative stress was evaluated by measuring the levels of total Chl content, H2O2 content, and MDA content in the leaves of sugar beet (Figure 3). The total Chl content exhibited a significant elevation by 37.61% and 24.79% at 75 mM and 100 mM saline water treatments, respectively, whereas it markedly declined by 12.05% and 30.77% under 150 mM and 250 mM saline water treatment, respectively (Figure 3A). The content of H2O2 also remarkably increased by 30.86%, 39.33%, and 82.27% following the treatments of 100 mM, 150 mM, and 250 mM saline water, respectively, whereas it displayed non-significant increase under 75 mM salt stress (Figure 3B). Similarly, the MDA content showed a significant elevation by 41.12%, 62.19%, and 106.80% at 100 mM, 150 mM, and 250 mM saline water treatment, respectively, over water control. In contrast, under 75 mM saline water treatment, a non-significant change of MDA was observed compared to control sugar beet plants (Figure 3C).

3.5. Differential Effect of Salt Concentrations on Enzymatic and Non-Enzymatic Antioxidants

We measured the activity of enzymatic antioxidants (CAT, APX, and POX) and the content of non-enzymatic antioxidant (ascorbate) to understand the adaptive salt mechanisms of sugar beet plant (Figure 4). Ascorbate content significantly decreased by 23.44%, 28.74%, 25.45%, and 22.83% under 75 mM, 100 mM, 150 mM, and 250 mM salt stress, respectively (Figure 4A). However, the CAT activity was significantly increased by 200.0%, 213.21%, 220.75%, and 245.28% at 75 mM, 100 mM, 150 mM, and 250 mM saline water treatments, respectively (Figure 4B). A similar trend of an increase was also displayed in POX by 96.89%, 128.68%, 136.43% and 147.29% in response to 75 mM, 100 mM, 150 mM, and 250 mM saline water treatments, respectively (Figure 4C). Unlike the trend of CAT and POX, the activity of APX was enhanced by 46.54% and 34.15% at 75 mM and 100 mM saline water treatment, respectively, while showing no significant change at 150 mM and 250 mM saline treatments, respectively (Figure 4D).

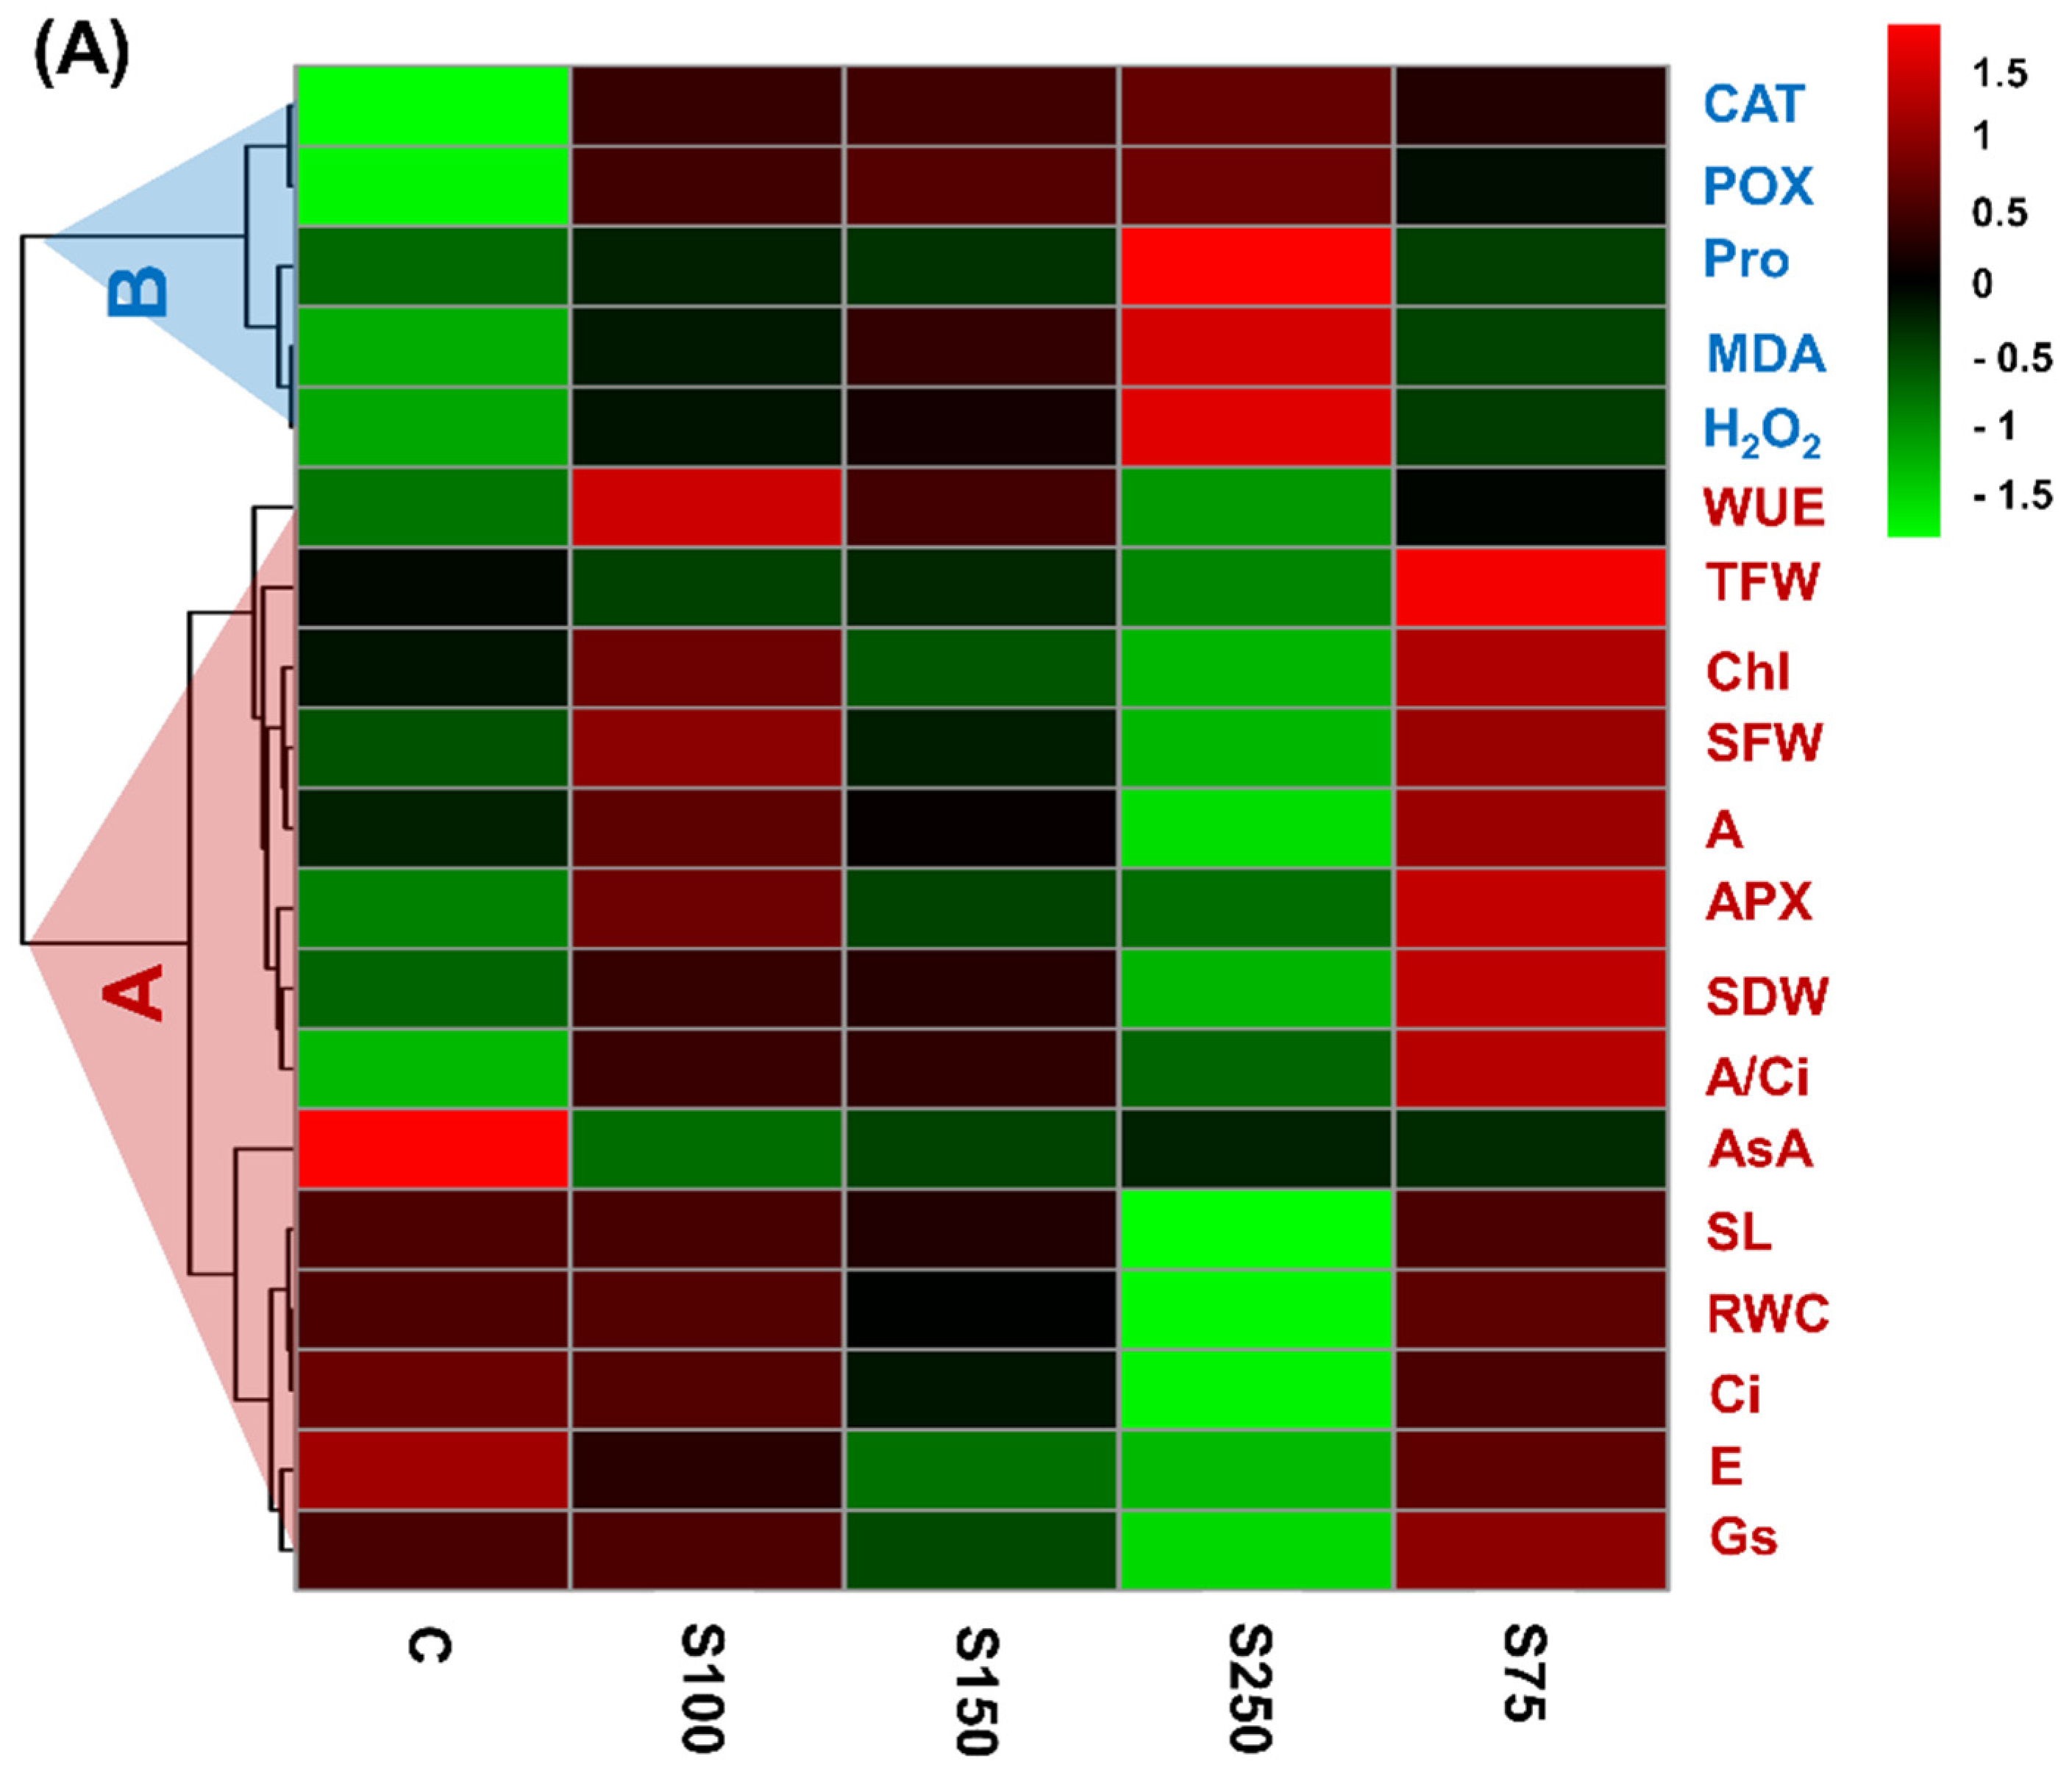
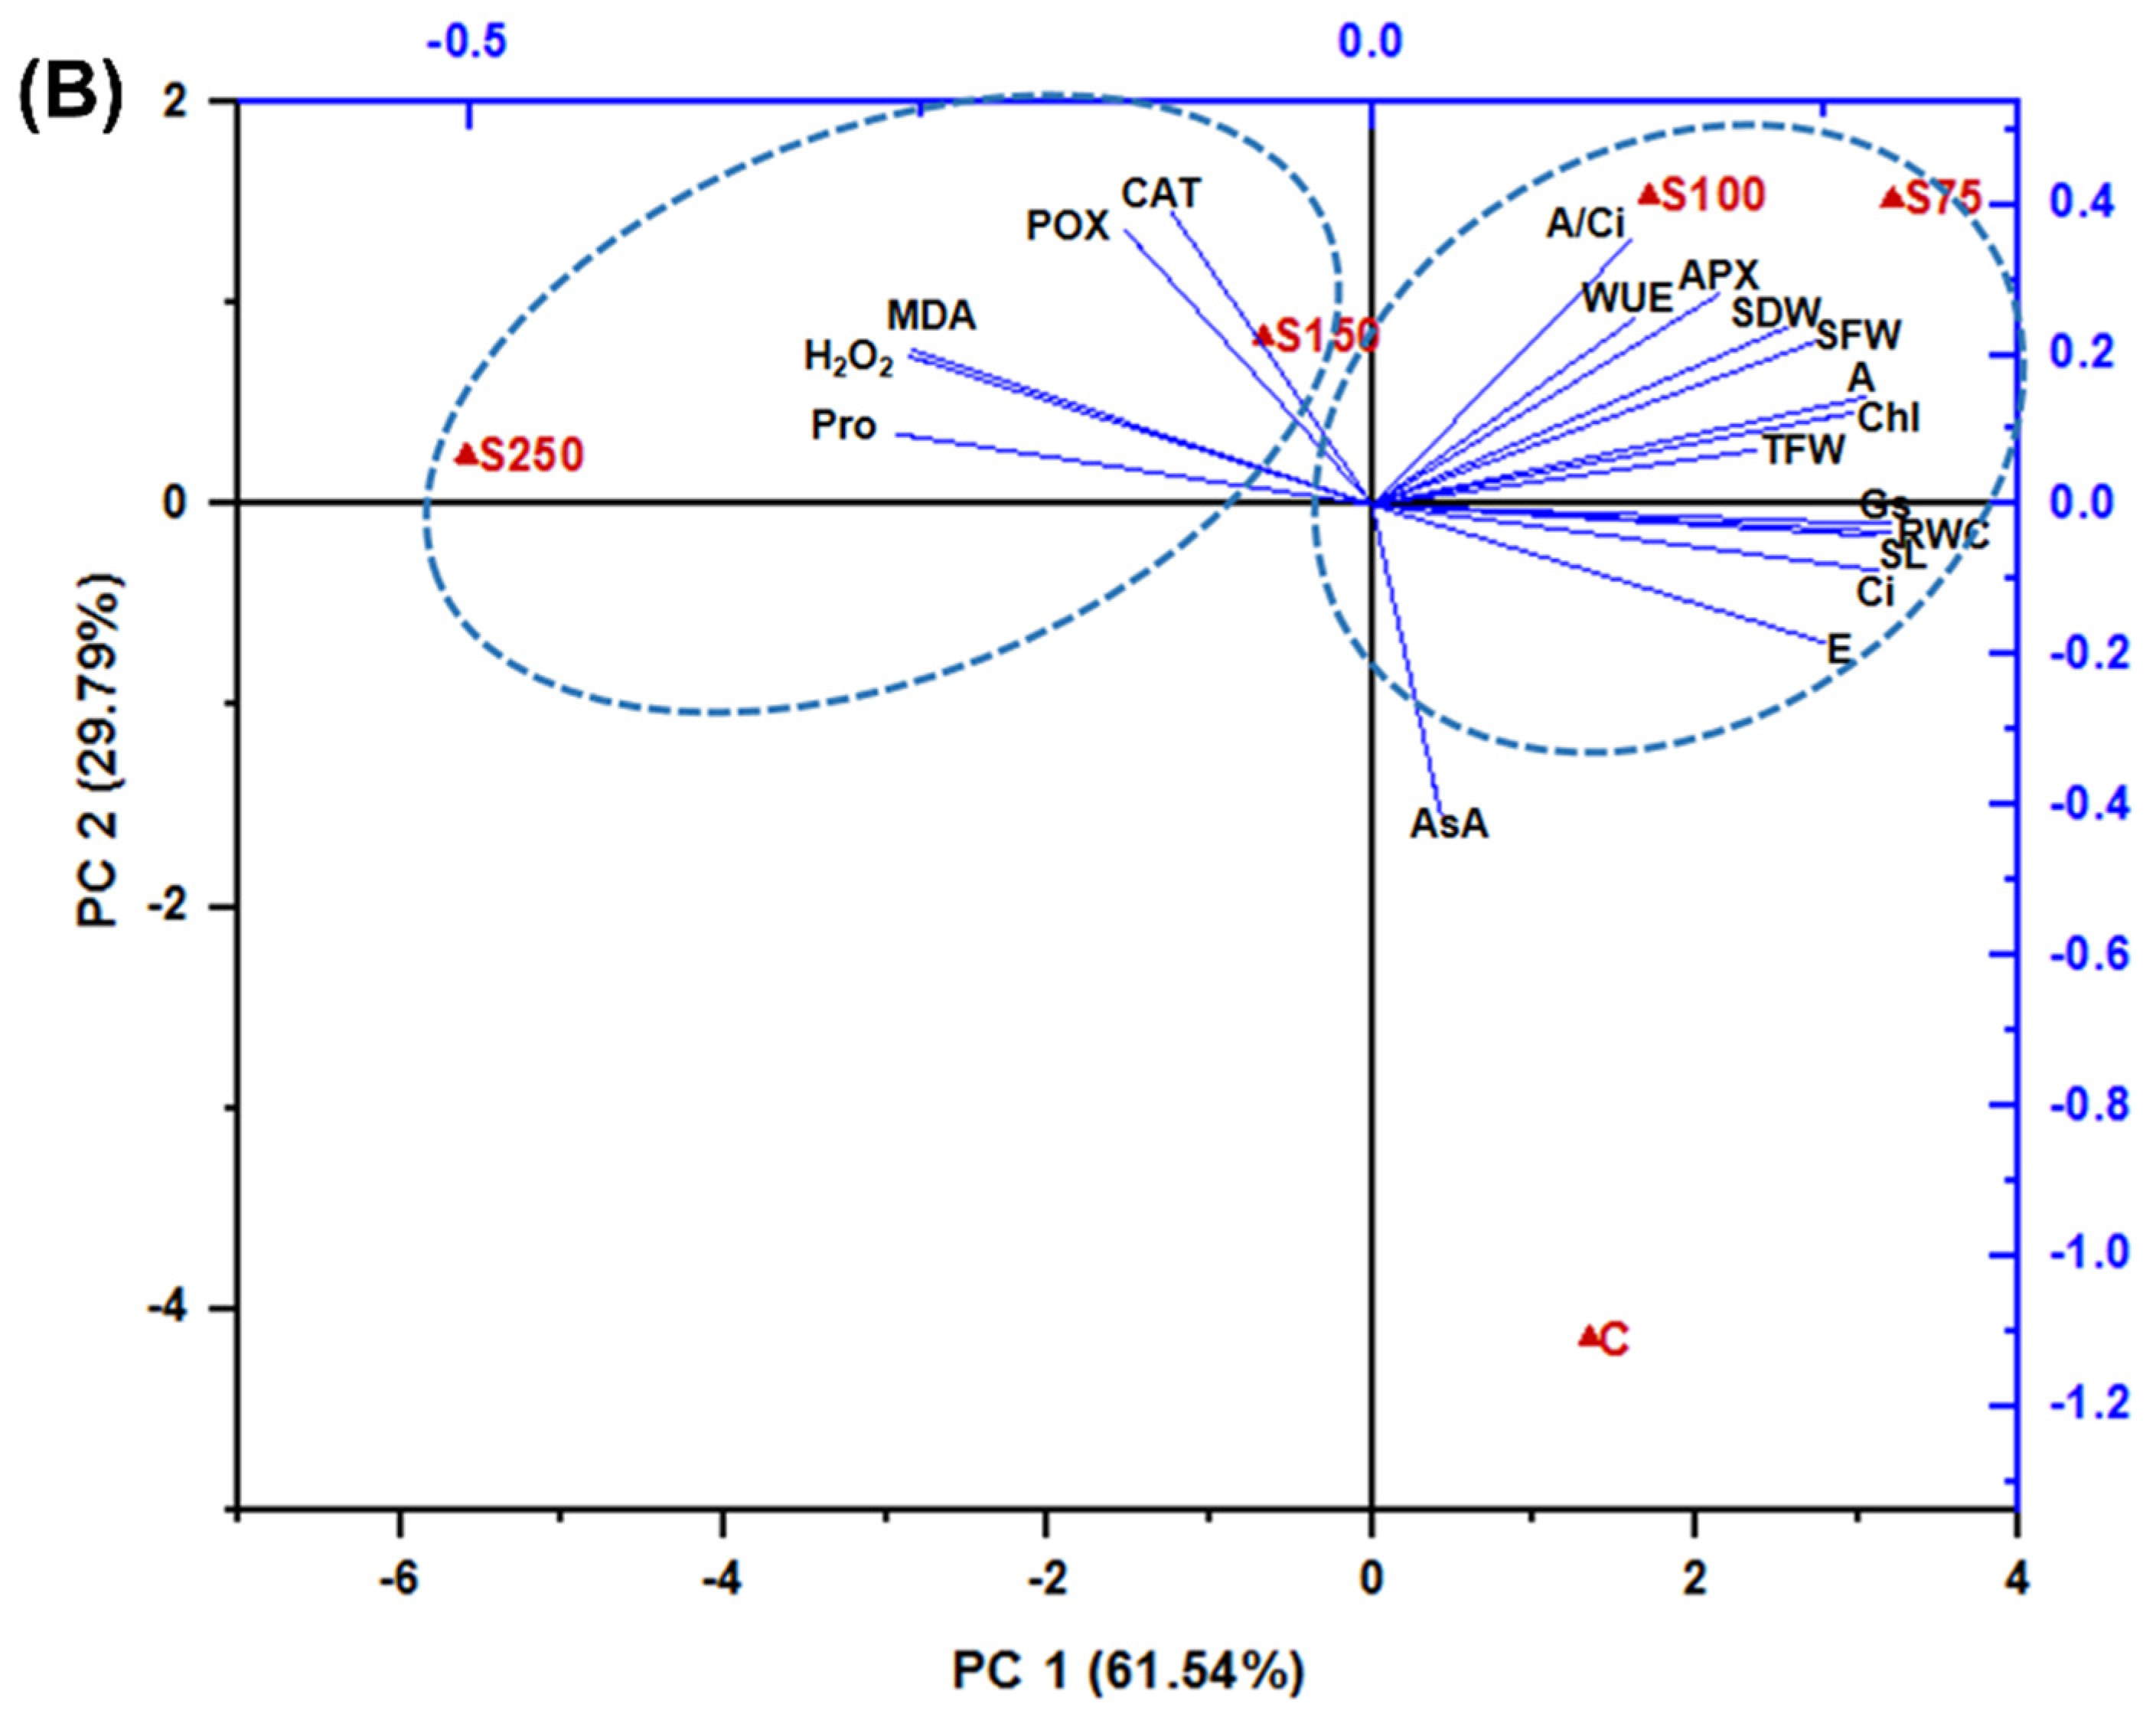
3.6. Hierarchical Clustering, Heatmap, and PCA Analysis Unveiled the Connections between Variables and Treatments

Consequently, the values of all the morpho-physiological and biochemical parameters of different salt concentrations were employed to construct the heatmap, hierarchical clustering as well as PCA. Hierarchical clustering grouped all the variables into two clusters (cluster-A and cluster-B) (Figure 5A). Hierarchical clustering and heatmap revealed that cluster-A was characterized by some biochemical parameters, such as CAT, POX, Pro (proline), H2O2, and MDA. All the variables of cluster-A showed minimal values at the control condition, whereas the increase of salinity triggered elevated trends. On the other hand, cluster-B represents all morphological (SL, RWC, SFW, SDW, and TFW) and photosynthetic attributes (A, E, Gs, Ci, A/Ci, and WUE) and some biochemical parameters including Chl, ascorbate, and APX. Compared to non-saline treatment, all the variables of cluster-A showed a rising trend when treated with 75 mM and 100 mM saline water, but exhibited a decreasing trend while treated with 150 mM and 250 mM saline water. Interestingly, the maximum values of almost all parameters (with the exception of ascorbate content) of cluster-B were observed in 75 mM saline water (S75) treatment and lowest at 250 mM saline water (S250) treatment. The PCA analysis was subsequently undertaken to uncover the connection of the different parameters with different treatment groups (Figure 5B). The two elements of PCA (PC1 and PC2) together described 91.33% of data variability. The results demonstrated an intimate association of cluster-A variables with 75 mM saline water (S75) and 100 mM saline water (S100) treatments, whereas cluster-B variables were interlinked with treatments 150 mM saline water (S150) and 250 mM saline water (S250). There was no close interrelation between the non-saline treatment and other parameters.

4. Discussion

In the present study, we have examined the response of sugar beet var. HI-0473 to different concentrations of long-term soil salinity stress. In this connection, we evaluated plant growth, yield, i.e., tuber production, photosynthesis, gas exchange attributes, ROS accumulation, and detoxification mechanisms. Altogether, our findings suggest the moderate salt-tolerance nature of sugar beet var. HI-0473.
Growth inhibition of most of the plant species under salinity is a common physiological response. Some glycophyte and almost all halophyte plants usually exhibit stimulated rather than restrained growth and biomass production under lower levels of salinity treatments. Yet higher salt concentration inhibits the growth and development of these plants [9,20,61,62,63,64]. Thus, a comprehensive evaluation of salinity-induced growth retardation of sugar beet var. HI-0473 would reveal a reliable rating of its relative grade of salt tolerance and the possibility of its cultivation in saline-prone areas.
As demonstrated in our experiment, 75 mM and 100 mM NaCl treatment, in general, had no significant inhibitory effect on sugar beet var. HI-0473’s growth parameters and yield, which is reflected in SL, SFW, SDW, and TFW (Table 1). Moreover, 150 mM NaCl did not show distinct growth inhibition of sugar beet. In contrast, 250 mM salt stress retarded the growth parameters and displayed marked inhibitory symptoms in all the growth parameters (Table 1). These findings made us speculate that low saline-induced growth improvement might be attributed to the stimulation of several physiological attributes, including better photosynthetic capacity (Figure 2), elevation of photosynthetic pigment (Figure 3A), and stable water uptake (Figure 1B), whereas a high saline concentration disturbed these attributes (Figure 1B, Figure 2 and Figure 3A). The outcomes of this experiment are in accord with the previous reports in sugar beet [44,65], Vicia faba [66], Elaeagnus angustifolia [21], Phragmites karka [67], and Spartina maritime [68] where it was found that the imposition of low concentrations saline water led to enhanced growth parameters in plants, whereas higher concentrations caused significant inhibition. Mild saline water can pose favorable effects on the growth of some plants due to the osmotic function of Na+ and it has been considered as a functional nutrient for some plant species, such as radish, rape, sugar beet, red beet, wheat (Triticum aestivum), and Zygophyllum xanthoxylum, etc. [63,69,70].
Environmental constraints trigger cellular dehydration which prompts the accumulation of several osmolytes [22,71]. Proline, a low molecular weight and high water-soluble osmotic adjusting substance, accumulates in the plant and performs a crucial function in the osmotic balance of plant cells under stress conditions [22,72]. In the present study, the RWC of sugar beet plant showed no significant change under 75 and 100 mM salt stress. As a result, a non-significant change in proline content displayed in these concentrations indicated that mild saline water is not inhibitory for sugar beet plants (Figure 1). Maintaining an optimal amount of water in the plant helps to maintain the succulence of leaf that facilitates the plants to avoid saline toxicity [63]. But, under 250 mM salt stress, the RWC of sugar beet plants significantly dropped (Figure 1B) which might trigger by a sharp accumulation of proline content (Figure 1A) which inhibited the growth of sugar beet (Table 1). Similar enhancement of proline under decreased RWC was found in Elaeagnus angustifolia [21], Achras sapota [73], and rice (Oryza sativa) [74].
In plants, ROS generates in the process of photorespiration and β-oxidation of fatty acids which is considered as a normal metabolic phenomenon. On the contrary, extreme salinity triggers the production of a lethal amount of ROS which can affect the structural integrity of the plasma membrane, functions of enzymes, and the CO2 assimilation apparatus of plants [23,24,64,75,76]. Plant cells possess an array of enzymatic and non-enzymatic antioxidants that protects plant cells from the adverse effects of excessive ROS by scavenging it in different steps [77]. In addition, there have been a plethora of reports of increased activity of antioxidant enzymes under saline conditions in different plants [33,54,78,79,80]. CAT, APX, and POX are responsible for the neutralization of excess H2O2 [77]. In our experiment, CAT and POX activity increased with the increasing concentration of saline water. On the other hand, APX activity increased only under 75 mM and 100 mM saline water but decreased under 150 and 250 mM salt stress (Figure 4). Our data also showed that the H2O2 content of leaves was enhanced markedly with the increasing concentration of salt (Figure 3B). Then, in terms of tolerance, each concentration showed a differential response pattern. We infer that coordinated action of CAT, APX, and POX might be responsible for tolerance against 75 mM and 150 mM saline water treated plants and showed lesser accumulation of H2O2 compared to 150 mM and 250 mM saltwater. On the other hand, dyssynchronous action of CAT, APX, and POX might be responsible for the highest accumulation of H2O2 in plants and displayed the least tolerance against 150 mM and 250 mM saline water treatments (Figure 4B-D). Similar enhancement of CAT, APX, and POX was found in olive tree (Olea europaea) [81], soybean (Glycine max) [82], Oryza sativa [83], sugar beet [84] and maize (Zea mays) [6] under different concentration of salt stress. Thus, high concentrated salinity inhibits sugar beet var. HI-0473 growth and physiological processes.
Although the growth and yield of crops are regulated by several physiological, biochemical, and molecular processes, photosynthesis is a vital one. Salt stress usually hampers plant growth and productivity by disturbing the physiological processes of plants, especially photosynthesis [17,85]. Disturbance in photosynthesis is partly related to the reduced Chl content [52,86]. Although salinity lessens the chlorophyll pigment, the level of the reduction relies on the salt tolerance capacity of plant species. In our present study, total Chl content of sugar beet plants was significantly increased under 75 mM and 100 mM saline water but showed marked decreased under 150 mM and 250 mM saline water treatment demonstrating that photosynthesis in sugar beet plant was improved under low salinity then declined under high salinity as reflected in the sugar beet’s growth, biomass, and yield (Table 1). This finding was supported by the studies on several plants [73,87,88,89,90,91]. These results led us to speculate that sugar beet plants still retain some halophytic nature of its ancestor see beet [41] and displayed a tolerance mechanism against low and moderate salinity [92]. The lower salt stress-induced increase in Chl content might be complemented because of the increased number of chloroplasts in the leaves of salt-exposed plants [93], whereas the higher salt stress reduced Chl by higher ROS-induced pigment degradation (Figure 3A).
Regulation of photosynthetic capacity under various biotic and abiotic stress conditions is vital for a plant’s survival [17], and plants implement this strategy by regulating several gas exchange attributes, including stomatal conductance (Gs), transpiration rate (E), and intercellular CO2 concentration (Ci) [92,94]. In the current study, 75 and 100 mM salt stress displayed no deleterious effect on E, Gs, and Ci which collectively participated to the balanced CO2 assimilation rate (A), whereas 150 and 250 mM salt stress showed the inverse result on E, Gs, and Ci and compromised A (Figure 2A–D). Similar results were found in the different concentrations of saline affected plants [87,89,95]. At low to moderate salt stress (75 and 100 mM), sugar beet plants might activate specific mechanisms for salt avoidance either to reduce the entry of Na+ ions into the cell or decreased the concentrations of Na+ in the cytoplasm by sequestering the ions into the vacuoles [62,63] which might help plant to protect its photosynthetic components. Importantly, slightly increased Na+ concentration in 75 and 100 mM salt treatment in our experiment, increased the net CO2 assimilation rate (A) which might be because of higher chlorophyll content in sugar beet leaves (Figure 2A and Figure 3A) which ensure more photon harvesting. A similar result was also reported on Alhagi pseudoalhagi [96]. On the other hand, a high concentration of salts (150 and 250 mM) might increase the hydraulic root resistance [92] which, in turn, decreased the RWC (Figure 1B). A similar finding was reported in Triticum aestivum [10]. Thus, to avoid the loss of this minimal water, sugar beet plants might close its stomata which decreased the stomatal conductance along with intracellular CO2 concentration that leads to the marked decline in net CO2 assimilation rate (A) (Figure 2A,C). These salt-induced negative effects were reflected in the growth and yield of sugar beet (Table 1).
The differential results in WUE (A/E) and carboxylation efficiency (A/Ci) were observed in the current experiment (Figure 2E,F). This increase in WUE under moderate salt concentrations indicates that sugar beet plants might utilize the water efficiently, which contributes to elevating the yield. Alternatively, high saline water decreased the WUE (Figure 2F), which might be a factor for the compromised growth and yield of sugar beet plants (Table 1). Reports show that high salt stress accumulates ABA (abscisic acid) in various plants [97], such as Arabidopsis [98] and maize [99]. Thus we speculate, sugar beet plants may accumulate ABA which induces stomatal closure and leads to lower Gs and E under osmotic stress conditions [100,101]. Lower transpiration rate leads to a compromised value of WUE [102]. In addition, a low and moderate concentration of salts showed no significant effect on carboxylation efficiency. But the carboxylation efficiency was severely reduced in sugar beet under high saline treatments due to the lowered amount of CO2 assimilation rate (A) (Figure 2A,E).
Under various abiotic stresses, ROS level elevates in the plant tissues due to the anomalies in the electron transport chain and accretion of photo reducing power. This excess of electrochemical energy can be dissipated through the Mehler reaction, resulting in ROS generation, including H2O2, and injure cell membranes, reflected in elevated MDA levels [23,103,104]. In the current experiment, H2O2 and MDA content increased gradually in a concentration-dependent manner where 75 mM salt stress showed a non-significant increase which is reflected in the growth performance of sugar beet (Table 1). A similar increase in H2O2 and MDA was also observed in other plants [75,84,105]. This elevation of H2O2 and MDA occurrence might be due to the impairment of photosynthesis, insufficient activity of enzymatic antioxidant, and declination of non-enzymatic antioxidant, ascorbate (Figure 4A).
Finally, to validate the concentration-dependent effect of NaCl, the whole dataset was analyzed using a PCA-based clustering method (Figure 5B). The effects of 75 mM and 100 mM salinity were intensely and positively correlated with growth, yield, and photosynthetic attributes, whereas under higher salinity (150 mM and 250 mM NaCl) conditions, the effects were much closer with enzymatic antioxidant activities and ROS accumulation. These findings clearly suggest that lower salinity concentrations do not disturb the growth and photosynthetic attributes and trigger to a higher yield of sugar beet. In contrast, these correlations vanish at higher salt concentrations and lead to growth retardation due to excess ROS accumulation which ultimately results in yield loss.

5. Conclusions

In summary, our results revealed that sugar beet can thrive at low to moderate (75–100 mM NaCl) salinity in soil culture test which was evidenced by the close association of these treatments with growth, yield, water relation, and photosynthetic parameters in the PCA. Most importantly, low (75 mM NaCl) soil salinity improved the photosynthesis and yield of sugar beet in this pot experiment. Although the yield of sugar beet was not impeded by 150 mM NaCl stress, the RWC, gas exchange parameters, and Chl content were slightly hampered by this salt concentration. Therefore, we recommended 100 mM NaCl stress as the threshold level of salinity tolerance of sugar beet based on our soil–pot culture experiment. Altogether these results suggest that sugar beet might possess salt tolerance attributes. Therefore, it can be a promising crop for cultivation in the saline prone large coastal regions in Bangladesh. The adapted salt tolerance mechanisms of sugar beet could be attributed to (i) the abundance of relative water content which increased the succulence of the sugar beet, (ii) elevated photosynthetic pigment, such as chlorophyll content, (iii) balanced osmolyte content, such as proline, (iv) increased the net CO2 assimilation rate, stomatal conductance, carboxylation efficiency, and water use efficiency which contributed to better carbon and mineral management and, (v) increased antioxidant enzyme, such as CAT, APX, and POX, activity, which detoxifies excess ROS. It is also revealed that excessive salinity can inhibit the growth, biomass, and yield of sugar beet. However, further investigations of salinity-adaptive mechanisms of sugar beet at the genetic and molecular levels are crucial to discover the exact potential of this crop for cultivation in salt-affected areas in the coastal belt.

Author Contributions

Conceptualization, M.T.-U.-A.; Formal Analysis, A.A.M.S., S.A., T.A., M.A.S.P. and A.S.U.M.; Investigation, M.T.-U.-A.; Resources, M.A.T.S.; Writing–Original Draft Preparation, A.A.M.S., M.T.-U.-A., K.K.B. and M.T.H. Writing–Review and Editing, M.B. and Y.M.; Funding Acquisition, M.B.

Funding

The research was funded by project APVV-15-0721 and NutRisk Centre No. CZ.02.1.01/0.0/0.0/16_019/0000845.

Acknowledgments

We are grateful to M. Afzal Hossain, Department of Biochemistry and Molecular Biology, Bangladesh Agricultural University, for his valuable suggestions throughout the research works. We acknowledged the support of Muzahidul Islam to help us to determine the photosynthesis-related parameters. We also acknowledged the help of Shariful Islam throughout the experiment.

Conflicts of Interest

The authors declare no conflict of interest.

References

  1. IPCC (Intergovernmental Panel on Climate Change). Climate Change 2014: Synthesis Report, in Contribution of Working Groups I, II and III to the Fifth Assessment Report of the Intergovernmental Panel on Climate Change; Pachauri, R.K., Meyer, L.A., Eds.; IPCC: Geneva, Switzerland, 2014. [Google Scholar]
  2. Nachshon, U. Cropland soil salinization and associated hydrology: Trends, processes and examples. Water. 2018, 10, 1030. [Google Scholar]
  3. Machado, R.; Serralheiro, R. Soil salinity: Effect on vegetable crop growth. Management practices to prevent and mitigate soil salinization. Horticulturae 2017, 3, 30. [Google Scholar] [CrossRef]
  4. United Nations Development of Economic and Social Affairs (UNDESA). 2013. Available online: http://www.un.org/en/development/desa/news/population/un-report-world-population-projected-to-reach-9-6-billion-by-2050.html (accessed on 13 February 2019).
  5. Flowers, T.J.; Galal, H.K.; Bromham, L. Evolution of halophytes: Multiple origins of salt tolerance in land plants. Funct. Plant. Biol. 2010, 37, 604–612. [Google Scholar] [CrossRef]
  6. AbdElgawad, H.; Zinta, G.; Hegab, M.M.; Pandey, R.; Asard, H.; Abuelsoud, W. High salinity induces different oxidative stress and antioxidant responses in maize seedlings organs. Front. Plant. Sci. 2016, 7, 276. [Google Scholar] [CrossRef] [PubMed]
  7. Zörb, C.; Geilfus, C.M.; Dietz, K.J. Salinity and crop yield. Plant. Biol. 2019, 21, 31–38. [Google Scholar] [CrossRef]
  8. Alam, M.Z.; Carpenter-Boggs, L.; Mitra, S.; Haque, M.; Halsey, J.; Rokonuzzaman, M.; Saha, B.; Moniruzzaman, M. Effect of salinity intrusion on food crops, livestock, and fish species at Kalapara Coastal Belt in Bangladesh. J. Food Qual. 2017, 2017, 23. [Google Scholar] [CrossRef]
  9. Munns, R.; Tester, M. Mechanisms of salinity tolerance. Annu. Rev. Plant. Biol. 2008, 59, 651–681. [Google Scholar] [CrossRef]
  10. Sun, Z.W.; Ren, L.K.; Fan, J.W.; Li, Q.; Wang, K.J.; Guo, M.M.; Wang, L.; Li, J.; Zhang, G.X.; Yang, Z.Y.; et al. Salt response of photosynthetic electron transport system in wheat cultivars with contrasting tolerance. Plant. Soil Environ. 2016, 62, 515–521. [Google Scholar] [Green Version]
  11. Wei, D.; Zhang, W.; Wang, C.; Meng, Q.; Li, G.; Chen, T.H.; Yang, X. Genetic engineering of the biosynthesis of glycinebetaine leads to alleviate salt-induced potassium efflux and enhances salt tolerance in tomato plants. Plant. Sci. 2017, 257, 74–83. [Google Scholar] [CrossRef]
  12. Ahanger, M.A.; Tomar, N.S.; Tittal, M.; Argal, S.; Agarwal, R.M. Plant growth under water/salt stress: ROS production; antioxidants and significance of added potassium under such conditions. Physiol Mol. Biol. Plant. 2017, 23, 731–744. [Google Scholar] [CrossRef]
  13. Mbarki, S.; Sytar, O.; Cerda, A.; Zivcak, M.; Rastogi, A.; He, X.; Zoghlami, A.; Abdelly, C.; Brestic, M. Strategies to mitigate the salt stress effects on photosynthetic apparatus and productivity of crop plants. In Salinity Responses and Tolerance in Plants; Kumar, V., Wani, S.H., Suprasanna, P., Tran, L.S., Eds.; Springer: Cham, Switzerland, 2018; pp. 85–136. [Google Scholar]
  14. Li, J.; Ma, J.; Guo, H.; Zong, J.; Chen, J.; Wang, Y.; Li, D.; Li, L.; Wang, J.; Liu, J. Growth and physiological responses of two phenotypically distinct accessions of centipedegrass (Eremochloa ophiuroides (Munro) Hack.) to salt stress. Plant. Physiol. Biochem. 2018, 126, 1–10. [Google Scholar] [CrossRef] [PubMed]
  15. Alsaeedi, A.; El-Ramady, H.; Alshaal, T.; El-Garawany, M.; Elhawat, N.; Al-Otaibi, A. Silica nanoparticles boost growth and productivity of cucumber under water deficit and salinity stresses by balancing nutrients uptake. Plant. Physiol. Biochem. 2019, 139, 1–10. [Google Scholar] [CrossRef] [PubMed]
  16. Rasel, M.; Tahjib-Ul-Arif, M.; Hossain, M.A.; Sayed, M.A.; Hassan, L. Discerning of Rice Landraces (Oryza sativa L.) for Morpho-physiological, Antioxidant Enzyme Activity, and Molecular Markers’ Responses to Induced Salt Stress at the Seedling Stage. J. Plant. Growth Regul. 2019, 1–19. [Google Scholar] [CrossRef]
  17. Chaves, M.M.; Flexas, J.; Pinheiro, C. Photosynthesis under drought and salt stress: Regulation mechanisms from whole plant to cell. Ann. Bot. 2009, 103, 551–560. [Google Scholar] [CrossRef]
  18. Yan, K.; Shao, H.; Shao, C.; Chen, P.; Zhao, S.; Brestic, M.; Chen, X. Physiological adaptive mechanisms of plants grown in saline soil and implications for sustainable saline agriculture in coastal zone. Acta Physiol. Plant. 2013, 35, 2867–2878. [Google Scholar] [CrossRef]
  19. Uddin, M.N.; Hossain, M.A.; Burritt, D.J. Salinity and drought stress: Similarities and differences in oxidative responses and cellular redox regulation. In Water Stress and Crop Plants: A Sustainable Approach; Ahmad, P., Ed.; John Wiley & Sons: Singapore, 2016; pp. 86–101. [Google Scholar]
  20. Negrão, S.; Schmöckel, S.M.; Tester, M. Evaluating physiological responses of plants to salinity stress. Ann. Bot. 2017, 119, 1–11. [Google Scholar] [CrossRef]
  21. Liu, Z.; Zhu, J.; Yang, X.; Wu, H.; Wei, Q.; Wei, H.; Zhang, H. Growth performance, organ-level ionic relations and organic osmoregulation of Elaeagnus angustifolia in response to salt stress. PLoS ONE. 2018, 13, e0191552. [Google Scholar] [CrossRef]
  22. Suprasanna, P.; Nikalje, G.C.; Rai, A.N. Osmolyte accumulation and implications in plant abiotic stress tolerance. In Osmolytes and Plants Acclimation to Changing Environment: Emerging Omics Technologies; Iqbal, N., Nazar, R., Khan, N.A., Eds.; Springer: New Delhi, India, 2016; pp. 1–12. [Google Scholar]
  23. Choudhury, F.K.; Rivero, R.M.; Blumwald, E.; Mittler, R. Reactive oxygen species, abiotic stress and stress combination. Plant. J. 2017, 90, 856–867. [Google Scholar] [CrossRef]
  24. Waszczak, C.; Carmody, M.; Kangasjärvi, J. Reactive oxygen species in plant signaling. Annu. Rev. Plant. Biol. 2008, 69, 209–236. [Google Scholar] [CrossRef]
  25. Hossain, M.A.; Bhattacharjee, S.; Armin, S.M.; Qian, P.; Xin, W.; Li, H.Y.; Burritt, D.J.; Fujita, M.; Tran, L.S. Hydrogen peroxide priming modulates abiotic oxidative stress tolerance: Insights from ROS detoxification and scavenging. Front. Plant. Sci. 2015, 6, 420. [Google Scholar] [CrossRef]
  26. Allakhverdiev, S.I.; Murata, N. Environmental stress inhibits the synthesis de novo of proteins involved in the photodamage–repair cycle of photosystem II in Synechocystis sp. PCC 6803. BBA-Bioenergetics 2004, 1657, 23–32. [Google Scholar] [CrossRef] [PubMed]
  27. Møller, I.M.; Sweetlove, L.J. ROS signaling-specificity is required. Trends Plant. Sci. 2010, 15, 370–374. [Google Scholar] [CrossRef] [PubMed]
  28. Hu, L.; Zhou, K.; Li, Y.; Chen, X.; Liu, B.; Li, C.; Gong, X.; Ma, F. Exogenous myo-inositol alleviates salinity-induced stress in Malus hupehensis Rehd. Plant Physiol. Bioch. 2018, 133, 116–126. [Google Scholar] [CrossRef] [PubMed]
  29. Sun, Y.; Sun, P.; Wang, C.; Liao, J.; Ni, J.; Zhang, T.; Wang, R.; Ruan, H. Growth, physiological function, and antioxidant defense system responses of Lemna minor L. to decabromodiphenyl ether (BDE-209) induced phytotoxicity. Plant. Physiol. Bioch. 2019, 139, 113–120. [Google Scholar] [CrossRef]
  30. Gill, S.S.; Tuteja, N. Reactive oxygen species and antioxidant machinery in abiotic stress tolerance in crop plants. Plant. Physiol. Bioch. 2010, 48, 909–930. [Google Scholar] [CrossRef]
  31. Agarwal, P.K.; Shukla, P.S.; Gupta, K.; Jha, B. Bioengineering for salinity tolerance in plants: State of the art. Mol. Biotechnol. 2013, 54, 102–123. [Google Scholar] [CrossRef]
  32. Das, K.; Roychoudhury, A. Reactive oxygen species (ROS) and response of antioxidants as ROS-scavengers during environmental stress in plants. Front. Environ. Sci. 2014, 2, 53. [Google Scholar] [CrossRef]
  33. Gupta, D.K.; Palma, J.M.; Corpas, F.J. Antioxidants and Antioxidant Enzymes in Higher Plants Gupta; Springer: Cham, Switzerland, 2018. [Google Scholar]
  34. Wang, H.; Chen, Y.; Hu, W.; Snider, J.L.; Zhou, Z. Short-term soil-waterlogging contributes to cotton cross tolerance to chronic elevated temperature by regulating ROS metabolism in the subtending leaf. Plant. Physiol. Bioch. 2019, 139, 333–341. [Google Scholar] [CrossRef]
  35. Gao, S.; Yan, R.; Cao, M.; Yang, W.; Wang, S.; Chen, F. Effects of copper on growth, antioxidant enzymes and phenylalanine ammonia-lyase activities in Jatropha curcas L. seedling. Plant. Soil Environ. 2008, 54, 117–122. [Google Scholar] [CrossRef]
  36. Mittova, V.; Guy, M.; Tal, M.; Volokita, M. Response of the cultivated tomato and its wild salt-tolerant relative Lycopersicon pennellii to salt-dependent oxidative stress: Increased activities of antioxidant enzymes in root plastids. Free Radic. Res. 2002, 36, 195–202. [Google Scholar] [CrossRef]
  37. Chaparzadeh, N.; D’Amico, M.L.; Khavari-Nejad, R.A.; Izzo, R.; Navari-Izzo, F. Antioxidative responses of Calendula officinalis under salinity conditions. Plant. Physiol. Bioch. 2004, 42, 695–701. [Google Scholar] [CrossRef] [PubMed]
  38. Brar, N.S.; Dhillon, B.S.; Saini, K.S.; Sharma, P.K. Agronomy of sugarbeet cultivation-A review. Agricul. Rev. 2015, 36, 184–197. [Google Scholar] [CrossRef]
  39. Sidra, M.; Mubbashira, N.; Zaman, S.B.; Waqas, F. Potential of sugar beet production in Pakistan: A review. Pak. J. Agric. Res. 2016, 29, 202–211. [Google Scholar]
  40. Feizi, M.; Fallahzade, J.; Noorshargh, P. Sugar beet yield response to different levels of saline irrigation water and leaching in an arid region. J. Plant. Nutr. 2018, 41, 654–663. [Google Scholar] [CrossRef]
  41. Biancardi, E.; Panella, L.W.; Lewellen, R.T. Beta maritima: The origin of beets. Springer Sci. Bus. Med. 2011, 113, 1–65. [Google Scholar]
  42. Rozema, J.; Cornelisse, D.; Zhang, Y.; Li, H.; Bruning, B.; Katschnig, D.; Broekman, R.; Ji, B.; Van Bodegom, P. Comparing salt tolerance of beet cultivars and their halophytic ancestor: Consequences of domestication and breeding programmes. AoB Plants. 2015, 7, 83. [Google Scholar] [CrossRef]
  43. Moreno, F.; Cabrera, F.; Fernandez-Boy, E.; Giron, I.F.; Fernandez, J.E.; Bellido, B. Irrigation with saline water in the reclaimed marsh soils of south-west Spain: Impact on soil properties and cotton and sugar beet crops. Agric. Water Manag. 2001, 48, 133–150. [Google Scholar] [CrossRef]
  44. Hajiboland, R.; Joudmand, A. The K/Na replacement and function of antioxidant defence system in sugar beet (Beta vulgaris L.) cultivars. Acta Agric. Scand. 2009, 59, 246–259. [Google Scholar]
  45. Ghoulam, C.; Foursy, A.; Fares, K. Effects of salt stress on growth, inorganic ions and proline accumulation in relation to osmotic adjustment in five sugar beet cultivars. Environ. Exper Bot. 2002, 47, 39–50. [Google Scholar] [CrossRef]
  46. Dadkhah, A. Response of root yield and quality of sugar beet (Beta vulgaris) to salt stress. Iran. Agric. Res. 2005, 23, 43–50. [Google Scholar] [CrossRef]
  47. Wang, Y.; Stevanato, P.; Yu, L.; Zhao, H.; Sun, X.; Sun, F.; Li, J.; Geng, G. The physiological and metabolic changes in sugar beet seedlings under different levels of salt stress. J. Plant. Res. 2017, 130, 1079–1093. [Google Scholar] [CrossRef] [PubMed]
  48. Mahmuduzzaman, M.; Ahmed, Z.U.; Nuruzzaman, A.K.; Ahmed, F.R. Causes of salinity intrusion in coastal belt of Bangladesh. Int. J. Plant. Res. 2014, 4, 8–13. [Google Scholar]
  49. Mondal, M.K.; Bhuiyan, S.I.; Franco, D.T. Soil salinity reduction and prediction of salt dynamics in the coastal ricelands of Bangladesh. Agric. Water Manag. 2001, 47, 9–23. [Google Scholar] [CrossRef]
  50. Kibria, M.G.; Hossain, M.; Murata, Y.; Hoque, M.A. Antioxidant defense mechanisms of salinity tolerance in rice genotypes. Rice Sci. 2017, 24, 155–162. [Google Scholar] [CrossRef]
  51. Afrin, S.; Tahjib-Ul-Arif, M.; Sakil, M.; Sohag, A.; Polash, M.; Hossain, M. Hydrogen peroxide priming alleviates chilling stress in rice (Oryza sativa L.) by enhancing oxidant scavenging capacity. Fundam. Appl. Agric. 2019, 4, 713–722. [Google Scholar] [CrossRef]
  52. Tahjib-Ul-Arif, M.; Roy, P.R.; Sohag, A.A.; Afrin, S.; Rady, M.M.; Hossain, M.A. Exogenous calcium supplementation improves salinity tolerance in BRRI dhan28; a salt-susceptible high-yielding Oryza sativa cultivar. J. Crop. Sci. Biotechnol. 2018, 21, 383–394. [Google Scholar] [CrossRef]
  53. Lichtenthaler, H.K. Chlorophylls and carotenoids: Pigments of photosynthetic biomembranes. Methods Enzymol. 1987, 148, 350–382. [Google Scholar]
  54. Tahjib-Ul-Arif, M.; Siddiqui, M.N.; Sohag, A.A.; Sakil, M.A.; Rahman, M.M.; Polash, M.A.; Mostofa, M.G.; Tran, L.S. Salicylic Acid-Mediated Enhancement of Photosynthesis Attributes and Antioxidant Capacity Contributes to Yield Improvement of Maize Plants Under Salt Stress. J. Plant. Growth Regul. 2018, 37, 1318–1330. [Google Scholar] [CrossRef]
  55. Zhang, Z.; Huang, R. Analysis of malondialdehyde, chlorophyll proline, soluble sugar, and glutathione content in Arabidopsis seedling. Biol. Protoc. 2013, 3. [Google Scholar] [CrossRef]
  56. Velikova, V.; Yordanov, I.; Edreva, A. Oxidative stress and some antioxidant systems in acid rain-treated bean plants: Protective role of exogenous polyamines. Plant. Sci. 2000, 151, 59–66. [Google Scholar] [CrossRef]
  57. Jagota, S.K.; Dani, H.M. A new colorimetric technique for the estimation of vitamin C using Folin phenol reagent. Anal. Biochem. 1982, 127, 178–182. [Google Scholar] [CrossRef]
  58. Aebi, H. Catalase in vitro. Methods Enzymol. 1984, 105, 121–126. [Google Scholar] [PubMed]
  59. Nakano, Y.; Asada, K. Hydrogen peroxide is scavenged by ascorbate-specific peroxidase in spinach chloroplasts. Plant. Cell Physiol. 1981, 22, 867–880. [Google Scholar]
  60. Xia, J.; Psychogios, N.; Young, N.; Wishart, D.S. MetaboAnalyst: A web server for metabolomic data analysis and interpretation. Nucleic Acids Res. 2009, 37, 652–660. [Google Scholar] [CrossRef]
  61. Flowers, T.J.; Colmer, T.D. Salinity tolerance in halophytes. New Phytol. 2008, 179, 945–963. [Google Scholar] [CrossRef]
  62. Flowers, T.J.; Colmer, T.D. Plant salt tolerance: Adaptations in halophytes. Ann. Bot. 2015, 115, 327–331. [Google Scholar] [CrossRef]
  63. Aslamsup, R.; Bostansup, N.; Mariasup, M.; Safdar, W. A critical review on halophytes: Salt tolerant plants. J. Med. Plant. 2011, 5, 7108–7118. [Google Scholar]
  64. Tahjib-Ul-Arif, M.; Afrin, S.; Polash, M.A.; Akter, T.; Ray, S.R.; Hossain, M.T.; Hossain, M.A. Role of exogenous signaling molecules in alleviating salt-induced oxidative stress in rice (Oryza sativa L.): A comparative study. Acta Physiol. Plant. 2019, 41, 69. [Google Scholar] [CrossRef]
  65. Wu, G.Q.; Liang, N.; Feng, R.J.; Zhang, J.J. Evaluation of salinity tolerance in seedlings of sugar beet (Beta vulgaris L.) cultivars using proline, soluble sugars and cation accumulation criteria. Acta Physiol. Plant. 2013, 35, 2665–2674. [Google Scholar] [CrossRef]
  66. Qados, A.M. Effect of salt stress on plant growth and metabolism of bean plant Vicia faba (L.). J. S. Soc. Agric. Sci. 2011, 10, 7–15. [Google Scholar]
  67. Abideen, Z.; Koyro, H.W.; Huchzermeyer, B.; Ahmed, M.Z.; Gul, B.; Khan, M.A. Moderate salinity stimulates growth and photosynthesis of Phragmites karka by water relations and tissue specific ion regulation. Environ. Expert. Bot. 2014, 105, 70–76. [Google Scholar] [CrossRef]
  68. Naidoo, G.; Naidoo, Y.; Achar, P. Ecophysiological responses of the salt marsh grass Spartina maritima to salinity. Afr J. Aquat. Sci. 2012, 37, 81–88. [Google Scholar] [CrossRef]
  69. Wakeel, A.; Asif, A.R.; Pitann, B.; Schubert, S. Proteome analysis of sugar beet (Beta vulgaris L.) elucidates constitutive adaptation during the first phase of salt stress. J. Plant. Physiol. 2011, 168, 519–526. [Google Scholar] [CrossRef] [PubMed]
  70. Yue, L.J.; Li, S.X.; Ma, Q.; Zhou, X.R.; Wu, G.Q.; Bao, A.K.; Zhang, J.L.; Wang, S.M. NaCl stimulates growth and alleviates water stress in the xerophyte Zygophyllum xanthoxylum. J. Arid. Environ. 2012, 87, 153–160. [Google Scholar] [CrossRef]
  71. Hayat, S.; Hayat, Q.; Alyemeni, M.N.; Wani, A.S.; Pichtel, J.; Ahmad, A. Role of proline under changing environments: A review. Plant. Signal. Behav. 2012, 7, 1456–1466. [Google Scholar] [CrossRef]
  72. Kaur, G.; Asthir, B. Proline: A key player in plant abiotic stress tolerance. Biol. Plant. 2015, 59, 609–619. [Google Scholar] [CrossRef]
  73. Rahman, M.M.; Mostofa, M.G.; Rahman, M.A.; Miah, M.G.; Saha, S.R.; Karim, M.A.; Keya, S.S.; Akter, M.; Islam, M.; Tran, L.S. Insight into salt tolerance mechanisms of the halophyte Achras sapota: An important fruit tree for agriculture in coastal areas. Protoplasma 2019, 256, 181–191. [Google Scholar] [CrossRef]
  74. Summart, J.; Thanonkeo, P.; Panichajakul, S.; Prathepha, P.; McManus, M.T. Effect of salt stress on growth, inorganic ion and proline accumulation in Thai aromatic rice, Khao Dawk Mali 105, callus culture. Afr. J. Biotechnol. 2010, 9, 145–152. [Google Scholar]
  75. You, J.; Chan, Z. ROS regulation during abiotic stress responses in crop plants. Front. Plant. Sci. 2015, 6, 1092. [Google Scholar] [CrossRef]
  76. Roy, P.R.; Tahjib-Ul-Arif, M.; Polash, M.A.; Hossen, M.Z.; Hossain, M.A. Physiological mechanisms of exogenous calcium on alleviating salinity-induced stress in rice (Oryza sativa L.). Physiol. Mol. Biol. Plant. 2019, 25, 611–624. [Google Scholar] [CrossRef]
  77. Birben, E.; Sahiner, U.M.; Sackesen, C.; Erzurum, S.; Kalayci, O. Oxidative stress and antioxidant defense. World Allergy Organ. J. 2012, 5, 9–19. [Google Scholar] [CrossRef] [PubMed]
  78. Bor, M.; Özdemir, F.; Türkan, I. The effect of salt stress on lipid peroxidation and antioxidants in leaves of sugar beet Beta vulgaris L. and wild beet Beta maritima L. Plant. Sci. 2003, 164, 77–84. [Google Scholar] [CrossRef]
  79. Ahmad, P.; Abdel Latef, A.A.; Hashem, A.; Abd_Allah, E.F.; Gucel, S.; Tran, L.S. Nitric oxide mitigates salt stress by regulating levels of osmolytes and antioxidant enzymes in chickpea. Front. Plant. Sci. 2016, 7, 347. [Google Scholar] [CrossRef] [PubMed]
  80. Taïbi, K.; Taïbi, F.; Abderrahim, L.A.; Ennajah, A.; Belkhodja, M.; Mulet, J.M. Effect of salt stress on growth, chlorophyll content, lipid peroxidation and antioxidant defence systems in Phaseolus vulgaris L. S. Afr. J. Bot. 2016, 105, 306–312. [Google Scholar] [CrossRef]
  81. Ben Ahmed, C.; Ben Rouina, B.; Sensoy, S.; Boukhriss, M.; Ben Abdullah, F. Exogenous proline effects on photosynthetic performance and antioxidant defense system of young olive tree. J. Agric. Food Chem. 2010, 58, 4216–4222. [Google Scholar] [CrossRef]
  82. Weisany, W.; Sohrabi, Y.; Heidari, G.; Siosemardeh, A.; Ghassemi-Golezani, K. Changes in antioxidant enzymes activity and plant performance by salinity stress and zinc application in soybean (Glycine max L.). Plant. Omics. 2012, 5, 60–67. [Google Scholar]
  83. Roy, P.R.; Tahjib-Ul-Arif, M.; Akter, T.; Ray, S.R.; Sayed, M.A. Exogenous ascorbic acid and hydrogen peroxide alleviates salt-induced oxidative stress in rice (Oryza sativa L.) by enhancing antioxidant enzyme activities and proline content. Adv. Environ. Biol. 2016, 10, 148–155. [Google Scholar]
  84. Zou, C.; Sang, L.; Gai, Z.; Wang, Y.; Li, C. Morphological and Physiological Responses of Sugar Beet to Alkaline Stress. Sugar Tech. 2018, 20, 202–211. [Google Scholar] [CrossRef]
  85. Tang, X.; Mu, X.; Shao, H.; Wang, H.; Brestic, M. Global plant-responding mechanisms to salt stress: Physiological and molecular levels and implications in biotechnology. Crit. Rev. Biotechnol. 2015, 35, 425–437. [Google Scholar] [CrossRef]
  86. Ashraf, M.H.; Harris, P.J. Photosynthesis under stressful environments: An overview. Photosynthetica 2013, 51, 163–190. [Google Scholar] [CrossRef]
  87. Wei, Y.; Xu, X.; Tao, H.; Wang, P. Growth performance and physiological response in the halophyte Lycium barbarum grown at salt-affected soil. Ann. Appl. Biol. 2006, 149, 263–269. [Google Scholar] [CrossRef]
  88. Jamil, M.; Lee, K.J.; Kim, J.M.; Kim, H.S.; Rha, E.S. Salinity reduced growth PS2 photochemistry and chlorophyll content in radish. Sci Agric. 2007, 64, 111–118. [Google Scholar] [CrossRef] [Green Version]
  89. Stepien, P.; Johnson, G.N. Contrasting responses of photosynthesis to salt stress in the glycophyte Arabidopsis and the halophyte Thellungiella: Role of the plastid terminal oxidase as an alternative electron sink. Plant. Physiol. 2009, 149, 1154–1165. [Google Scholar] [CrossRef] [PubMed]
  90. Pak, V.A.; Nabipour, M.; Meskarbashee, M. Effect of salt stress on chlorophyll content, fluorescence, Na+ and K+ ions content in rape plants (Brassica napus L.). Asian J. Agric. Res. 2009, 3, 28–37. [Google Scholar] [CrossRef]
  91. Gong, D.H.; Wang, G.Z.; Si, W.T.; Zhou, Y.; Liu, Z.; Jia, J. Effects of Salt Stress on Photosynthetic Pigments and Activity of Ribulose-1, 5-bisphosphate Carboxylase/Oxygenase in Kalidium foliatum. Rus. J. Plant. Physiol. 2018, 65, 98–103. [Google Scholar] [CrossRef]
  92. Acosta-Motos, J.; Ortuño, M.; Bernal-Vicente, A.; Diaz-Vivancos, P.; Sanchez-Blanco, M.; Hernandez, J. Plant responses to salt stress: Adaptive mechanisms. Agronomy 2017, 7, 18. [Google Scholar] [CrossRef]
  93. Misra, A.N.; Sahu, S.M.; Meera, I.; Mohapatra, P.; Das, N.; Misra, M. Root growth of a salt susceptible and a salt resistant rice (Oryza sativa L.) during seedling establishment under NaCl salinity. J. Agron. Crop. Sci. 1997, 178, 9–14. [Google Scholar] [CrossRef]
  94. Maswada, H.F.; Djanaguiraman, M.; Prasad, P.V. Response of photosynthetic performance, water relations and osmotic adjustment to salinity acclimation in two wheat cultivars. Acta Physiol. Plant. 2018, 40, 105. [Google Scholar] [CrossRef]
  95. Redondo-Gómez, S.; Mateos-Naranjo, E.; Figueroa, M.E.; Davy, A.J. Salt stimulation of growth and photosynthesis in an extreme halophyte, Arthrocnemum macrostachyum. Plant. Biol. 2010, 12, 79–87. [Google Scholar] [CrossRef]
  96. Kurban, H.; Saneoka, H.; Nehira, K.; Adilla, R.; Premachandra, G.S.; Fujita, K. Effect of salinity on growth, photosynthesis and mineral composition in leguminous plant Alhagi pseudoalhagi (Bieb.). Soil Sci. Plant. Nutr. 1999, 45, 851–862. [Google Scholar] [CrossRef]
  97. Golldack, D.; Li, C.; Mohan, H.; Probst, N. Tolerance to drought and salt stress in plants: Unraveling the signaling networks. Front. Plant. Sci. 2014, 5, 151. [Google Scholar] [CrossRef] [PubMed] [Green Version]
  98. Wang, T.; Tohge, T.; Ivakov, A.; Mueller-Roeber, B.; Fernie, A.R.; Mutwil, M.; Schippers, J.H.; Persson, S. Salt-related MYB1 coordinates abscisic acid biosynthesis and signaling during salt stress in Arabidopsis. Plant. Physiol. 2015, 169, 1027–1041. [Google Scholar] [CrossRef] [PubMed]
  99. Jia, W.; Wang, Y.; Zhang, S.; Zhang, J. Salt-stress-induced ABA accumulation is more sensitively triggered in roots than in shoots. J. Exp. Bot. 2002, 53, 2201–2206. [Google Scholar] [CrossRef] [PubMed] [Green Version]
  100. Niu, M.; Xie, J.; Chen, C.; Cao, H.; Sun, J.; Kong, Q.; Shabala, S.; Shabala, L.; Huang, Y.; Bie, Z. An early ABA-induced stomatal closure, Na+ sequestration in leaf vein and K+ retention in mesophyll confer salt tissue tolerance in Cucurbita species. J. Exp. Bot. 2018, 69, 4945–4960. [Google Scholar] [CrossRef]
  101. Bashar, K.K.; Tareq, M.; Amin, M.; Honi, U.; Tahjib-Ul-Arif, M.; Sadat, M.; Hossen, Q.M. Phytohormone-Mediated Stomatal Response, Escape and Quiescence Strategies in Plants under Flooding Stress. Agronomy 2019, 9, 43. [Google Scholar] [CrossRef]
  102. Vesala, T.; Sevanto, S.; Grönholm, T.; Salmon, Y.; Nikinmaa, E.; Hari, P.; Hölttä, T. Effect of leaf water potential on internal humidity and CO2 dissolution: Reverse transpiration and improved water use efficiency under negative pressure. Front. Plant. Sci. 2017, 8, 54. [Google Scholar] [CrossRef]
  103. Choudhury, S.; Panda, P.; Sahoo, L.; Panda, S.K. Reactive oxygen species signaling in plants under abiotic stress. Plant. Signal. Behav. 2013, 8, e23681. [Google Scholar] [CrossRef] [Green Version]
  104. Calderón, A.; Sevilla, F.; Jiménez, A. Redox protein thioredoxins: Function under salinity, drought and extreme temperature conditions. In Antioxidants and Antioxidant Enzymes in Higher Plants; Gupta, D.K., Palma, J.M., Corpas, F.J., Eds.; Springer: Cham, Switzerland, 2018; pp. 123–162. [Google Scholar]
  105. Nxele, X.; Klein, A.; Ndimba, B.K. Drought and salinity stress alters ROS accumulation, water retention, and osmolyte content in sorghum plants. S. Afr. J. Bot. 2017, 108, 261–266. [Google Scholar] [CrossRef]
Figure 1. Effects of soil salinity on leaf proline content (A), and relative water content (RWC) (B) in sugar beet after exposed to various salt concentrations for 95 days. Each bar represents the average of three independent replicates (n = 3), and the error bar denotes standard errors. Statistically significant differences among different treatments are designated by various alphabetic letters based on Tukey’s honestly significant differences test (p < 0.05). Control (C), 0 mM NaCl; S75, 75 mM NaCl; S100, 100 mM NaCl; S150, 150 mM NaCl; S250, 250 mM NaCl.
Agriculture 09 00223 g001
Figure 2. Effects of soil salinity on net CO2 assimilation rate (A) (A); transpiration rate (E) (B); stomatal conductance (Gs) (C); intracellular CO2 concentration (Ci) (D); carboxylation efficiency (A/Ci) (E); and water use efficiency (WUE) (F) in sugar beet after exposed to various salt concentrations for 95 days. Each bar represents the average of three independent replicates (n = 3), and the error bar denotes standard errors. Statistically significant differences among different treatments are designated by various alphabetic letters based on Tukey’s honestly significant differences test (p < 0.05). Control (C), 0 mM NaCl; S75, 75 mM NaCl; S100, 100 mM NaCl; S150, 150 mM NaCl; S250, 250 mM NaCl.
Agriculture 09 00223 g002
Figure 3. Effects of soil salinity on total chlorophyll (Chl) content (A), H2O2 content (B), and MDA (malondialdehyde) content (C) in sugar beet after exposed to various salt concentrations for 95 days. Each bar represents the average of three independent replicates (n = 3), and the error bar denotes standard errors. Statistically significant differences among different treatments are designated by various alphabetic letters based on Tukey’s honestly significant differences test (p < 0.05). Control (C), 0 mM NaCl; S75, 75 mM NaCl; S100, 100 mM NaCl; S150, 150 mM NaCl; S250, 250 mM NaCl.
Agriculture 09 00223 g003
Figure 4. Effects of soil salinity on ascorbate content (A), catalase (CAT) activity (B), peroxidase (POX) activity (C) and ascorbate peroxidase (APX) activity (D) in sugar beet after exposure to various salt concentrations for 95 days. Each bar represents the average of three independent replicates (n = 3), and the error bar denotes standard errors. Statistically significant differences among different treatments are designated by different alphabetic letters based on Tukey’s honestly significant differences test (p < 0.05). Control (C), 0 mM NaCl; S75, 75 mM NaCl; S100, 100 mM NaCl; S150, 150 mM NaCl; S250, 250 mM NaCl.
Agriculture 09 00223 g004
Figure 5. Hierarchical clustering and heatmap analysis (A), and principal component analysis (PCA) (B) to reveal the treatment-variable associations of sugar beet grown under different salt concentrations for a period of 95 days. At the variable level, two separate clusters (A and B) were recognized. In the heatmap, the color scale shows the intensity of the standardized mean values of different parameters. In PCA, the lines starting from the central point of the biplots display negative or positive associations of different variables, and their proximity specifies the degree of correlation with a specific treatment. Control (C), 0 mM NaCl; S75, 75 mM NaCl; S100, 100 mM NaCl; S150, 150 mM NaCl; S250, 250 mM NaCl. SL, shoot length; SFW, shoot fresh weight; SDW, shoot dry weight; TFW, tuber fresh weight; RWC, relative water content; Pro, proline content; Chl, total chlorophyll content; H2O2, hydrogen peroxide content; MDA, malondialdehyde content; CAT, catalase activity; POX, peroxidase activity; APX, ascorbate peroxidase; ASC, ascorbate content; A, net CO2 assimilation rate; Gs, stomatal conductance; E, transpiration rate; Ci, intercellular CO2 concentration; A/Ci, carboxylation efficiency; WUE, water use efficiency.
Agriculture 09 00223 g005aAgriculture 09 00223 g005b
Table 1. Effects of soil salinity on shoot length (SL), tuber fresh weight (TFW), shoot fresh weight (SFW), and shoot dry weight (SDW) of sugar beet plant after treatments with various salt concentrations for a period of 95 days.
TreatmentsShoot Length
(cm)
Tuber Fresh Weight
(g plant−1)
Shoot Fresh Weight
(g plant−1)
Shoot Dry Weight
(g plant−1)
0 mM NaCl28.83 ± 0.58a38.50 ± 0.58b46.22 ± 0.62c5.28 ± 0.17c
75 mM NaCl28.73 ± 0.56a49.27 ± 1.19a69.58 ± 0.54a7.40 ± 0.23a
100 mM NaCl28.61 ± 0.78a36.08 ± 0.58bc68.13 ±0.69a6.40 ± 0.23b
150 mM NaCl27.33 ± 1.16a37.18 ± 1.17bc51.50 ±0.86b6.28 ± 0.17b
250 mM NaCl17.33 ± 0.33b33.20 ± 1.17c36.06 ± 1.15d4.70 ± 0.06c
All values in the table are averages of three replicates (n = 3) ± standard errors. Different alphabetic letters within the same column denote statistically significant differences according to Tukey’s honestly significant differences test (p < 0.05)

