Article

Comparison of UAV Photogrammetry and 3D Modeling Techniques with Other Currently Used Methods for Estimation of the Tree Row Volume of a Super-High-Density Olive Orchard

by
Alexandros Sotirios Anifantis
*,
Salvatore Camposeo
,
Gaetano Alessandro Vivaldi
,
Francesco Santoro
and
Simone Pascuzzi
Department of Agricultural and Environmental Science, University of Bari Aldo Moro, Via Amendola 165/A, 70126 Bari, Italy
*
Author to whom correspondence should be addressed.
Submission received: 26 September 2019 / Revised: 21 October 2019 / Accepted: 26 October 2019 / Published: 29 October 2019

Abstract

:
A comparison of three different methods to evaluate the tree row volume (TRV) of a super-high-density olive orchard is presented in this article. The purpose was to validate the suitability of unmanned aerial vehicle (UAV) photogrammetry and 3D modeling techniques with respect to manual and traditional methods of TRV detection. The use of UAV photogrammetry can reduce the amount of estimated biomass and, therefore, reduce the volume of pesticides to be used in the field by means of more accurate prescription maps. The presented comparison of methodologies was performed on an adult super-high-density olive orchard, planted with a density of 1660 trees per hectare. The first method (TRV1) was based on close-range photogrammetry from UAVs, the second (TRV2) was based on manual in situ measurements, and the third (TRV3) was based on a formula from the literature. The comparisons of TRV2-TRV1 and TRV3-TRV1 showed an average value of the difference equal to +13% (max: +65%; min: −11%) and +24% (max: +58%; min: +5%), respectively. The results show that the TRV1 method has high accuracy in predicting TRV with minor working time expenditure, and the only limitation is that professionally skilled personnel is required.

1. Introduction

Super-high-density (SHD) olive cropping systems represent a very interesting proposal for olive oil orchard profitability because they considerably reduce production costs, thanks to full mechanization from planting to harvesting, and provide higher, more constant crop levels. SHD olive trees grow in hedgerows that form continuous fruit-bearing canopies, which are suitable for over-the-row harvesting machines. Many agronomic aspects are currently under study for SHD olive culture, such as soil management, harvesting times, cropping density, irrigation management, tree architecture, and precision farming [1,2,3,4]. Precision agriculture, especially for fruit tree crops, is an environmental and economic management strategy that uses information and communication technology to acquire data that leads to decisions aimed at agricultural production [5] in the context of climate change. The use of unmanned aerial vehicles (UAVs) for exact cultivation detection from 3D point cloud maps [6] and digital surface models (DSMs) [7], which are generated from multispectral imagery, has accelerated the extrapolation of valuable information for the optimal management of sustainable agriculture. This new frontier is exemplified by the use of data fusion for delineating homogeneous management zones in precision agriculture [8]. Furthermore, remote sensing can be used for precision agriculture to discern the “health status” of crops [9] in a measurement system net located in scattered fields. Advances in precision agriculture have allowed for prompt, site-specific management of the limiting factors of the production system, by which decisions to apply resources and agronomic practices are dictated in progress by the variability detected in the field among the crops [10]. Site-specific management means that inputs, namely, irrigation water, fertilizers, and pesticides, are applied only where and when necessary to maximize the desired result, which in most cases is linked to income maximization and reduced environmental impact [11]. For instance, pest management in agriculture substantially increases crop productivity, but at the same time, it could increase risks to human health and the environment. The Directive 2009/128/EC compels farmers to achieve the sustainable use of pesticides by reducing these impacts. All this has led to the spread of both integrated pest management and organic agriculture. Moreover, recently, precision agriculture has been used in other agronomic practices, such as estimating height [12], tree biomass [13,14,15,16,17], fruit tree crop, pollination, and pruning and harvesting amount, as well as for disease detection [18]. The use of these very new technologies has aroused greater environmental awareness and attention to human health for both consumers and fruit growers, along with awareness of the economic costs of treatment for farmers. The smart and integrated management of high-resolution environmental data from sensors and images represents a low-cost method for setting prescription maps and has been increasingly studied for agricultural applications [19].
The reduction of estimation errors in tree row volume (TRV) calculations could be a very interesting application of these new technologies in order to obtain the correct volume of pesticides for use in treatments with sprayer machines; this could allow for reductions in costs and environmental pesticide dispersions by as much as 50%. There are different techniques for obtaining tree volumes from a point cloud, such as an adjusted tree volume generated from a light detection and ranging (LiDAR) sensor [20,21] and UAV techniques based on airborne laser scanning and structure from motion (SfM) point clouds [22]. The high costs of very high-resolution imagery provided by satellites or LiDAR sensors often impede estimations of aboveground biomass and the determination of other vegetation parameters [23]. A comparison of three different methods to evaluate the TRV of a super-high-density olive orchard is presented in this article. The purpose was to validate the suitability of UAV photogrammetry and 3D modeling techniques with respect to manual and traditional methods of TRV detection. The first method (TRV1) was used to estimate the volume of an SHD olive grove using UAV systems coupled with numerical software. TRV2 estimated the volume of the SHD olive tree canopy measured manually in situ by means of measuring instruments, such as an optical meter and a portable GPS locator; TRV2 was the reference method. Finally, TRV3 was used to estimate the volume of the olive grove by the traditional method [24]. Subsequently, TRV1 and TRV3 were compared with TRV2. The workflow of the TRV tree detection process with the three different methods is shown in Figure 1.

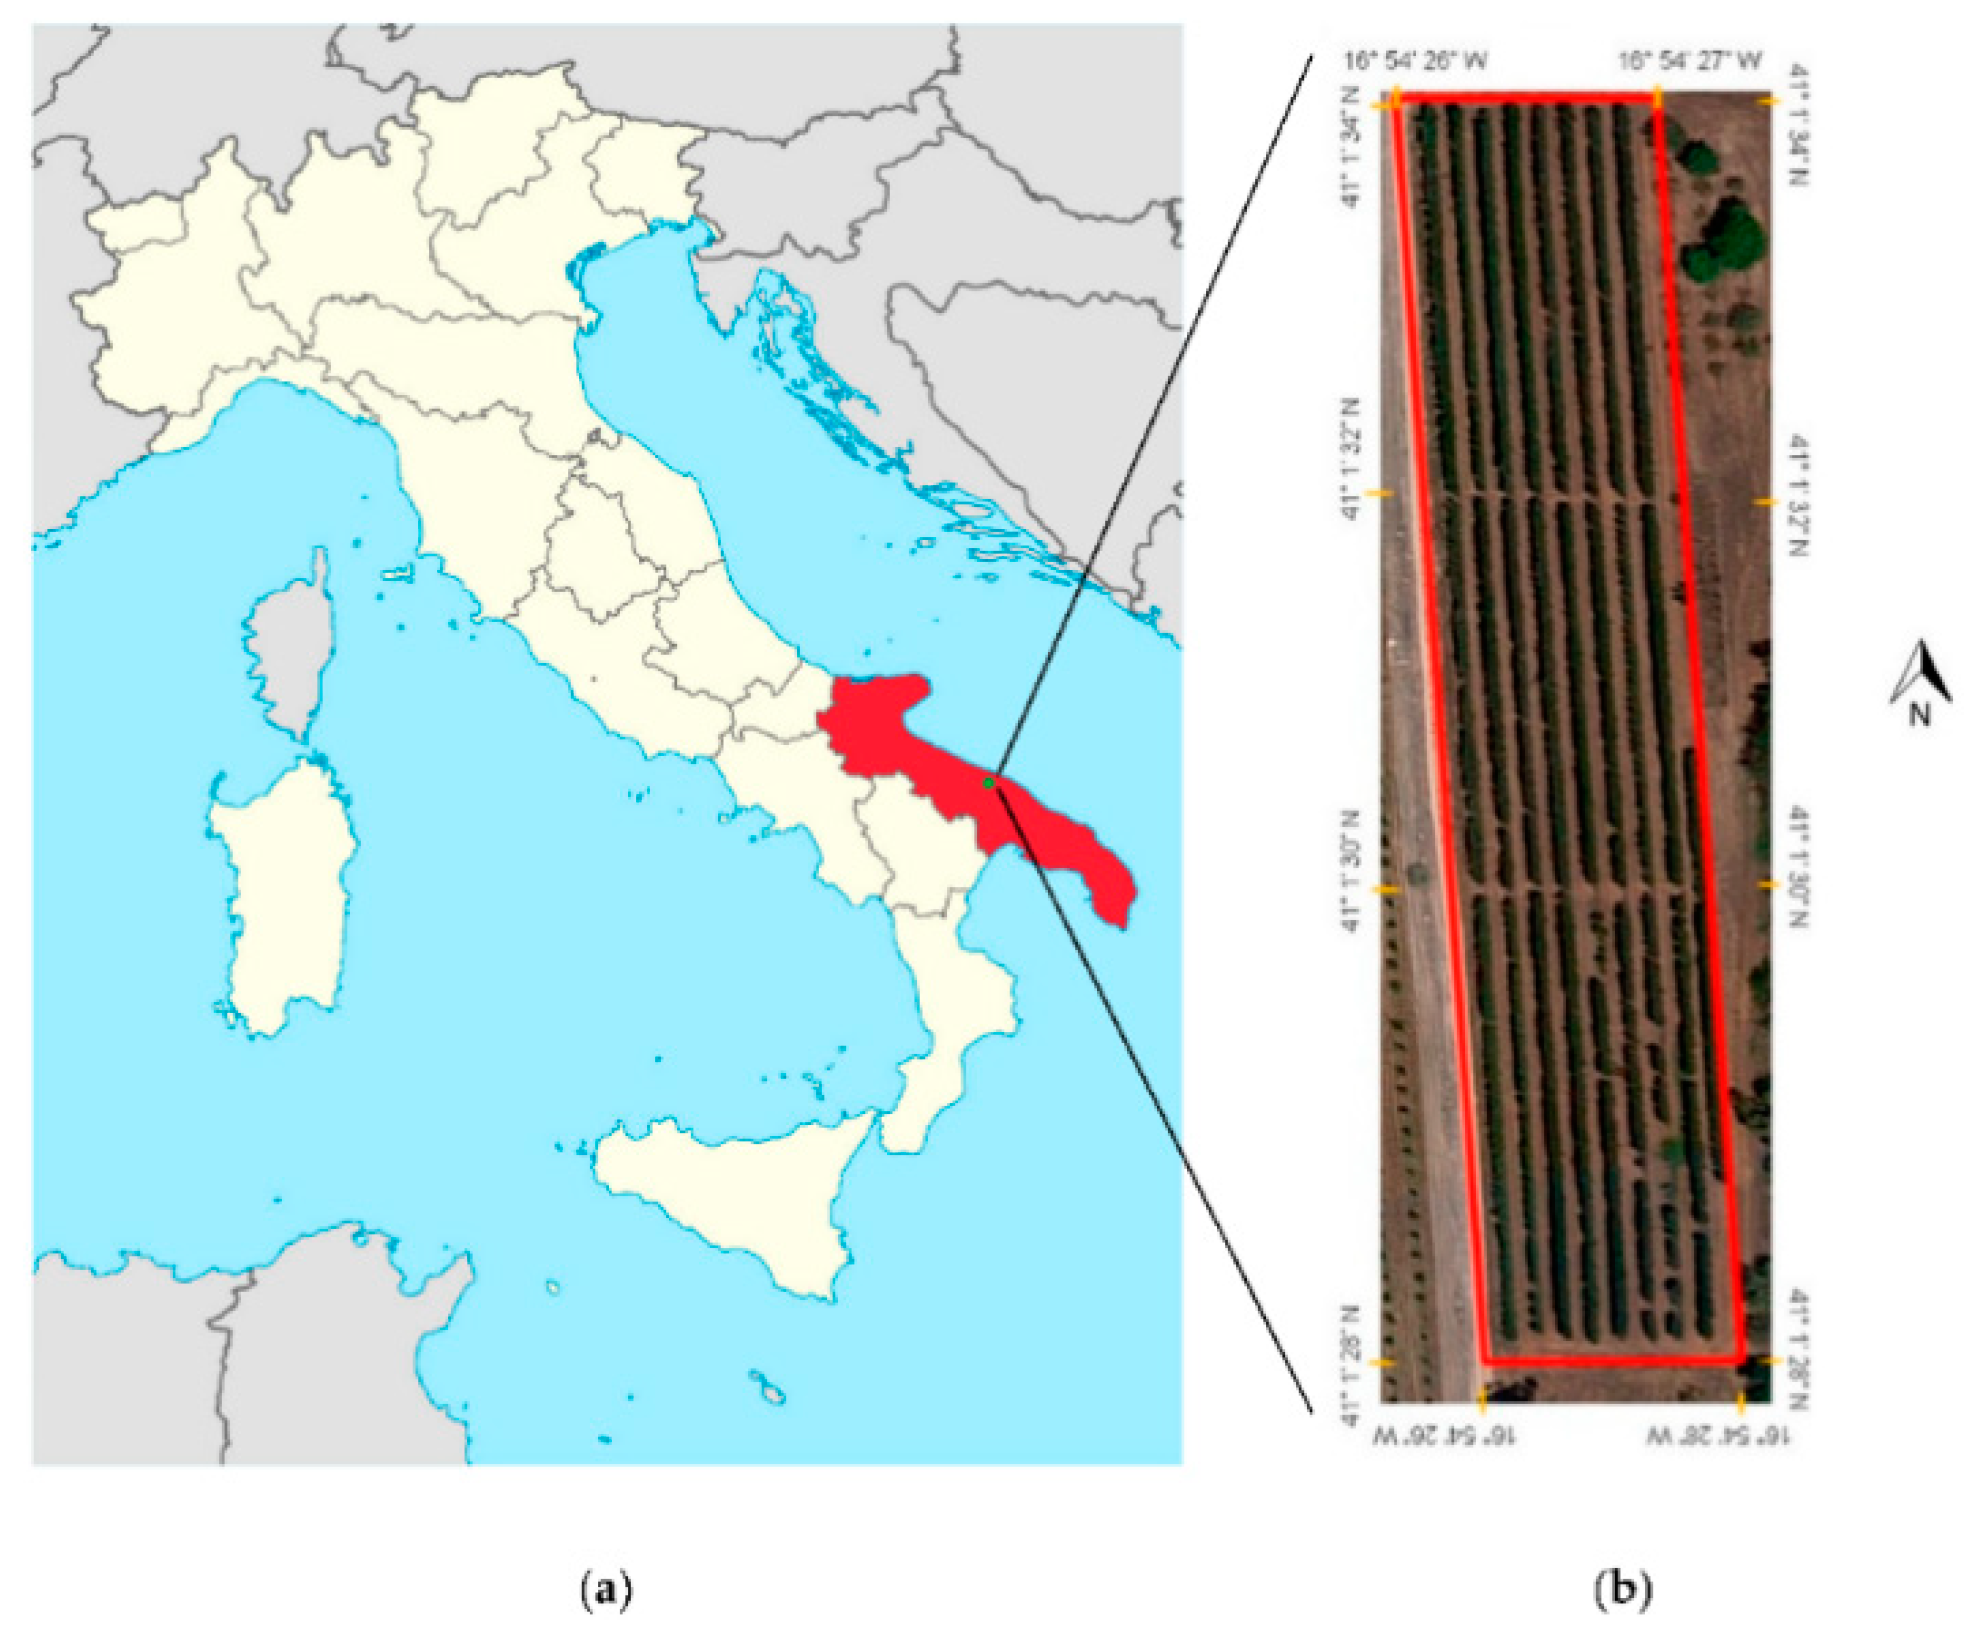
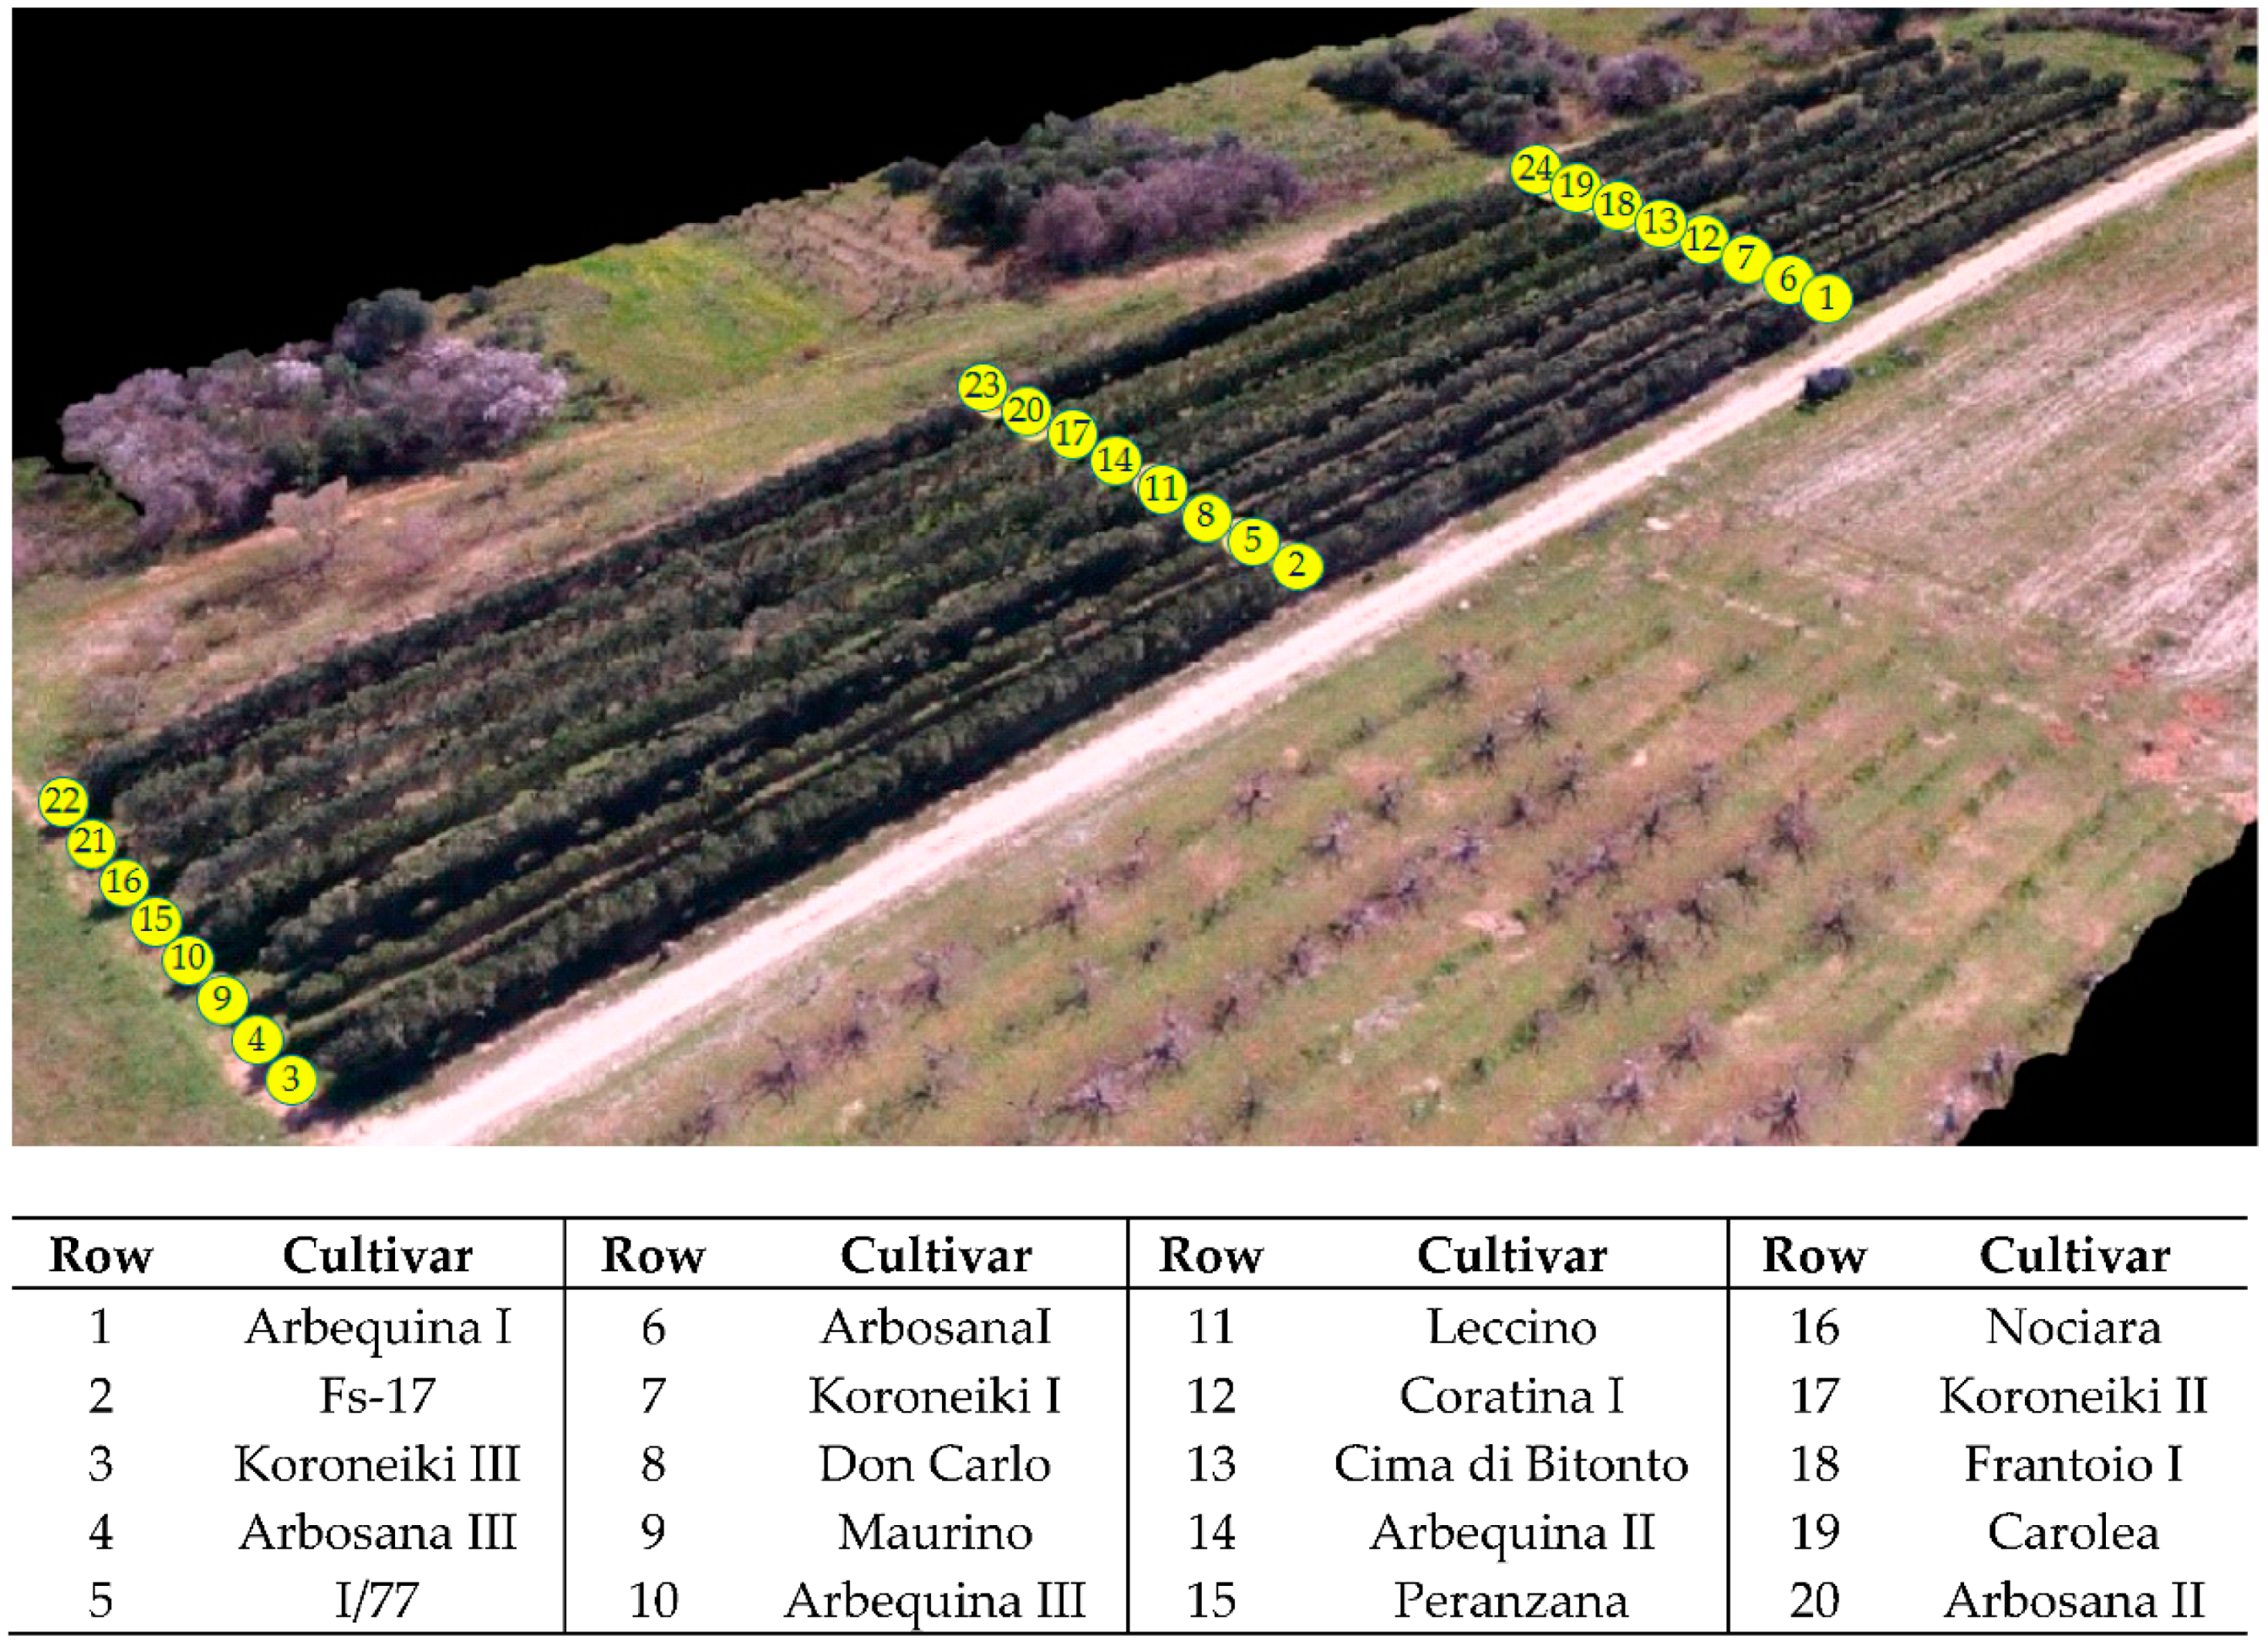
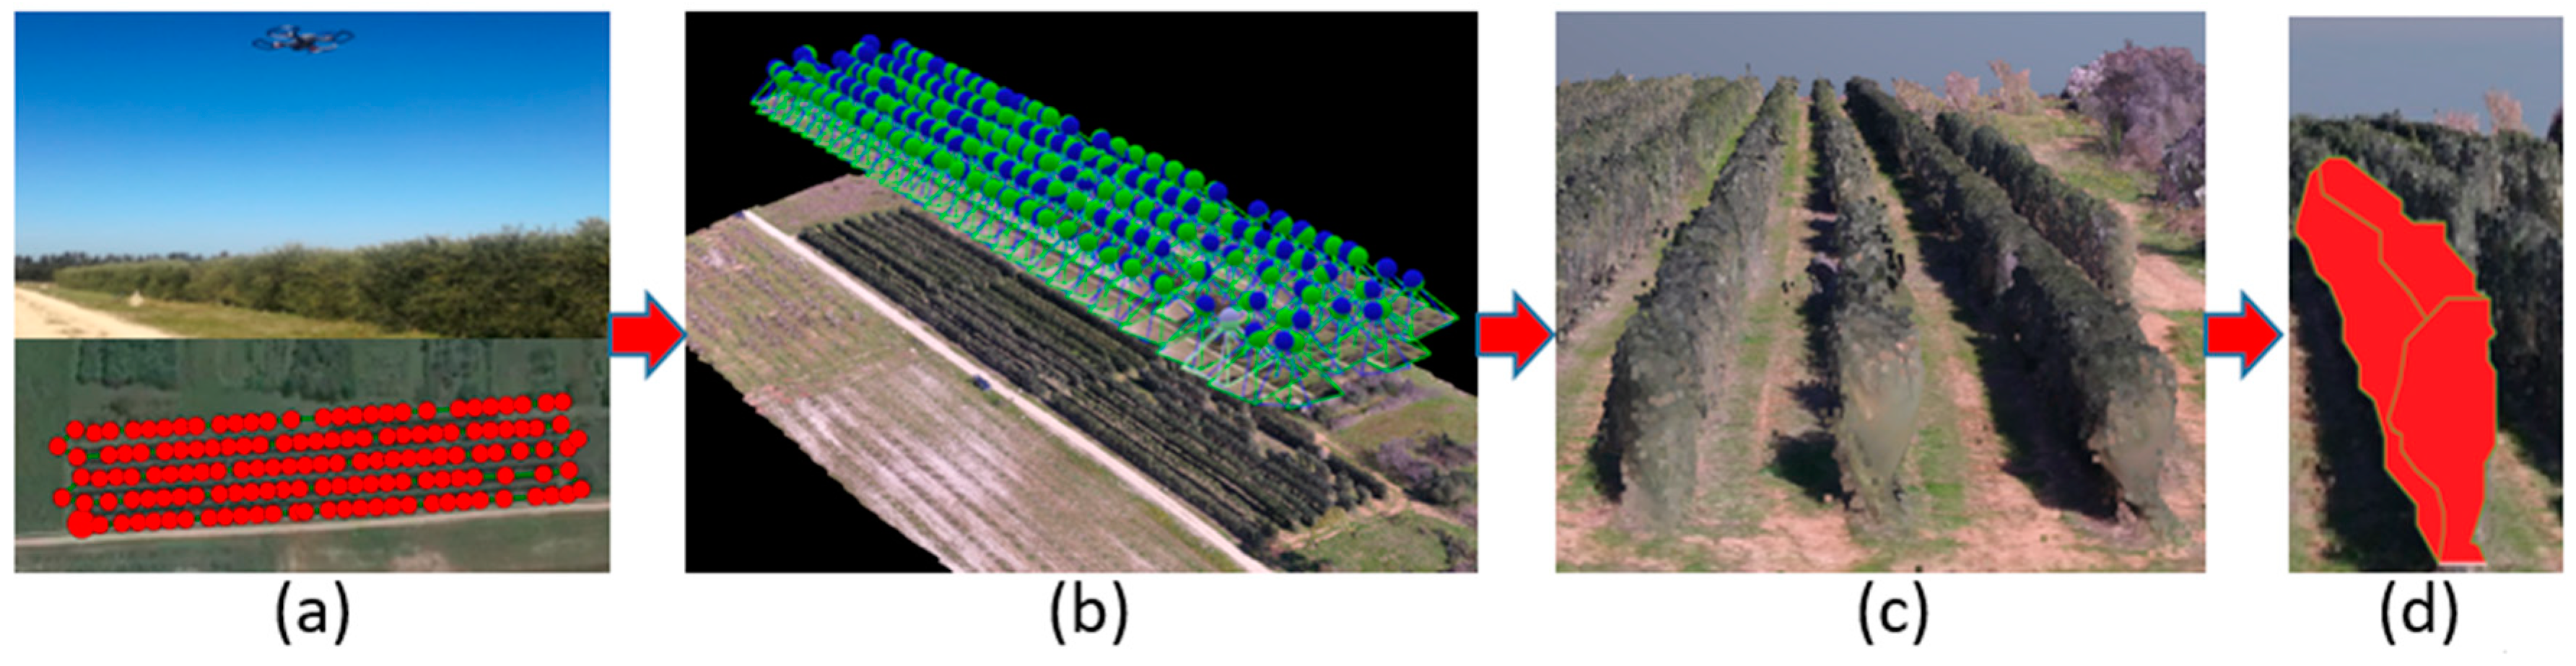
2. Materials and Methods

The research was carried out at the experimental center “P. Martucci” of the University of Bari in Valenzano (Bari), Italy (41.025800 N, 16.907563 W, 140 m a.s.l.), where the TRV of an adult (13 years old) super-high-density olive orchard was estimated (Figure 2).
The olive orchard had a density of 1660 trees per hectare. The field examined consisted of 24 rows including 15 olive cultivars: Arbequina (3 rows); Arbosana (3 rows); Carolea, Cima di Bitonto, and Coratina (2 rows); Don Carlo and Frantoio (2 rows); Fs-17 and I/77, Koroneiki (3 rows); and Leccino, Maurino, Nociara, Peranzana, and Urano (2 rows) (Figure 3). The study was conducted in winter 2019 during olive tree rest. For each of the three adopted methods of TRV estimation, the entire volume of each of the 24 rows was taken into account. No pruning was performed.
This study compared three different methods for calculating TRV in order to assess their reliability for reproducing tree crown geometry and volume.

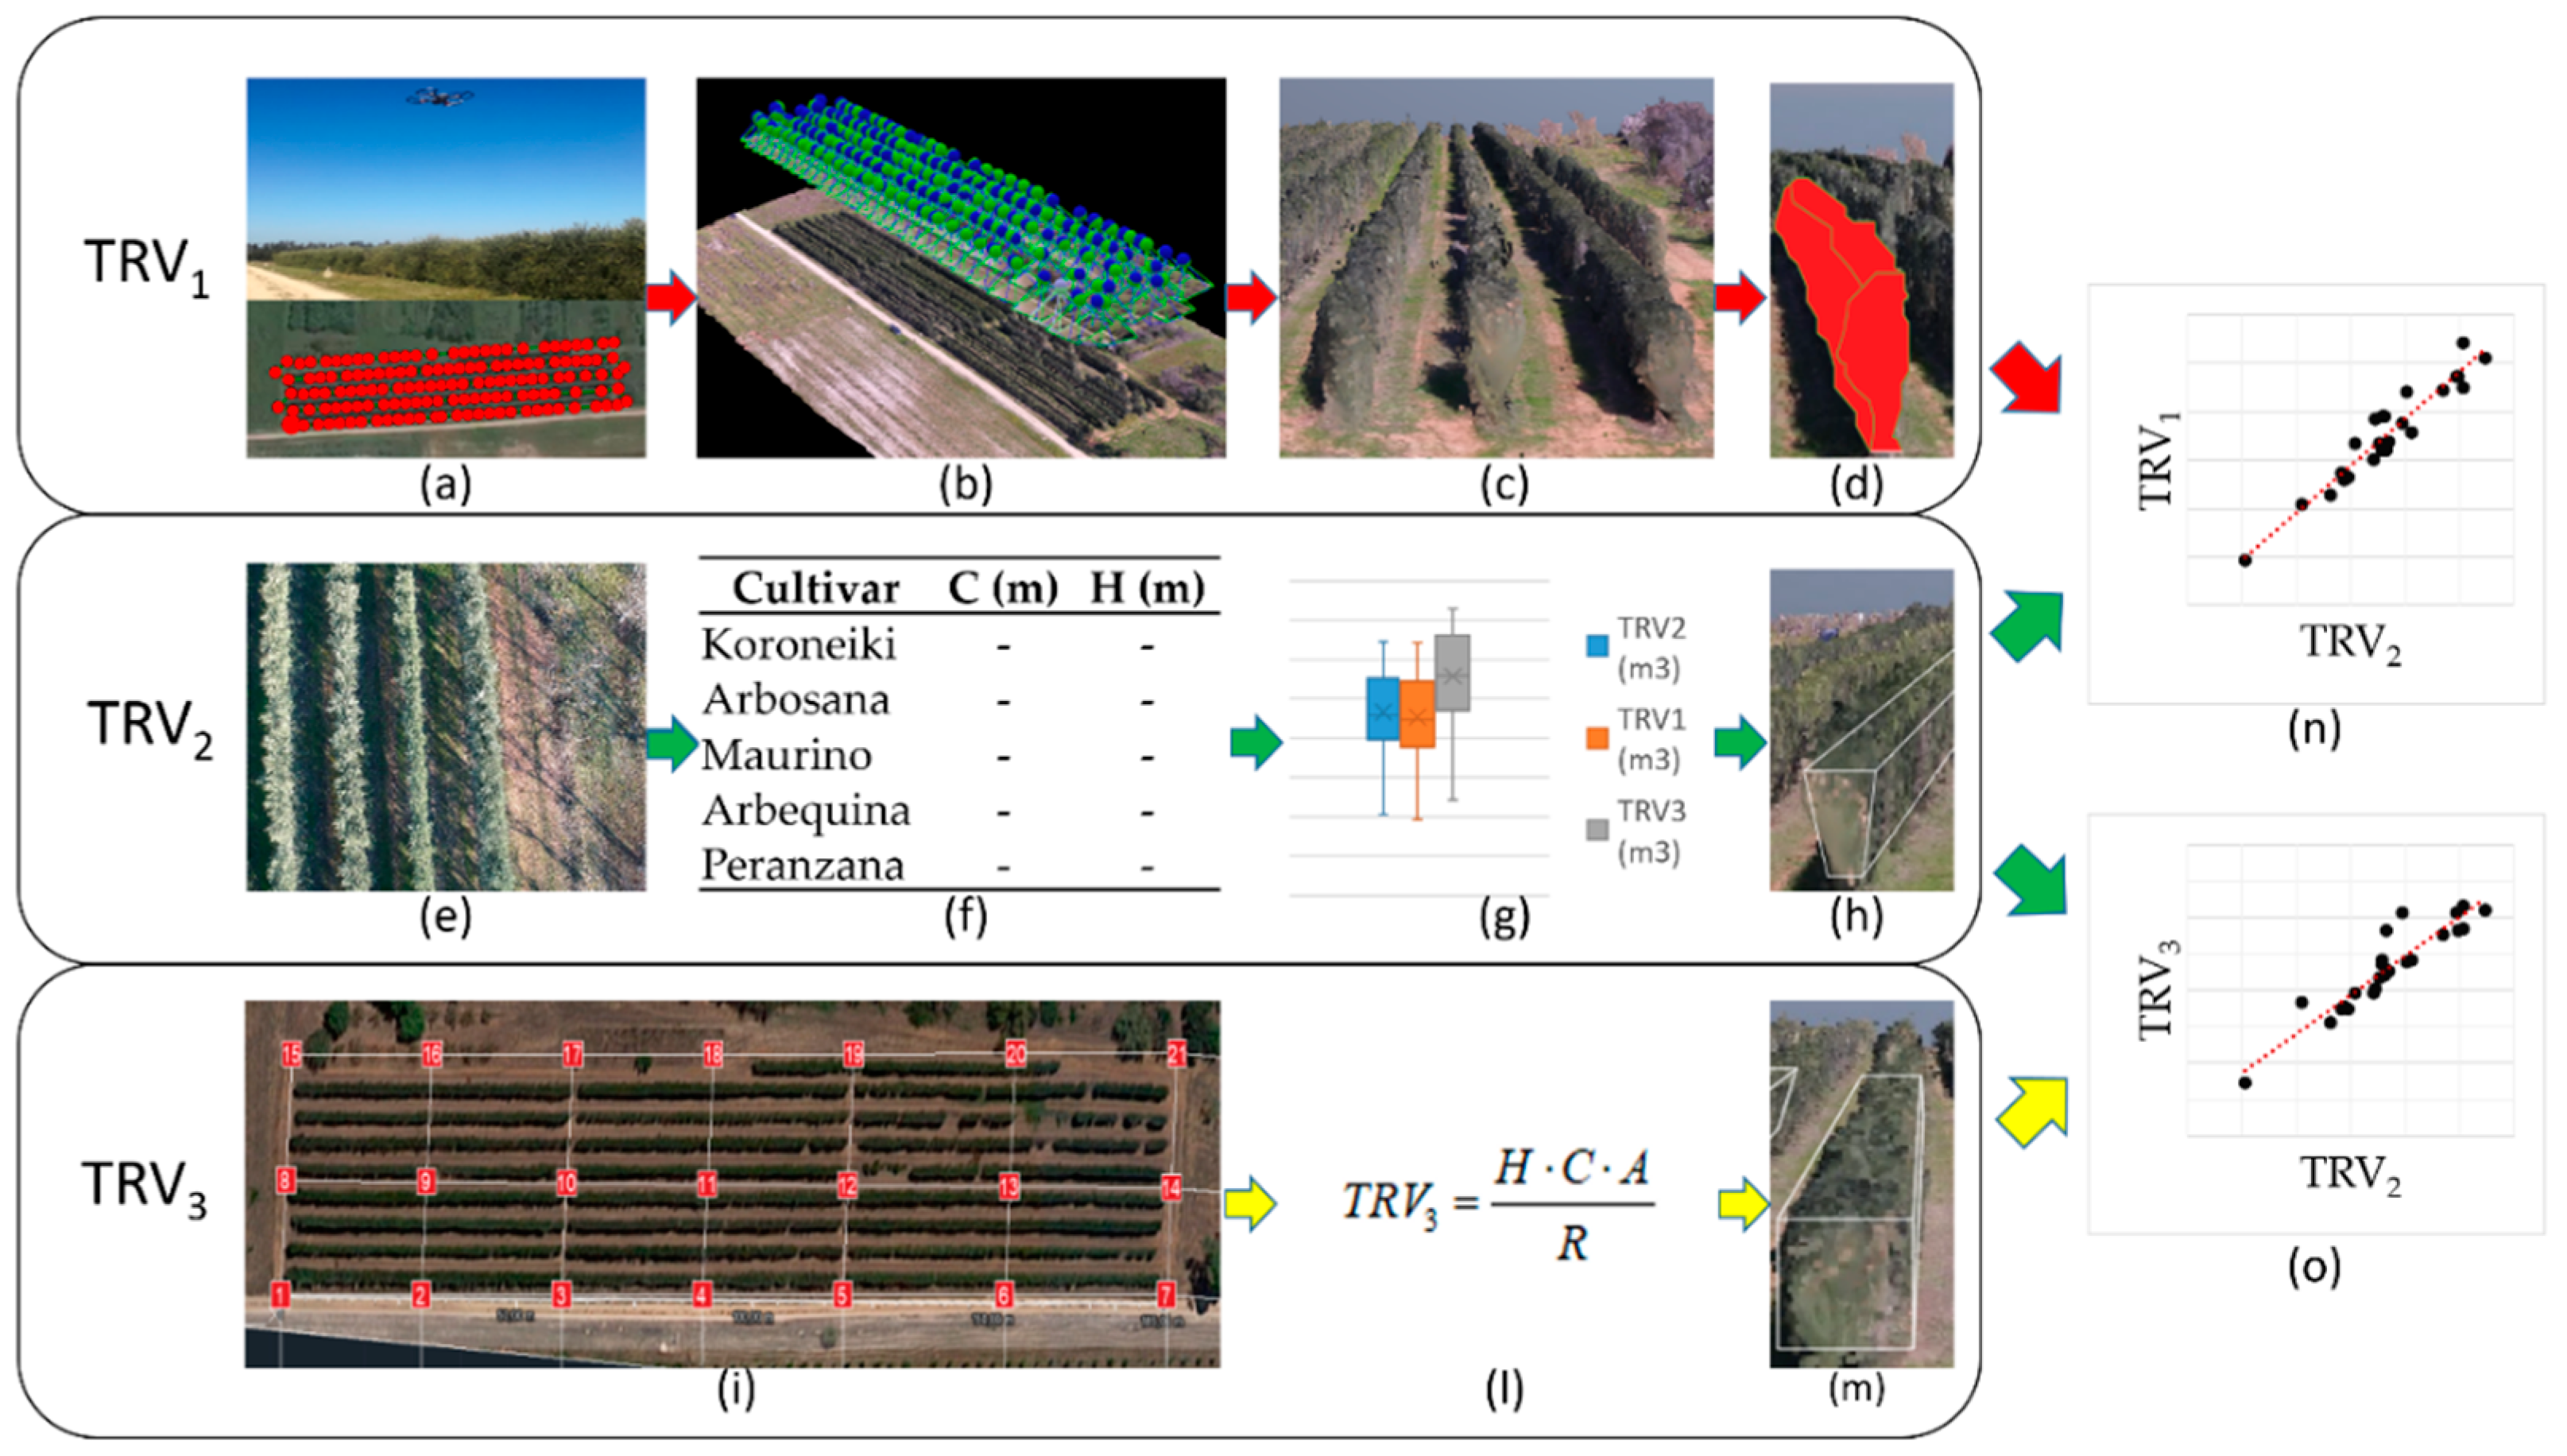
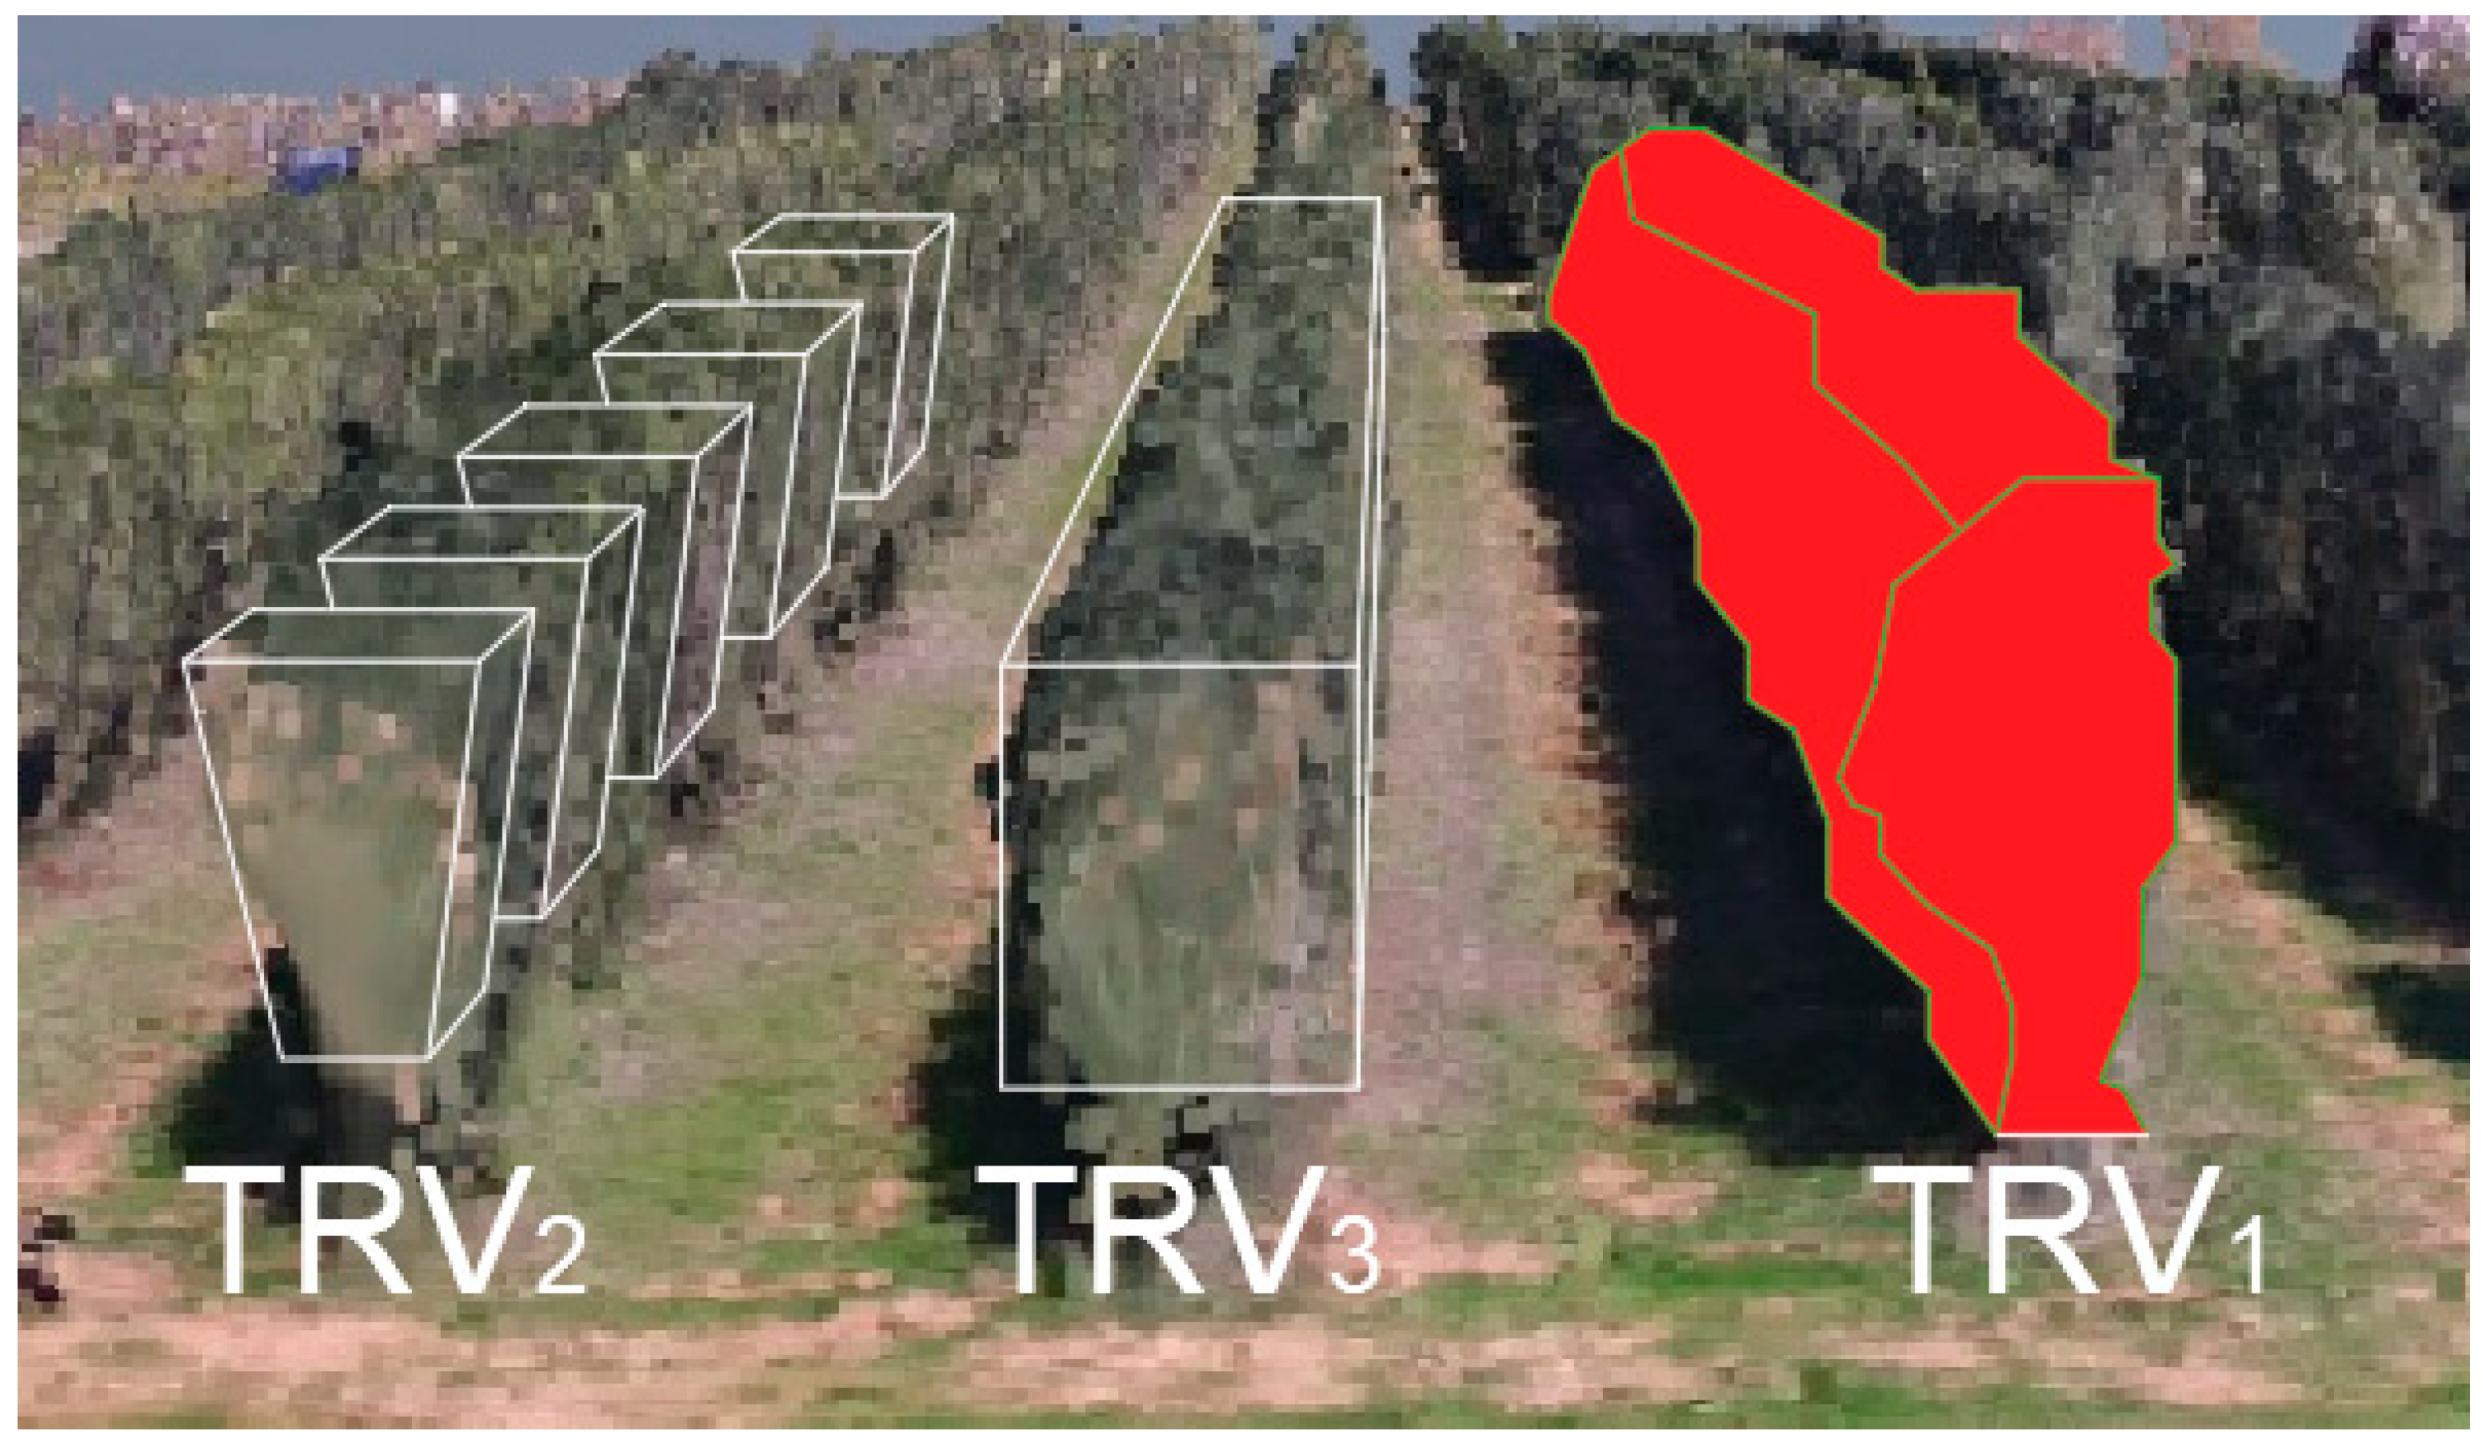
2.1. TRV1 Estimation

The first method used for the estimation of the TRV of the SHD olive orchard was the UAV close-range photogrammetry and 3D modeling technique. Figure 4 shows the 21 ground control points (GCPs) that were positioned on the ground in order to correlate the GPS positions of the images taken by the UAV with the GPS position measured in the field of the GCPs.
The UAV used for the experiment was a DJI SPARK, which is a low-cost UAV that was selected in order to obtain a 3D model of the field without using very expensive equipment that, at the same time, maintains good precision. The study area had an extension of 186 × 36.11 m2. Standard RGB images were acquired with a regular grid pattern, frontal overlap of 75%, side overlap of 60%, flight height of 20 m, image size of 3968 × 2976 pixels, a field of view (FoV) of 81.9°, and ground sampling distance (GSD) of 0.68 cm/pixel. The flight plan was designed to minimize flight time. The UAV was equipped with a CMOS 1/2.3″ sensor of 12 MP, an exposure time of 1/240 s, and an ISO of 100.
The photogrammetric 3D map, the dense point cloud, and the mesh of all the olive crowns were processed by Pix4Dmapper software (Version 4.3.33; Pix4D, Lausanne, Switzerland) [25].
After reconstructing the 3D model, the total TRV1 of each row was calculated by the software using the volume function and selecting the upper half-space parallel to the surface of the ground and positioned below the crown of the trees. The GCP measurements were used for recovering the camera interior parameters and adjusting for any systematic error or block distortion.
Figure 5 provides an analysis of the procedure used for one particular day to quantify the TRV. The point cloud was converted into a mesh by applying the Pix4Dmapper software. Finally, subtractions from these meshes gave us the tree crown volume of each row.

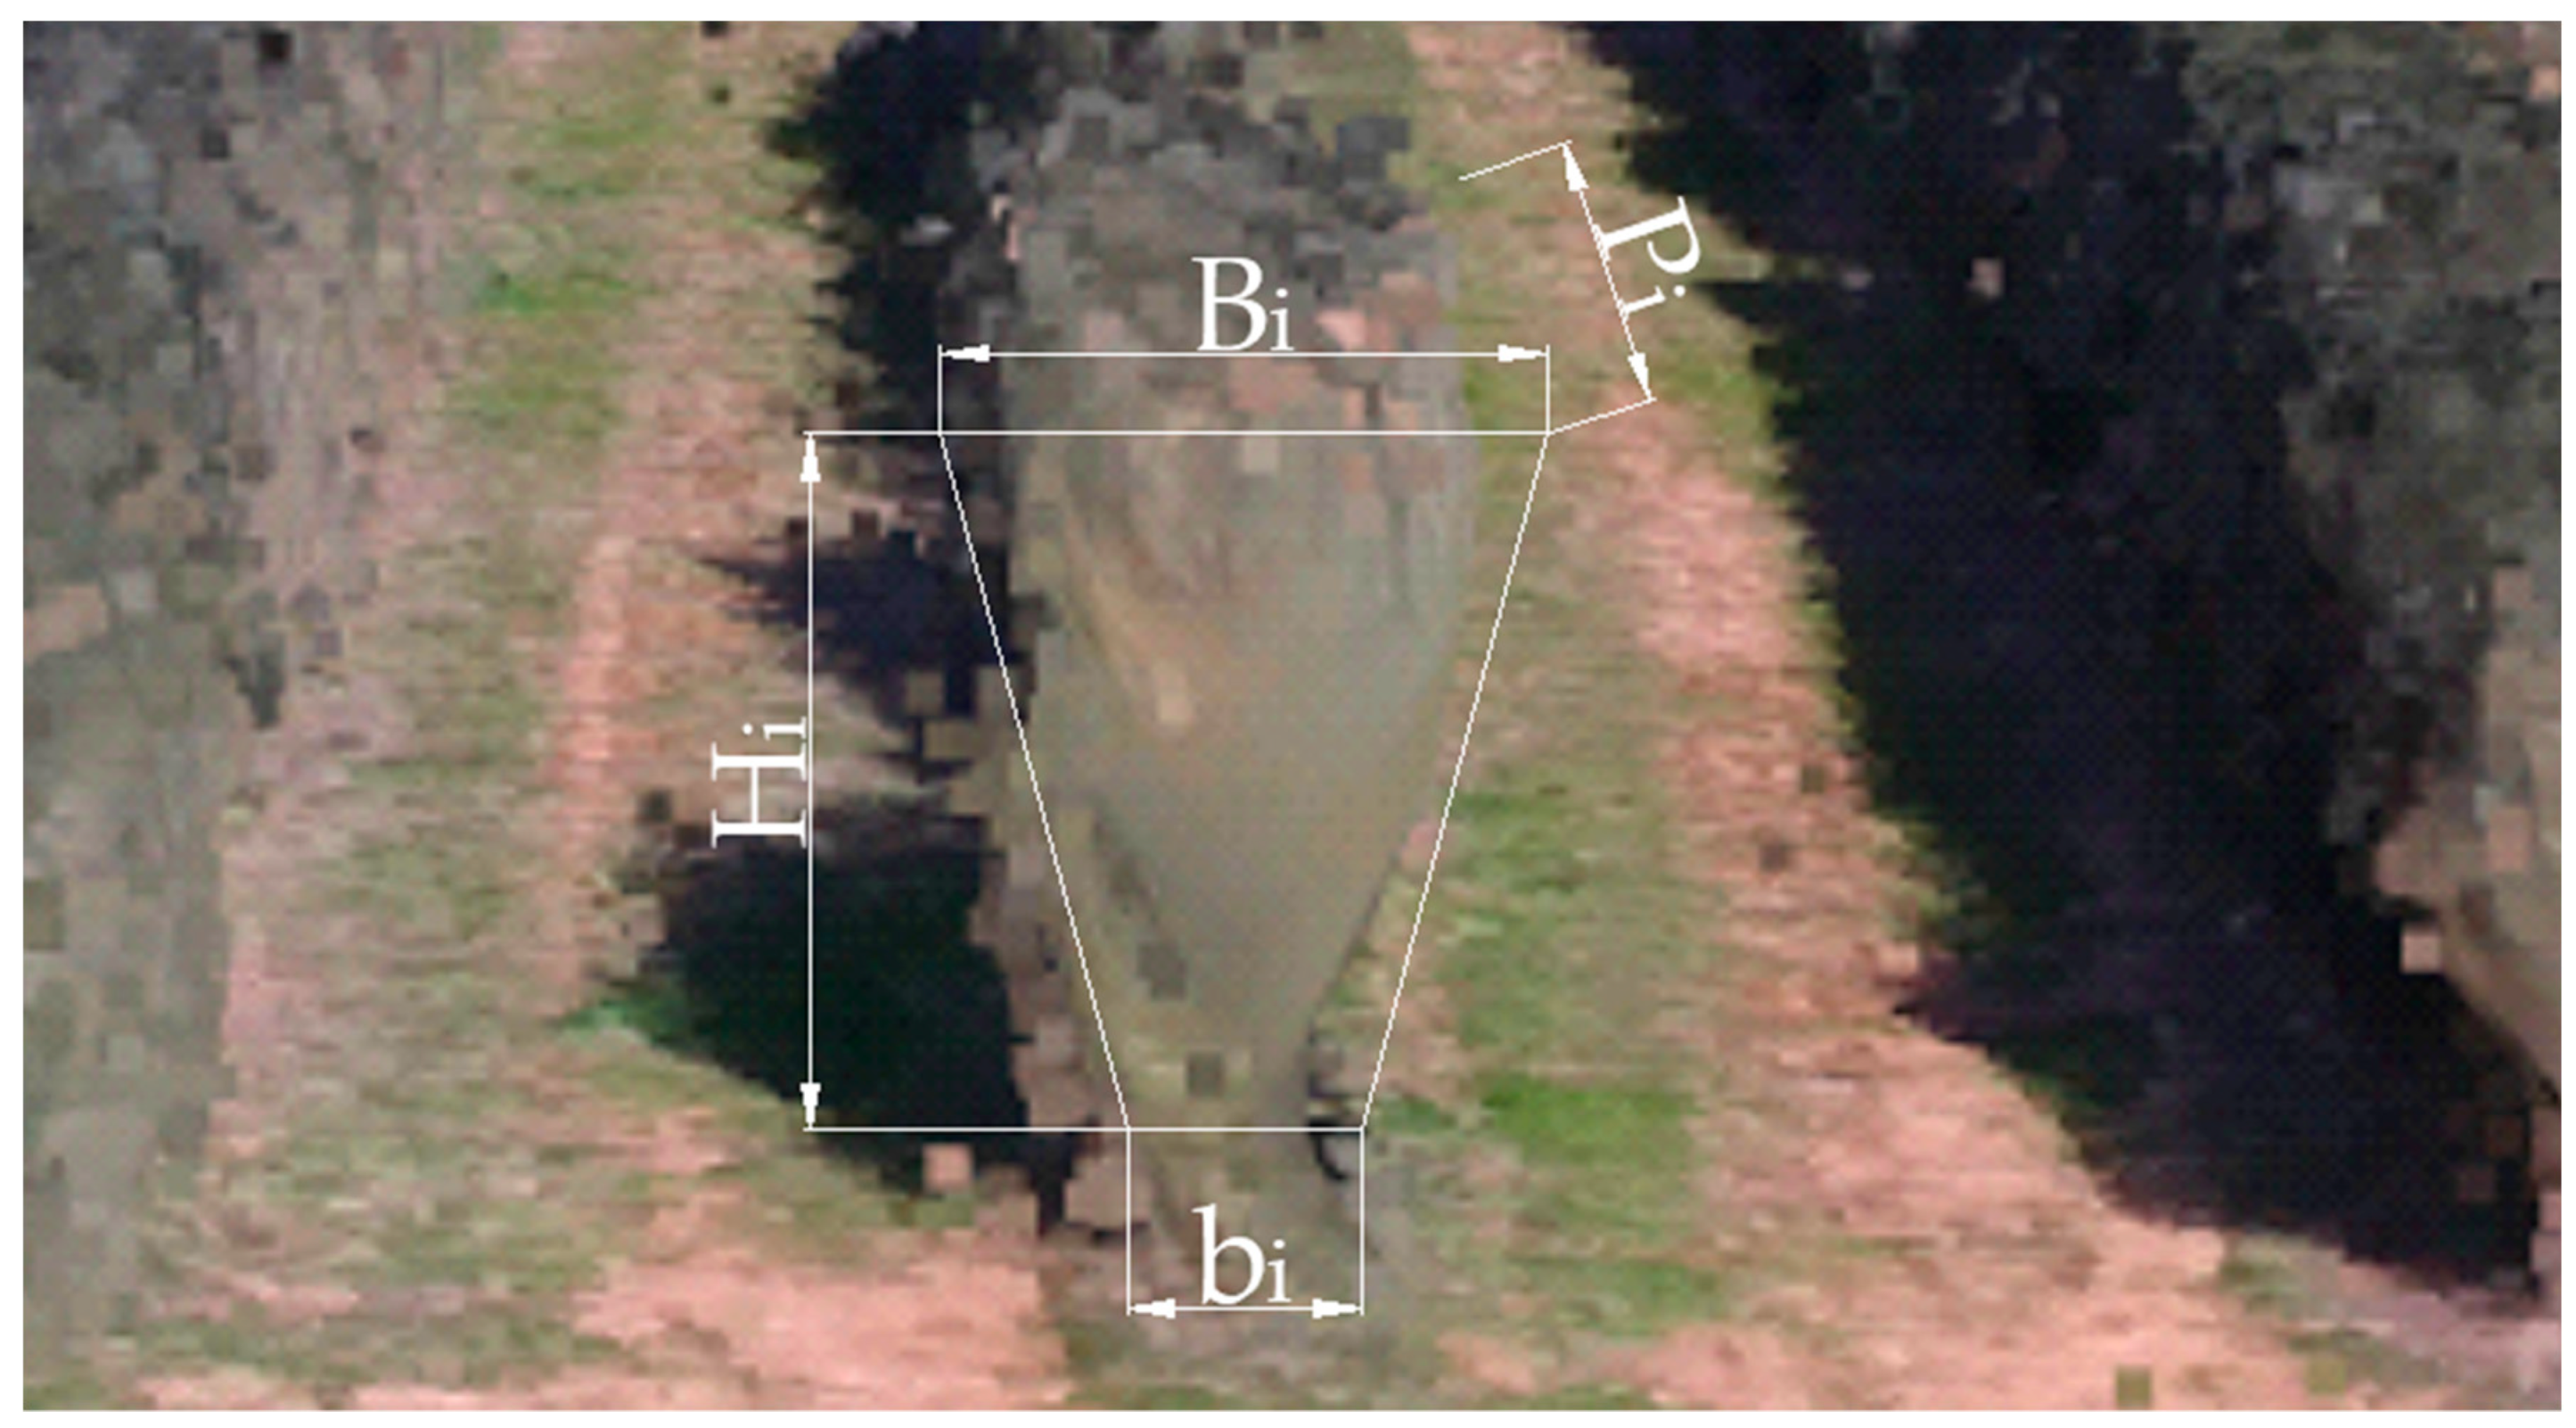
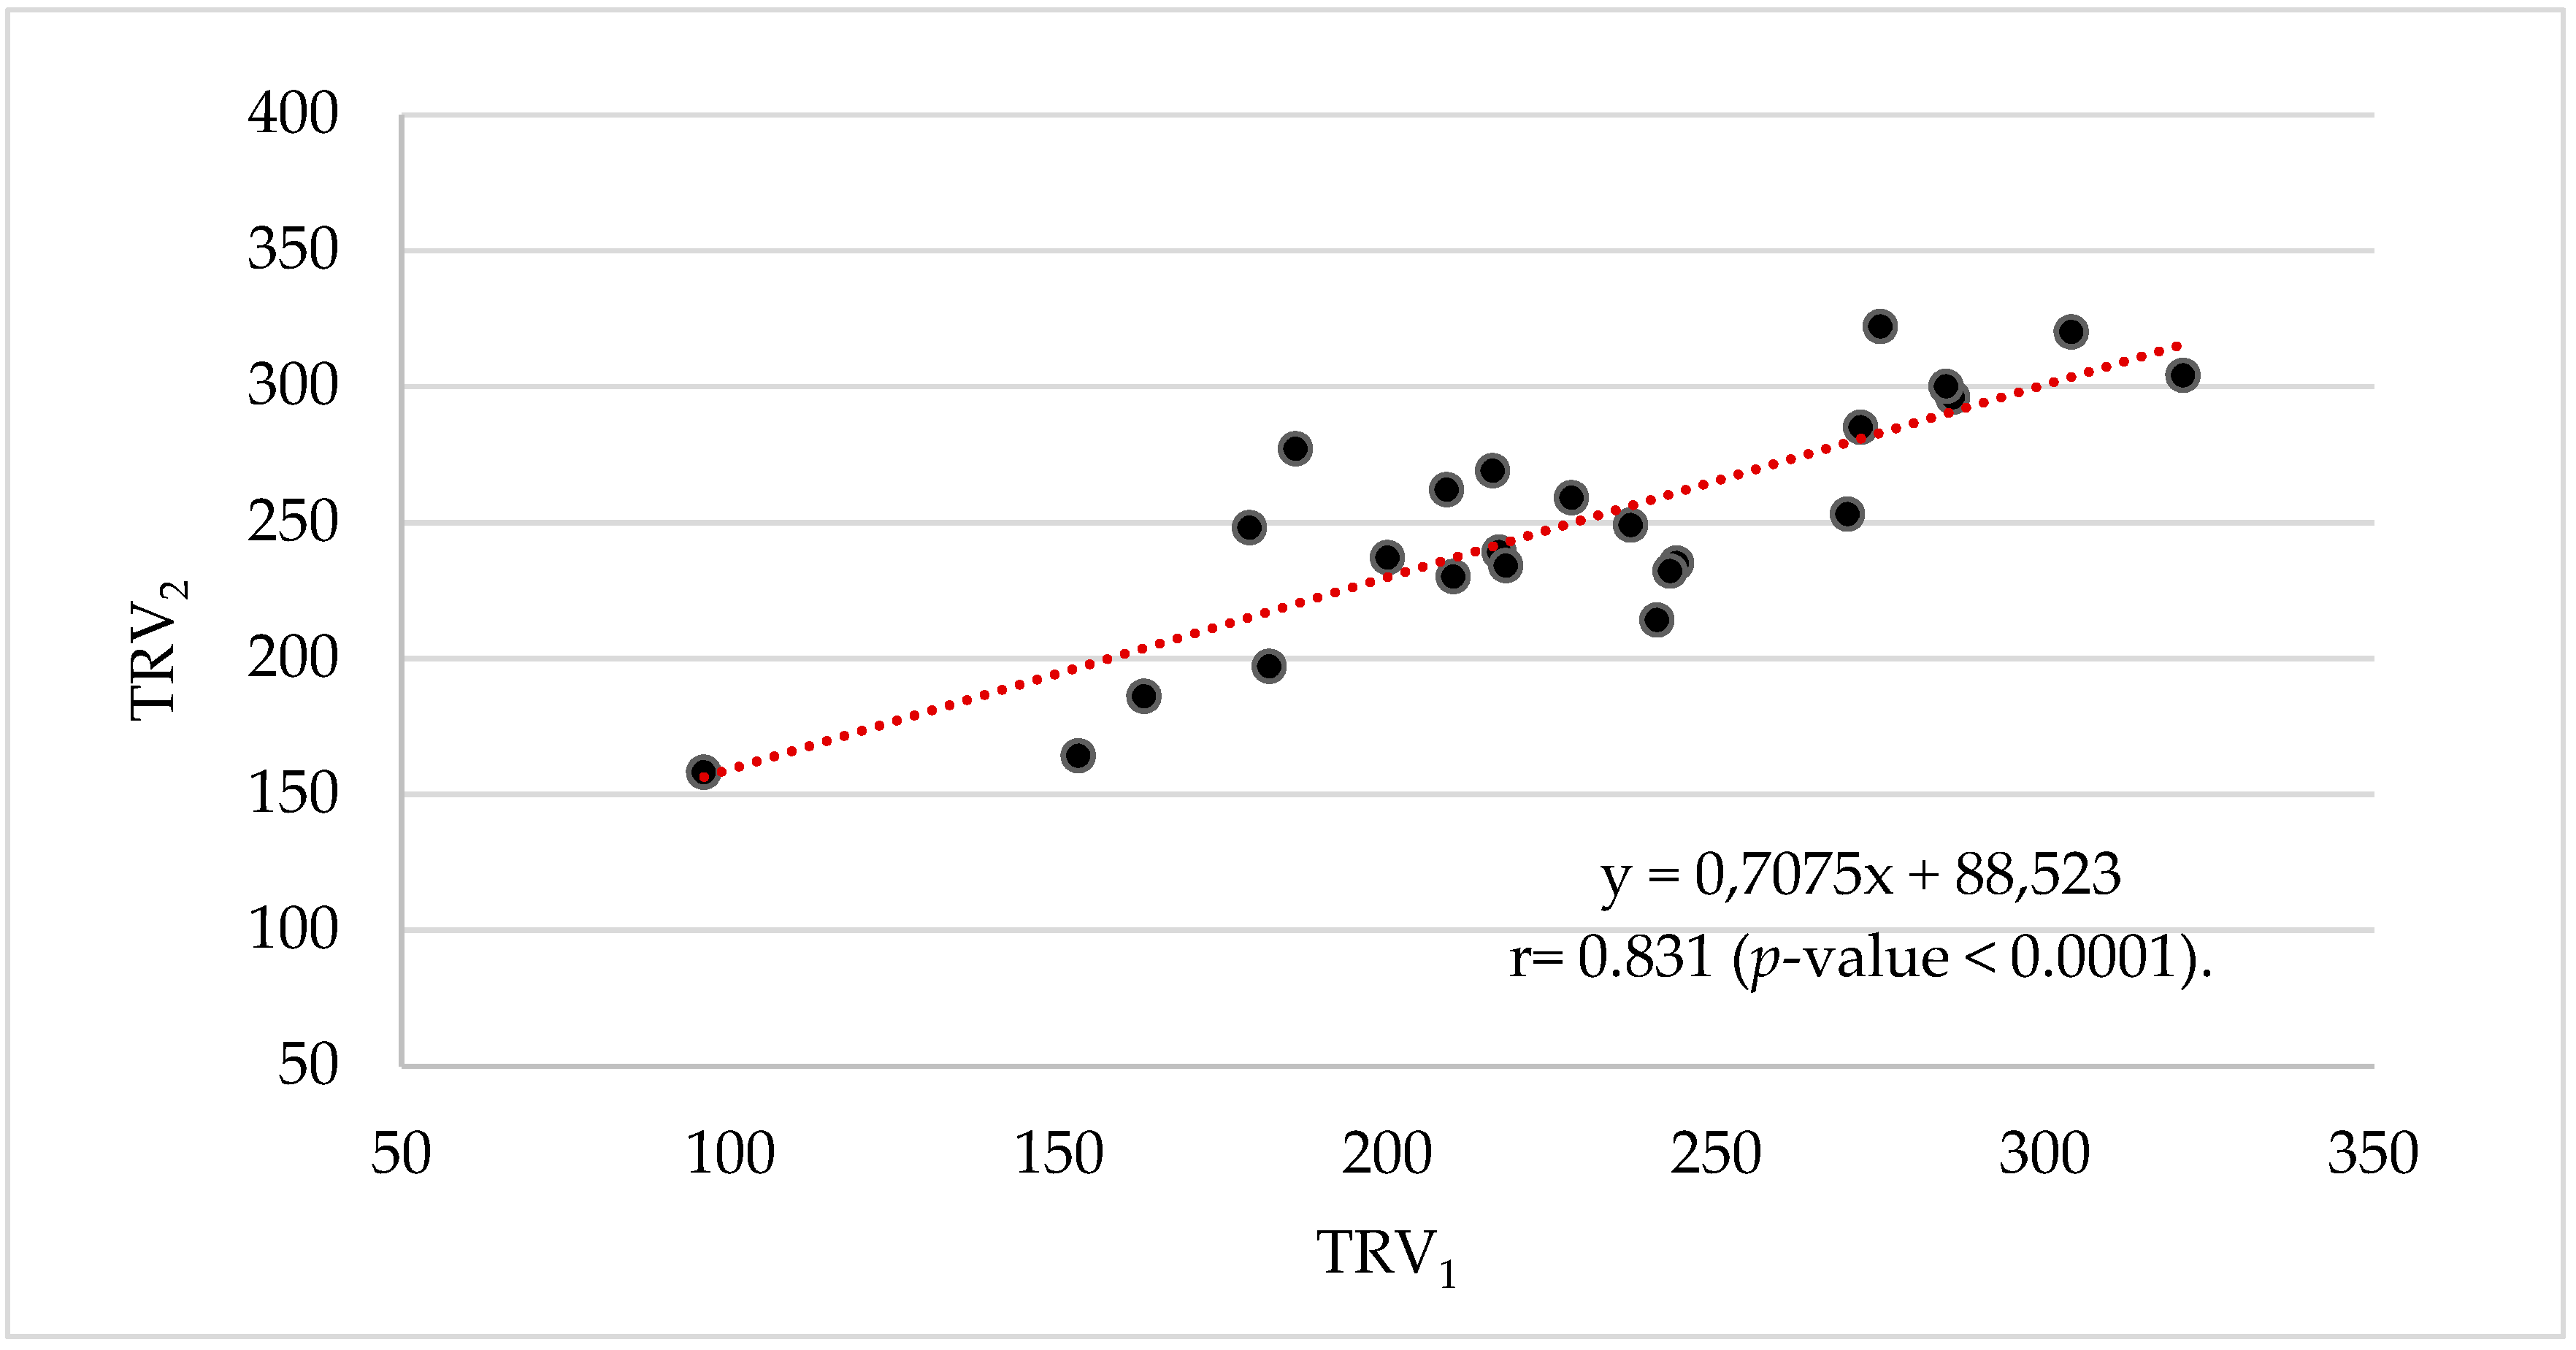
2.2. TRV2 Estimation

To estimate the TRV2 of the SHD olive grove, an in situ measurement, aimed at evaluating the TRV* of a single tree, was carried out by means of simple measuring instruments, such as an optical meter (Hilti PD-E, measuring range of 0–200 m, accuracy of ±0.001 m) and a portable GPS locator (GARMIN GPSMAP 64 S).
Once the TRV*s of 10 trees per row were calculated, the TRV2 of each row was evaluated by multiplying the number of trees in a single row by the mean value of the obtained TRV*s.
This technique can be divided into two phases: (1) acquisition of the tree biometric parameters in two sampling days, and (2) data analysis and tree volume processing by means of MS Excel software.
To evaluate each tree’s TRV*, the tree height was measured with a distance meter placed vertically on the ground. Measurements of the height of the vegetation and the height of the subcrown were then acquired, taking into proper consideration the real shape of each tree. Horizontally, the width of the tree crown was measured considering the end of the most protrusive branch.
To calculate the TRV*, the tree row geometry, considering its vertical section, was approximated after pruning to an isosceles trapezoid (Figure 6); in this way, the TRV* was determined by multiplying the trapezoid area by the crown dimension in its orthogonal directions (Formula (1)):
T R V 2 = n T R V a v g * = n i = 1 10 T R V i * 10 = n i = 1 10 ( B i + b i ) H i 2 P i 10
where n is the effective number of trees per row (n = N − M), N is the number of trees, M is the number of missing trees, TRV*avg is the average value of TRV* (m3), Bi is the crown transversal major extension (m), bi is the crown transversal minor extension (m), Hi is the crown height (m), and Pi is the crown longitudinal extension (m).
The trees crowns were highly linked to each other as a hedgerow; for this reason, P was assumed by the ratio of the entire length of the row per the number of trees of each row. Furthermore, b was assumed to be equal to 80% of B, since the base of a tree has lower vegetative growth than the apical zone and is similar to the geometry of an inverted truncated wedge. The value of 80% was obtained by measuring the average inclination of all sampling trees.
The advantages of using TRV2 include the possibility of sampling any type of tree, but above all, the simplicity of the necessary instrumentation. The drawback is the very long sampling time, which limits the number of samples that can be taken for each cultivar, and therefore, the statistical representativeness of the samples.

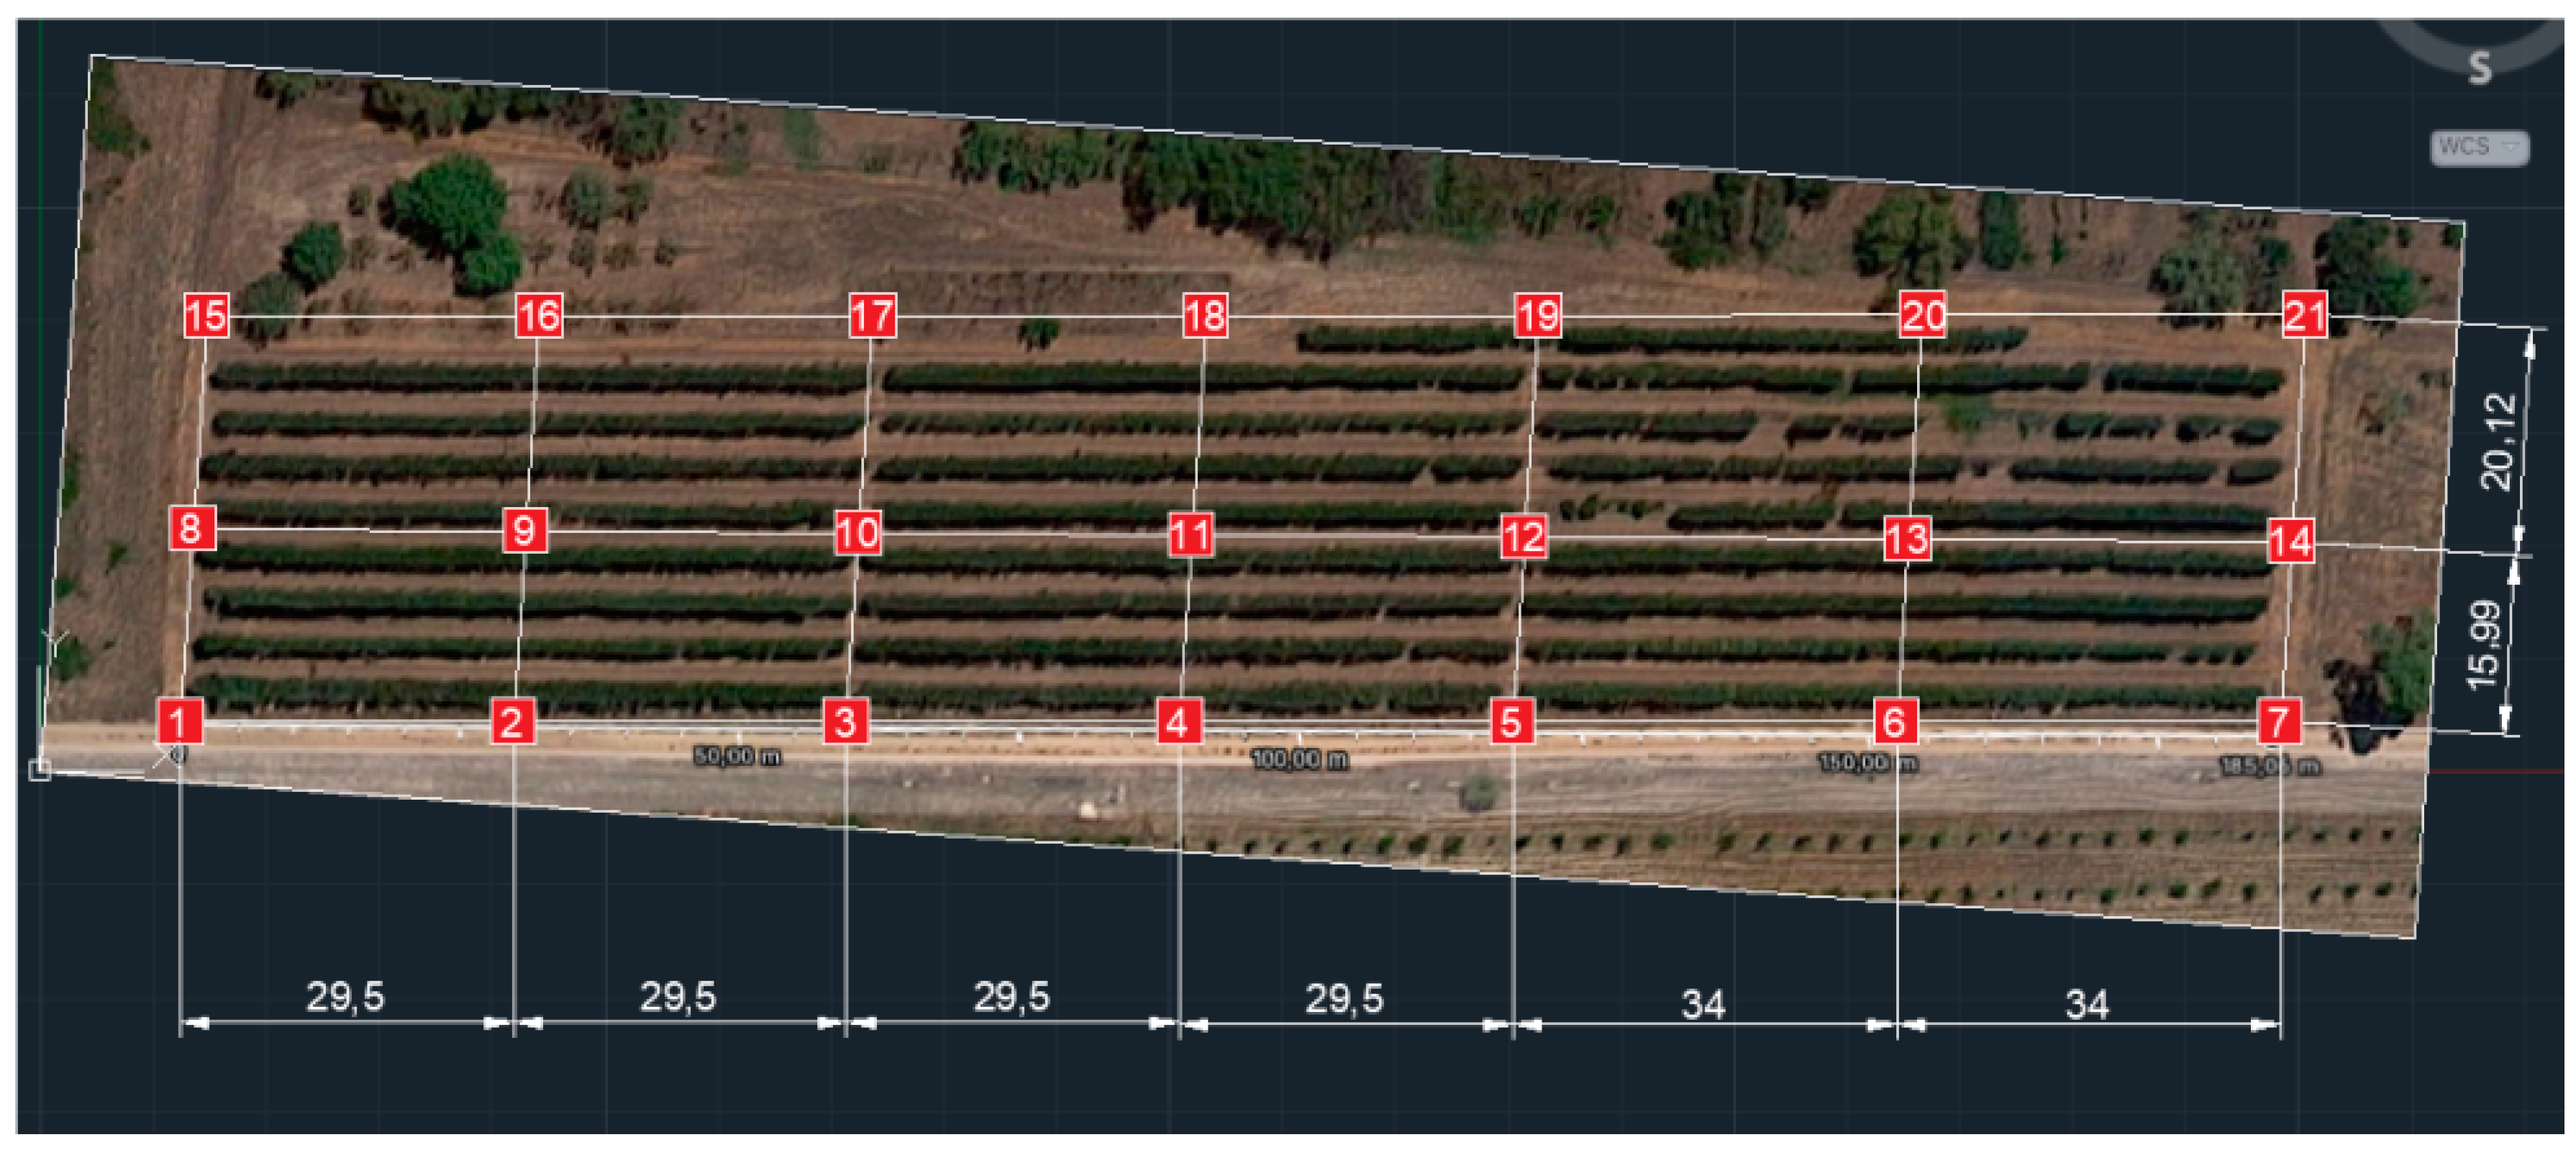
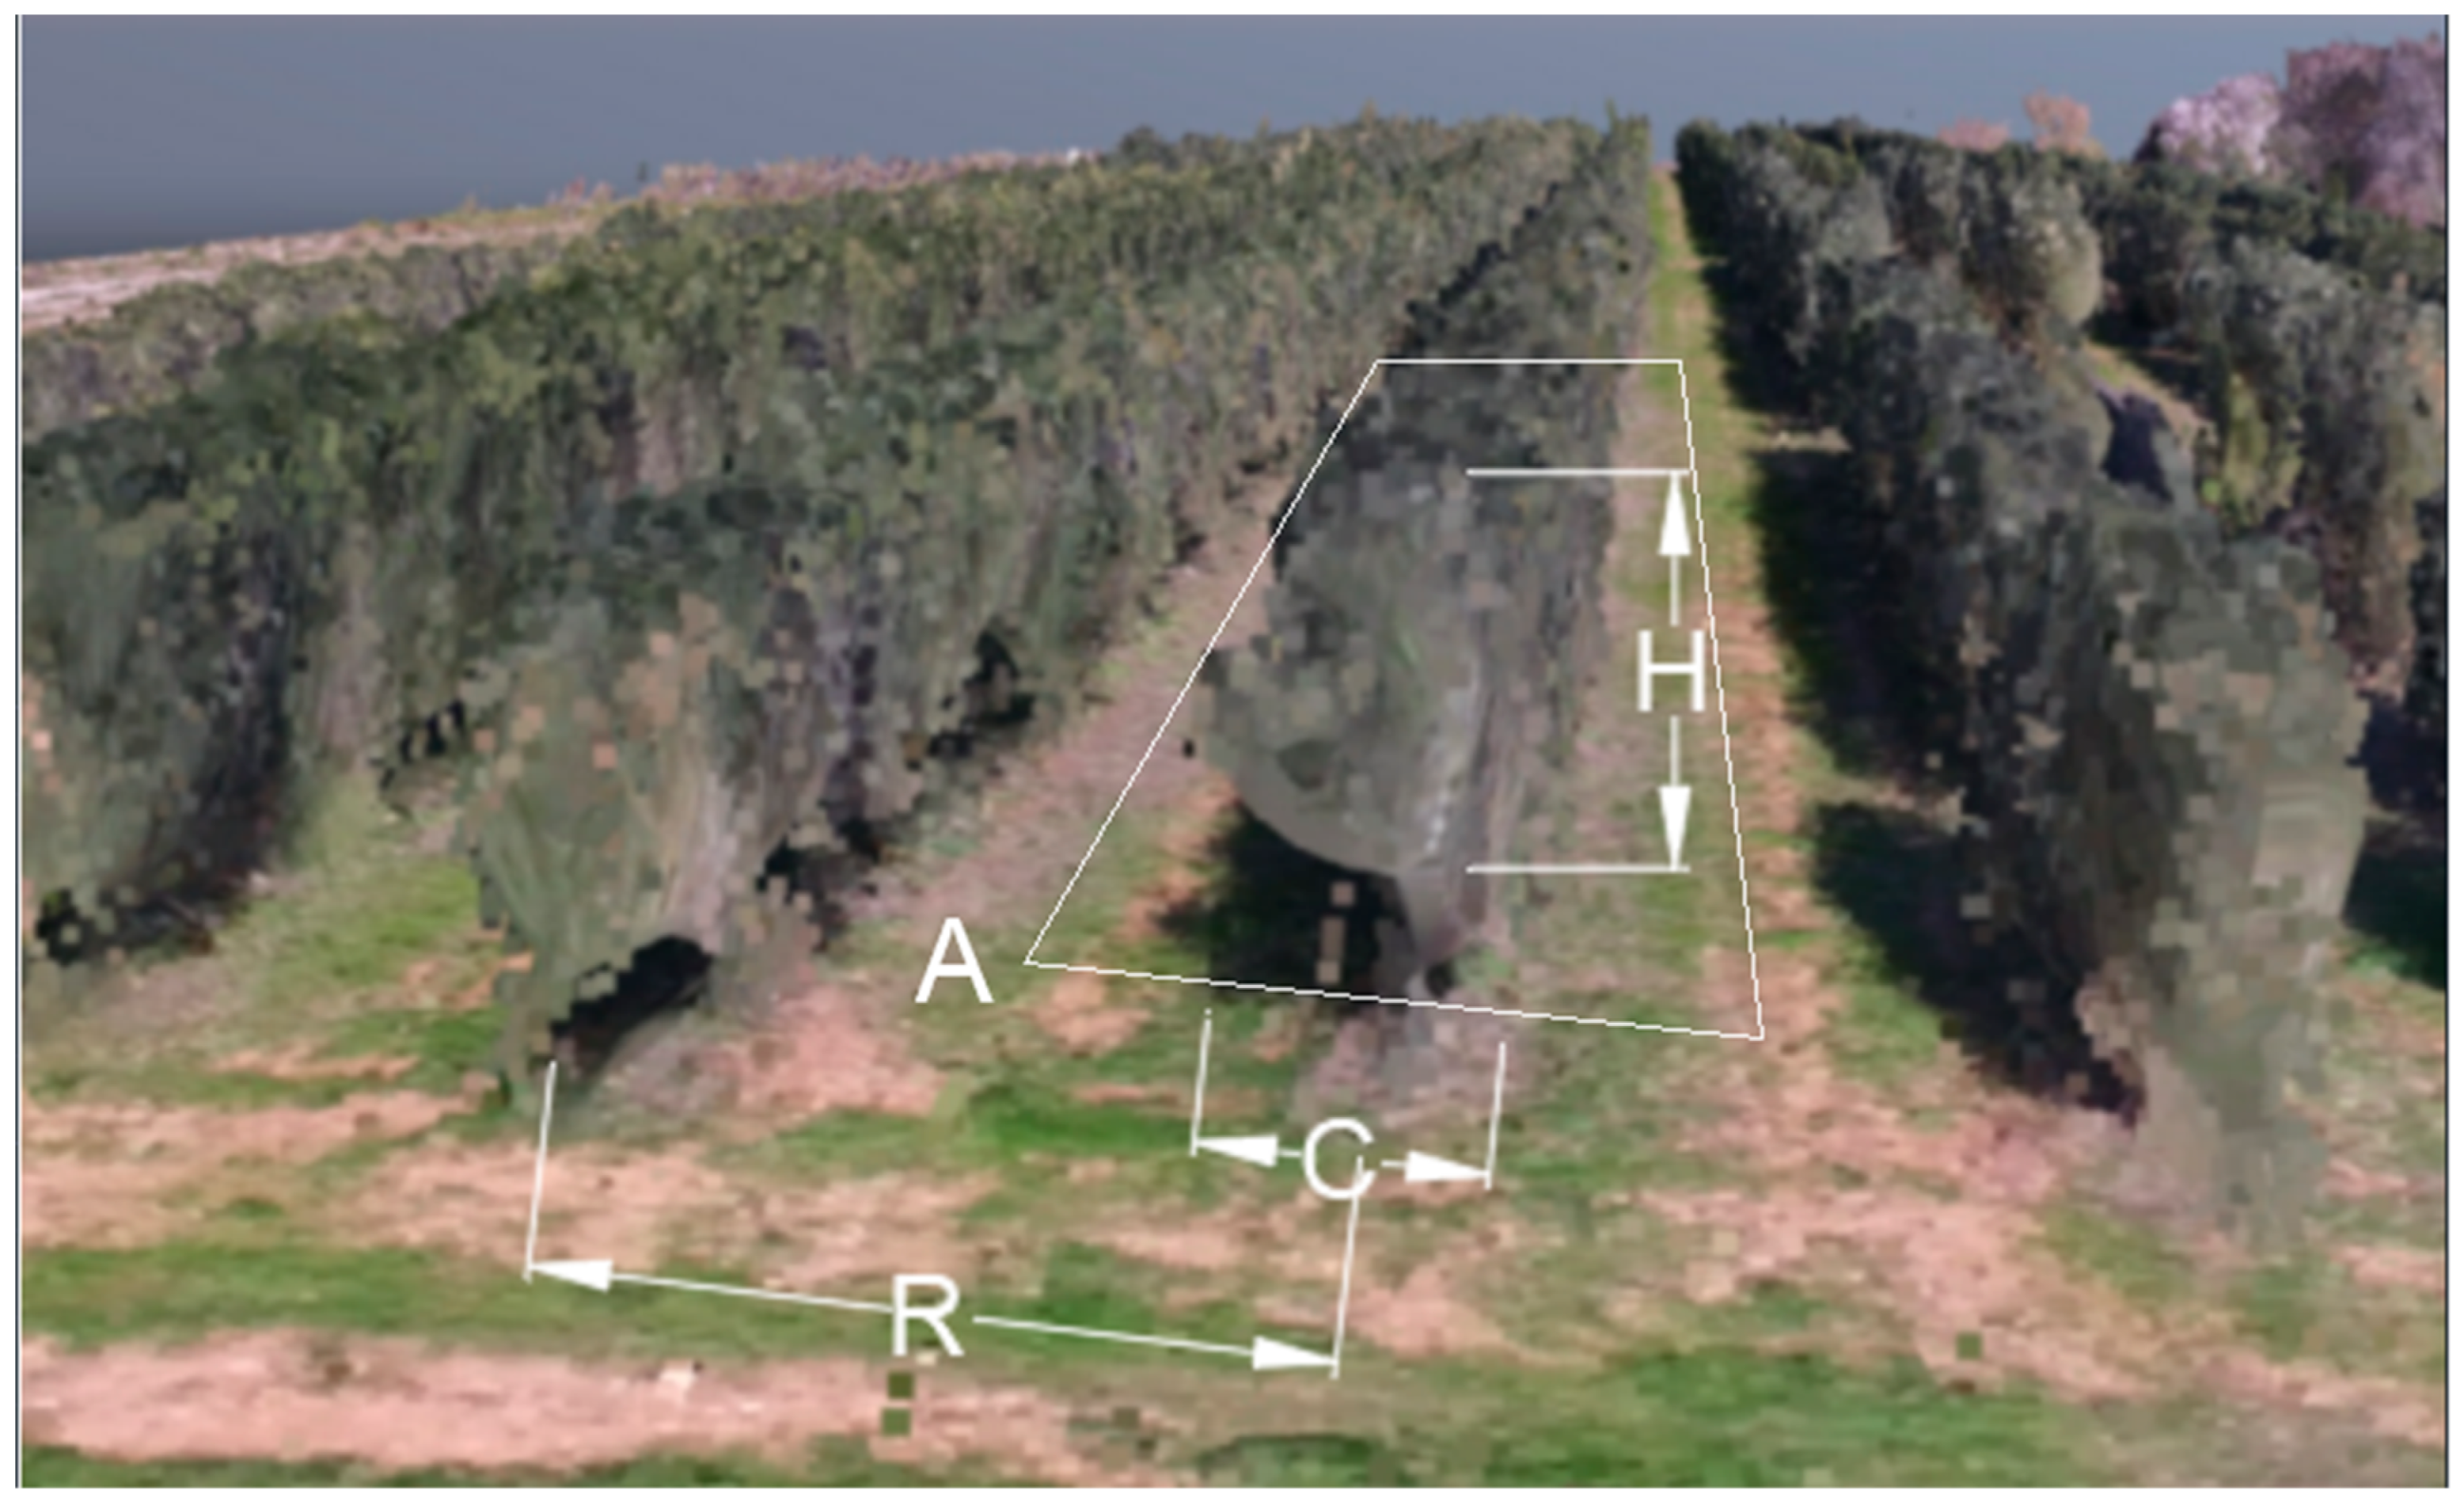
2.3. TRV3 Estimation

Finally, the third procedure, usually adopted for estimating TRV3 [24], consisted of multiplying the average values of the height and thickness of the crown for each row (Figure 7), multiplied by the area of 1 ha and divided by the inter-row width (Formula (2)). The crown was considered to be a rectangular shape. In our case study, as the surface was less than 1 ha, the general formula was revised by multiplying by the effective row ground area divided by 10,000 m2:
T R V 3 = H C 10000 R A 10000 = H C A R
where H is the average crown height in a row (m), C is the average crown thickness in a row (m), R is the inter-row width (m), and A is the effective row ground area (m2).
An overall graphical representation of the three used methods is reported in Figure 8. The TRV1 method allows for better reconstruction of the tree shape, unlike the TRV2 and TRV3 methods (Figure 8). However, the TRV2 method is based on field measurements (10 samples per row) and should be the most representative of reality. TRV3, that is, the traditional method, is the one that most differs from the true TRV value, as it is based on a rough estimate. It should also be pointed out that the TRV3 calculated in this paper is very precise, considering that all the dimensions used in Formula (2) were derived from the averages of the biometric parameters of 10 trees per row; in traditional practice, it is taken as a reference for the calculation of the TRV3 of a single pair of trees per hectare, which produces an estimated value that is very far from the true value.

3. Results

All the results obtained from each of the described methods are shown in Table 1. In particular, for the TRV1 method, the reported results were derived from the software evaluation; for the other two methods, all the parameters were used in their respective evaluation formulas (Formulas (1) and (2)).
The first statistical analysis of the three methods (TRV1, TRV2, and TRV3) on the 24 rows showed that, although the mean values of the three methods were very similar and the asymmetry was very low (close to zero), the standard deviation was very high and the kurtosis was very low compared with the threshold value of 3 of the Gaussian distributions for all of them (Table 2, Figure 9). This implies that the distribution of volumes cannot be considered Gaussian and the TRVs changed considerably from cultivar to cultivar, regardless of the method used.
Figure 10 and Figure 11 show the scatter plots related to the data couples TRV1–TRV2 and TRV1–TRV3, respectively. Each figure also displays the regression line evaluated in order to assess the correlation between the datasets used, with a confidence interval (CI) of 95%. The correlation between TRV1–TRV2 showed a Pearson’s coefficient r1–2 = 0.831 (p-value < 0.0001), while the correlation between TRV1–TRV3 showed a Pearson’s coefficient r1–3 = 0.874 (p-value < 0.0001). Both obtained results indicate that evaluating tree volume by UAVs has a high level of correlation with manual and traditional methods, regardless of the analyzed cultivar.
Although the regression lines show a high correlation index between the different methods used, it is of significance to analyze the differences between the absolute values measured by the three TRVs per each row considering TRV1 as the reference for the other two methods. In particular, the relative difference between TRV2 and TRV1 and between TRV3 and TRV1 was calculated.
The average value per row of the relative difference between TRV2 and TRV1 was equal to 13%, while the minimum value was equal to −11% for the Arbequina I cultivar and the maximum value was +65% for the replica of the Arbosana II cultivar (Figure 12). The outlier of 65% of the relative difference between TRV2 and TRV1 was mainly generated by the low density of the replica of the Arbosana II cultivar and the consequent underestimation effect of the volume generated by the 3D photogrammetry of the tree crowns. The average value per row of the relative difference between TRV3 and TRV1 was equal to +24%, while the minimum value was equal to 5% for the Arbequina I and Maurino cultivars and the maximum value was +58% for the Frantoio I cultivar.
From the difference of the mean values between the various cultivars of (TRV2 − TRV1)/(TRV1) and (TRV3 − TRV1)/(TRV1), it can be noted that the TRV1 method obtained average results lower than the TRV2 and TRV3 methods. This was due to the 3D modeling of the canopy that thickened the actual shape of the tree crown compared with the TRV2 and TRV3 methods.
Considering the total values of the volumes calculated with the three methods reported in Table 1, it is worth highlighting that TRV2 had a difference of 10% more than the total volume calculated with TRV1, and TRV3 had a difference of +23% more than the total volume calculated with TRV1. Also, in absolute terms, the TRV1 method succeeded in providing a better estimate of the canopy biomass, unlike TRV3, which always overestimated the volume of the tree crown.
The geometrical measurements shown in Table 1 for the TRV2 method, as mentioned before, correspond to the average of the measurements of 10 trees per row. This method is very laborious and requires a large number of specialized operators working in the field for hours. With TRV2, the surveys were carried out over two days, the data was backed up and processed in Excel in four days, and there were four operators employed. In comparison, the TRV1 method required about 15 min of flight per half hectare, 4–5 h of calculation using the software, and a single specialized operator.

4. Discussion

The respective Pearson coefficients that were calculated demonstrated that the correlation between the methods was high and the analysis was statistically significant.
In general, the 3D modeling technique (TRV1) underestimated crown volume with respect to the reference method (TRV2), which did not take into account the density of the vegetation and considered empty spaces as full. This effect was indeed related to canopy density and the architecture of the different cultivars under study.
Where the canopies were normally dense, which was the case for most of the cultivars, TRV1 “saw” all the effective density of vegetation. Indeed, the TRV1 technique underestimated the crown volume for the rows by about 40% with respect to the other two methods, as Cima di Bitonto, Koroneiki II, Frantoio I, Carolea, and Arbosana II were characterized by low canopy density and defoliated rows [2,26]. On the contrary, no significant differences between the first method and the other two were found for Arbequina I, which was characterized by a canopy density as dense as Arbequina III and Maurino.
The comparisons between TRV2–TRV1 and TRV3–TRV1 showed an average value of the difference of +13% (max: +65%, min: −11%; depending on the cultivar) and +24% (max: +58%, min: +5%; depending on the cultivar), respectively. The obtained results demonstrate that the TRV1 method is highly accurate at predicting the TRV and requires low labor effort and time expenditure for both olive trees and similar woody crops.
This result demonstrates that it is possible to measure the canopy volume in a super-high-density olive orchard using UAVs to improve the management of spatial variability and avoid tedious and time-consuming fieldwork in comparison with the other methods.
In this experiment, TRV3 was very accurate compared with the values usually determined by farmers because the data of the geometric dimensions of the trees were well known, but normally, the value of TRV3 is much higher and more inaccurate. The TRV3 method overestimated crown volume, especially for the cultivars Cima di Bitonto, Frantoio, and Carolea, which are characterized by very high vigor and a trapezoidal shape.
However, all the methods used allowed us to obtain the same statistical results, and this reinforces the correctness of the experimental analysis carried out in this work. This is one of the first studies aimed at evaluating the tree row volume of a large number of cultivated genotypes for an SHD olive orchard using UAV photogrammetry and 3D modeling techniques and comparing them with other TRV evaluation methods.
The use of UAVs improves the management of spatial variability and avoids intensive fieldwork. The traditional method (TRV3) has very rough TRV estimation errors; in the present work, it was +23%. The error was related to some genetic characteristics of the cultivars, such as tree vigor, crown architecture, and density. An estimate so coarse leads to cascading errors for the estimation of the leaf mass, the quantity of pesticides to be used in the field, and the estimate of the quantity of water for irrigation. The TRV1 method can obtain greater definition with respect to traditional surveys and provides the possibility of reaching otherwise inaccessible areas in a time- and cost-saving manner. Furthermore, it guarantees the analysis of very large areas in a very short time and high survey precision. Finally, the main limitation of the first method is that professionally skilled personnel is required; in fact, the analysis and 3D modeling of the foliage assume that the operator has specific knowledge of flight and photogrammetry techniques and knows how to use complicated hardware and software equipment. It must also be considered however, that today technology has playing a major role in managing different needs of the agricultural industry, as the reduction of energy [27,28], agricultural biomass [29] and working time [30] and then increasingly specialized agricultural operators are required.

Author Contributions

Data curation, A.S.A., S.C. and G.A.V.; Formal analysis, A.S.A.; Investigation, A.S.A.; Methodology, A.S.A.; Software, A.S.A.; Supervision, S.C. and S.P.; Validation, G.A.V.; Writing—original draft, A.S.A. and F.S.; Writing—review & editing, A.S.A.

Funding

This research was funded by FONDAZIONE PUGLIA (Bari, Italy) to support the project “Messa a punto di un trattore agricolo a profilo compatto per le lavorazioni nelle coltivazioni arboree specializzate”.

Conflicts of Interest

The authors declare no conflict of interest.

References

  1. Camposeo, S.; Vivaldi, G.A. Short-term effects of de-oiled olive pomace mulching application on a young super high-density olive orchard. Sci. Hortic. 2011, 129, 613–621. [Google Scholar] [CrossRef]
  2. Caruso, T.; Campisi, G.; Marra, F.P.; Camposeo, S.; Vivaldi, G.A.; Proietti, P.; Nasini, L. Growth and yields of the cultivar Arbequina in high density planting systems in three different olive growing areas in Italy. Acta Hortic. 2014, 1057, 341–348. [Google Scholar] [CrossRef]
  3. Connor, D.J.; Gómez-del-Campo, M. Simulation of oil productivity and quality of N-S oriented olive hedgerow orchards in response to structure and interception of radiation. Sci. Hortic. 2013, 150, 90–99. [Google Scholar] [CrossRef]
  4. Díez, C.M.; Moral, J.; Cabello, D.; Morello, P.; Rallo, L.; Barranco, D. Cultivar and tree density as key factors in the long-term performance of super high-density olive orchards. Front. Plant Sci. 2016, 7, 1226. [Google Scholar] [CrossRef] [PubMed]
  5. Dewi, C.; Chen, R.-C. Decision making based on IoT data collection for precision agriculture. Stud. Comput. Intell. 2019, 830, 31–42. [Google Scholar]
  6. Comba, L.; Biglia, A.; Ricauda Aimonino, D.; Gay, P. Unsupervised detection of vineyards by 3D point-cloud UAV photogrammetry for precision agriculture. Comput. Electron. Agric. 2018, 155, 84–95. [Google Scholar] [CrossRef]
  7. De Castro, A.I.; Jiménez-Brenes, F.M.; Torres-Sánchez, J.; Peña, J.M.; Borra-Serrano, I.; López-Granados, F. 3-D characterization of vineyards using a novel UAV imagery-based OBIA procedure for precision viticulture applications. Remote Sens. 2018, 10, 584. [Google Scholar] [CrossRef]
  8. Castrignanò, A.; Buttafuoco, G.; Quarto, R.; Parisi, D.; ViscarraRossel, R.A.; Terribile, F.; Langella, G.; Venezia, A. A geostatistical sensor data fusion approach for delineating homogeneous management zones in Precision Agriculture. CATENA 2018, 167, 293–304. [Google Scholar] [CrossRef]
  9. Zarco-Tejada, P.J.; Camino, C.; Beck, P.S.A.; Calderon, R.; Hornero, A.; Hernández-Clemente, R.; Kattenborn, T.; Montes-Borrego, M.; Susca, L.; Morelli, M.; et al. Previsual symptoms of xylellafastidiosa infection revealed in spectral plant-trait alterations. Nat. Plants 2018, 4, 432–439. [Google Scholar] [CrossRef]
  10. Gavioli, A.; de Souza, E.G.; Bazzi, C.L.; Schenatto, K.; Betzek, N.M. Identification of management zones in precision agriculture: An evaluation of alternative cluster analysis methods. Biosyst. Eng. 2019, 181, 86–102. [Google Scholar] [CrossRef]
  11. Ezenne, G.I.; Jupp, L.; Mantel, S.K.; Tanner, J.L. Current and potential capabilities of UAS for crop water productivity in precision agriculture. Agric. Water Manag. 2019, 218, 158–164. [Google Scholar] [CrossRef]
  12. Malambo, L.; Popescu, S.C.; Murray, S.C.; Putman, E.; Pugh, N.A.; Horne, D.W.; Richardson, G.; Sheridan, R.; Rooney, W.L.; Avant, R.; et al. Multitemporal field-based plant height estimation using 3D point clouds generated from small unmanned aerial systems high-resolution imagery. Int. J. Appl. Earth Obs. Geoinf. 2018, 64, 31–42. [Google Scholar] [CrossRef]
  13. Torres-Sánchez, J.; López-Granados, F.; Serrano, N.; Arquero, O.; Fernández-Escobar, R.; Peña, J.M. Characterizing olive tree geometric features using unmanned aerial vehicle (UAV) images. In Proceedings of the International Conference for Olive Tree and Olive Products, Amman, Jordan, 3–6 November 2014. [Google Scholar]
  14. Torres-Sánchez, J.; López-Granados, F.; Peña, J.M. An automatic objectbased method for optimal thresholding of remotely-sensed data: Application for vegetation detection in herbaceous crops from UAV images. Comput. Electron. Agric. 2015, 114, 43–52. [Google Scholar] [CrossRef]
  15. Torres-Sánchez, J.; de Castro, A.I.; Peña, J.M.; Jiménez-Brenes, F.M.; Arquero, O.; Lovera, M.; López-Granados, F. Mapping the 3D structure of almond trees using UAV acquired photogrammetric point clouds and object-based image analysis. Biosyst. Eng. 2018, 176, 172–184. [Google Scholar] [CrossRef]
  16. Jiménez-Brenes, F.M.; López-Granados, F.; De Castro, A.I.; Torres-Sánchez, J.; Serrano, N.; Peña, J.M. Quantifying pruning impacts on olive tree architecture and annual canopy growth by using UAV-based 3D modelling. Plant Methods 2017, 13, 55. [Google Scholar] [CrossRef] [PubMed]
  17. Peña, J.M.; De Castro, A.I.; Torres-Sánchez, J.; Andújar, D.; San Martín, C.; Dorado, J.; Fernández-Quintanilla, C.; López-Granados, F. Estimating tree height and biomass of a poplar plantation with image-based UAV technology. AIMS Agric. Food 2018, 3, 313–326. [Google Scholar] [CrossRef]
  18. Whalley, J.L.; Shanmuganathan, S. Applications of image processing in viticulture: A review. In Triple S: A New Tool for Soybean High Throughput Phenotyping from Uas-Based Multispectral Imagery (2013) SPIE Defense + Commercial Sensing, Proceedings of the 20th International Congress on Modelling and Simulation, Adelaide, Australia, 1–6 December 2013; Herrero-Huerta, M., Govindarajan, S., Cherkauer, K., Rainey, K., Eds.; International Society for Optics and Photonics. SPIE: Baltimore, MD, USA, 2019; pp. 1007–1020. [Google Scholar]
  19. Ampatzidis, Y.; Partel, V. UAV-based high throughput phenotyping in citrus utilizing multispectral imaging and artificial intelligence. Remote Sens. 2019, 11, 410. [Google Scholar] [CrossRef]
  20. Sanz, R.; Llorens, J.; Escolà, A.; Arnó, J.; Planas, S.; Román, C.; Rosell-Polo, J.R. LIDAR and non-LIDAR-based canopy parameters to estimate the leaf area in fruit trees and vineyard. Agric. For. Meteorol. 2018, 260–261, 229–239. [Google Scholar] [CrossRef]
  21. Herrero-Huerta, M.; Felipe-García, B.; Belmar-Lizarán, S.; Hernández-López, D.; Rodríguez-Gonzálvez, P.; González-Aguilera, D. Dense canopy height model from a low-cost photogrammetric platform and LiDAR data. Trees Struct. Funct. 2016, 30, 1287–1301. [Google Scholar] [CrossRef]
  22. Wallace, L.; Lucieer, A.; Malenovskỳ, Z.; Turner, D.; Vopěnka, P. Assessment of forest structure using two UAV techniques: A comparison of airborne laser scanning and structure from motion (SfM) point clouds. Forests 2016, 7, 62. [Google Scholar] [CrossRef]
  23. González-Jaramillo, V.; Fries, A.; Bendix, J. AGB estimation in a tropical mountain forest (TMF) by means of RGB and multispectral images using an unmanned aerial vehicle (UAV). Remote Sens. 2019, 11, 1413. [Google Scholar] [CrossRef]
  24. Codis, S.; Carra, M.; Delpuech, X.; Montegano, P.; Nicot, H.; Ruelle, B.; Ribeyrolles, X.; Savajols, B.; Vergès, A.; Naud, O. Dataset of spray deposit distribution in vine canopy for two contrasted performance sprayers during a vegetative cycle associated with crop indicators (LWA and TRV). Data Br. 2018, 18, 415–421. [Google Scholar] [CrossRef] [PubMed]
  25. Herrero-Huerta, M.; Rainey, K.M. High throughput phenotyping of physiological growth dynamics from uas-based 3D modeling in soybean. Int. Arch. Photogramm. Remote Sens. Spat. Inf. Sci. ISPRS Arch. 2019, 42, 357–361. [Google Scholar] [CrossRef]
  26. Camposeo, S.; Godini, A. Preliminary observations about the performance of 13 varieties according to the super high density oliveculture training system in Apulia (southern Italy). Adv. Hortic. Sci. 2010, 24, 16–20. [Google Scholar]
  27. Anifantis, A.S.; Pascuzzi, S.; Scarascia-Mugnozza, G. Geothermal source heat pump performance for a greenhouse heating system: An experimental study. J. Agric. Eng. 2016, 47, 164–170. [Google Scholar] [CrossRef]
  28. Anifantis, A.S. Performance assessment of photovoltaic, ground source heat pump and hydrogen heat generator in a stand-alone systems for greenhouse heating. Chem. Eng. Trans. 2017, 58, 511–516. [Google Scholar]
  29. Russo, G.; Verdiani, G.; Anifantis, A.S. Re-use of agricultural biomass for nurseries using proximity composting. Contemp. Eng. Sci. 2016, 9, 1151–1182. [Google Scholar] [CrossRef]
  30. Bulgakov, V.; Pascuzzi, S.; Santoro, F.; Anifantis, A.S. Mathematical Model of the Plane-Parallel Movement of the Self-Propelled Root-Harvesting Machine. Sustainability 2018, 10, 378. [Google Scholar] [CrossRef]
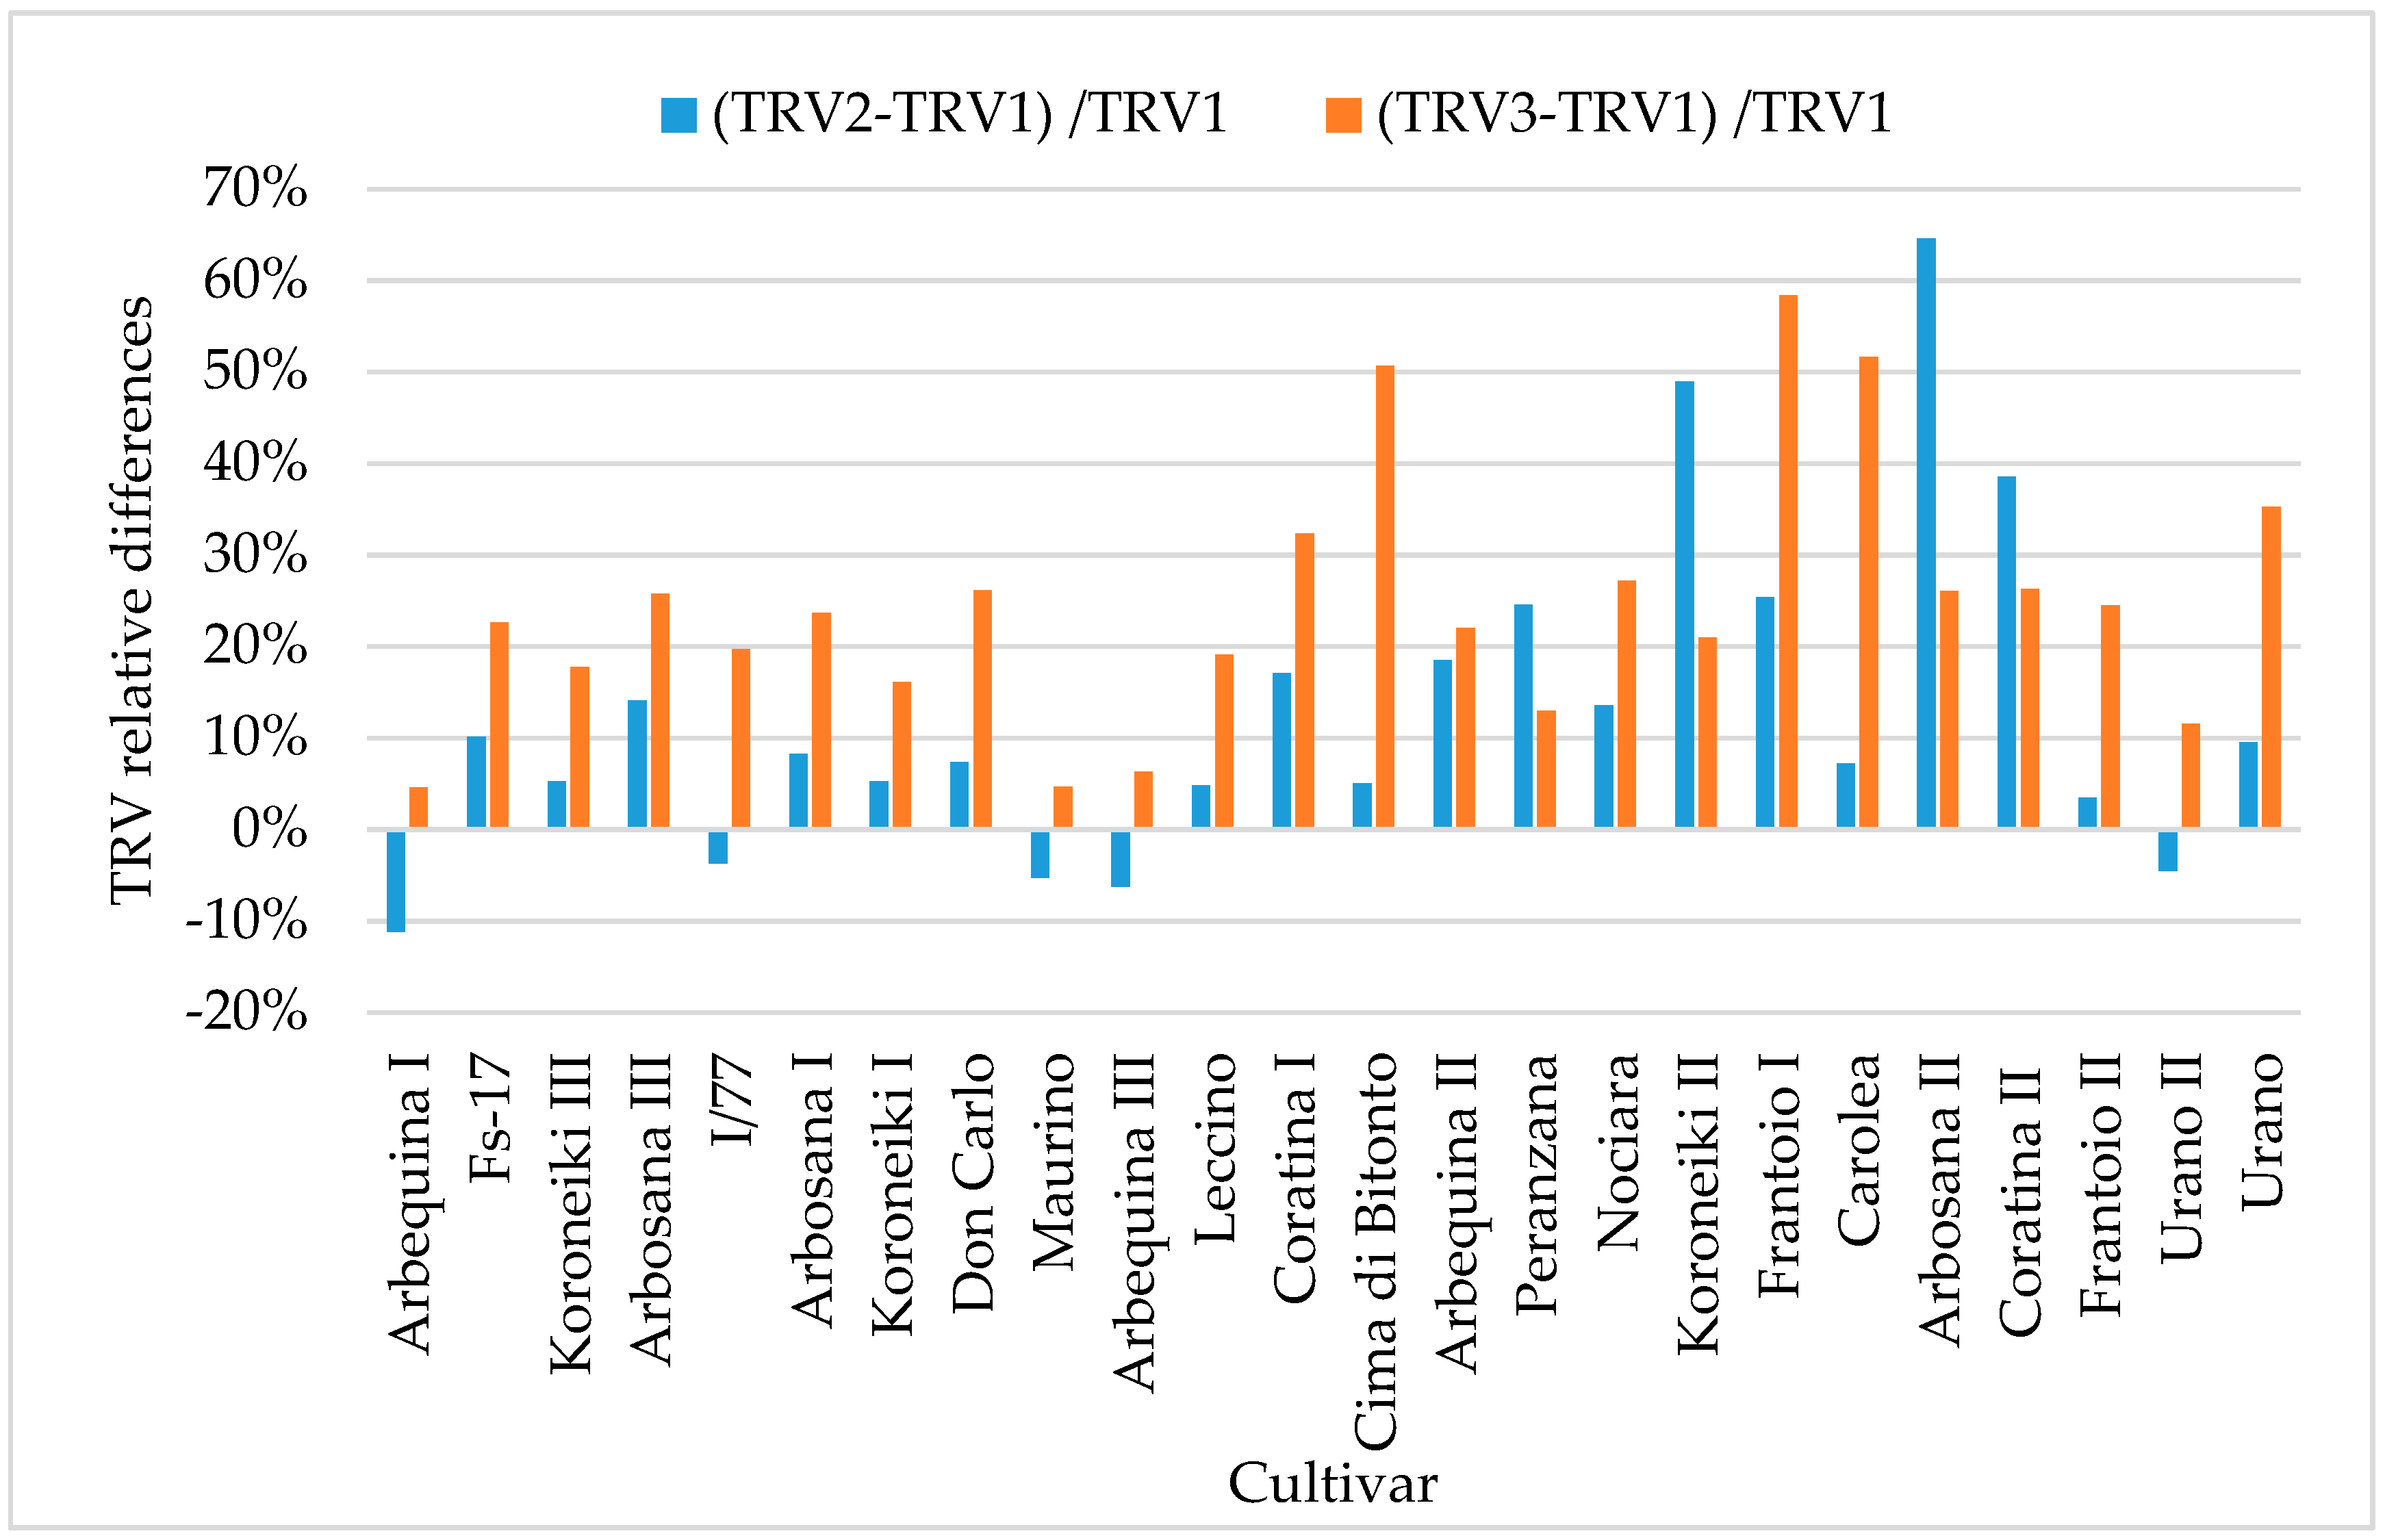
Figure 1. Workflow of the tree row volume (TRV) tree detection process with three different methods. TRV1—UAV method: (a) UAV (unmanned aerial vehicle) image acquisition, (b) RGB images processing, (c) 3D point cloud map computation, and (d) TRV1 calculation. TRV2—manual method: (e) manual measurement of the tree geometry, (f) determination of the TRV of each tree, (g) calculation of the average TRV of trees of each cultivar, and (h) evaluation of the average canopy volume for each species of cultivar. TRV3—traditional method: (i) acquisition of field area and number of rows, (l) TRV traditional mathematical formula, and (m) TRV calculation. (n) Correlation between TRV1 and TRV2. (o) Correlation between TRV3 and TRV2.
Agriculture 09 00233 g001
Figure 2. General location of the study area: (a) Apulia region, Italy; (b) overview of the image obtained by satellite of the area under study.
Agriculture 09 00233 g002
Figure 3. Experimental olive orchard, row numbers, and cultivars.
Agriculture 09 00233 g003
Figure 4. Ground control point (GCP) positions and field size of the experimental olive orchard.
Agriculture 09 00233 g004
Figure 5. TRV estimations with UAV close-range photogrammetry and 3D modeling: (a) UAV image acquisition, (b) RGB image processing, (c) 3D point cloud map computation, and (d) TRV1 calculation.
Agriculture 09 00233 g005
Figure 6. Tree crown geometry for the TRV2 estimation method.
Agriculture 09 00233 g006
Figure 7. Tree crown geometry for the TRV3 estimation method.
Agriculture 09 00233 g007
Figure 8. Different volumetric representations of tree crowns in the super-high-density olive orchard following three different TRV estimation methods (TRV1, TRV2, and TRV3).
Agriculture 09 00233 g008
Figure 9. Statistical analysis of the three distributions of the TRVs.
Agriculture 09 00233 g009
Figure 10. Linear regression graph between TRV1 and TRV2.
Agriculture 09 00233 g010
Figure 11. Linear regression graph between TRV3 and TRV1.
Agriculture 09 00233 g011
Figure 12. Differences between the absolute values measured by the three TRVs per row.
Agriculture 09 00233 g012
Table 1. Results of the three different methods for calculating tree row volume (TRV).
RowCultivarTRV1 (m3)NMTRV*avg (m3)TRV2 (m3)C (m)H (m)R (m)A (m2)TRV3 (m3)
1Arbequina I2413715.952141.752.124272252
2Fs-172173826.642391.902.374236266
3Koroneiki III3043808.423202.302.644236358
4Arbosana III1633815.031861.452.404236205
5I/772443757.342351.772.804236292
6ArbosanaI1823915.171971.472.254272225
7Koroneiki I2853807.903001.702.864272331
8Don Carlo2183726.692341.702.744236275
9Maurino3213708.203041.903.004236336
10Arbequina III2703816.852531.802.704236287
11Leccino2723717.912851.952.824236324
12Coratina I2753839.203221.902.824272364
13Cima di Bitonto2373998.292491.832.874272357
14Arbequina II2003706.402371.452.854236244
15Peranzana2163837.672691.402.964236244
16Nociara2283817.012591.623.034236290
17Koroneiki II1863628.162771.302.944236225
18Frantoio I2093689.022621.652.954272331
19Carolea15338107.111641.502.274272232
20Arbosana II963724.271580.902.274236121
21Coratina II1793826.902481.302.954236226
22Frantoio II2863838.452962.042.964236356
23Urano II2433726.622321.822.524236271
24Urano2103846.762301.792.334272284
TOTAL5435 5970 6696
Table 2. Statistical output of the dataset from the three different methods for calculating tree row volume (TRV; m3).
TRV1TRV2TRV3
Mean226249279
Median223249280
Standard deviation524559
Skewness−0.38−0.30−0.55
Kurtosis0.34−0.260.54

