Article

Efficiency in the Rice Farming: Evidence from Northwest Bangladesh

by
Shokhrukh-Mirzo Jalilov
1,*,
Mohammed Mainuddin
1,
Md. Maniruzzaman
2,
Md. Mahbubul Alam
2,
Md. Towfiqul Islam
2 and
Md. Jahangir Kabir
2
1
CSIRO Land and Water, Black Mountain Science and Innovation Park, Canberra ACT 2601, Australia
2
Bangladesh Rice Research Institute, Gazipur 1707, Bangladesh
*
Author to whom correspondence should be addressed.
Submission received: 9 October 2019 / Revised: 7 November 2019 / Accepted: 12 November 2019 / Published: 15 November 2019

Abstract

:
Rice production takes a leading role in the agricultural sector of Bangladesh contributing to 35% of the gross value added of total agricultural production (December 2011), employing 48% of the rural workforce. While the country achieved self-sufficiency in rice, continuous population growth requires Bangladesh to further increase the production of this staple cereal. However, considering the steady decline of the cropped area and available rural workforce, such increase could be reached by increasing the efficiency in rice production. This study aims to examine the resource use efficiency and its drivers in the performance of rice farms in the Northwest region of Bangladesh, which is considered as the food bowl of the country. The study applied a two-stage approach of Data Envelopment Analysis followed by Ordinary Least Squares to estimate the impact of contextual variables on rice production. The empirical research results show that 83% of rice farms among the sample of 184 farms are efficient being located on efficiency frontier, while the 2% farms are inefficient and could improve their efficiency. The remaining 15% of farms are at level that is close to the efficiency frontier. Such factors as the cost of irrigation, pest control, and crop harvesting and carrying are the main drivers of efficiency amongst the considered rice farms.

1. Introduction

Bangladesh has made a remarkable development in agriculture over the last few decades and gained self-sufficiency in rice production. With a population of 76 million in 1977, the total production of rice was 11.6 million tonnes (152 kg/capita). In 2012, with a population of 153 million, the total production of rice has increased to 34 million tonnes (222 kg/capita) [1]. There are three types of rice depending on a season of a year: (1) Aus, (2) Aman, and (3) Boro. Aman rice is the predominant crop (72% of the net cultivable area) in the wet season, Aus is the next crop during the wet season, Boro rice is the major crop grown in the dry season [2]. While areas under the first two types of rice are gradually decreasing, for instance, Aus have declined from 23.6% of total crop area in 1983–1984 to 8.4% in 2008, Aman from 36.8% to 30.8%, respectively, areas under Boro rice have expanded three-fold, from 9.6% to 33.14% [3].
Production increases have resulted from a substantial intensification in agriculture rather than from increases in the land area available for cultivation. The overall cropping intensity has increased from 148.9% in 1977 to 190% in 2012 with an increasing proportion of land being double- or triple-cropped [3]. This growth in intensity was driven by increased cultivation during the dry season, made possible by the growing availability of irrigation.
There was phenomenal growth in irrigation development over the last three decades. The total irrigated area has increased from 1.52 million ha in 1983 (18% of the net cultivable area) to 5.4 million ha in 2013, (63% of the net cultivable area). This growth was driven by the growing use of groundwater through a rapid increase in the adoption of shallow tubewells (STW). Groundwater covers about 80% of the total irrigated area of the country and is growing. The number of STWs has increased from 93 thousand to 1.52 million during this period. The number of deep tubewells (DTWs), which also pump groundwater, has increased from about 14 thousand to 35 thousand [4].
Bangladesh takes fourth place among the thirteen main rice-producing nations in the world (those nations produce ~90% of the global rice production) with average annual rice production of 37 million tons which is 6.3% of the global share [5]. However, while the country harvests rice on 11,641 thousand hectares, which is still fourth place among those world producers, by the average rice yield Bangladesh is ranked eight, at 3.50 tons per hectare, which is lower than the global average of 4.49 tons per hectare [5].
Besides low rice yield, Bangladesh faces the problem of declining agricultural land area. According to the World Development Indicators, arable land as a percentage of the total land area has decreased from 64.5% in 1995 to 59.7% in 2015, the agricultural land area per person has dwindled from 0.07 ha to 0.05 per person in the same period [6]. This fact in combination with rapid population growth, which is declined from 2.8% to 1% in recent decades [6], but still constitutes significant 1.6 million people per year in absolute numbers, raises the issue of food security for the country. In addition, rural population growth is negative since 2012 [6], which means a natural loss in rural population and the subsequent decrease of agricultural labour force availability. Certainly, there are possible solutions such as the introduction of new productive rice breeds, mechanization of agricultural practices, land consolidation, etc. One of the effective and faster solutions could be the increase in resource use efficiency in agricultural farms. Thus, the objective of this study is to apply Data Envelopment Analysis (DEA) method at a regional level by employing various inputs and outputs to analyze the performance of rice farms in the Northwest (NW) region of Bangladesh. Then, OLS regression method is applied to identify variables that may have determined score efficiency estimated by the DEA. Finally, we draw conclusions and policy recommendations for rice farming in the NW region of Bangladesh.

2. Materials and Methods
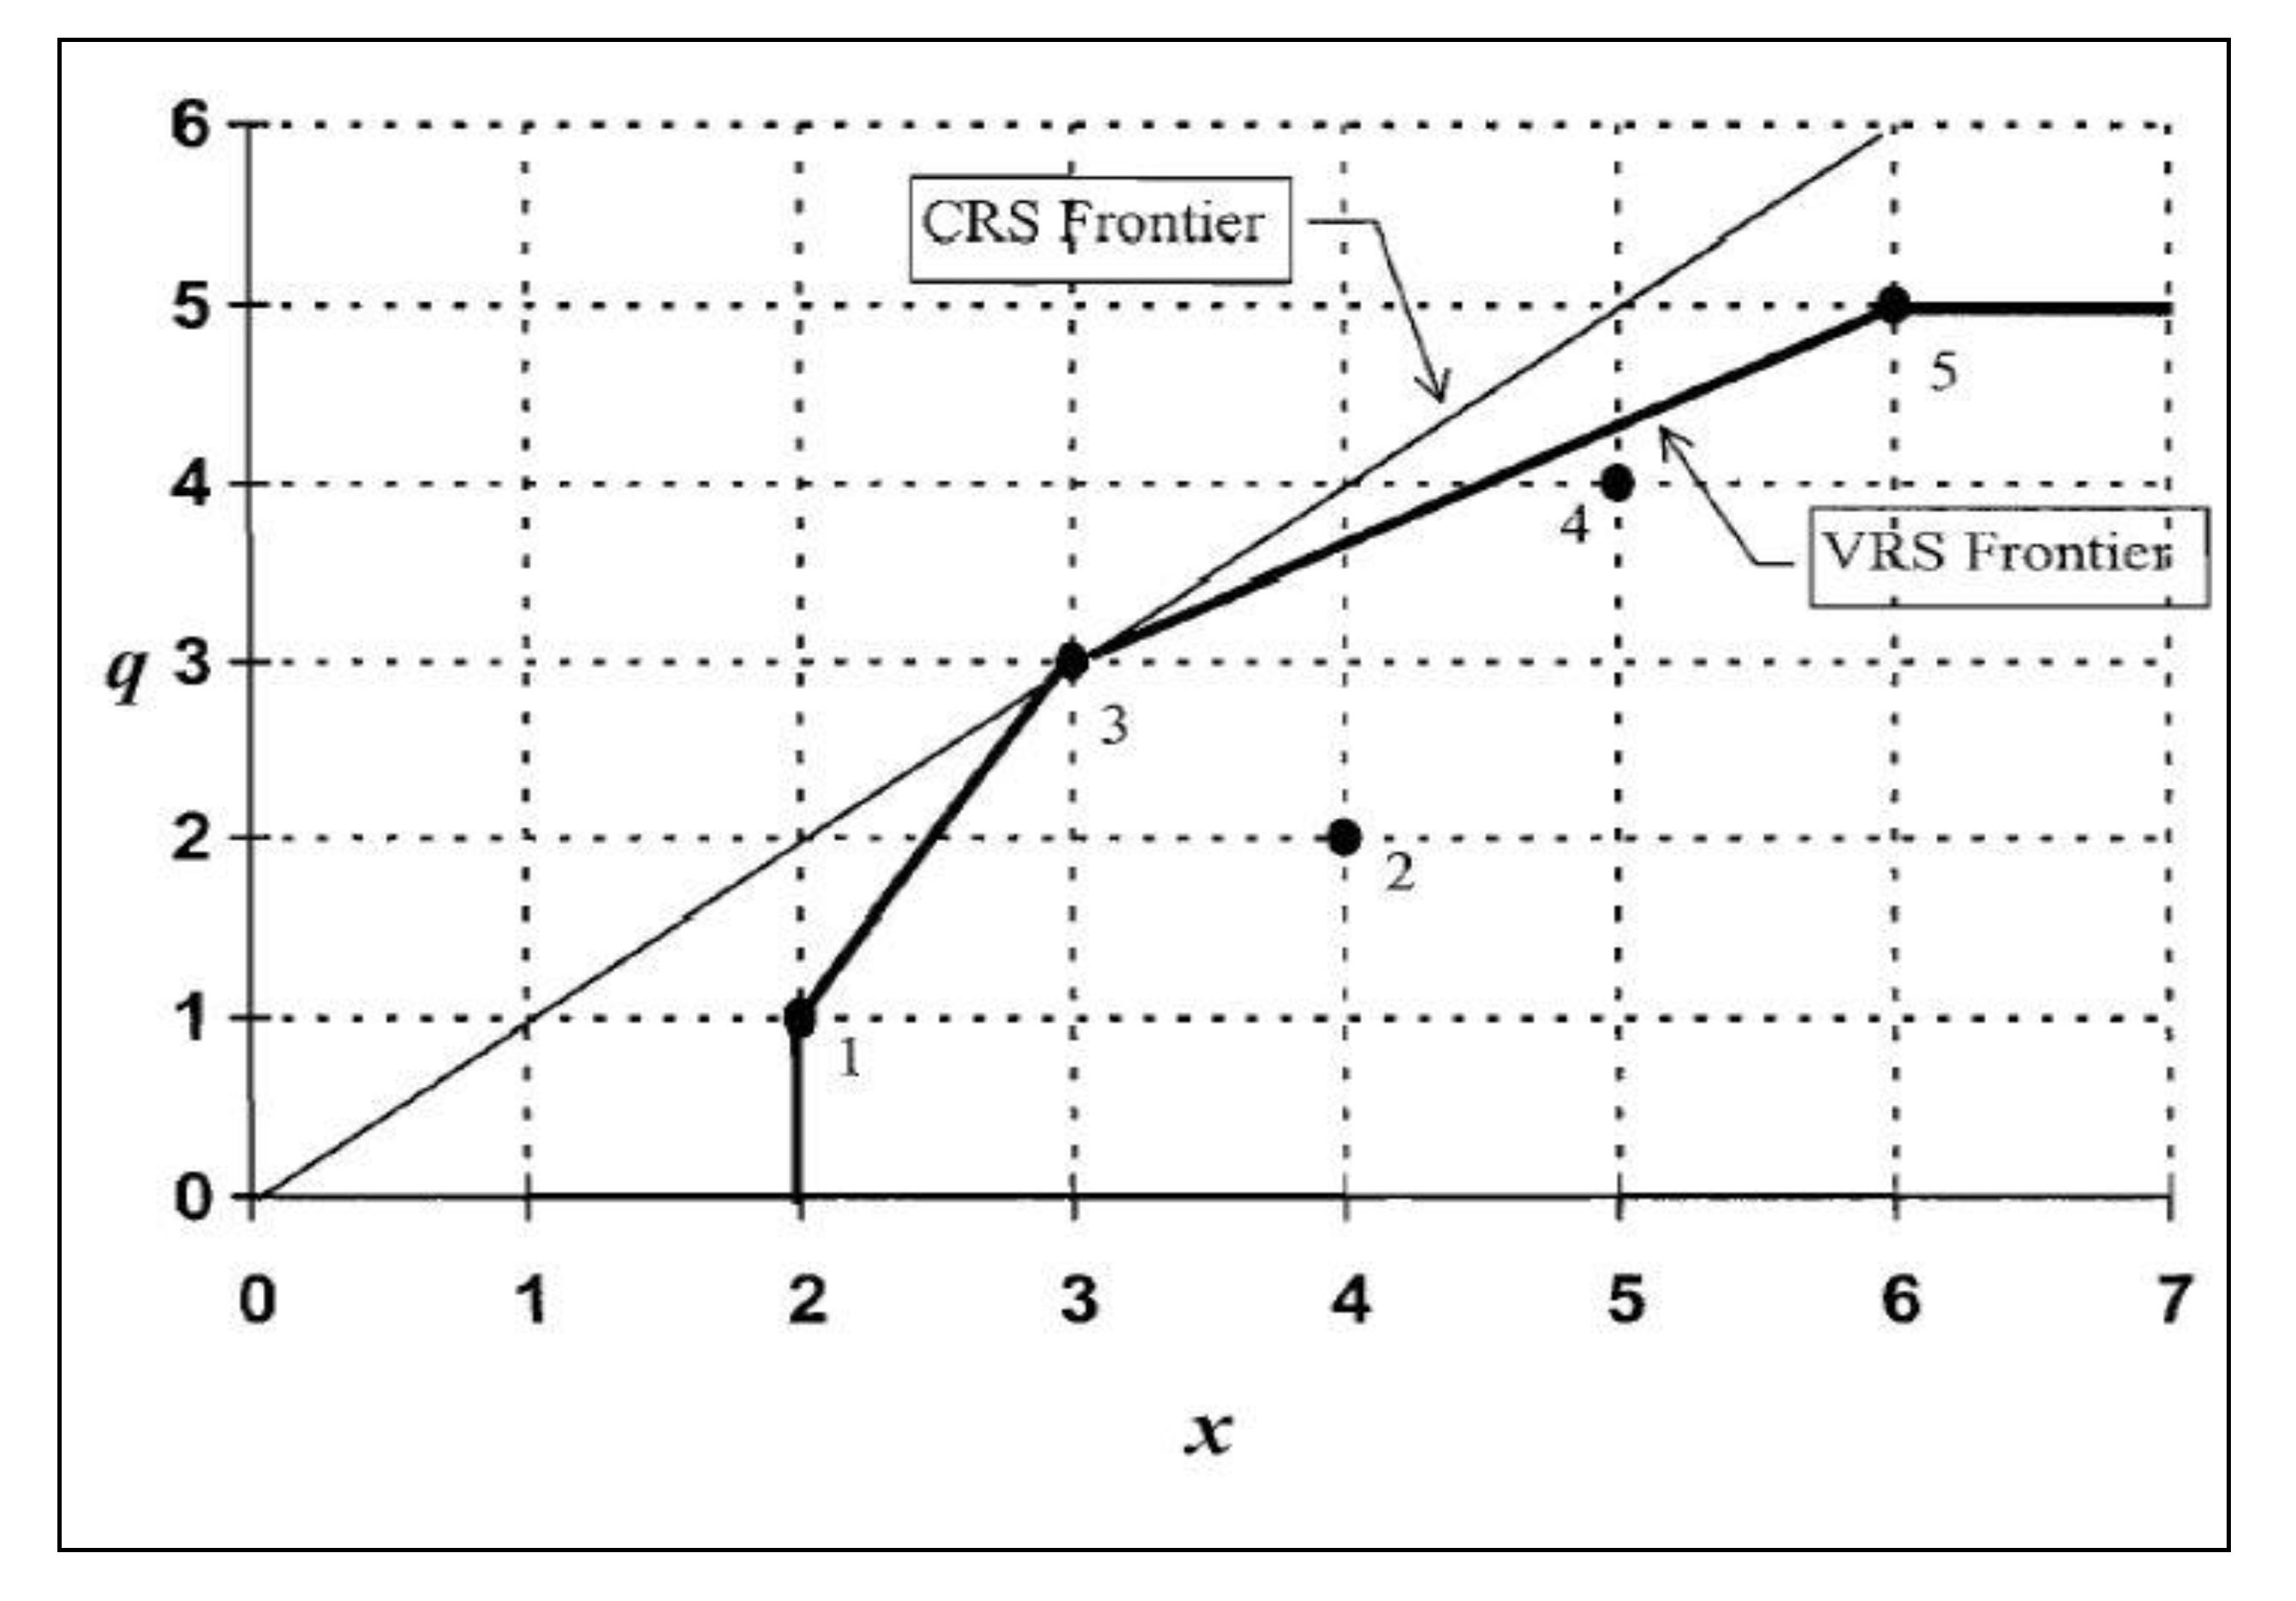
2.1. DEA Literature

DEA is a powerful management and benchmarking linear programming technique which was introduced by [7,8] to measure relative efficiency among similar organizations or units within the one organization. The approach is called the envelopment model as it identifies the best frontier solution envelops of all observations of Decision Making Units (DMUs).
Since the pioneering work of [7] Data Envelopment Analysis (DEA) method has been widely employed in academic and policy-making arena, results of which were published in scientific journals, conferences proceedings, dissertations and policy papers within both private (for-profit) and public (non-profit) sectors of the economy. For instance, recent applications covered such areas as banking [9,10], hospital performance [11,12], port operations [13,14], construction industry [15], schools [16], among many others. Different aspects of DEA application, model programming, and specification, and detailed analysis on a selection of inputs and outputs and DMU could be found in [17,18,19]. In addition, DEA has been widely employed in measuring the performance of agricultural policies and activities in many countries around the world, see Dhungana et al. [20] for Nepalese rice farms, [21] for Spanish farms, [22] for cotton farms in Pakistan, [23] for Japanese wheat farming.
A number of researchers have used this approach in efficiency analysis of Bangladeshi rice farming before as well. For example, [24] measured Bangladeshi rice farms’ efficiency by employing stochastic and DEA methods. [25] in their 1997 sample of 406 rice farms in three agro-ecological zones of Bangladesh, found that efficiency varied between 69% and 95% scores. Later, [26] applied the DEA double bootstrap method and revealed that education, extension and credit, and age are drivers of efficiency in rice farming in Bangladesh.

2.2. DEA Analysis

Generally, there are two commonly used approaches that calculate efficiency and both these approaches represent some form of frontier function. These two principal approaches are (1) Data Envelopment Analysis (DEA) which is a non-parametric mathematical programming method, and (2) Stochastic Production Frontiers (SPF) which is the econometric method. Each of these methods has a number of advantages and disadvantages, for a detailed comparison refer to [27,28]. The clear advantages of the DEA approach are that it can simultaneously handle multiple inputs and multiple outputs without the need to specify their weight in advance. In addition, there is no need for specification of the functional form of the production function, i.e., the most efficient input-output relationship (as is required in the SPF approach). The disadvantages of DEA are: it does not necessarily estimate the most efficient Decision Making Unit (DMU), it just measures the relative inefficiency of DMUs. Also, DEA does not estimate the effectiveness of resources/inputs used, it just measures the efficiency of DMU only in comparison with the most efficient DMU.
DEA is a nonparametric linear programming technique which develops an efficiency frontier by optimizing (maximizing) the weighted output/input ratio of each DMU, subject to the condition that this ratio can be equal, but never exceed, unity for any other DMU in the data set [7]. To improve that efficiency, a given DMU should either increase the outputs or decrease the inputs used. This reflects on the DEA application technique. DEA method application could be divided into two types: input-oriented and output-oriented DEA. The input-oriented DEA model minimizes the inputs to achieve the potential level of output (by reducing inputs bundle while keeping the outputs level constant), and output-oriented model which maximizes the outputs bundle while keeping the inputs at a constant level (by increasing outputs bundle while keeping the level of the input constant). Both input and output-oriented model seek to maximize the outputs, minimize the inputs and thus maximize the efficiency. In general, the input-oriented model closely focuses on operational and managerial issues whereas the output-oriented model is more associated with planning and strategy [29].
The envelopment surface will differ depending on the scale assumptions that underpin the model. Two scale assumptions are generally employed: constant returns to scale (CRS), and variable returns to scale (VRS). The latter encompasses both increasing and decreasing returns to scale. CRS reflects the fact that output will change by the same proportion as inputs are changed (e.g., a doubling of all inputs will double output). VRS reflects the fact that production technology may exhibit increasing, constant and decreasing returns to scale. Both, CRS and VRS, frontiers are illustrated in Figure 1. There are generally a priori reasons to assume that farming would be subject to variable returns and, in particular, decreasing returns to scale. In essence, a researcher examines the technical efficiency given different returns to scale and determines whether or not the observed levels are along the frontier corresponding to a particular return to scale. Assuming a CRS frontier is more likely to result in a greater estimate of capacity output and a lower estimate of capacity utilization than assuming a VRS frontier [5].
The mathematical formulation of the linear programming model is given in Appendix A. As was mentioned earlier, the detailed theoretical development of DEA approach and application is extensively discussed in the literature. Therefore, it was decided to avoid repetition of the discussion and put more emphasis on the approach itself, interpretation of its results and their implications for rice farm productivity in Northwest Bangladesh. The GAMS optimization platform was used for model programming.

2.3. Ordinary Least Squares (OLS)

Many researchers used the DEA method to estimate efficiency of DMUs and then identify determinants that impact DEA efficiency scores in the next (second) stage of their analysis. There is a significant number of these research that employed either ordinary least squares (OLS) or Tobit regression [30,31,32] with no obvious explanation of reasons to justify their two-stage approach [33]. Clearly, there is no common agreement among researchers on which method yields more robust estimates. However, a recent study pointed out:
“Extensive simulations from a stochastic frontier data generating process document that the simple two-stage DEA + OLS model significantly outperforms the more complex Simar-Wilson model with lower mean absolute deviation (MAD), lower median absolute deviation (MEAD) as well as higher coverage rates when the contextual variables significantly impact productivity” [33].
In our point of view, the Tobit regression method (which is censored regression model) in post DEA analysis may provide a biased result as DEA scores (efficiency measures) are bounded between 0 and 1 which means that this variable is bounded not censored. Therefore, Tobit regression could be a fragile estimator that can be appropriate to use when a researcher has the dependent variable as are censored data. DEA efficiency scores are percentage data, produced by a normalization process [31]. The DEA analysis generates a production frontier. A rice farm’s DEA efficiency measure (score) is equal to its actual output (multiplied by 100) divided by the frontier output corresponding to the farm’s input values. Although the measures are between 0 and 100, and there are many scores of 100, the scores are not generated by a censoring process. Consequently, it can be shown that Tobit estimates are, in general, inconsistent, but OLS estimates are consistent and asymptotically normal.

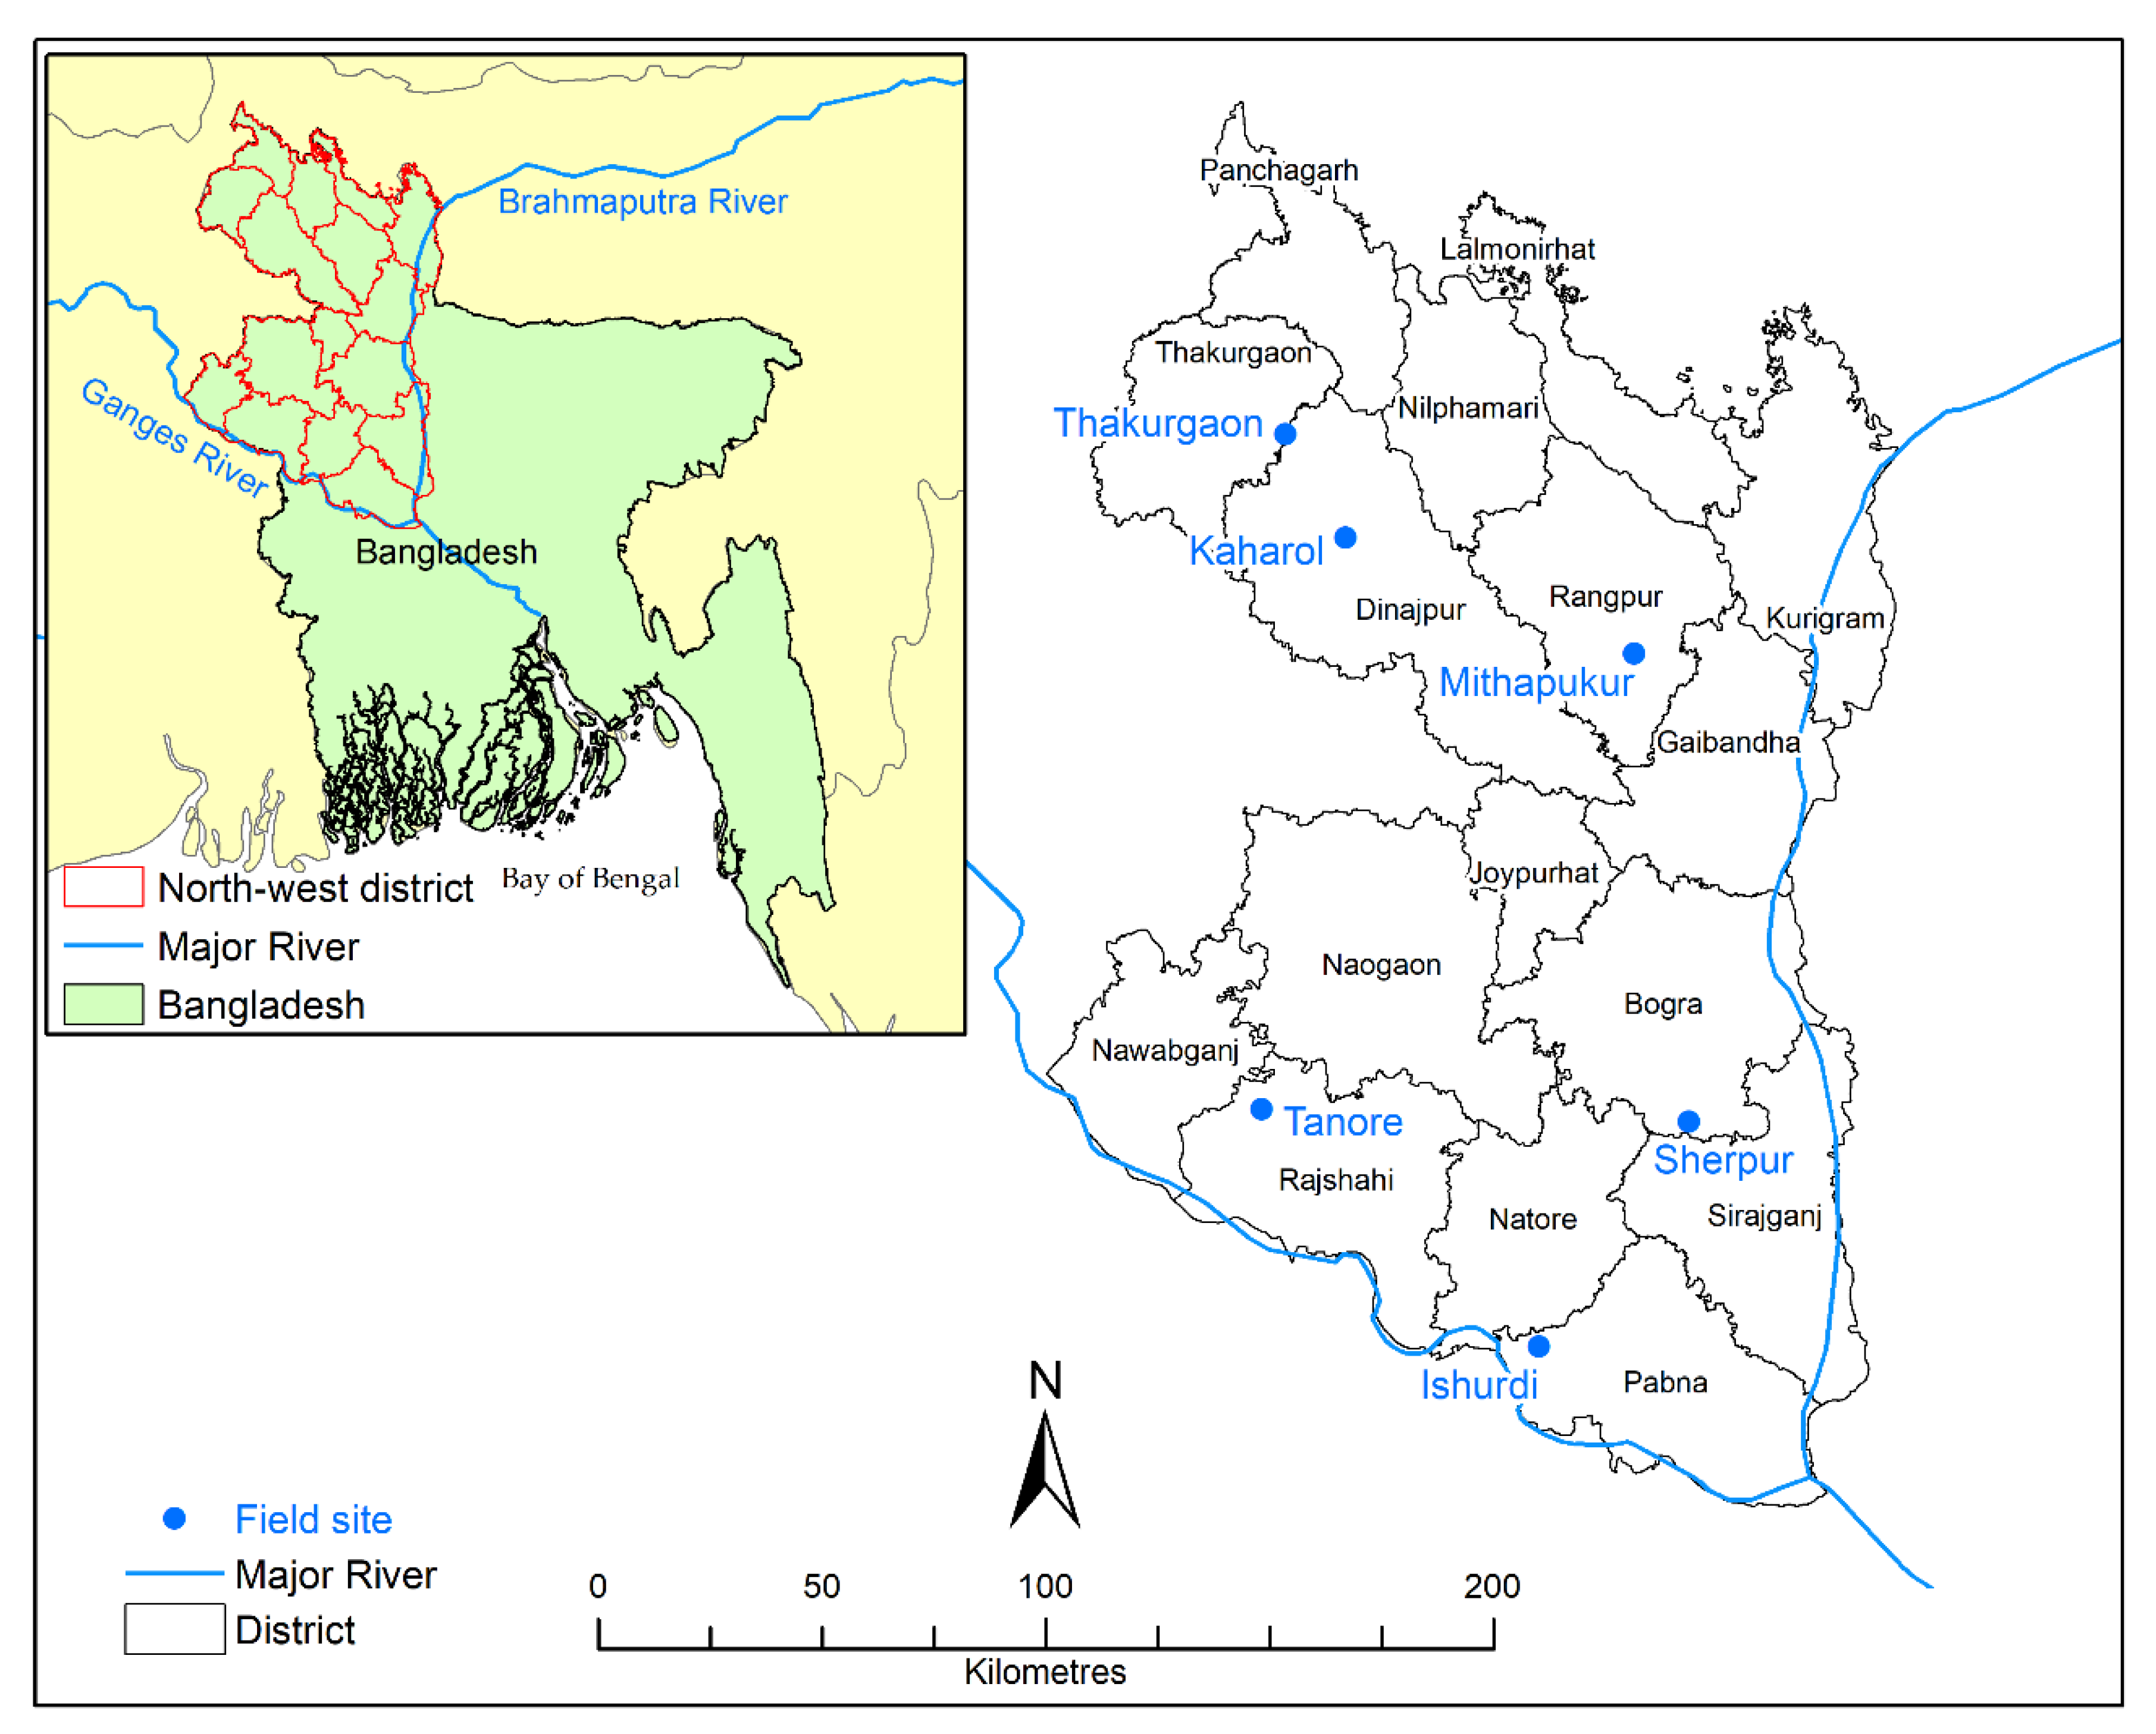
2.4. Study Area and Collected Data

Northwest region of Bangladesh is part of the Eastern Gangetic Plains (broadly, Bihar and northern West Bengal in India, the Terai area in Nepal and Northwest Bangladesh) within the Ganges Basin. Eastern Gangetic Plains (EGP) is believed to have significant potential for intensification of agricultural production and to offer underutilized opportunities to improve the livelihoods of smallholder farmers. The region (Figure 2) has the highest percentage of net cultivable area irrigated in 2012–2013 (around 85%) and has the most intensive use of groundwater, over 97% of the total area is irrigated (2012–2013) by groundwater [2]. The region produces 34% of the country’s total rice, 60% of the total wheat, and more than 2/3 of the total production of potato and maize. This region is considered as the food basket of Bangladesh [34]. Considering issues of growing total population and declining rural population and available agricultural land, the region is experiencing increasing pressure to raise efficiency of agricultural production.
We have selected 4 districts in the northwest region of Bangladesh (Figure 2). The following criteria were followed while selecting study sites:
  • Represents good geographical spreads within the northwest region
  • Each site will have a group of deep tubewell (DTWs) and shallow tubewell (STWs) that covers the considerable area (10 to 20 ha)
  • 2 (DTW) and 4 (STW) sites
  • Consider both diesel and electricity operated pumps
  • Having different water pricing mechanisms (share of the crop as water charge, fixed land area-based water charge, smart card, diesel + fixed charge, etc.)
  • Rice is the main dry season crop of the area.
Comprehensive input resources and output products data on 184 rice farms were collected in these selected districts (Rangpur—82, Thakurgaon—18, Pabna—39, and Bogra—45 farms) of Northwest region of Bangladesh during the 2016–2017 production year. Inputs include nine variables which cover almost the entire production process from the beginning to the end product such as (1) seed and seedlings cost, (2) land preparation cost, (3) seedling transplanting cost, (4) irrigation cost, (5) fertilizer cost, (6) weed control cost, (7) pest control cost, (8) crop harvest and carrying, (9) threshing, winnowing and drying cost. All inputs are reported in monetary values (Bangladeshi taka per plot). One plot is one decimal unit which is commonly a measurement unit in India and Bangladesh (1 dec = 40.46 m2).
Farm households are typified based on the operating area of the farm and ownership of the operating land. On average 91% of total farm households are small farm types. This is higher than the national average figure of small farm types (84% of total) as per the agriculture census 2008 [3]. Besides, nearly half of the farm households are owner tenant farmers followed by 35% are owner farmers. On the contrary, on average about 66% of total rural farm households in Bangladesh were owner-operated farms, followed by 24% of total were owner tenant operated farm as per agriculture census 2008 [3].
Figure 3 presents the above-mentioned cost of each production resource averaged over all 184 rice farms in absolute terms (Bangladeshi taka per unit of land and in percentage). The three the most expensive inputs in rice farming in NW Bangladesh are irrigation, crop harvesting and carrying, and fertilizer, which combined take more than half of the total resource costs required in rice farming (59%). The rest of inputs take a decent 5–9% of the total production costs. The lowest cost is shown for seed and seedling cost and pest control—each of which takes 5% of the total production costs. Based only on Figure 3, one can make preliminary conclusion or hypothesis on which factor or factors may have significant impact on efficiency performance of the observed rice farms.
Output includes two products, namely the total yield of the main product (rice) and yield of by-product (straw). Descriptive statistics of the farms and subsequent variables used by the study are given in Table 1.

3. Results and Discussion

3.1. Identification of Efficient and Inefficient Farms

The efficiency score has been computed for each of the 184 farms, however, paper size limitation will not allow in presenting all the set. Instead results have been grouped by ranges and given districts. In general, DEA findings show that most of the considered rice farms have been operating on the frontier production point—the mean efficiency score is equal to 0.96, minimum score is equal to 0.70.
The studied rice farms could be divided into three broad categories: (1) best performers—efficient farms with scale between 0.90–1.00 or 90–100% efficiency, (2) good farms with scale between 0.80–0.89 or 80–89% efficiency, and (3) bad performers—inefficient farms with scale less than 0.79 or 79%. This division is totally arbitrary and was done for the purpose of separating inefficient farms and showing the differences across the farms as farm operating with efficiency score 0.95 (95%) is very much different from the farm operating with 0.75 (75%) efficiency score. Thus, there are 153 best performers (fully efficient or almost fully efficient) which in total comprise 83% of the sample size, 27 good farms which constitute 15% of the sampling and 4 inefficient farms which represent 2% of farms.
Table 2 reports efficiency scores results obtained by the DEA model by ranges. As the minimum score is 0.70, a total of three groups are reported. As it could be seen from the table, only 4 farms (2%) are operating inefficiently (low efficiency of resources/inputs utilization), 27 (15%) farms are showing good performance in resource use efficiency, and the most of farms, 153 (83%) lie on efficiency frontier.
As expected, best-performing rice farms with mean efficiency score of 98% produce more main output (rice) than other two categories (which have corresponding 85% and 75% mean efficiency score). Thus, best performers outperform good performers by 25% and bad performers by 28% (Table 2).

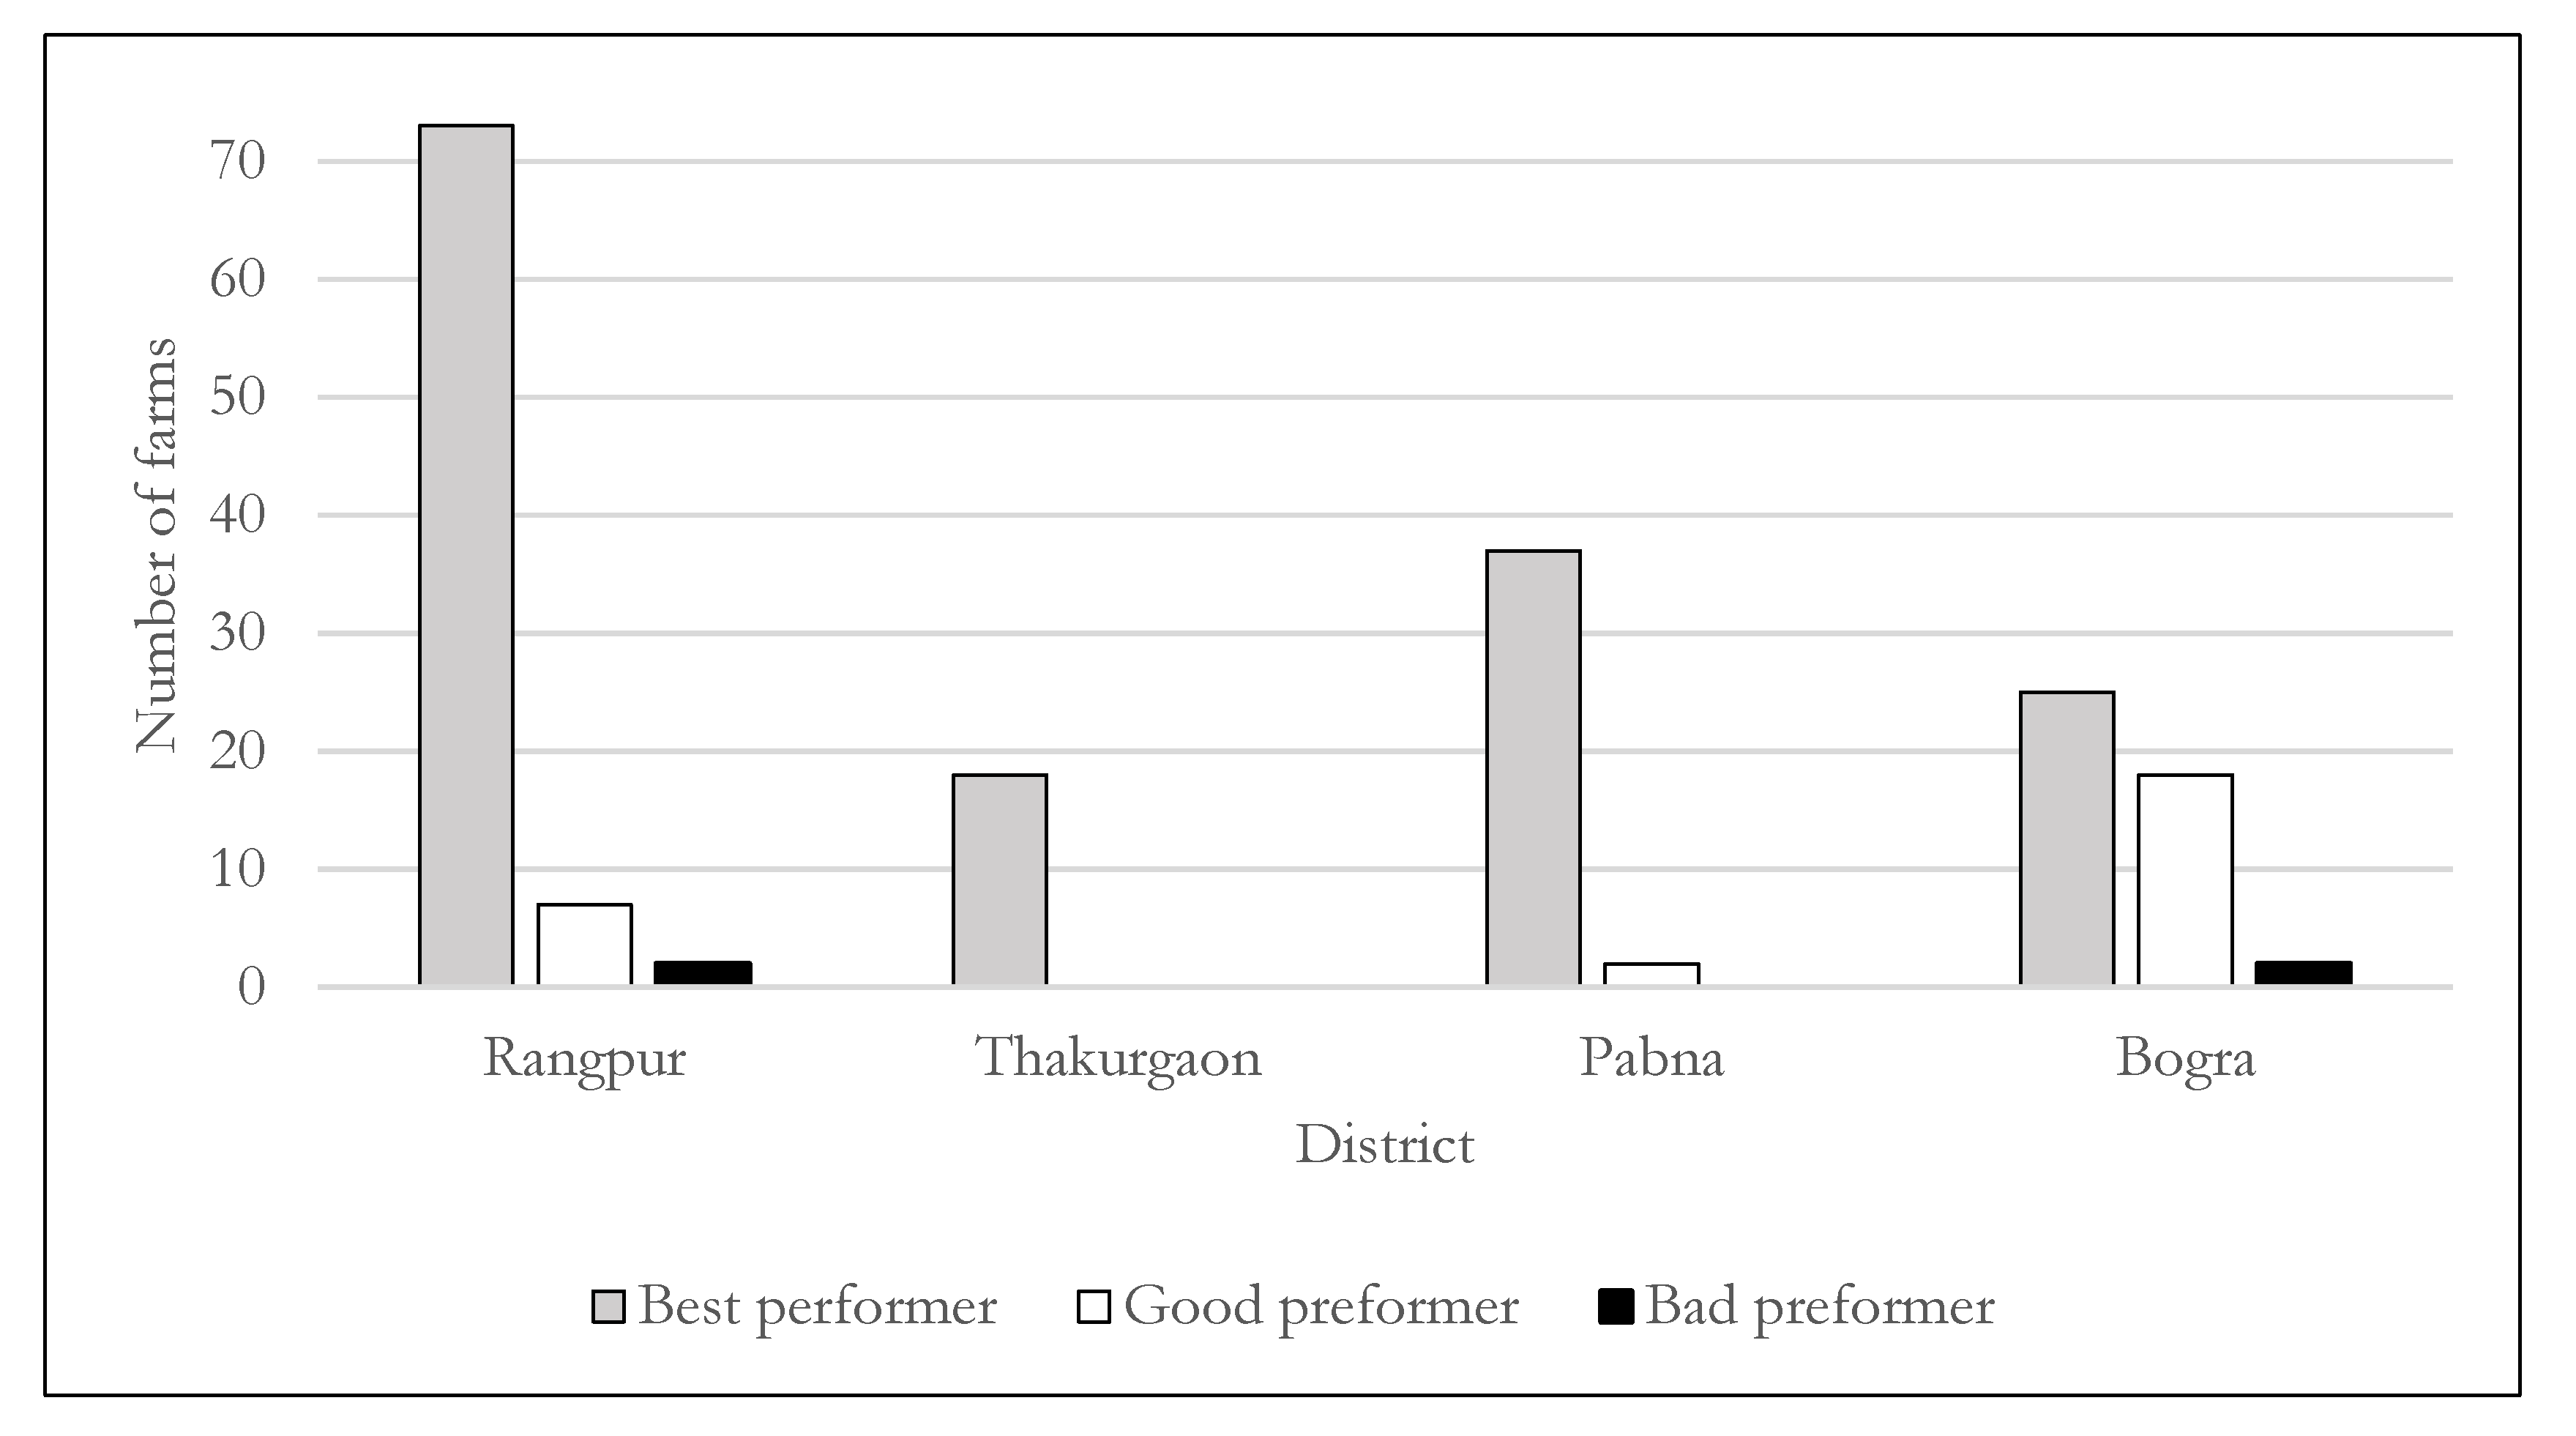
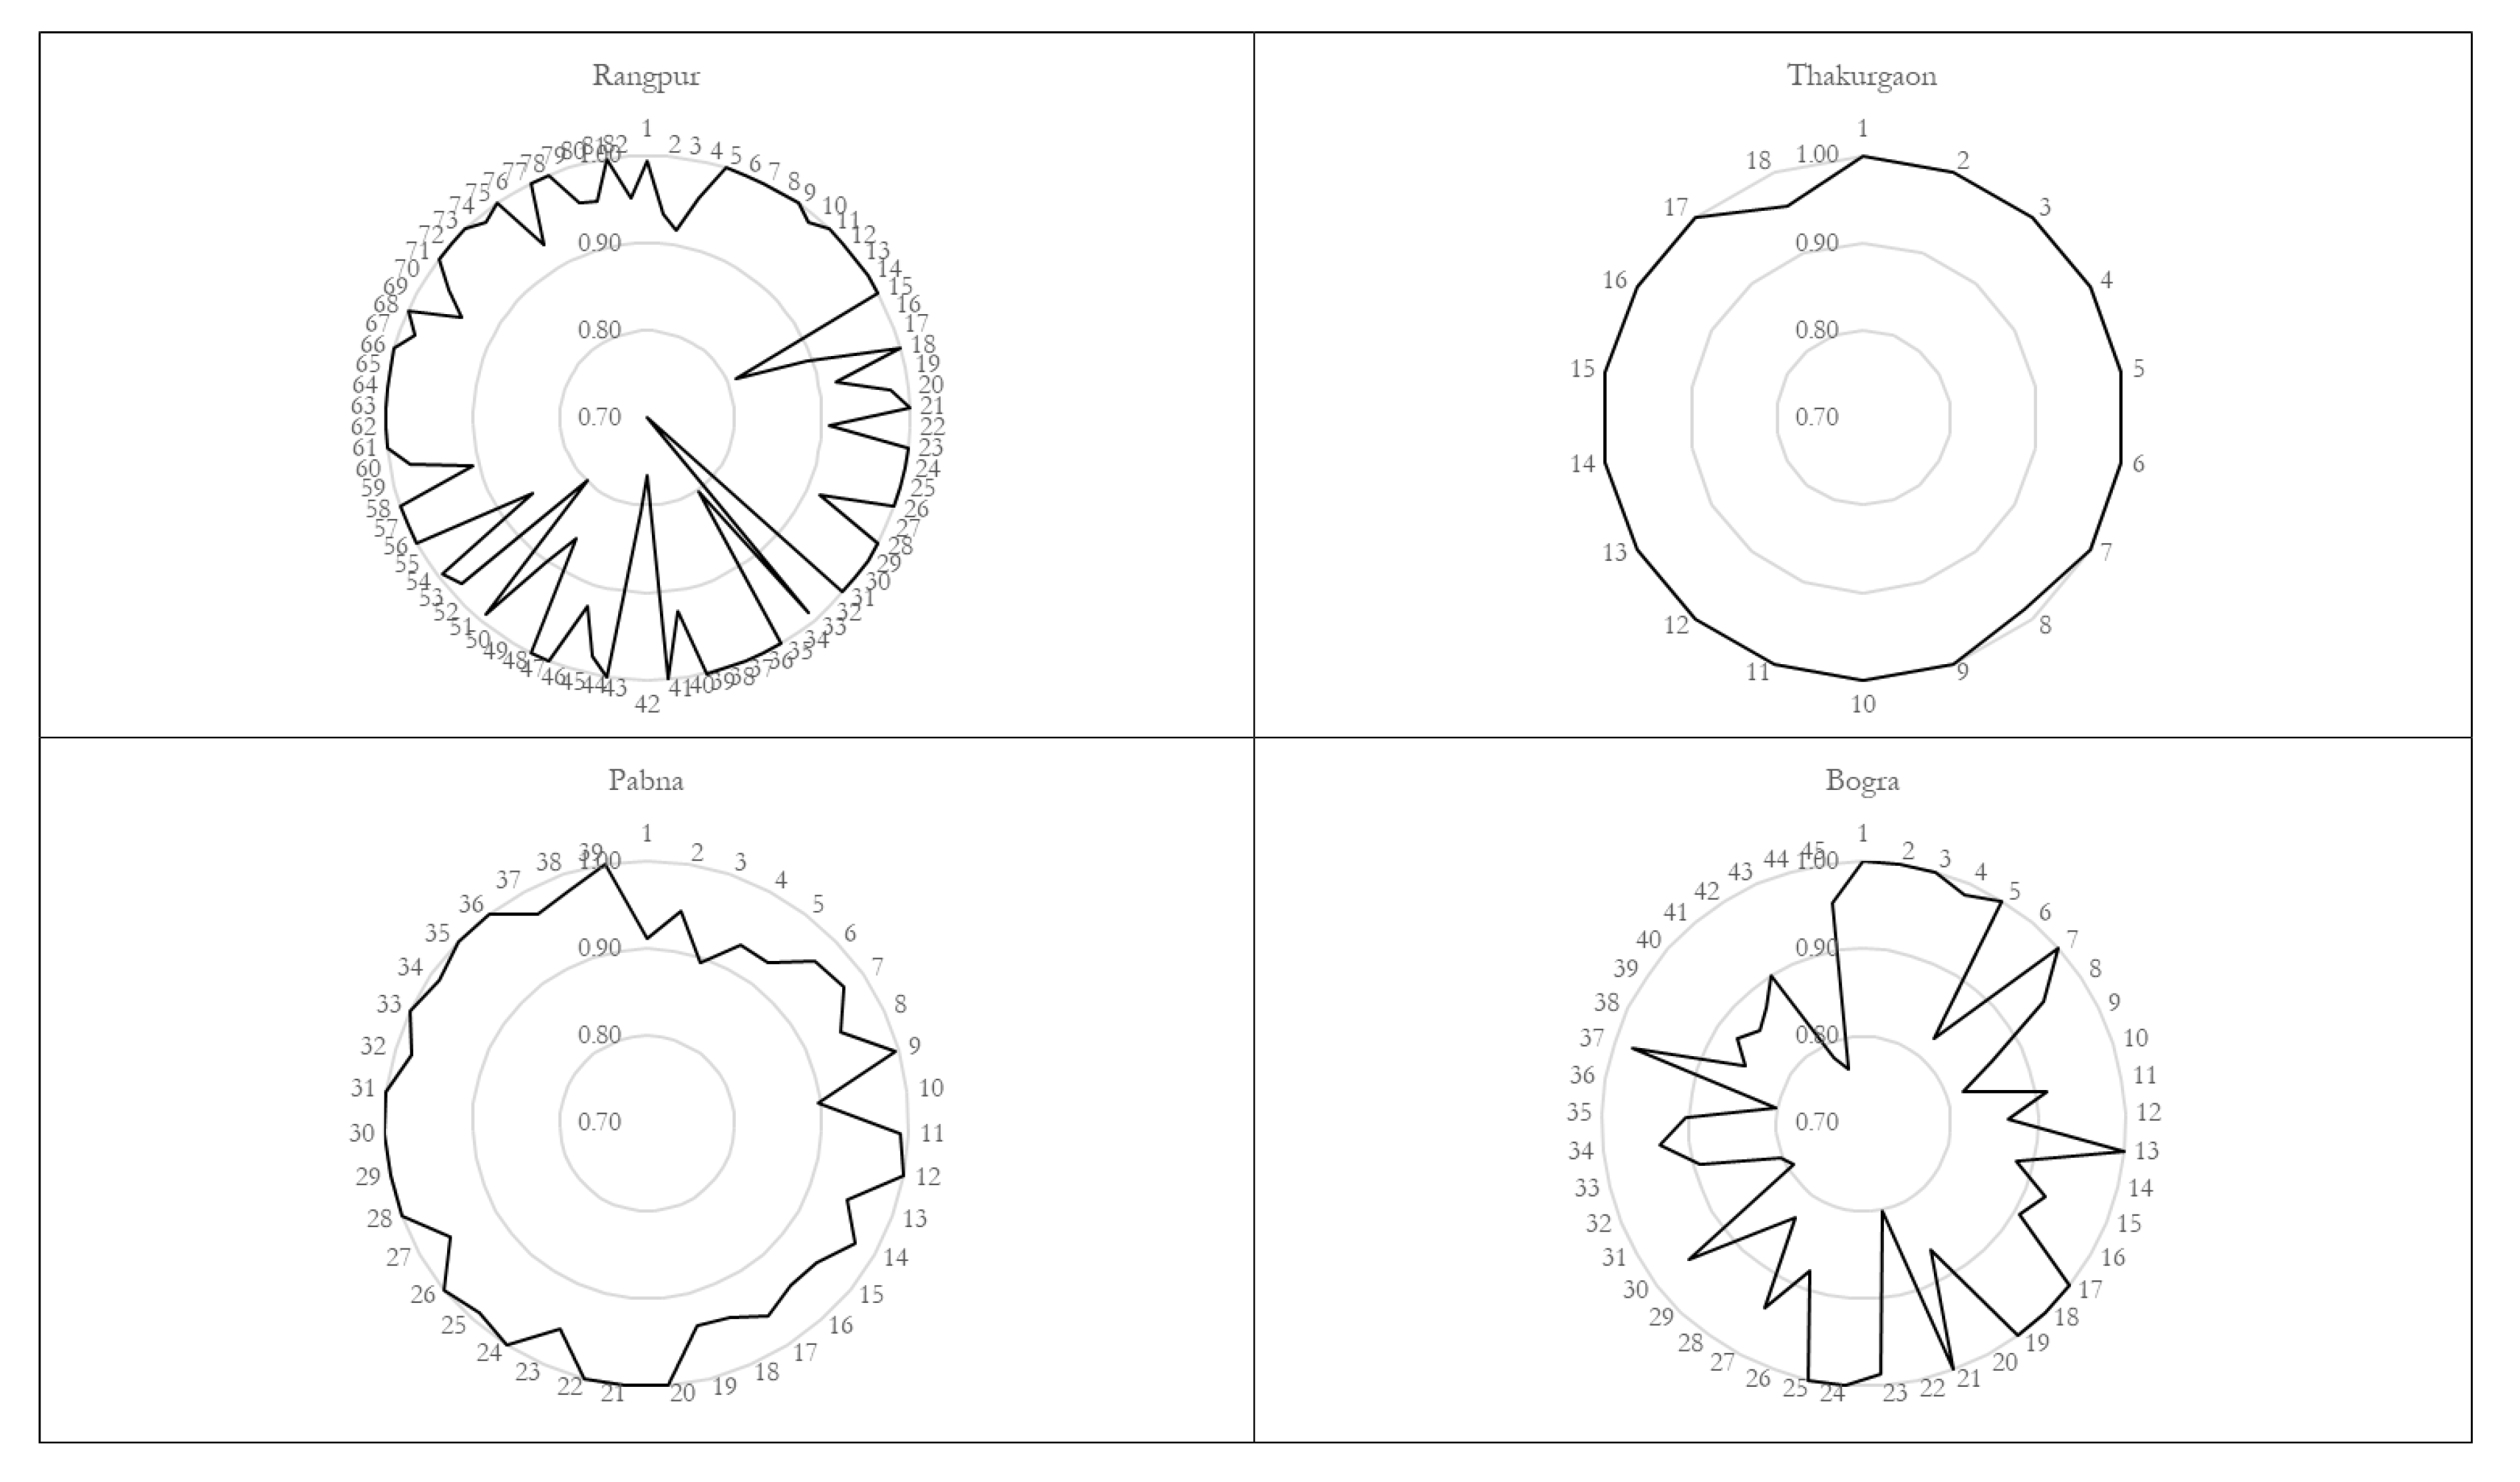
3.2. Efficient and Inefficient Farms by Districts

Cross-district analysis of farm efficiencies reveals an interesting picture. Figure 4 shows farms distribution by DEA efficiency scores across the districts. One can immediately notice an uneven distribution of farms by identified efficiency types across districts. For instance, the inefficient farms are located in Rangpur and Bogra districts (two farms in each district) which means two other districts, namely, Thakurgaon and Pabda do not have any bad performing farms. Moreover, all 18 farms in Thakurgaon district fall in the category of best performing farms. Pabna district has 37 best preforming and 2 good performing farms (Figure 4).
So far, DEA analysis results were presented for the entire NW region and across districts. Next, actual DEA scores are given across farms within each of the observed districts. However, instead of showing an overwhelming table with the DEA score for each of the 184 farms (that could occupy many pages), it was decided to use a radar chart. Hence, Figure 5 illustrates efficiency of each farm separated by the district. Consistent with the previous findings, Figure 5 clearly shows that most farms in the Thakurgaon district are placed on the edge (1.00) meaning that they are efficient. A similar picture is observed in the Pabna district, which has number of good performing farms with score not less than 0.90 (90%). Very different radar chars are seen for Rangpur and Bogra districts. Both have bad performing farms with scores within 0.70–0.89.

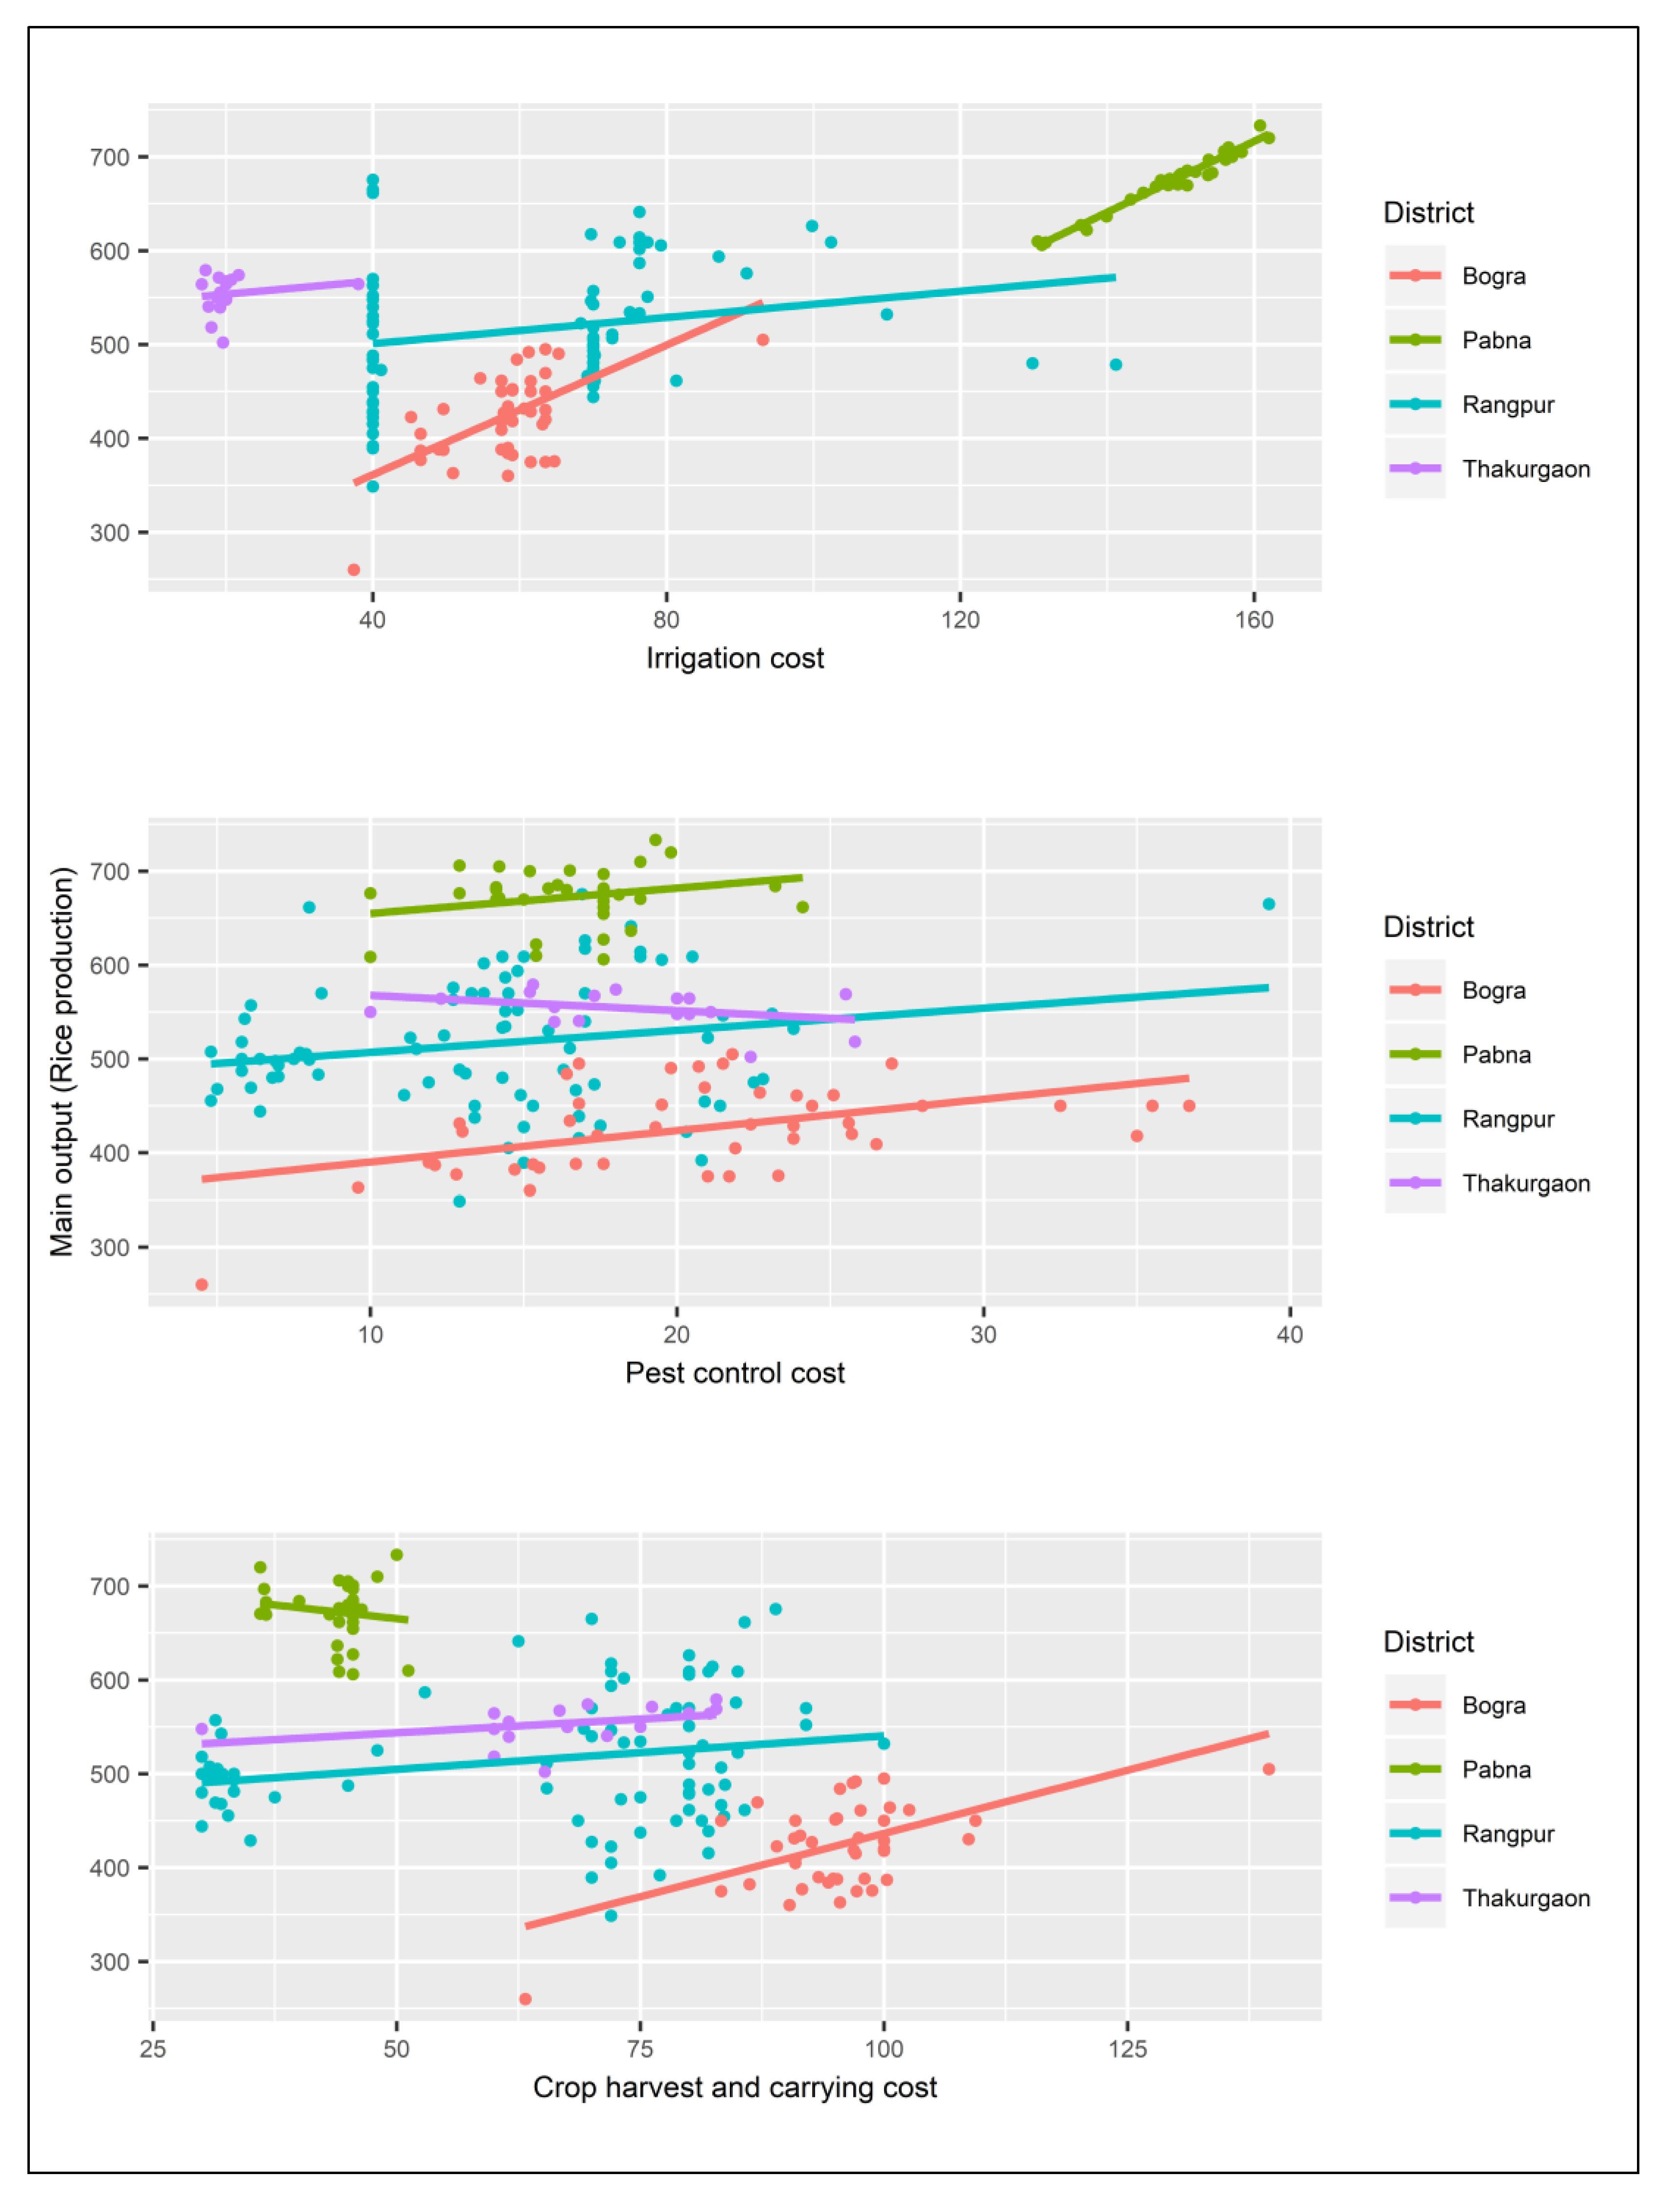
3.3. Drivers of Rice Farm’s Efficiency

In the second stage of the DEA analysis, the study employed the OLS regression model to find what variables influence rice farm efficiency in NW Bangladesh. StepAIC operation in R software has been applied to select the best model from the class according to the Akaike information criterion (AIC). The robustness test of the chosen model has been first conducted for multicollinearity amongst the explanatory variables. This was done to avoid the existence of collinearity between the independent variables that have the likelihood of inflating the variances of the parameter estimates, which consequently could lead to incorrect inferences about relationships between the explanatory and response variables (redundancy between predictor variables). As a rule of thumb, a VIF value that exceeds 5 or 10 indicates a problematic amount of collinearity. In case of the identified model all predictor variables’ values were in order of 1.3–1.8.
The estimated model identified three statistically significant determinants of efficiency in the performance of rice farms in NW Bangladesh, namely irrigation cost, pest control cost, and crop harvesting and carrying cost (Table 3). Two of them are significant at 99% level (irrigation and crop harvesting and carrying cost) and pest control cost at 90% level. This clearly indicates some accuracy to the assumptions made earlier in the paper, that irrigation cost and crop harvesting and carrying would have influence on performance of rice farms.
Table 3 shows that R-squared and adjusted R-squared are low (22% and 20%, respectively), however, it does not necessarily mean that the estimated model is bad. Generally, R-squared does not indicate whether a regression model provides an adequate fit to your data. A good model can have a low R-squared, and on the other hand a biased model can have a high R-squared value. Moreover, if one’s R-squared estimation is low but estimated predicted values are significant (such in this case), it is still possible to draw important conclusions about how changes in the predictor values are associated with changes in the response value. Regardless of the R-squared, the significant coefficients still represent the mean change in the response for one unit of change in the predictor while holding other predictors in the model constant. Obviously, this type of information can be extremely valuable.
Figure 6 provides visualization of possible correlation between rice production and identified predictors to check initial assumptions and reliability of identified determinants. As one can see, higher spending on irrigation provides more output—steep lines for Bogra and Pabna districts, and less steep lines for Thakurgaon and Rangpur districts. Actually, irrigation is one of the decisive factors in farming in NW Bangladesh in dry season. Similar pictures are observed for pest control and crop harvesting and carrying spending. Exceptions are pest control cost in the Thakurgaon district, and crop harvesting and carrying cost in the Pabna district, which shows less of these inputs may yield more output. This could be a sign of a diminishing return to scale when more of input does not necessarily lead to higher production. Overall, identified predictors play a significant role in rice production in Northwest Bangladesh.

4. Conclusions

The objective of this study was to investigate the efficiency performance of rice farms in the Northwest region of Bangladesh and identify drivers of such efficiency by employing second stage efficiency analysis (DEA + OLS). The analysis shows that 85% of rice farms are completely achieving DEA efficiency and operate at their optimal scale, 15% of farms are at a good level with a score between 80% and 89%, and 2% of farms are inefficient. The results confirm the utility of using DEA models in the assessment of agricultural practices. It would be interesting to check how efficiency score changes with time, but that analysis needs time-series data, and this remains in this way a real opportunity for future research in the field.
Second-stage regressions attempted to identify drivers in efficiency measures between farms. The results obtained indicate that such inputs as irrigation, pest control, and crop harvesting and carrying are likely driving rice production in the region. While the study acknowledges weakness of the estimated model due to unavailability of such data, for example, as access to agricultural credit, a farmer’s age, education, experience, etc., the findings could still shed light on the performance of rice farms.
In terms of policy implications, the DEA results show that the average mean of efficiency scores for rice farms in Northwest Bangladesh is high (96%), however, there are large discrepancies across the analyzed districts. In particular, only two districts (Pabna and Rangpur) have inefficient farms. This could indicate that farmers may face some issues in these districts and this could be of special interest for the local decision-makers. In spite of overall good performance, there is a considerable opportunity for rice farms in the region to improve their operational efficiency and contribute to Bangladeshi international competitiveness and trade performance in relation to rice production, as it was said in the introduction section, average yield in Bangladesh is lower than the global average. In a highly rice-dependent nation, efficiency in its production can play an important role in Bangladeshi overall export performance and economic development.

Author Contributions

Conceptualization, S.-M.J. and M.M.; methodology and analysis, S.-M.J.; the rest of the team took active participation in data collection.

Funding

This research was supported by the Australian Centre for International Agricultural Research through the project, entitled “Improving water use for dry season agriculture for marginal and tenant farmers in the Eastern Gangetic Plains”.

Conflicts of Interest

The authors declare no conflict of interest.

Appendix A

Efficiency is a major indicator of performance. It is defined as the ratio of output/s to input/s. More output/s per one unit of input/s mean greater efficiency. Suppose that a DMU j has on its disposal several inputs xi,j and produces a number of outputs yk.j, then a measurement of a relative efficiency would be estimated by:
E f f i c i e n c y = k u k y k , j i v i x i , j
where u and v mean weights. Generally, efficiency varies between 0 and 1, or respectively between 0% and 100%. There is no need to set the same weights for each DMU, DEA method allows each DMU to set its own weights (Kalvelagen, 2004). It can be done by defining optimization problem—maximize the efficiency of DMU subject to that efficiency of all DMU are less or equal to 1.
DMU is not efficient (or best performer, or not at benchmark), because it could be using too many inputs and/or it is not producing a potential level of output. Thus, there are two options to improve its performance. First is to reduce its inputs and still be able to reach the frontier, and the second, to increase its output level to reach the frontier while still using the same level of inputs.
An input-oriented DEA model estimates technical efficiency by checking the vector of inputs used in the production process and compare if a farm is using the minimum necessary inputs level to produce a given level of outputs (held constant). Technical efficiency in this category of the DEA model is measured by the maximum reduction of inputs while keeping the possibility to produce a given output bundle.
Färe et al. (1994) suggested the below stated input-oriented DEA model to estimate technical efficiency:
M i n λ ,   z λ
subject to:
u j m j = 1 J z j   u j m ,       m = 1 , 2 , ,   M . j = 1 J z J x j n λ   x j n ,       n = 1 , 2 , ,   N . z j 0 ,   j = 1 , 2 , ,   J .
where
  • λ = input efficiency of DMUs being estimated by DEA
  • ujm = amount of output m produced by DMU j
  • xjn = amount of input n used by DMU j
  • zj = intensity variable for DMU j
This is CCR (constant returns-to-scale) model, to impose variable a returns-to-scale, the following constraint is added to the model [2]:
j λ j = 1
This equation transforms CCR (constant returns-to-scale) model into BCC (variable returns-to-scale) model. This allows the showing of technical efficiency scores.
An output-oriented DEA model estimates technical efficiency by measuring the potential outputs that might be produced by DMU, given the level of inputs (held constant). Technical efficiency in this category of the DEA model is measured by the maximum output which potentially could be achieved by employing the given outputs bundle.
Again, Färe et al. (1994) suggested the below stated output-oriented DEA model to estimate technical efficiency:
M a x θ ,   z θ
subject to:
θ u j m j = 1 J z j   u j m ,       m = 1 , 2 , ,   M . j = 1 J z j x j n x j n ,       n = 1 , 2 , ,   N . z j 0 ,   j = 1 , 2 , ,   J .
where
  • θ = output efficiency of DMUs being estimated by DEA
  • ujm = amount of output m produced by DMU j
  • xjn = amount of input n used by DMU j
  • zj = intensity variable for DMU j
There are many commercial programs to conduct DEA analysis, Microsoft Excel has also the add-on to run such analysis (FAO, 2018). However, MATLAB (matrix laboratory) and GAMS (General Algebraic Modelling System) represent the most optimal software to run such problems (FAO, 2018). It should be kept in mind that the DEA model runs linear programming problems for each of DMU for both input and output-oriented cases—in our case 470 (235 × 2) farms which could be a time-consuming task. However, by using “loop” operation in GAMS software which is used in this analysis, this task was greatly eased.
The model is programmed on the GAMS optimization platform which provides greater flexibility in comparison with other similar platforms. The model code and collected data are available from the author upon request.

References

  1. Mainuddin, M.; Kirby, M. National food security of Bangladesh to 2050. Food Secur. 2015, 7, 633–646. [Google Scholar] [CrossRef]
  2. Mainuddin, M.; Kirby, M.; Chowdhury, R.A.R.; Sanjida, L.; Sarker, M.H.; Shah-Newaz, S.M. Bangladesh Integrated Water Resources Assessment Supplementary Report: Land Use, Crop Production, and Irrigation Demand. CSIRO: Water for a Healthy Country Flagship. 2014. Available online: https://publications.csiro.au/rpr/download?pid=csiro:EP141373&dsid=DS6 (accessed on 4 October 2018).
  3. BBS (Bangladesh Bureau of Statistics). Yearbook of Agricultural Statistics-2016; Bangladesh Bureau of Statistics: Dhaka, Bangladesh, 2017.
  4. BADC (Bangladesh Agricultural Development Corporation). Minor Irrigation Survey Report 2014–2015; Bangladesh Agricultural Development Corporation: Dhaka, Bangladesh, 2015.
  5. FAO (Food and Agriculture Organization of UN). Appendix D. Data Envelopment Analysis (DEA). 2018. Available online: http://www.fao.org/docrep/006/y5027e/y5027e0e.htm (accessed on 5 October 2018).
  6. WB (World Bank). World Bank Open Data. 2018. Available online: https://data.worldbank.org/ (accessed on 5 October 2018).
  7. Charnes, A.; Cooper, W.; Rhodes, E. Measuring the efficiency of decision making units. Eur. J. Oper. Res. 1978, 2, 429–444. [Google Scholar] [CrossRef]
  8. Charnes, A.; Cooper, W.W.; Rhodes, E. Short Communication: Measuring the Efficiency of Decision-Making Units. Eur. J. Oper. Res. 1979, 3, 339. [Google Scholar] [CrossRef]
  9. Avkiran, N.K. An illustration of dynamic network DEA in commercial banking including robustness tests. Omega 2015, 55, 141–150. [Google Scholar] [CrossRef]
  10. Wanke, P.; Barros, C. Two-stage DEA: An application to major Brazilian banks. Expert Syst. Appl. 2014, 41, 2337–2344. [Google Scholar] [CrossRef]
  11. Khushalani, J.; Ozsan, Y.A. Are hospitals producing quality care efficiently? An analysis using Dynamic Network Data Envelopment Analysis (DEA). Socio-Econ. Plan. Sci. 2017, 60, 15–23. [Google Scholar] [CrossRef]
  12. Gholami, R.; Higon, D.A.; Emrouznejad, A. Hospital performance: Efficiency or quality? Can we have both with IT? Expert Syst. Appl. 2015, 42, 5390–5400. [Google Scholar] [CrossRef]
  13. Nguyen, H.; Nguyen, H.; Chang, Y.; Chin, A.T.H.; Tongzon, J. Measuring port efficiency using bootstrapped DEA: The case of Vietnamese ports. Marit. Policy Manag. 2015, 43, 644–659. [Google Scholar] [CrossRef]
  14. Rajasekar, T.; Deo, M. Is There Any Efficiency Difference between Input and Output Oriented DEA Models: An Approach to Major Ports in India. J. Bus. Econ. Policy 2014, 1, 18–28. [Google Scholar]
  15. Hu, X.; Liu, C. Profitability performance assessment in the Australian construction industry: A global relational two-stage DEA method. Constr. Manag. Econ. 2016, 34, 147–159. [Google Scholar] [CrossRef]
  16. Fatimah, S.; Mahmudah, U. Two-Stage Data Envelopment Analysis (DEA) for Measuring the Efficiency of Elementary Schools in Indonesia. Int. J. Environ. Sci. Educ. 2017, 12, 1971–1987. [Google Scholar]
  17. Färe, R.; Grosskopf, S.; Karagiannis, G.; Margaritis, D. Data envelopment analysis and its related linear programming models. Ann. Oper. Res. 2017, 250, 37–43. [Google Scholar] [CrossRef]
  18. Golany, B.; Roll, Y. An application procedure for DEA. Omega 1989, 17, 237–250. [Google Scholar] [CrossRef]
  19. Cook, W.D.; Tone, K.; Zhu, J. Data envelopment analysis: Prior to choosing a model. Omega 2014, 44, 1–4. [Google Scholar] [CrossRef]
  20. Dhungana, B.R.; Nuthall, P.L.; Nartea, G.V. Measuring the economic inefficiency of Nepalese rice farms using data envelopment Analysis. Aust. J. Agric. Resour. Econ. 2004, 48, 347–369. [Google Scholar] [CrossRef]
  21. Picazo-Tadeo, A.J.; Gómez-Limón, J.A.; Reig-Martínez, E. Assessing farming eco-efficiency: A Data Envelopment Analysis approach. J. Environ. Manag. 2011, 92, 1154–1164. [Google Scholar] [CrossRef]
  22. Ullah, A.; Perret, S.R.; Gheewala, S.H.; Soni, P. Eco-efficiency of cotton-cropping systems in Pakistan: An integrated approach of life cycle assessment and data envelopment analysis. J. Clean. Prod. 2016, 134, 623–632. [Google Scholar] [CrossRef]
  23. Masuda, K. Measuring eco-efficiency of wheat production in Japan: A combined application of life cycle assessment and data envelopment analysis. J. Clean. Prod. 2016, 126, 373–381. [Google Scholar] [CrossRef]
  24. Wadud, A.; White, B. Farm household effciency in Bangladesh: A comparison of stochastic frontier and DEA methods. Appl. Econ. 2000, 32, 1665–1673. [Google Scholar] [CrossRef]
  25. Coelli, T.; Rahman, S.; Thirtle, C. Technical, Allocative, Cost and Scale Efficiencies in Bangladesh Rice Cultivation: A Non-parametric Approach. J. Agric. Econ. 2002, 53, 607–626. [Google Scholar] [CrossRef]
  26. Balcombe, K.; Fraser, I.; Latruffe, L.; Rahman, M.; Smith, L. An application of the DEA double bootstrap to examine sources of efficiency in Bangladesh rice farming. Appl. Econ. 2011, 40, 1919–1925. [Google Scholar] [CrossRef]
  27. Bowlin, W.F.; Charnes, A.; Cooper, W.W.; Sherman, H.D. A Comparative Study of Data Envelopment Analysis and Other Approaches to Efficiency Estimation; Research Report CCS 451; Center for Cybernetic Studies, The University of Texas at Austin: Austin, TX, USA, 1983. [Google Scholar]
  28. Banker, R.D.; Conrad, R.F.; Strauss, R.P. A Comparative Application of Data Envelopment Analysis and Translog Methods: An Illustrative Study of Hospital Production. Manag. Sci. 1986, 32, 30–44. [Google Scholar] [CrossRef]
  29. Cullinane, K.; Song, D.W.; Wang, T.F. The application of mathematical programming approaches to estimating container port production efficiency. J. Product. Anal. 2005, 24, 73–92. [Google Scholar] [CrossRef]
  30. Simar, L.; Wilson, P. Two-stage DEA: Caveat Emptor. J. Product. Anal. 2011, 36, 205–218. [Google Scholar] [CrossRef]
  31. McDonald, J. Efficiency in the Domesday economy, 1086: Evidence from Wiltshire estates. Appl. Econ. 2010, 42, 3231–3240. [Google Scholar] [CrossRef]
  32. Hoff, A. Second Stage DEA: Comparison of Approaches for Modeling the DEA Score. Eur. J. Oper. Res. 2007, 181, 425–435. [Google Scholar] [CrossRef]
  33. Banker, R.; Natarajan, R.; Zhang, D. Two-Stage Estimation of the Impact of Contextual Variables in Stochastic Frontier Production Function Models Using Data Envelopment Analysis: Second Stage OLS versus Bootstrap Approaches. Eur. J. Oper. Res. 2018, 278, 368–384. [Google Scholar] [CrossRef]
  34. Mainuddin, M.; Kirby, M.; Walker, G.; Connor, J. (Eds.) Sustaining Water Resources for Food Security in Bangladesh; CSIRO, Land and Water Flagship: Canberra, Australia, 2014. [Google Scholar]
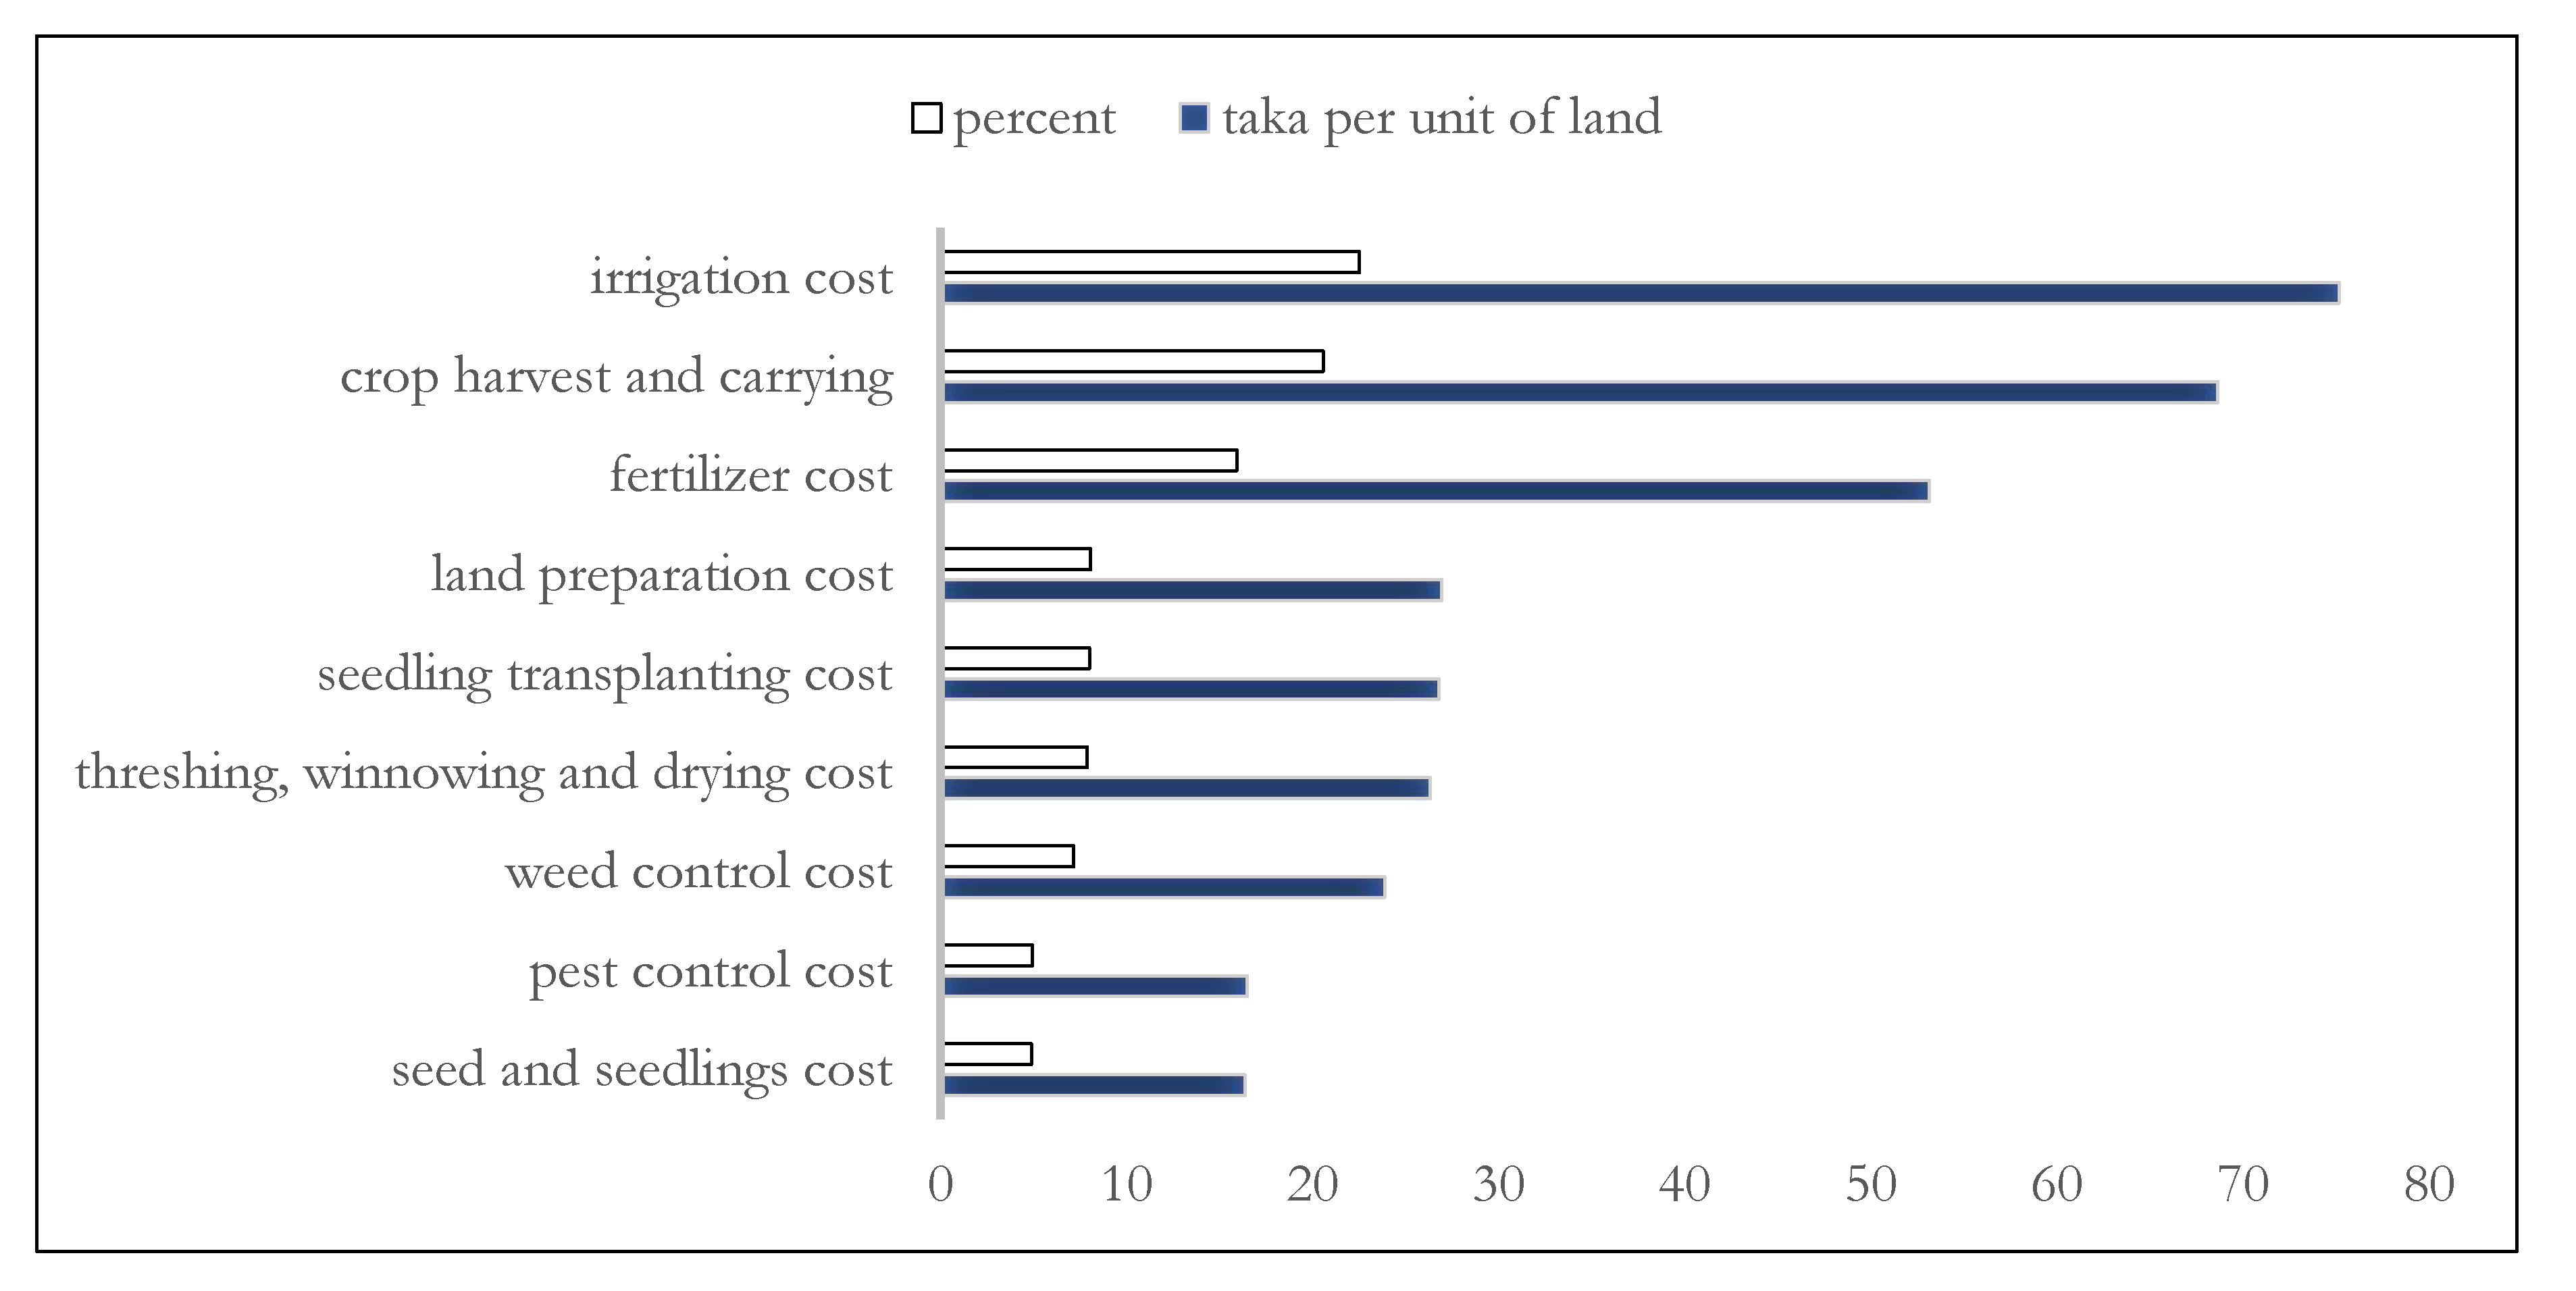
Figure 1. Constant returns to scale (CRS) and variable returns to scale (VRS) frontiers (Source: [25]).
Agriculture 09 00245 g001
Figure 2. Sites location in the Northwest region of Bangladesh.
Agriculture 09 00245 g002
Figure 3. Range of inputs per unit of land (averaged values, in descending order).
Agriculture 09 00245 g003
Figure 4. Types of rice farms by districts (in absolute numbers).
Agriculture 09 00245 g004
Figure 5. Dispersion of farms by efficiency score within each district.
Agriculture 09 00245 g005
Figure 6. Scatterplot of correlation between rice production and three statistically significant predictors.
Agriculture 09 00245 g006
Table 1. Descriptive statistics on inputs and outputs for rice-producing farms in Northwest Bangladesh (n = 184) (in Bangladeshi taka).
VariableMeanStd. Dev.MinMax
Inputs
X1seed and seedlings cost16.363.919.5037.0
X2land preparation cost26.964.4114.7043.20
X3seedling transplanting cost26.785.6114.7038.90
X4irrigation cost75.1842.8116.70162.0
X5fertilizer cost53.1713.0028.7080.30
X6weed control cost23.8912.758.9053.40
X7pest control cost16.506.124.5039.30
X8crop harvest and carrying68.6823.5430.00139.50
X9threshing, winnowing and drying cost26.347.2310.540.00
Outputs
Y1Rice530.75100.09260.00733.30
Y2Straw26.938.0312.8073.20
Table 2. Efficiency score generated by data envelopment analysis.
Efficiency ScoreFrequencyPercentage of FarmsMean Efficiency ScoreMean Main Output Associated with this RangeMean Main Output Associated with this Range
Less than 0.7942.170.7543025
0.80 to 0.892714.670.8544026
0.90 to 1.0015383.150.9855127
Table 3. Determinants of data envelopment analysis (DEA) efficiency scores (ordinary least squares (OLS) regression output).
Dependent Variable: DEA Efficiency ScoreMethod: Ordinary Least Squares
VariableCoefficientStd. Errort-StatisticProb.
Constant/Intercept1.06599330.020264052.605<2 × 10−16
Irrigation cost−0.00039900.0001160−3.441 ***0.000721
Pest control cost−0.00199570.00080182.489 *0.013717
Crop harvest and carrying−0.00164620.0002376−6.927 ***7.36 × 10⁻¹¹
R-squared: 0.2155; F-statistic: 16.48; Adjusted R-squared: 0.2025; p-value: 1.653 × 10⁻⁹; Residual S.E.: 0.0572; Durbin-Watson stat: 1.75812; *** = significant at 1 per cent level (p < 0.01), * = significant at 10 per cent level (p < 0.10).

