Impact of Land Use Changes on Soil and Vegetation Characteristics in Fereydan, Iran


1
Department of Geobotany, Trier University, 54296 Trier, Germany
2
Department of Rehabilitation of Arid and Mountainous Regions, Natural Resources faculty, University of Tehran, Tehran 1417466191, Iran
3
Economics and Rural Development, Gembloux Agro-Bio Tech, University of Liège, B-5030 Liège, Belgium
4
Department of Geography, Ghent University, 9000 Ghent, Belgium
*
Author to whom correspondence should be addressed.
Agriculture 2019, 9(3), 58; https://0-doi-org.brum.beds.ac.uk/10.3390/agriculture9030058
Submission received: 14 November 2018
/
Revised: 11 March 2019
/
Accepted: 14 March 2019
/
Published: 20 March 2019
Abstract
:To understand and manage ecosystem complexity, it is important to determine the relationships between soil characteristics, human activities, and biodiversity. This study analyzes the relationships between vegetation, soil, and man-made damage with regards to land use change in the Fereydan region, Iran. Soil physical properties such as sand and silt content, clay, saturated soil’s moisture content, and gravel percentage as well as chemical properties such as lime content, pH, electro conductivity (EC), and organic matter content were measured. In order to trace these variables, the principle component analysis (PCA) was applied. The study area was divided into three states of conditions; i.e., good condition rangelands, poor condition rangelands, and abandoned rain-fed area. Based on the results there was a significant difference between species diversity in good condition rangelands compared with two other sites. The results further revealed that among soil chemical and physical characteristics, only soil organic matter had a significant difference between different rangeland sites. According to the results, the rangelands with good conditions had the highest amount of organic matter (1.43–1.50%) compared with two other studied rangelands (poor conditions: 1.02–1.09%; abandoned rain-fed: 1.2–1.46%). The most influential factor on the species diversity index was the distance to village parameter that revealed the important role of humans in degrading rangelands and reducing species diversity.
1. Introduction
Plant communities owe their existence to relations between plants and their surrounding environment. A number of environmental factors (e.g., soil nutrients and moisture content) impose a profound effect on the unique characteristics of plants as well as plant and vegetation communities [1,2,3,4,5]. The introduced relations between plant communities and environmental factors underpin a very important debate in ecology [6]. Arid and semi-arid areas are mostly characterized by their scarce vegetation cover which makes its ecosystems fragile and vulnerable to external or internal components such as human activities [7]. The distribution, pattern, and abundance of plant species in arid and semi-arid areas have most often been related to three groups of factors including physical environmental, soil chemistry, and human factors [8]. In order to plan better conservative measures and perform effective well-informed management, one should understand the differences between species of distinct ecological categories within a studied location [9]. The existence of relationships between the environment, humans, and vegetation dictates the progress or regress of a given species within a given area.
The relations between human activities and plant communities have been studied by many researchers. Lavergne et al. (2005) [10] analyzed the implications of environmental and human factors on the presence of rare species, exclusion, and preservation of the species in the Mediterranean region. Comparing the floristic lists of 1886 and 2001 showed that in 2001, rare species tended to migrate to upper elevations. Guo et al. (2007) [11] evaluated that both undisturbed and disturbed communities showed the same changeable bell-shaped trend with an elevation increase. Suzart de Albuquerque et al. (2011) [12] scrutinized human effects on the richness of endemic and exotic plants. Their results showed a strong relationship between the endemic and exotic species. Zhang (2009) [13] also evaluated the influences of grazing intensity, soil, and topography on the status and diversity and found that grazing intensity was an important factor influencing vegetation composition and structure. Soil and topographic variables were also important to vegetation composition, although most soil variables were sensitive to grazing intensity. Similarly, El-khouly (2004) [14] found that overgrazing was the most important activity influencing vegetation diversity and floristic composition. Salinity was also found to be a significant factor that limits the plant species diversity in the location of Siwa Oasis, Egypt. A study by Pueyo et al. (2006) [15] demonstrated that grazing gives rise to the biological diversity in plant species. Mligo (2006) [16] also pointed out that the lightest grazing intensity areas were the main cause of plants reaching a peak in diversity.
Considering the high importance of plants and soils in the lives of humans, and in order to have effective management of a natural system, such as rangeland ecosystem, identifying the relationship between plant and soil has a great importance [17,18,19,20]. Soule and Piper (1992) [21] and Weil (2004) [22] discussed that relationships between soil properties and the dominance of certain plant species in a natural environment may assist in tailoring suitable species for particular soil types within a managed rangeland. In this regard, through field visits and the measuring of various environmental factors in Kamyaran rangelands in Iran, Gholinejad et al. (2012) [23] surveyed environmental determinants including the main soils, and physical and chemical parameters on plant communities’ distribution as one of the most significant structures in semi-arid rangelands. Their findings showed that clay, nitrogen, sand, altitude, and slope have the highest relationships with principal components and are the most important factors affecting the distribution of plant communities in semi-arid rangelands. Accordingly, the first hypothesis of the current study is that there is a significant difference between soils’ physical properties in different rangeland sites. Zare Chahouki et al. (2008) [24] evaluated the relationship between vegetation distribution patterns and soil characteristics in the Poshtkouh rangelands of Yazd Province, Iran. Their results revealed that the vegetation distribution pattern was mainly correlated to soil parameters such assalinity, soluble potassium, texture, gypsum, and lime. Based on the previous studies, the second hypothesis of this study is that there is a significant difference between species diversity in different rangeland sites. In relation to the effects of soil parameters on the diversity of plant species, Munhoz et al. (2008) [25] also worked in the species–environment relationship in the herb-subshrub layer of a moist Savanna site in central Brazil. They found a significant relationship between the soil texture and soil moisture parameters with the plant distribution based on the canonical-correlation analysis. Timsina et al. (2011) [26] found a significant difference between invaded transitional and non-invaded plots in species composition and soil properties in rangelands communities in Nepal. Zhang (2009) [13] also evaluated the influences of soil variables and topographical features on the plant variety and reported that topographical characteristics could alter plant variety while soil variables could permanently alter vegetation varieties and structure. There is sufficient evidence that land use/land cover change is a major driving factor for the balance of SOM (soil organic matter) [27,28,29]. In particular, changes among land use types such as cropland, forestland, and pastureland will result in clear changes in SOM reserves [27]. Houghton (2003) [30] showed that global land use changes since 1850 had caused 156 Pg of soil carbon release into the atmosphere.
Based on the role of plants that bring balance into ecosystems and their products which humans directly as well as indirectly consume, there is an urgent need to understand the relationship between the plants, the surrounding environment as well as human activities to reach stability and sustainability. Given the role of human on ecosystems, the third hypothesis of the current study is that human activities have a significant impact on species diversity. Reasonable management and utilization of rangelands requires recognition of the vegetation per se and the relationship that it has with the environment and humans. It is obvious that soil, climate, and biological characteristics of the region have a direct influence on the diverse plant community [31]. Assessing the mentioned factors is inevitable for finding the reasons of plant distribution and variety and also site capability. Vegetation and diversity conservation, recognition of plant communities, environmental factors, and human effects are fundamental principles for the preservation of natural ecosystems. With respect to the importance of species diversity in managing rangelands, this paper aims to identify and assess the types and potential influences of some influential human and environmental factors regarding plant distribution and diversity in two types of rangelands (degraded and good condition) and abandoned rain-fed regions in the Fereydan district, Isfahan province, Iran.
2. Material and Methods
2.1. Site Description
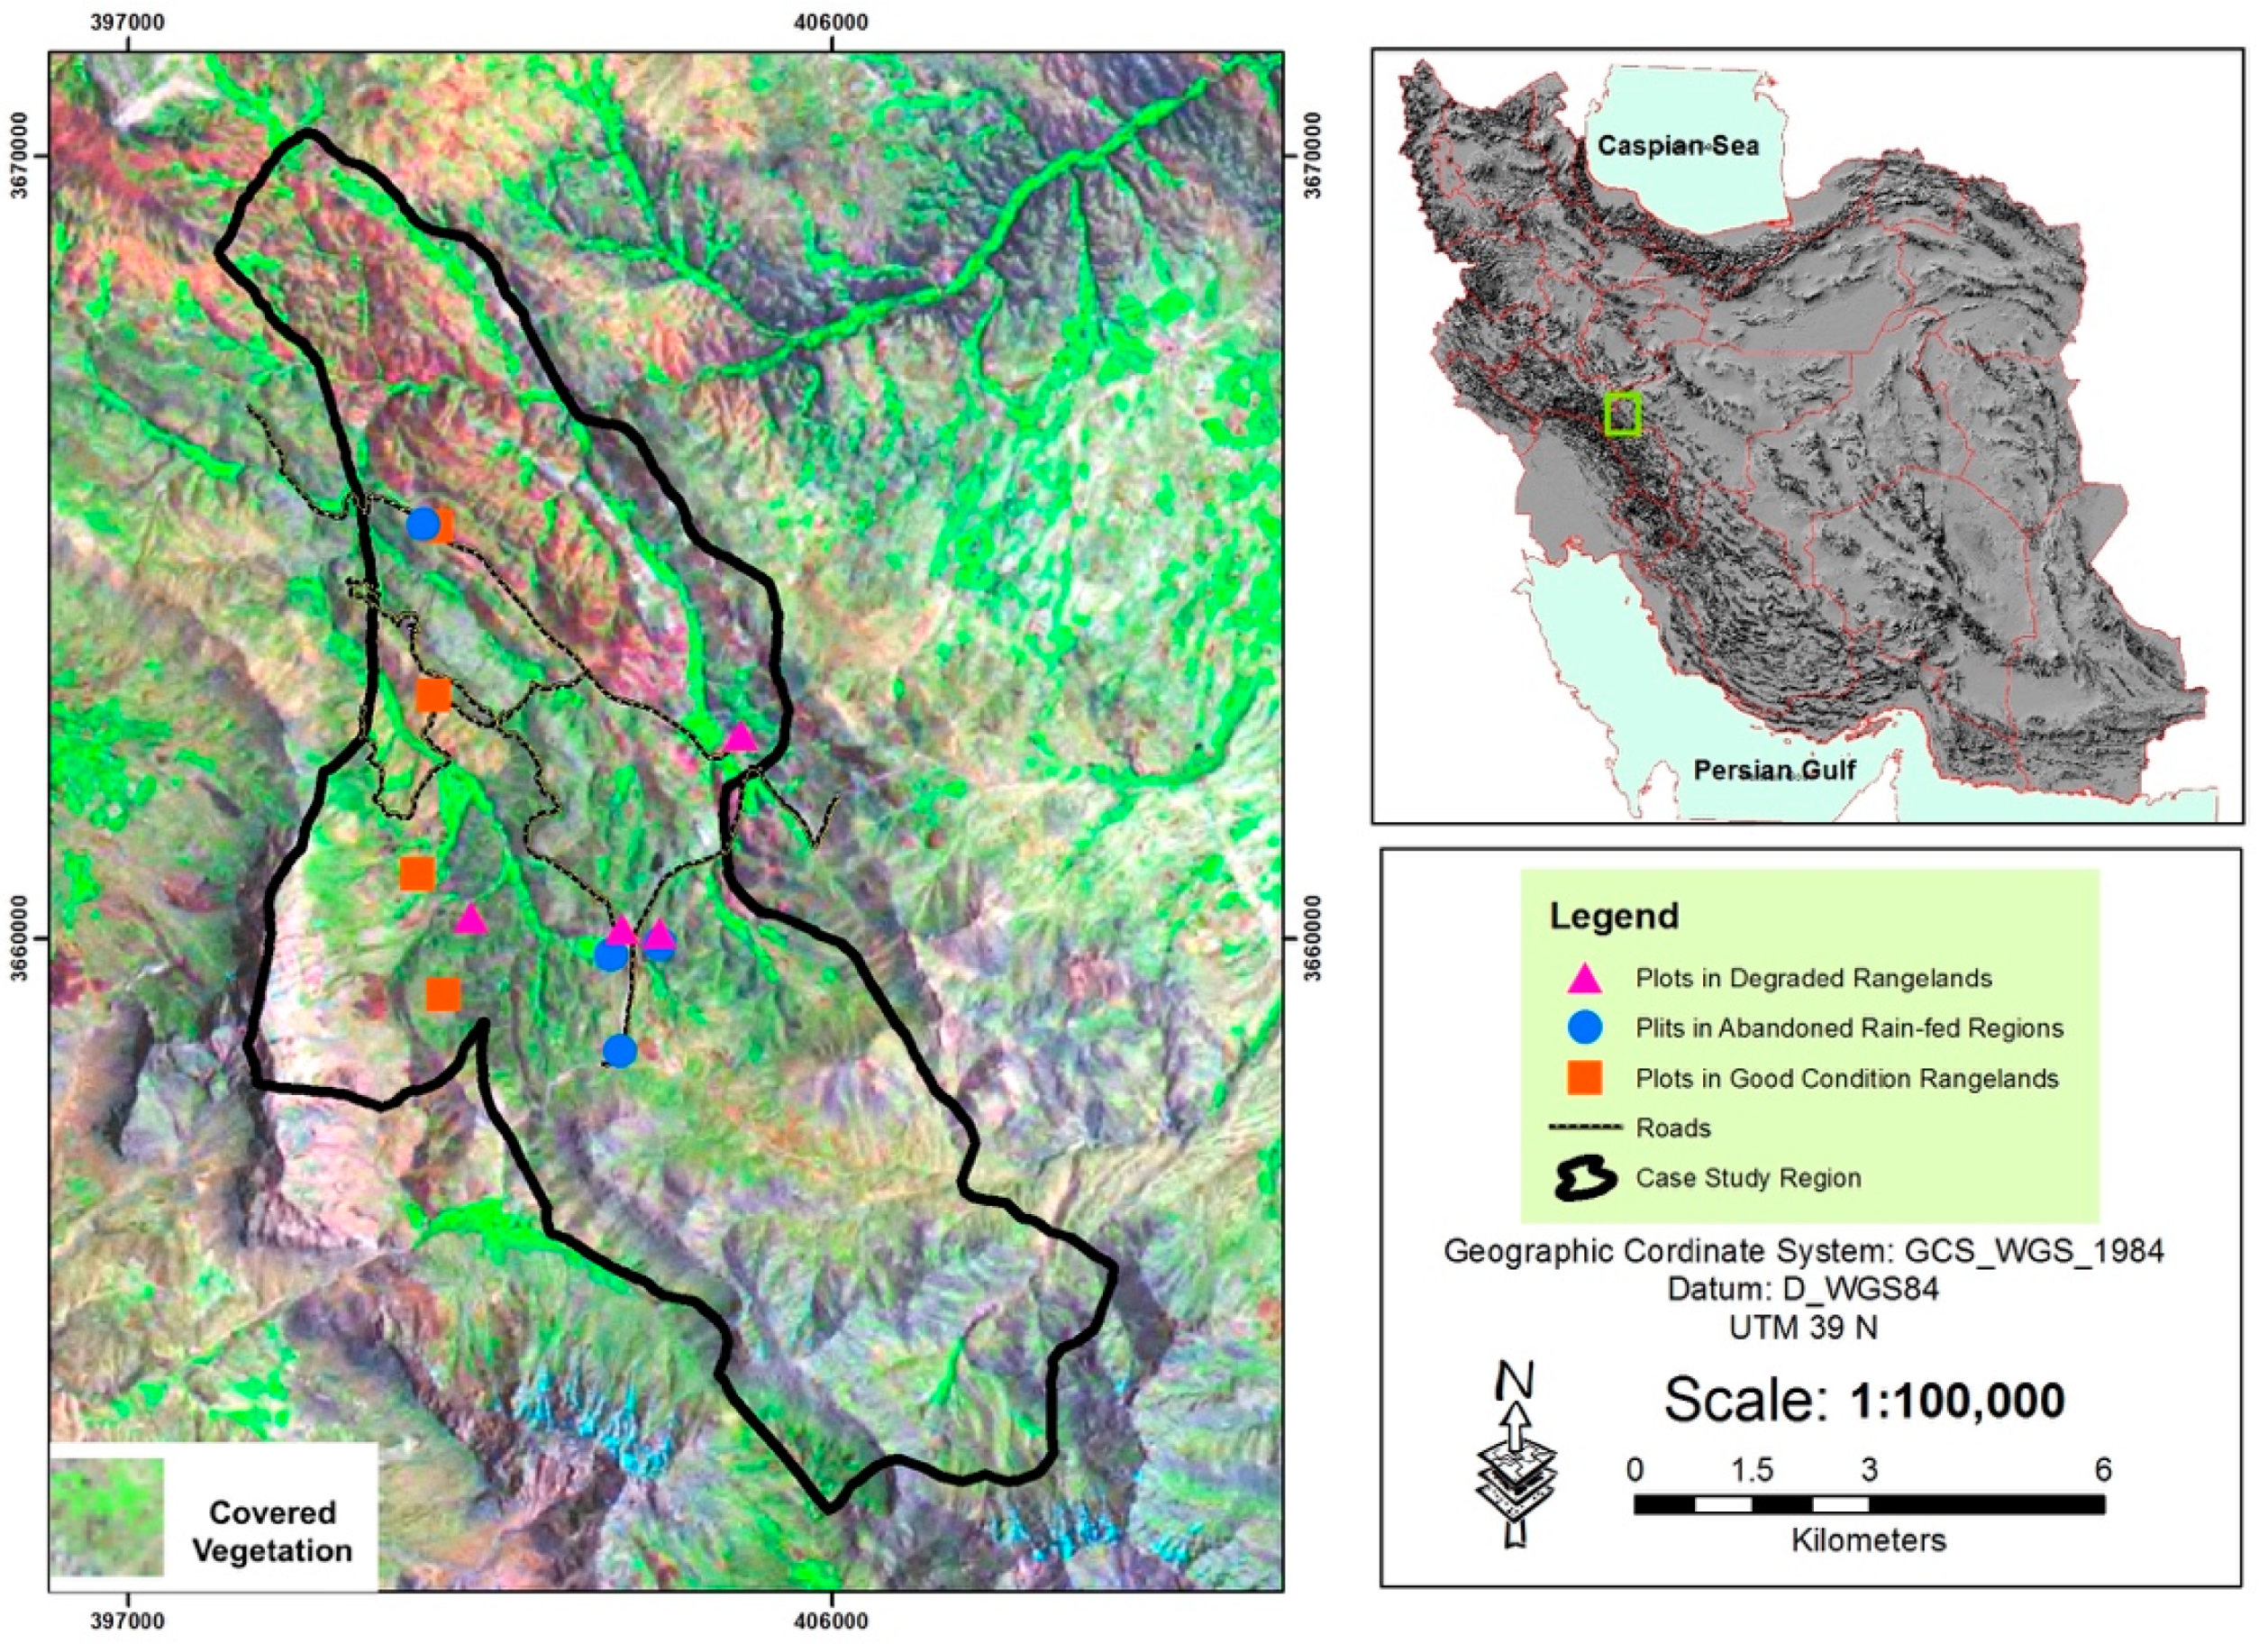
The study area is located in the South of Karchambouy and Northeast of Boin va Miandasht town, west of the Isfahan province and covers about 9677.5 ha. The geographic coordinates are 49°50′46″ E to 50°00′36″ E and 33° 02′27″ N to 33°11′18″ N. The average annual precipitation exceeds 430 mm and the average annual temperature reaches 9.9 °C (Figure 1). The average land area of the study site is covered by vegetation and in the degraded rangelands, vegetation cover is poor and has an upward trend. Topographically, the area consists of areas that are 2290 m above sea level. Grazing intensity is various in different areas from low to high but generally is high. Astracantha sp., Ferulaovina, Contaurea, and Agropyron sp. are the major plantation cover in study area. The geology of the studied area is mostly alluvial sediments that has been developed from the Quaternary alluvium. According to the WRB system, soil type in this region is Cambisols.
The number of livestock in Fereydan is estimated at 214,810. There are two main types of livestock used to graze grasslands, sheep (197,928) and goats (16,882). The villagers feed their domestic animals partly by fodder, but they also rely heavily on natural pastures which have been diminishing through overgrazing. The intensification of dairy farming has also been found to have a deleterious effect on soil quality, particularly in terms of compaction by trampling, which results in losses of production, pasture quality, and hydraulic conductivity [32]. One of the most important soil properties vulnerable to animal trampling is penetration resistance that is highly sensitive to animal trampling. Grazing effects on soil structural stability were significant only in periods when the soil dried, and it was suggested that stocking rates had to be regulated in those dry periods. However, some workers have reported that animal trampling did not show a significant effect on soil physical properties.
2.2. Methodology
The methodology consisted of the primary recognition and pre-assessment site visits for defining vegetation types. Using random-systematic method, soil and vegetation were sampled in key areas of each vegetation type in 2014. Firstly, the study area was divided into three states of conditions; i.e., good condition rangelands, poor condition rangelands and abandoned rain-fed areas. Rangelands, with 0–26%, 26–50%, 50–75%, and 76–100% vegetation are called respectively poor, fair, good, and excellent condition rangelands [33]. Iran has a total of 90 million ha of rangeland. These rangelands are divided into three parts according to their qualities. These qualities are known as ‘good’, ‘fair’ and ‘poor’. The ‘good’ quality lands comprise 14 million, the ‘fair’ quality lands comprise 60 million and the ‘poor’ quality lands comprise 16 million ha. In this study, rangelands with 51–100% vegetation are called good condition rangelands. Poor condition rangelands consist of those rangelands with 1–50% vegetation. Abandoned rain-fed areas consist of those rangelands with no vegetation cover. Abandoned rain-fed areas are abandoned by their owners because of low potentials for yielding. IWMI (International Water Management Institute) [34] defined abandoned rain-fed as those that cannot be reallocated to irrigate crops or use for other purposes. Given that, they are not included in agricultural land but animal grazing; we considered them as rangeland in this study. The three treatments were not contiguous patches but many mosaic-like patches.
Every condition; i.e., good condition rangelands, poor condition rangelands and abandoned rain-fed areas was divided into 20 regular blocks. With a random number generator, numbers between 1 and 20 were selected. This provided the location of the blocks. Then, in every condition; i.e., good condition rangelands, poor condition rangelands and abandoned rain-fed areas, four homogenous areas were selected by stratified random sampling method according to similar topography, soil etc. A land unit area (LUA) map was applied as a homogenous field area to guide soil sampling. LUA is a fundamental concept of ecology and is defined as an ecologically homogeneous area of land, considering the scale of the field [35]. A total number of 12 sites were selected and soil and vegetation were sampled. In each of the 12 sites, a sample was drawn at lengths of 300 m transects with 8 plots in the good condition rangelands, 20 plots in the poor condition rangelands, and 7 plots in the abandoned rain-fed rangelands. The sampling plots of 1 m2 size were applied for the vegetation type and its distribution. The recorded data in each plot consisted of floristic lists, canopy covers, vegetation density, and the percentage of gravel cover.
In each site with three replications, six soil profiles with an equal distribution were excavated. Soil sampling was conducted in the 0–30 cm depth from the surface topsoil (totally 12 profiles) in order to examine soil characteristics including clay, silt and sand content, soil moisture content, lime content, pH, EC, and organic matter as well as gravel content. Once the soil was dried, it was sieved by a 2 mm mesh size sieve. Table 1 shows slope conditions for each of the 12 sites.
Distances to roads, villages, and watering points were chosen and considered in order to examine the impacts of human factors. Distances from water or village can be an indicator for grazing intensity; with increased distances, grazing intensity decreases and therefore plant diversity increases. Furthermore, livestock grazing is not the main activity in this study site. In fact, in sites without grazing or with even light grazing, the idea that with increasing distances, grazing intensity decreases and therefore plant diversity increases is not true anymore. Accordingly, in this study the distance to roads, villages and watering points were considered in order to examine the impacts of human factor on the diversity of species. According to the equation of grazing intensity when stocking rate/grazing capacity was >1, it means over grazing and is therefore degraded rangeland and when stocking rate/grazing capacity was ≤1, it is good rangeland.
Soil samples were obtained from three points at each site at a depth of 0–30 cm. The three replicate samples were then homogenized by hand mixing and large live plant material (roots and shoots) and pebbles in each sample were separated by hand and discarded. The soil samples were air-dried and sieved for determination of soil properties. Thus, 70 soil profiles were studied in the site. Soil organic matter (SOM) content was determined by the Walkley–Black method. Soil pH was measured in a saturated paste using a pH electrodes and electrical conductivity (ECe) was determined in the extract using a conductivity meter. Calcium carbonate equivalent (CCE) content was determined by the back-titration method.
The topographic map of the region was geo-referenced in the ArcGIS (geographic information system version 9.3 developed by Environmental Systems Research Institute (ESRI), Redlands, CA, USA), and this led to the measurement of the mentioned parameters of distance to the roads and villages as well as the watering points. The Ecological Methodology software was used in order to identify the species richness in the Fereydan’s rangelands. The Simpson, Shannon, Hill N1 and N2 were used to evaluate the species richness.
2.2.1. Simpson’s Diversity Index
Simpson’s diversity index is a simple mathematical measure that characterizes species diversity in a community. It takes into account the number of present species as well as the abundance of each species. Richness is a measure for the number of different kinds of organisms present in a particular site [36]. This index is calculated according to Equation (1)
where Pi denotes the number of individuals or the frequency of individuals in proportion to the total vegetation individuals. The Simpson index implies dominancy and varies between 0 to 1; ni is the abundance of ith species; N shows the total abundance [37].
Λ = ∑pi; Pi = ni/N
2.2.2. Shannon–Weiner Diversity Index
Two basic assumptions are taken into account in this index. Firstly, the number of individuals is randomly sampled. Secondly, all species present in the society are included. This index is estimated according to Equation (2)
where Pi shows the number of individuals or the frequency of individuals in proportion to the total vegetation individuals; S shows the total species and varies from 0 to 4.5 [38].
2.2.3. Hill N1 Diversity Index
Hill N1 is the index of diversity influenced by species richness which is shown in Equation (3).
where e shows the natural logarithm’s exponent with the quantity of 2.71828, is the Shannon–Weiner equation and N1 is the variety index [39].
2.2.4. Hill N2 Diversity Index
Hill N2 is an index that is predominantly influenced by the abundance of the dominant species as estimated in Equation (4)
where 1/D is the reversed Simpson index.
Neher and Darby (2009) [40] regarded this as N2 (P1 symbolizes the frequency of the first studied species in proportion to the total number of individuals by n samples). The Simpson index or Jenney—Simpson (1-D) index ranges from 0 (low diversity) to maximally 1 (1-1/s) while the reverse Simpson index (1/D) ranges from 1 to S (Simpson’s index) (the number of species in the sample).
The stepwise regression was applied for anticipation species diversity and edaphic and human activities. The best model was selected and reported based on AIC (Akaike information criterion). A model with low AIC is better which are shown in the results. In the regression analysis, species diversity index was applied as dependent and soil, as well as anthropogenic activities were used as independent variables. Soil physical properties such as sand and silt content, clay, saturated soil’s moisture content and gravel percentage and also chemical properties such as lime content, pH, electro conductivity (EC), and organic matter content were measured. Moreover, human activities including distance from roads, villages, and watering point were considered.
3. Results
Table 2 shows the physicochemical properties of soils in different land management situations in this study. The results of the ten experimented physicochemical properties of the soil indicated that only the amount of organic matter has a significant difference between the studied rangeland sites. The rangeland in good conditions had the highest amount of organic matter compared to the other two studied rangelands. When water logging occurs in the soil, it will result in the accumulation of organic matter. The higher densities of the dominant species can also cause more organic matter in the soil.
Table 3 presents the results for investigating the effects of human activities on plant communities showing the distance from a few man-made facilities in the study site. As the table shows, the good condition rangeland sites are located more than 1 km away from human infrastructure (such as road, watering place etc.) and rural sites whereas abandoned rain-fed and poor condition rangelands are located in the vicinity of the human infrastructures. Accordingly, these two categories of rangelands have less than 200 and 500 m distance from the roads and water holes, respectively.
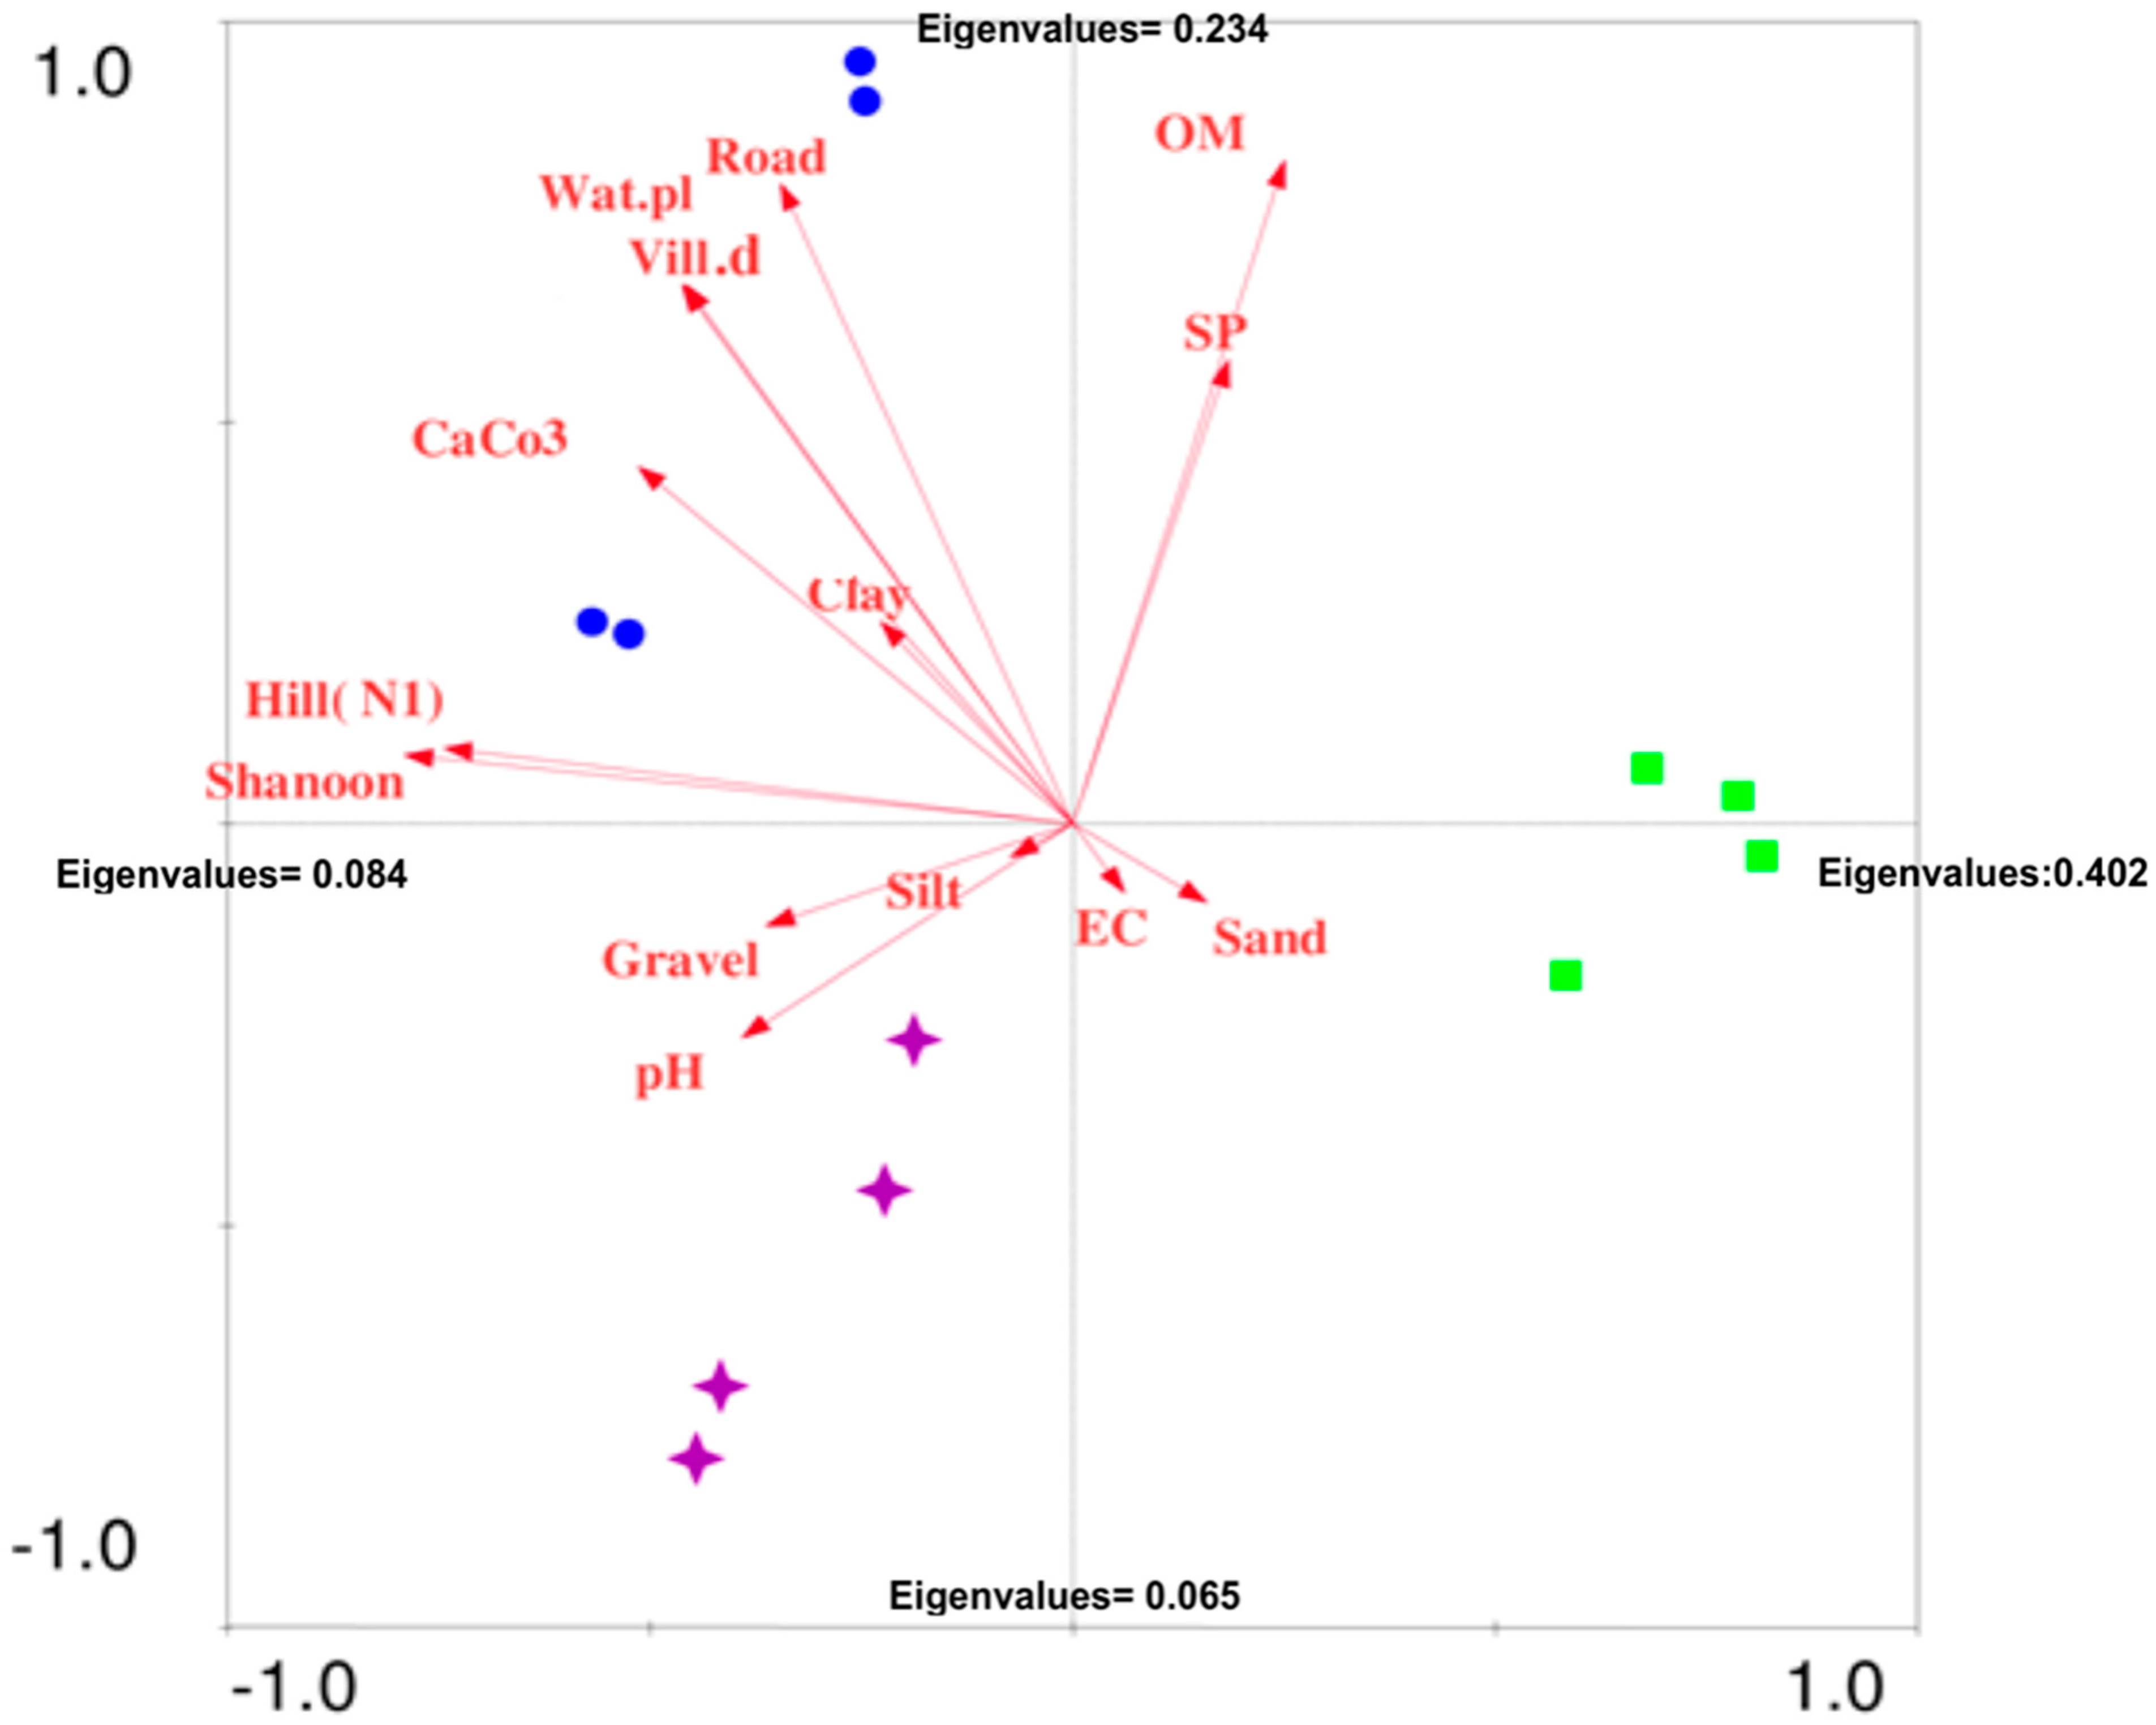
In order to identify the most important environmental factors influencing the vegetation diversity, the PCA (principle component analysis) was applied which supports the importance of the variables devised in each factor [41]. This method is concerned with establishing which linear components exist within the data and how a particular variable might contribute to that component [42]. In accordance with eigenvalues of the PCA axis, which are useful for selecting the axis, the most important axis was selected. According to the results, the first and second axis justify the most significant changes of the eigenvalues, respectively 0.402 and 0.234. Therefore, the most important factors correspond to the first and then second axis. Thus, according to the eigenvalues, the most effective factors evaluated in the study are located in the first and second axis including CaCO3, watering place, village distance, and roads.
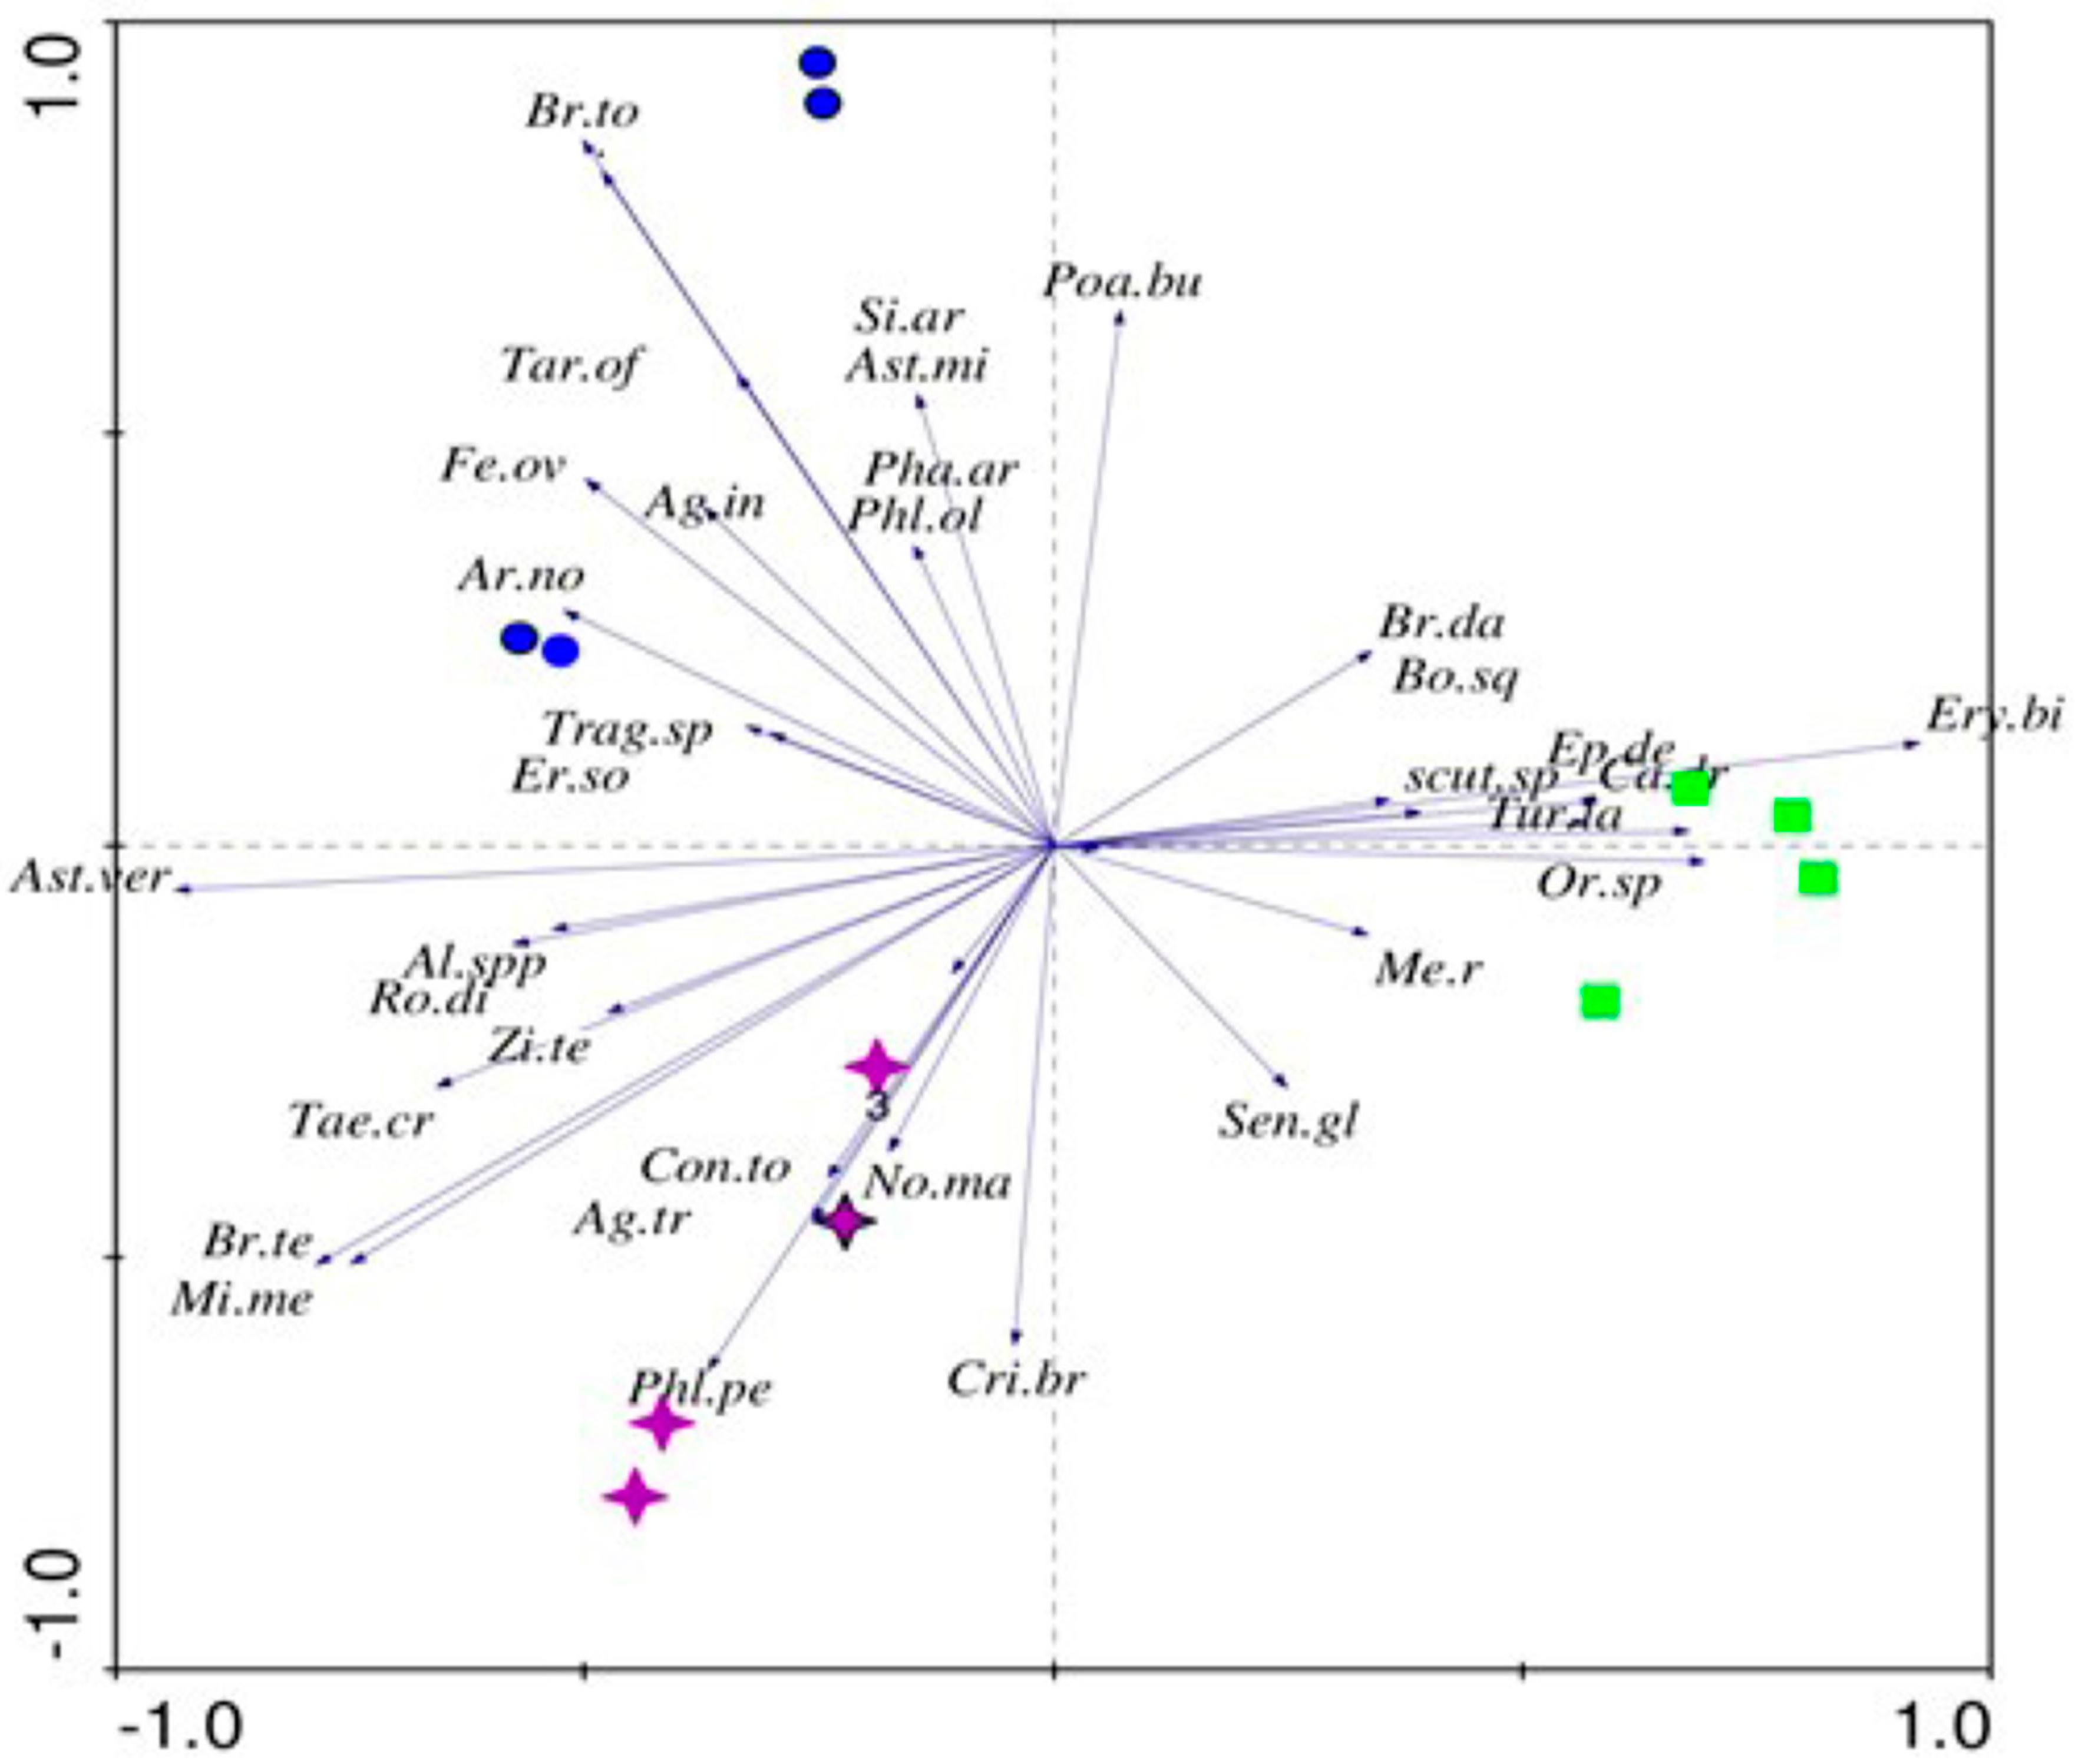
Figure 2 and Figure 3 show the result of the PCA method for distribution of plant species in the study site and the effective environmental and anthropogenic disturbance in the coordinate axis. Accordingly, SP (saturation percentage) percentage and OM (organic matter) axis are in the same direction and the low angle is a sign of high correlation between these two factors. Shannon and Hill diversity indices in good condition rangelands in the second quarter of the coordinate axis show high plant diversity. Poor condition rangeland is located in the third quarter of the coordinate axis and soil factors including silt, pH, and gravel content are effective in the distribution of poor quality plant species while the abandoned rain-fed site is located in the first and fourth quarters of the coordinate axis. Floristic list in the designated site is shown in the Table 4 with the percentage of the relative frequency. Major vegetation of abandoned rain-fed areas has low or non-palatability and the vegetation of abandoned rain-fed includes invasive species. Main species is Eryngium billardieri and accompanying species are Boissiera squarrosa and Euphorbia descipiens. In the good condition rangelands, the dominant species is Bromus tomentellus and other accompanying species are: Astragalus verus, Ferula ovina, and Eremo songarica. Annual species and non-palatable ones such as Bromus tectorum and Astragalus verus are the main plant cover of poor condition rangelands.
Furthermore, the indices of plants richness and diversity were analyzed. In doing so, the Hill N1 and Shannon–Weiner were applied as appropriate indices to approximate species diversity.
The results of the Simpson, Shannon, Hill N1, and Hill N2 are presented in Table 5 and Table 6 illustrating that the maximum and minimum values belong to the Hill N1 and Simpson diversity indices, respectively. The estimated Shannon and Hill N1 indices show significant difference between the good rangeland site and abandoned rain-fed or poor condition rangeland based on all species (p ≤ 0.05). Also, the calculated diversity indices based on perennial species coverage show significant difference between the good condition rangeland site and abandoned rain-fed or poor condition rangeland (p ≤ 0.05). In the multivariate regression analysis, the Shannon–Weiner and Hill N1 species diversity index is applied as dependent, and soil and anthropogenic activities used as independent variables.
4. Discussion
According to the results of this study, among all the tested physicochemical properties of soil, the amount of organic matter indicated a significant difference between the three types of rangeland sites (i.e.,1.4, 1, and 1.3 percent for good rangeland, degraded rangeland, and abandoned dry land farming, respectively). Accordingly, the first hypothesis is rejected as only organic matter indicated a significant difference between the rangeland sites. Similarly, using the same methodology, Zare et al. (2011) [43] found that salinity, soil texture, effective soil depth, potassium, organic matter, available nitrogen, lime, and soil moisture criteria were the main soil parameters responsible for diversity in vegetation pattern in Shahriyar rangelands, Iran. If water logging occurs in the soil, it will cause the accumulation of organic matter [44]. The higher densities of dominant species can also be the cause for more organic matter in the soil. While the proper utilization of the natural ecosystems is leading to the preservation of biological diversity, exclusive conservation will not bring about biological diversity at its most appropriate condition [45]. In this study, organic matter is projected to be the most influential soil component in the plant species to establish their diversity (i.e., 1.4, 1, and 1.3 percent for good rangeland, degraded rangeland, and abandoned dry land farming, respectively). Hersak (2004) [46] also suggested that soil organic matter and nitrogen content should be considered as the most important factors to define plant succession series over the sand dunes of the northern parts of Croatia.
Examining different rangelands in the Fereydan district showed the existence of a significant difference of species diversity between good condition rangelands compared with the other sites. Accordingly, the second hypothesis of the study is accepted as plant diversity is different between rangeland sites. This study showed that among soil chemical and physical characteristics, only soil organic matter has a direct relationship with the vegetation cover. According to the fact that in the studied rangelands, geological and physiographic features show slight differences, it could be concluded that species diversity has no effect on the edaphic factors and any change made in the soil organic matter is the overall outcome of the interactions of soil and vegetation which itself is under the influence of the utilization level.
With regard to the effects of human-related factors, this study showed that the rangeland areas are in good condition when they are located at a far distance from rural areas and constructed facilities (such as road, watering place) by human in the study site whereas abandoned rain-fed and degraded rangelands are located much closer to these three human infrastructures. Accordingly, the third hypothesis of the study is also accepted as human activities have influential impacts on species diversity. Perhaps, in farther distances, grazing intensity decreases, thus species diversity increases. One of the factors that is effective in plant communities is grazing due to livestock density around the watering places. Findings of Zhao (2007) [47] and Todd and Hoffman (2009) [48] suggest that grazing has significant influence on vegetation to the extent that the number of the palatable species decreases and coverage of ephemerals increases considerably. Similarly, decreased local species diversity is confirmed as a widespread impact of human activity [49,50]. De Bello (2006) [51] observed the highest number of rare species in abandoned areas, while abandoned areas correspond to the lowest species diversity in this study. Mitchell et al. (2002) [32] reported that the reduction in species diversity is preceded by destructive human operations and this could result in a loss of primary production. Also, communities that lost the species dominant at high diversity had higher pathogen loads, presumably because relaxed competition allowed greater in-creases in host abundances. In total, their results support the hypothesis that decreased species richness will increase foliar pathogen load if this increases the host abundance and, therefore, disease transmission. Bornman et al. (2008) [52] provided the evidence that distance to water acts as one of the most critical variables determining the distribution of plant types in Southern Africa that is consistent with our findings. According to the previous study, there are environmental variables that had the greatest influence on the distribution of the dominant salt marsh species. These environmental variables included soil moisture, distance from the estuary, elevation above mean sea level, and depth to the water table. The most important ecological driver for salt marsh vegetation, especially along the arid west coast of southern Africa, is moisture. Woldewahid et al. (2007) [53] also reported that access to water and land-use conditions are the main human factors affecting the distribution of plant types along the coasts of the Red Sea, Sudan that is also in line with the current study findings.
Furthermore, the results of PCA in this study showed that the most effective factors affecting the plant diversity index are CaCO3, watering place, village distance and roads (i.e., the most significant changes of the eigenvalues are respectively 0.402 and 0.234). Similarly, Qian (2008), by applying a cluster analysis and PCA in China, considered soil chemical and physical characteristics such as nutrients, moisture, salinity, and pH as the main determinants of ecosystem’s homogeneity and the spatial distribution of plant societies in that area.
There are different studies that investigate the relations between various edaphic, environmental and human activities and their impact on plant diversity and distribution, such as Zare et al. (2011) [43] in Iran and Wang et al. (2012) [7] in Qinghai-Tibet Plateau of China. Similarly, Gholinejad et al. (2012) [23] showed that major factors influencing the plant communities’ distribution in rangelands of Kamyaran rangelands, Iran are physical soil properties and physiographic parameters amongst which soil texture is one of the most effective determinants in the distribution of plant communities in the studied region. With regard to the distribution of plant species in the study area and effective environmental and anthropogenic disturbance, SP percentage, and OM showed a significant difference between the study sites. Moreover, Shannon and Hill diversity indices in good condition rangeland show high plant diversity. Whittaker (1977) [54] observed that the highest diversity of plants is seen in good condition rangelands. Distance from village, clay percentage and lime content are effective in high diversity and the distribution of plant species such as Bromus tomentellus, Festuca ovina, and other desirable species for livestock. In contrast, soil factors such as silt, pH, and gravel content are effective in the distribution of poor quality plant species in poor condition rangelands. Rutherford and Powrie (2010) [55] studied to quantify and understand the impact of severe land degradation on plant diversity in Succulent Karoo in South Africa and found that although the total number of species declined due to heavy grazing, greater equality resulted in an increase in species diversity.
According to this study, the Hill N1 index is the best for recognition the difference between different rangelands. This is in the line with Peet’s (1974) [56] results about the Hill index. However, Magurran (1988) [57] determined that the Shannon diversity and Simpson diversity indices are the best for recognition of species diversity. The estimated Shannon and Hill N1 indices in this study showed significant differences between the good rangeland area and abandoned rain-fed or poor condition rangelands based on all species as well as on perennial species coverage. Panitsa et al. (2010) [58], applied stepwise regressions to test the effects of similar factors on the species richness of native and especially of endemic plants, at local scales. They concluded that a strong correlation exists between intercept values arising from species–area relationships at the family level and total richness of these families in their studied area (South Aegean, Greece).
5. Conclusions
The study showed that distance to roads, villages, and watering points can affect rangeland sites. Poor condition rangelands and good condition rangelands have the closest and the farthest distances to the human made facilities, respectively. Good condition rangelands have the highest level of species diversity and richness among all the mentioned sites. According to the multivariate regression analysis, the most influential factor on the species diversity index is the distance to village parameter; which signifies the important role of humans in degrading rangelands and reducing species diversity. Accordingly, this study concludes that the best way to conserve natural ecosystems, especially rangeland ecosystems is rangelands management in terms of extending and reserving plant species diversity. This study addressed some dimensions of interactions between human and environmental factors and plant vegetation in native rangelands within semi-arid areas of Iran. It was forecasted that the result of this study could be utilized as a basis for anticipating of the probability of the plant species in rangeland within similar ecosystems and recommend the suitable guidance for management and development of rangelands for similar regions.
The current study had some limitations in selecting soil properties. This study just focused on soil physical properties such as sand and silt content, clay, saturated soil’s moisture content, and gravel percentage as well as chemical properties such as lime content, pH, electro conductivity, and organic matter content. So, we recommend that future studies focus on determining biological and physical properties of soil quality assessment after land sue change, such as soil respiration, carbon biomass, hydraulic conductivity, soil aggregation, and mean weight diameter. It is also recommended that future studies focus on determining the degree of protection of the species and identify vulnerable, endangered, and critically endangered species.
Author Contributions
H.E. and G.A. performed the study and developed the main text; P.L. and H.A. enriched the text and helped the first two authors to address the reviewers’ comments.
Funding
We acknowledge Isfahan University of Technology (IUT) for its support and laboratory facilities. Also, thanks to Mehdi Basiri and Mstafa Tarkesh for their advice.
Conflicts of Interest
The authors declare no conflict of interest.
References
- Pugnaire, F.I.; Armas, C.; Maestre, F.T. Positive plant interactions in the Iberian southeast: Mechanisms, environmental gradients, and ecosystem function. J. Arid Environ. 2011, 75, 1310–1320. [Google Scholar] [CrossRef]
- Lindo, Z.; Winchester, N.N. Spatial and environmental factors contributing to patterns in arboreal and terrestrial oribatid mite diversity across spatial scales. Oecologia 2009, 160, 817–825. [Google Scholar] [CrossRef] [PubMed]
- Erfanzadeh, R.; Bahrami, B.; Motamedi, J.; Petillon, J. Changes in soil organic matter driven by shifts in co-dominant plant species in a grassland. Geoderma 2014, 213, 74–78. [Google Scholar] [CrossRef] [Green Version]
- Bruun, T.B.; Elberling, B.; de Neergaard, A.; Magid, J. Organic carbon dynamics in different soil types after conversion of forest to agriculture. Land Degrad. Dev. 2015, 26, 272–283. [Google Scholar] [CrossRef]
- de Oliveira, S.P.; de Lacerda, N.B.; Blum, S.C.; Escobar, M.E.O.; de Oliveira, T.S. Organic carbon and nitrogen stocks in soils of Northeastern Brazil converted to irrigated agriculture. Land Degrad. Dev. 2015, 26, 9–21. [Google Scholar] [CrossRef]
- Wang, Z.R.; Yang, G.J.; Chen, S.Y.; Wu, Z.; Guan, J.Y.; Zhao, C.C.; Zhao, Q.D.; Ye, B.S. Effects of environmental factors on the distribution of plant communities in a semi-arid region of the Qinghai-Tibet Plateau. Ecol. Res. 2012, 27, 667–675. [Google Scholar] [CrossRef]
- Zhang, Y.; Chen, Y.; Zhang, D. Quantitative classification and analysis on plant communities in the middle reaches of the Tarim River. J. Geogr. Sci. 2003, 13, 225–232. [Google Scholar]
- Enright, N.J.; Miller, B.P.; Akhter, R. Desert vegetation and vegetation-environment relationships in Kirthar National Park, Sindh, Pakistan. J. Arid Environ. 2005, 61, 397–418. [Google Scholar] [CrossRef]
- Pabst, R.J.; Spies, T.A. Distribution of herb and shrubs in relation to landform and canopy cover in riparian forests of coastal Oregon. Can. J. Bot. 1998, 76, 298–315. [Google Scholar]
- Lavergne, S.; Thuiller, W.; Molin, J.; Debussch, M. Environmental and human factors influencing rare plant local occurrence, extinction and persistence: A 115-year study in the Mediterranean region. J. Biogeogr. 2005, 32, 799–811. [Google Scholar] [CrossRef]
- Guo, Z.G.; Long, R.J.; Niu, F.J.; Wu, Q.B.; Hu, Y.K. Effect of highway construction on plant diversity of grassland communities in the permafrost regions of the Qinghai–Tibet plateau. Rangel. J. 2007, 29, 161–167. [Google Scholar] [CrossRef]
- Suzart, D.; Albuquerque, F.; Castro-Díez, P.Á.; Rodríguez, M.; Cayuela, L. Assessing the influence of environmental and human factors on native and exotic species richness. Acta Oecol. 2011, 37, 51–57. [Google Scholar]
- Zhang, J.T. Effects of grazing intensity, soil variables, and topography on vegetation diversity in the subalpine meadows of the Zhongtiao Mountains, China. Rangel. J. 2009, 31, 353–360. [Google Scholar] [CrossRef]
- El-Khouly, A.A.L. Effect of Human Activities on Vegetation Diversity in Siwa Oasis. In Proceedings of the International Conference on Water Resources & Arid Environment, Riyadh, Saudi Arabia, 5–8 December 2004; Organizers: King Saud University: Riyadh, Saudi Arabia, 2004. [Google Scholar]
- Pueyo, Y.; Alados, C.L.; Ferrer-Benimeli, C. Is the analysis of plant community structure better than common species-diversity indices for assessing the effects of livestock grazing on a Mediterranean arid ecosystem? J. Arid Environ. 2006, 64, 698–712. [Google Scholar] [CrossRef]
- Mligo, C. Effect of Grazing pressure on plant species Composition and diversity in the semi-arid rangelands of Mbulu district, Tanzania. Agric. J. 2006, 1, 277–283. [Google Scholar]
- Lieskovský, J.; Kenderessy, P. Modelling the effect of vegetation cover and different tillage practices on soil erosion in vineyards: A case study in vráble (Slovakia) using WATEM/SEDEM. Land Degrad. Dev. 2014, 25, 288–296. [Google Scholar] [CrossRef]
- Fernández-Romero, M.L.; Lozano-García, B.; Parras-Alcántara, L. Topography and land use change effects on the soil organic carbon stock of forest soils in Mediterranean natural areas. Agric. Ecosyst. Environ. 2014, 195, 1–9. [Google Scholar] [CrossRef]
- Liu, M.Y.; Chang, Q.R.; Qi, Y.B.; Liu, J.; Chen, T. Aggregation and soil organic carbon fractions under different land uses on the tableland of the Loess Plateau of China. Catena 2014, 115, 19–28. [Google Scholar] [CrossRef] [Green Version]
- Mohawesh, Y.; Taimeh, A.; Ziadat, F. Effects of land use changes and soil conservation intervention on soil properties as indicators for land degradation under a Mediterranean. Solid Earth 2015, 6, 857–868. [Google Scholar] [CrossRef]
- Soule, J.D.; Piper, J.K. Farming in Nature’s Image: An Ecological Approach to Agriculture; Island Press: Washington, DC, USA, 1992. [Google Scholar]
- Weil, R.R. Soil properties and Native Plant Communities in a Kansas Prairie. Thesis Carol Sue Gordon, Master of Science, University of Maryland, College Park, MD, USA, 2004; 106p. [Google Scholar]
- Gholinejad, B.; Farajollahi, A.; Pouzesh, H. Environmental factors affecting on distribution of plant communities in semiarid area (Case study: Kamyaran rangelands, Iran). Ann. Biol. Res. 2012, 3, 3990–3993. [Google Scholar]
- Zare Chahouki, M.A.; Azarnivand, H.; Jafari, M.; Shafizadeh, M. Effects of soil characteristics on distribution of vegetation types in Poshtkouh rangelands of Yazd Province (Iran). J. Environ. Res. Dev. 2008, 2, 840–848. [Google Scholar]
- Munhoz, C.B.R.; Felfili, J.M.; Rodrigues, C. Species-environment relationship in the herb-subshrub layer of a moist savanna site, Federal District, Brazil. Braz. J. Biol. 2008, 68, 25–35. [Google Scholar] [CrossRef]
- Timsina, B.; Shrestha, B.B.; Rokaya, M.B.; Münzbergová, Z. Impact of Parthenium hysterophorus L. invasion on plant species composition and soil properties of grassland communities in Nepal. Flora–Morphol. Distrib. Funct. Ecol. Plants 2011, 206, 233–240. [Google Scholar] [CrossRef]
- Poeplau, C.; Don, A.; Vesterdal, L.; Leifeld, J.; Van Wesemael, B.A.S.; Schumacher, J.; Gensior, A. Temporal dynamics of soil organic carbon after land-use change in the temperate zone–carbon response functions as a model approach. Glob. Chang. Biol. 2011, 17, 2415–2427. [Google Scholar] [CrossRef]
- Dunn, J.B.; Mueller, S.; Kwon, H.Y.; Wang, M.Q. Land-use change and greenhouse gas emissions from corn and cellulosic ethanol. Biotechnol. Biofuels 2013, 6, 51. [Google Scholar] [CrossRef]
- Gerber, S.; Hedin, L.O.; Keel, S.G.; Pacala, S.W.; Shevliakova, E. Land use change and nitrogen feedbacks constrain the trajectory of the land carbon sink. Geophys. Res. Lett. 2013, 40, 5218–5222. [Google Scholar] [CrossRef] [Green Version]
- Houghton, R.A. Revised estimates of the annual net flux of carbon to the atmosphere fromchanges in land use and land management 1850–2000. Tellus 2003, B55, 378–390. [Google Scholar]
- Pearson, R.G.; Dawson, T.P. Predicting the impacts of climate change on the distribution of species: Are bio climate envelope models useful? Glob. Ecol. Biogeogr. 2003, 12, 361–371. [Google Scholar] [CrossRef]
- Mitchell, C.E.; Tilman, D.; Groth, J.V. Effects of plant species diversity, abundance and composition on foliar fungal diseases. J. Ecol. 2002, 83, 1713–1726. [Google Scholar] [CrossRef]
- Stoddard, L.A.; Smith, S.D.; Box, T.W. Range-condition Analysis. In Range Management; McGraw-Hill Book Co.: New York, NY, USA, 1975. [Google Scholar]
- IWMI (International Water Management Institute). Strategic analyses of the national river linking project (NRLP) of India series 5. In Proceedings of the Second National Workshop on Strategic Issues in Indian Irrigation, New Delhi, India, 8–9 April 2009. [Google Scholar]
- Gharechelou, S.; Tateishi, R.; Sharma, R.C.; Johnson, B.A. Soil Moisture Mapping in an Arid Area Using a Land Unit Area (LUA) Sampling Approach and Geostatistical Interpolation Techniques. Int. J. Geo-Inf. 2016, 5, 35. [Google Scholar] [CrossRef]
- Begon, M.; Harper, J.L.; Townsend, C.R. Ecology: Individuals, Populations, and Communities, 3rd ed.; Blackwell Science Ltd.: Cambridge, MA, USA, 1996. [Google Scholar]
- Magurran, A.E. Measuring Biological Diversity; Blackwell Science Publishing: Hoboken, NJ, USA, 2004. [Google Scholar]
- Clarke, K.R.; Warwick, R.M. Changes in Marine Communities: An Approach to Statistical Analysis and Interpretation, 2nd ed.; PRIMERE: Plymouth, UK, 2001. [Google Scholar]
- Greenstreet, S.; Robinson, L.; Reiss, H.; Craeymeersch, J.; Callaway, R.; Goffin, A.; Jorgensen, L.; Robertson, M.; Kröncke, I.; DeBoois, I.; et al. Species Composition, Diversity, Biomass and Production of the Benthic Invertebrate Community of the North Sea; Fisheries Research Services Collaborative Report No. 10/07; Fisheries Research Services: Aberdeen, UK, 2007. [Google Scholar]
- Neher, D.A.; Darby, B.J. Nematodes as Environmental Bio Indicators. Chapter 4: General Community Indices That Can Be Used for Analysis of Nematode Assemblages; CABI publishing: Oxon, UK, 2009; pp. 107–123. [Google Scholar]
- Vyas, S.; Kumaranayake, L. Constructing socio-economic status indices: How to use principal components analysis. Health Policy Plan. 2006, 21, 459–468. [Google Scholar] [CrossRef] [PubMed]
- Field, A. Discovering Statistics Using SPSS, 2nd ed.; SAGE Publications: London, UK, 2005. [Google Scholar]
- Zare, S.; Jafari, M.; Tavili, A.; Abbasi, H.; Rostampour, M. Relationship between environmental factors and plant distribution in arid and semiarid area (case study: Shahriyar rangelands, Iran). Am. Eurasian J. Agric. Environ. Sci. 2011, 10, 97–105. [Google Scholar]
- Jafari, M. Reclamation of Arid Lands, 1st ed.; University of Tehran Press: Tehran, Iran, 2006. [Google Scholar]
- Naveh, A.; Whittaker, R.H. Structural and floristic diversity of shrub lands and woodlands in northern Israel and other Mediterranean areas. Plant Ecol. 1979, 41, 171–190. [Google Scholar] [CrossRef]
- Hersak, V. Vegetation succession and soil gradients on Inland sand dunes. J. Ekol. (Bratisl.) 2004, 23, 24–39. [Google Scholar]
- Zhao, W.Y. Changes in vegetation diversity and structure in response to heavy grazing pressure in the northern Tianshan Mountains. J. Arid Environ. 2007, 6, 465–479. [Google Scholar] [CrossRef]
- Todd, S.W.; Hoffman, T. A fence line in time demonstrates grazing induced vegetation shifts and dynamics in the semiarid Succulent Karoo. Ecol. Appl. 2009, 19, 1897–1908. [Google Scholar] [CrossRef] [PubMed]
- Pimm, S.L.; Russell, G.; Gittleman, J.L.; Brooks, T.M. The future of biodiversity. Nature 1995, 269, 347–350. [Google Scholar] [CrossRef] [PubMed]
- Vitousek, P.M.; Mooney, H.A.; Lubchenco, J.; Melillo, J.M. Human domination of Earth’s ecosystems. Science 1997, 277, 494–499. [Google Scholar] [CrossRef]
- De Bello, F.; Jan, L.; Maria-Teresa, S. Variations in species and functional plant diversity along climatic and grazing gradients. Ecography 2006, 29, 801–810. [Google Scholar] [CrossRef]
- Bornman, T.G.; Adams, J.B.; Bate, G.C. Environmental factors controlling the vegetation zonation patterns and distribution of vegetation types in the Olifants Estuary. S. Afr. J. Bot. 2008, 74, 685–695. [Google Scholar] [CrossRef]
- Woldewahid, G.; Werf, W.; Vander-Sykora, K.V.; Abate, T.; Mostafa, B.; Huis, A.V. Description of plant communities on the red sea coastal plain of Suden. J. Arid Environ. 2007, 68, 113–131. [Google Scholar] [CrossRef]
- Whittaker, R.H. Evolution of species diversity in land communities. Evol. Biol. 1977, 10, 1–67. [Google Scholar]
- Rutherford, M.C.; Powrie, L.W. Severely degraded rangeland: Implications for plant diversity from a case study in Succulent Karoo, South Africa. J. Arid Environ. 2009, 74, 692–701. [Google Scholar] [CrossRef]
- Peet, R.K. The measurement of species diversity. Annu. Rev. Ecol. Syst. 1974, 5, 285–307. [Google Scholar] [CrossRef]
- Magurran, A.E. Ecological Diversity and Its Measurement; University Press: Princeton, NJ, USA, 1988. [Google Scholar]
- Panitsa, M.; Trigas, P.; Iatrou, G.; Sfenthourakis, S. Factors affecting plant species richness and endemism on land-bridge islands—An example from the East Aegean archipelago. Acta Oecol. 2010, 36, 431–437. [Google Scholar] [CrossRef]
Figure 1.
Location of the case study (the background colorful theme is the region’s ETM+ (The Enhanced Thematic Mapper Plus) satellite image).
Figure 1.
Location of the case study (the background colorful theme is the region’s ETM+ (The Enhanced Thematic Mapper Plus) satellite image).

Figure 2.
Distribution of study area with regard to environmental and human factors using PCA method (OM: organic matter content, SP: Soil saturation percentage, EC: Soil electrical conductivity, pH: soil acidity, Gravel: gravel percentage, ![Agriculture 09 00058 i001]() : good rangeland;
: good rangeland; ![Agriculture 09 00058 i002]() : abandoned rain-fed;
: abandoned rain-fed; ![Agriculture 09 00058 i003]() : poor condition rangeland; CaCO3: lime percentage, Road: distance from road;Wat.pl: distance from watering place; Vill. d: distance to village, Hill (N1): hill diversity index; Shannon: Shannon diversity index; Sand: sand percentage; Silt: silt percentage; Clay: clay percentage).
: poor condition rangeland; CaCO3: lime percentage, Road: distance from road;Wat.pl: distance from watering place; Vill. d: distance to village, Hill (N1): hill diversity index; Shannon: Shannon diversity index; Sand: sand percentage; Silt: silt percentage; Clay: clay percentage).
 : good rangeland;
  : abandoned rain-fed;
  : poor condition rangeland; CaCO3: lime percentage, Road: distance from road;Wat.pl: distance from watering place; Vill. d: distance to village, Hill (N1): hill diversity index; Shannon: Shannon diversity index; Sand: sand percentage; Silt: silt percentage; Clay: clay percentage).
Figure 2.
Distribution of study area with regard to environmental and human factors using PCA method (OM: organic matter content, SP: Soil saturation percentage, EC: Soil electrical conductivity, pH: soil acidity, Gravel: gravel percentage, ![Agriculture 09 00058 i001]() : good rangeland;
: good rangeland; ![Agriculture 09 00058 i002]() : abandoned rain-fed;
: abandoned rain-fed; ![Agriculture 09 00058 i003]() : poor condition rangeland; CaCO3: lime percentage, Road: distance from road;Wat.pl: distance from watering place; Vill. d: distance to village, Hill (N1): hill diversity index; Shannon: Shannon diversity index; Sand: sand percentage; Silt: silt percentage; Clay: clay percentage).
: poor condition rangeland; CaCO3: lime percentage, Road: distance from road;Wat.pl: distance from watering place; Vill. d: distance to village, Hill (N1): hill diversity index; Shannon: Shannon diversity index; Sand: sand percentage; Silt: silt percentage; Clay: clay percentage).
: good rangeland; : abandoned rain-fed; : poor condition rangeland; CaCO3: lime percentage, Road: distance from road;Wat.pl: distance from watering place; Vill. d: distance to village, Hill (N1): hill diversity index; Shannon: Shannon diversity index; Sand: sand percentage; Silt: silt percentage; Clay: clay percentage).
Figure 3.
Plant species distribution related to studied area using PCA method (Ar.no: Arabis nova; Br.to: Bromus tomentellus; Scul.sp: Scutellaria sp.; Fe.ov: Ferula ovina; Bo.sq: Boissera squarrosa; Al.spp: Alyssum.spp; Sen.gl: Senecio glaucus; Ph.ar: Phalaris arundinacea; Phl.ol: Phlomis olivieri; Po.bu: Poa bulbosa; As.mi: Astragalus microsephalus; Si.ar: Silene arbuscula Fenzl ex Boiss; Me.r: Medicago rigidula; Or.sp: Orobanche sp.; Ery.bi: Eryngium billardieri; Ro.di: Rochelia disperma; As.ver: Astragalus verus; No.ma: Noea mucronata; Ep.de: Euphorbia decipiens; Br.da: Bromus danthonia; Con.to: Consolida tomentosa; Cri.br: Cirsium bracteosum; Tae.cr: Taeniatherum crinitum; Zi.te: Ziziphora tenuior; Br.tec: Bromus tecturum; Phl.pe: Phlomis persica; Er.so: Eremo songarica; Mi.me: Minuartia meyeri; Ca.dr: Cardaria draba; Ag.tr: Agropyron trichophorum; Tar.of: Taraxacum officinale; Ag.in: Agropyron intermedium; Trag.sp: Tragpogon sp (graminifolius); Tur.la: Turgenia latifolia ![Agriculture 09 00058 i001]() : good rangeland;
: good rangeland; ![Agriculture 09 00058 i003]() : abandoned rain-fed;
: abandoned rain-fed; ![Agriculture 09 00058 i002]() : poor condition rangeland
: poor condition rangeland
: good rangeland; : abandoned rain-fed; : poor condition rangeland

Table 1.
Slope conditions of the studied region
| Rangeland Condition | Repetition | Slope (%) | Slope Direction |
|---|---|---|---|
| Good condition rangeland * | 1 | 8 | Southern |
| 2 | 9 | Southern | |
| 3 | 7 | Southern | |
| 4 | 8 | Southern | |
| Degraded rangeland | 1 | 14 | Southern |
| 2 | 8 | Southern | |
| 3 | 12 | Southern | |
| 4 | 9 | Southern | |
| Abandoned rain-fed lands | 1 | 12 | Southern |
| 2 | 9 | Southern | |
| 3 | 10 | Southern | |
| 4 | 14 | southern |
* Good condition rangeland, followed by a description 1:14 million ha.
Table 2.
Soil properties of the studied sites at the depth of 0–30 cm
| Soil Properties | Rangeland Condition | Min | Max | Mean | Std. Deviation |
|---|---|---|---|---|---|
| Gravel content (%) | Good condition rangeland | 39 | 49 | 43 | 18 |
| Degraded rangeland | 39 | 51 | 45 | 9 | |
| Abandoned rain-fed lands | 40 | 52 | 45 | 13 | |
| pH | Good condition rangeland | 17.7 | 22.2 | 20.3 | 0.26 |
| Degraded rangeland | 17.7 | 23.3 | 20.4 | 0.12 | |
| Abandoned rain-fed lands | 15.3 | 24.6 | 20.0 | 0.05 | |
| Electrical Conductivity (EC) dS/m | Good condition rangeland | 32.5 | 38.1 | 36.2 | 0.10 |
| Degraded rangeland | 29.8 | 37.5 | 34.0 | 0.11 | |
| Abandoned rain-fed lands | 32.7 | 35.9 | 34.4 | 0.11 | |
| SP (saturation percentage) (%) | Good condition rangeland | 16 | 27 | 20 | 2 |
| Degraded rangeland | 14 | 21 | 17 | 1 | |
| Abandoned rain-fed lands | 13 | 14 | 14 | 3 | |
| Organic matter content (%) * | Good condition rangeland | 1.4b | 1.5 | 1.4 | 0.03 |
| Degraded rangeland | 1.0a | 1.0 | 1.0 | 0.03 | |
| Abandoned rain-fed lands | 1.2c | 1.4 | 1.3 | 0.12 | |
| Lime content | Good condition rangeland | 34.7 | 40.3 | 37.8 | 5.26 |
| Degraded rangeland | 33.7 | 37.4 | 35.3 | 2.76 | |
| Abandoned rain-fed lands | 33.2 | 41.5 | 37.2 | 0.55 | |
| Clay (%) | Good condition rangeland | 0.5 | 0.7 | 0.6 | 2.5 |
| Degraded rangeland | 0.5 | 0.8 | 0.7 | 3.2 | |
| Abandoned rain-fed lands | 0.5 | 0.7 | 0.6 | 1.4 | |
| Silt (%) | Good condition rangeland | 7.51 | 8.1 | 7.8 | 2.2 |
| Degraded rangeland | 7.7 | 8.0 | 7.9 | 2.5 | |
| Abandoned rain-fed lands | 7.6 | 7.8 | 7.7 | 4.9 | |
| Sand (%) | Good condition rangeland | 20.1 | 60.4 | 33.4 | 4.5 |
| Degraded rangeland | 21.4 | 42.0 | 33.8 | 5.2 | |
| Abandoned rain-fed lands | 13.2 | 42.3 | 23.7 | 6.3 | |
| Soil texture | Good condition rangeland | CL/SCL | |||
| Degraded rangeland | CL/SCL | ||||
| Abandoned rain-fed lands | CL/SCL |
SP: soil’s moisture percentage. CL: clay loam, SCL: sandy clay loam. * Signs (a, b, c) on the numbers indicate significant differences (p < 0.05) in the study sites (obtained from Tukey test).
Table 3.
Distance from roads, villages, and watering place in the studied sites
| Studied Areas | Distance from Road (m) | Distance to Villages (m) | Distance from Watering Place (m) |
|---|---|---|---|
| Good condition rangeland | 100 | 2116 | 2090 |
| Degraded rangeland | 170 | 478 | 476 |
| Abandoned rain-fed land | 112 | 424 | 423 |
Table 4.
Floristic list of the studied region (grasses (A), shrub (B), and forbs(C))
| (A) | ||||||||
| Number | Species | Family | Palatability Class | Life Form | Life Time | Relative Frequency (%) | ||
| Good Condition Rangelands | Poor Condition Rangelands | Abandoned Rain-fed | ||||||
| 1 | Bromus tomentellus | Gramineae | I | Grasses | perennial | 25.6 | 0.1 | 0.4 |
| 2 | Bromus danthoniae | Gramineae | II | Grasses | annual | 8 | 5.7 | 11.6 |
| 3 | Taeniatherum crinitum | Gramineae | III | Grasses | annual | 5.4 | 11.8 | 0.2 |
| 4 | Bromus tecturum | Gramineae | II | Grasses | annual | 5.7 | 10.4 | 1.4 |
| 5 | Eremo songarica | Gramineae | I | Grasses | annual | 8.2 | 4.3 | 12 |
| 6 | Boissera squarrosa | Gramineae | III | Grasses | annual | 2.8 | 4 | 19.5 |
| 7 | Poa bulbosa | Gramineae | II | Grasses | perennial | 4.2 | 2.6 | 1.1 |
| 8 | Eremopoa songarica | Gramineae | II | Grasses | annual | 1.3 | 0 | 0 |
| 9 | Agropyron trichophorum | Gramineae | II | Grasses | perennial | 0.4 | 0 | 0.4 |
| 10 | Phalaris arundinaceae | Gramineae | I | Grasses | perennial | 0 | 0.3 | 0 |
| 11 | Stipa barbata | Gramineae | II | Grasses | perennial | 0.1 | 0 | 0 |
| 12 | Agropyron intermedium | Gramineae | I | Grasses | perennial | 0 | 0.5 | 0 |
| 13 | Festuca ovina | Gramineae | I | Grasses | perennial | <0.1 | 0 | 0 |
| (B) | ||||||||
| Number | Species | Family | Palatability Class | Life Form | Life Time | Relative Frequency (%) | ||
| Good Condition Rangelands | Poor Condition Rangelands | Abandoned Rain-fed | ||||||
| 1 | Astragalus verus | Papilionaceae | III | Shrub | perennial | 12 | 48.4 | 0.9 |
| 2 | Scariola orientalis | Compositae | III | Shrub | perennial | 1.7 | 1 | 3.4 |
| 3 | Acanthophyllum heterophyllum | Caryophyllaceae | III | Shrub | perennial | 1.3 | 0.6 | 0 |
| 4 | Astragalus microcephalus | Papilionaceae | III | Shrub | perennial | 0 | 4.1 | 0 |
| 5 | Noaea mucronata | Chenopodiaceae | II | Shrub | perennial | 0 | 1.6 | 0 |
| 6 | Acanthophyllum microcephalum | Caryophyllaceae | III | Shrub | perennial | 0 | 1.2 | 0.1 |
| (C) | ||||||||
| Number | Species | Family | Palatability Class | Life Form | Life Time | Relative Frequency (%) | ||
| Good Condition Rangelands | Poor Condition Rangelands | Abandoned Rain-fed | ||||||
| 1 | Cousinia bachtiarica | Compositae | III | forbs | perennial | 4.8 | 0 | 0 |
| 2 | Phlomis persica | Labiatae | III | forbs | perennial | 4.2 | 0 | 0 |
| 3 | Eryngium billardieri | Umbelliferae | III | forbs | perennial | 3.3 | 2. 4 | 44 |
| 4 | Ferula ovina | Umbelliferae | I | forbs | perennial | 0 | 0.3 | 0 |
| 5 | Alyssum inflatum | Cruciferae | III | forbs | annual | 3.6 | 0.4 | 2.5 |
| 6 | Minuartia meyeri | Caryophyllaceae | III | forbs | annual | 3.5 | 13 | 0 |
| 7 | Phlomis olivieri | Labiatae | III | forbs | perennial | 4.4 | 0.3 | 0 |
| 8 | Arabis nova | Cruciferae | II | forbs | annual | 2 | 0.4 | 0 |
| 9 | Phlomis anisodonta | Labiatae | III | forbs | perennial | 1.4 | 0 | 0 |
| 10 | Ziziphora capitata | Labiatae | II | forbs | annual | 1.2 | 0 | 0 |
| 11 | Gypsophila virgata | Caryophyllaceae | III | forbs | perennial | 1 | 0 | 0 |
| 12 | Euphorbia descipiens | Euphorbiaceae | III | forbs | perennial | 0.7 | 1.4 | 0.1 |
| 13 | Rochelia disperma | Boraginaceae | III | forbs | annual | 0.8 | 1.7 | 0 |
| 14 | Centaurea luristanica | Compositae | III | forbs | perennial | 1 | 0 | 0.5 |
| 15 | Crepis sancta | Compositae | III | forbs | annual | 0.8 | 0 | 0 |
| 16 | Ziziphora tenuior | Labiatae | II | forbs | annual | 0.7 | 0 | 0 |
| 17 | Cardaria draba | Cruciferae | III | forbs | annual | 0.4 | 0 | 0 |
| 18 | Echinops robustus | Compositae | III | forbs | perennial | 0.4 | 0 | 0 |
| 19 | Galium verum | Rubiaceae | III | forbs | perennial | 0.3 | 0 | 0 |
| 20 | Silene arbuscula Fenzl ex Boiss | Caryophyllaceae | II | forbs | perennial | 0.2 | 0 | 0 |
| 21 | Taraxacum officinale | Compositae | I | forbs | perennial | 0.2 | 0 | 0 |
| 22 | Cirsium bracteosum | Compositae | III | forbs | perennial | 0 | 6.1 | 3.1 |
| 23 | Ceratocephalus falcatus | Compositae | II | forbs | annual | 0 | 1.1 | 0 |
| 24 | Malcolmia taraxacifolia | Cruciferae | II | forbs | annual | 0 | 0.9 | 0 |
| 25 | Medicago sativa | Papilionaceae | I | forbs | annual | 0 | 0.3 | 0 |
| 26 | Senecio glaucus | Compositae | III | forbs | annual | 0 | 0.2 | 0.8 |
| 27 | Bonium cylindricum | Umbelliferae | I | forbs | annual | 0 | 0.3 | 0 |
| 28 | Achillea vermicularis | Compositae | III | forbs | perennial | 0 | 0 | 3.8 |
| 29 | Veronica orientalis | Scrophulariaceae | III | forbs | perennial | 0 | 0 | 1.2 |
| 30 | Euphorbia cheiradenia | Euphorbiaceae | III | forbs | perennial | 0 | 0 | 1.2 |
| 31 | Geranium tuberosum | Geraniaceae | III | forbs | perennial | 0.1 | 0 | 1.8 |
| 32 | Tragopogon graminifolius | Compositae | I | forbs | perennial | 0 | 0 | 1.6 |
| 33 | Asperula arvensis | Rubiaceae | II | forbs | annual | 0 | 0 | 0.7 |
| 34 | Centaurea virgata | Compositae | III | forbs | perennial | 0 | 0 | 1 |
| 35 | Nepeta laxiflora | Labiatae | III | forbs | perennial | 0 | 0 | 0.6 |
| 36 | Scutellaria multicaulis | Labiatae | III | forbs | perennial | 0 | 0 | 0.4 |
| 37 | Sedum hispanicum | Crassulaceae | III | forbs | annual | 0.1 | 0 | 0 |
| 38 | Scabiosa olivieri | Dipsacacea | III | forbs | annual | 0 | 0 | 0.1 |
| 39 | Orobanch alba | Scrophulariaceae | III | forbs | annual | <0.1 | 0 | 0 |
| 40 | Polygonum polycnemoides | Polygonaceae | III | forbs | perennial | 0 | 0 | <0.1 |
| 41 | Consolida tomentosa | Ranunculaceae | III | forbs | annual | 0 | <0.1 | 0 |
| 42 | Turgenia latifolia | Umbelliferae | III | forbs | annual | 0 | 0 | <0.1 |
| 43 | Valerianella oxyrrhyncha | Valerianaceae | III | forbs | annual | <0.1 | 0 | 0 |
| 44 | Heteranthelium piliferum | Gramineae | III | forbs | annual | 0 | 0 | <0.1 |
Table 5.
Mean values of plant diversity indices in the study rangeland area based on the canopy cover of all species
Table 5.
Mean values of plant diversity indices in the study rangeland area based on the canopy cover of all species
| Rangeland Area | Simpson | Shannon | Hill N1 | Hill N2 |
|---|---|---|---|---|
| Good rangeland | 0.82 a | 3.3a | 10.13 a | 6.44 a |
| Degraded rangeland | 0.8 a | 3 b | 8.17 b | 5.95 a |
| Abandoned dry land farming | 0.74 a | 2.52 b | 5.81 b | 3.87 a |
Marks (a and b) presented for showing difference between mean values and similarity in marks indicate not significant deference (obtained results from Tukey test).
Table 6.
Mean values of plant diversity indices in the study rangeland area based on the canopy cover of perennial plant species
Table 6.
Mean values of plant diversity indices in the study rangeland area based on the canopy cover of perennial plant species
| Rangeland Area | Simpson | Shannon | Hill N1 | Hill N2 |
|---|---|---|---|---|
| Good condition rangeland | 0.70 a | 2.37 a | 5.18 a | 3.46 a |
| Degraded rangeland | 0.62 b | 1.90 b | 3.78 b | 2.85 b |
| Abandoned rain-fed land | 0.51 b | 1.58 b | 3.05 b | 2.10 b |
© 2019 by the authors. Licensee MDPI, Basel, Switzerland. This article is an open access article distributed under the terms and conditions of the Creative Commons Attribution (CC BY) license (http://creativecommons.org/licenses/by/4.0/).
Share and Cite
MDPI and ACS Style
Eghdami, H.; Azhdari, G.; Lebailly, P.; Azadi, H. Impact of Land Use Changes on Soil and Vegetation Characteristics in Fereydan, Iran. Agriculture 2019, 9, 58. https://0-doi-org.brum.beds.ac.uk/10.3390/agriculture9030058
AMA Style
Eghdami H, Azhdari G, Lebailly P, Azadi H. Impact of Land Use Changes on Soil and Vegetation Characteristics in Fereydan, Iran. Agriculture. 2019; 9(3):58. https://0-doi-org.brum.beds.ac.uk/10.3390/agriculture9030058
Chicago/Turabian StyleEghdami, Hanieh, Ghanimat Azhdari, Philippe Lebailly, and Hossein Azadi. 2019. "Impact of Land Use Changes on Soil and Vegetation Characteristics in Fereydan, Iran" Agriculture 9, no. 3: 58. https://0-doi-org.brum.beds.ac.uk/10.3390/agriculture9030058
Note that from the first issue of 2016, this journal uses article numbers instead of page numbers. See further details here.