Article

Effect of Tillage Systems on Physical Properties of a Clay Loam Soil under Oats

by
Karen Denisse Ordoñez-Morales
1,
Martin Cadena-Zapata
2,*,
Alejandro Zermeño-González
3 and
Santos Campos-Magaña
2
1
Production Systems Engineering Program, Universidad Autónoma Agraria Antonio Narro, Calzada Antonio Narro 1923 Saltillo, Coahuila 25315, Mexico
2
Agricultural Machinery Department UAAAN Saltillo, Coahuila 25315, Mexico
3
Irrigation and Drainage Department UAAAN, Saltillo, Coahuila 25315, Mexico
*
Author to whom correspondence should be addressed.
Submission received: 16 February 2019 / Revised: 20 March 2019 / Accepted: 20 March 2019 / Published: 23 March 2019

Abstract

:
In many regions, conservation tillage has been shown to contribute to preserving soil properties. However, in order to promote this practice in new areas, it is necessary to generate information about its results in local environmental conditions. Our objective was to study the effect of No Tillage (NT), Vertical Tillage (VT) and Conventional Tillage (CT) on physical soil properties of a clay loam soil and on yields (Avena sativa L.), in a semiarid area of Mexico. From 2013 to 2016 an experiment was conducted in random blocks, with the three tillage systems as treatments. Four variables were measured; bulk density (Bd), pore space (P), hydraulic conductivity (Ks) and crop yield. Our results did show scarce differences between the tillage systems. Values ranged between 1.21 g cm−3 to 1.39 g cm−3 for Bd, 45% to 55% for P, and 4.29 mm h−1 to 13.61 mm h−1 for Ks. Although differences were not significant among treatments, Bd decreased 6.7% for CT, 5.6% for NT and 0.7% for VT. P increased 6% for CT, 5% for NT and 0.5% for VT. Ks for CT decreased 6% more than for NT and VT. Average yield was 13% less in NT compared to CT and VT. A long-term investigation is needed in order to determine the effects of tillage methods, in our particular environmental conditions.

1. Introduction

The soil has a crucial role in agroecosystems; among the most important functions of the soil are to capture, store, and regulate water [1]. To preserve the integrity of the soil, water and biodiversity, crop production practices used in the agroecosystems should be oriented towards resource conservation [2].
Inadequate tillage practices of some crop production systems in Mexico leave the soil prone to erosion and the intensive traffic by the machinery causes an increase in soil density [3,4]. An increase in soil density could lead to degradation by compaction; when this occurs there is a problem for agricultural productivity [5,6]. Compaction also affects the hydraulic conductivity, which is an important factor in predicting the water flow and solute transport in the soil. The information on this factor is used to evaluate management alternatives of soil-water-crop [7].
The aim of tillage in crop production is to produce favorable physical conditions for seed germination and plant growth [8]. However, an intensive soil tillage can lead to degradation of soil structure, due to the gradual loss of stable aggregates, leading to soil erosion and compaction, which will result in low moisture availability for plants [9].
To promote the capture and conservation of water in agricultural systems in arid and semiarid regions, conservation tillage practices are important, in that they can contribute to avoiding soil degradation by compaction [10,11]. Vertical tillage with tine-type implements and no tillage with direct planters, do not invert the soil and leave crop residues on the surface [12]. These types of conservation tillage decrease the intensity and frequency of soil disturbance, compared with conventional tillage [13]. In some regions and soil conditions, different tillage methods have shown a great range of results with respect to bulk density and hydraulic conductivity of the soil [14,15].
Results on the effect of tillage in soil physical properties, to date, have been rather ambiguous, and sometimes contradictory. In some cases, in Latin America and Spain, no tillage results in high bulk density values in the surface, low infiltration rates, and less crop yield, compared with conventional tillage [16,17]. In another study, bulk density, in a loamy soil in a semiarid region with a cool climate in Turkey, increased significantly after 12 years of no tillage [18]. On the other hand, a site managed with no tillage for nine years in a silty loam soil in China resulted in a decrease of the bulk density and a significant increase of infiltration capacity. In this case, the improvement in soil physical conditions was due to an increase in the formation of macro aggregates, which was attributed to decreased soil disturbance and the addition of crop residues [19].
Conventional tillage can change significantly the soil physical properties within a growing season. For example, one experiment in France with conventional tillage shows bulk density increasing 15% to 20% from its initial value in a growing season of maize. The study also showed that the hydraulic conductivity decreased three to six times, according to the soil layer, and was negatively correlated with the bulk density [20]. In the case of no tillage, changes in soil properties are observed only after several years. In a study of a sandy loam soil with a monoculture of maize in Canada, over a period of 11 years, bulk density in a no tillage system increased only 10% at a depth of 0 to 10 cm compared to conventional tillage [21].
A bulk density in a range of 1.4 to 1.6 g cm−3 was found that severely restricted root growth [22]. However, this does not always happen. A high root density of wheat was obtained in Australia in a compacted sandy loam soil (1.5 g cm−3), rather than in a loose soil (1.1 g cm−3). This was due to a better contact between the soil and roots, and also, root diameter was greater in the condition of the high bulk density [23]. In a different study in the UK, the root growth of tomatoes was greater in a clay loam soil with high bulk densities of 1.5 to 1.6 g cm−3, than in densities of 1.2 and 1.3 g cm−3, considered with no restriction for root growth [24].
With respect to the hydraulic properties of the soils, it is well-known that the variability of the hydraulic conductivity in space and time is not fully understood [25]. The hydraulic properties of the soils are subject to temporal changes in response to tillage and natural factors such as rainfall, increase and decrease of biological activity, root development, and the cycle of drying and wetting [26].
Results in hydraulic conductivity depend on the management, i.e., the type of tillage and spatial variability of the soil, and also, on the sampling technique [27]. In one study, the rate of hydraulic conductivity was three times higher in a loam soil, after subsoiling and chiseling, compared to no tillage in a semiarid environment in Spain [28]. In another study in France, after seven years of conventional tillage and no tillage in a loam soil of temperate climate, the hydraulic conductivity was from 12% to 62% lower in the no tillage treatment [29].
The conventional tillage system based on disk plowing and disk harrowing has been common in Mexico for several decades. This has led to a loss of soil fertility and reduction of soil water holding capacity and soil structural stability, by facilitating erosion by water and wind [30]. The conservation tillage practices to be introduced in a particular region, should be carefully managed according to the particular soils and climates [31]. It is necessary to have more research to determine the effects of the conservation tillage methods on the physical and hydraulic properties in different soils and agroecological conditions [32,33].
While conservation tillage has been promoted in Mexico, there is scarce information about the results of these practices in the arid and semiarid areas of the country. The objective of this research was to quantify the effects of three tillage systems on the bulk density, pore space, and field saturated hydraulic conductivity, of a clay loam under semiarid climate conditions in Northern Mexico. Additionally, to determine the impact of these three different tillage methods on the fodder yield of oats. The hypothesis was that no tillage and vertical tillage would have a positive effect on bulk density, pore space, and saturated hydraulic conductivity, of the soil, and have a positive effect on crop yield.

2. Materials and Methods

2.1. Study Site

The study was conducted in the crop seasons of 2013, 2014, 2015 and 2016 at the experimental station of Universidad Autónoma Agraria Antonio Narro, Saltillo, Coahuila, Mexico. The site is located at 25°23’42’’ N and 100°59’57’’ W, at an altitude of 1743 m above sea level. The climate is semiarid with an average annual temperature of 16.9 °C, the mean annual rainfall is 435 mm, and the annual evaporation is 1956 mm. The soil at a depth of 0 to 20 cm is a clay loam (34.1% clay, 33.4% silt and 32.5% sand) with a 2.09% of organic matter.
The experimental setup was random blocks. In January, at the beginning of each growing season, the tillage treatments were performed in plots of 12 m × 40 m and replicated three times. The crop planted was forage oats (Avena sativa L.).

2.2. The Tillage Treatments

The operations for conventional tillage (CT) were: Disc plowing (disc plow ARHK-3, Kimball, Torreon, COAH. Mexico), harrowing (disc harrow RI 20204, Tecnomec Agricola SA de CV, AGS. Mexico) and planting (planter Gaspardo SC Maria, Maschio Gaspardo SpA, Padova, Italy).
For vertical tillage (VT), the operations were: Chisel plowing (Chisel plow JD610, John Deere SA de CV Monterrey, NL, Mexico), harrowing and planting.
For no tillage (NT), the only tillage operation was direct planting.
In Table 1, the specifications of the implements used for the tillage operations are presented.
In April of each year, at the end of the season, the variables under Section 2.3, Section 2.4, Section 2.5 and Section 2.6 were measured.

2.3. Bulk Density

At each treatment, undisturbed core samples were taken carefully from the soil profile between 0 and 20 cm at intervals of 5 cm. The core sampling was made using cylinders of 5 cm diameter and 5 cm in length. Samples were processed according to procedures described in [34]. Soil bulk density was calculated using Equation (1):
Bd = M/V
where: Bd = bulk density (g cm−3), M = mass of the dry soil sample (gr), V = volume of sample (cm3)

2.4. Pore Space

The percent of pore space was calculated from the values of bulk density and particle density. The latter was determined with the method of pycnometry [35]. It was calculated using Equation (2):
P = (1 − (Bd/Pd)) × 100
where: P = pore space (%), Bd = bulk density (g cm−3), Pd = particle density (g cm−3)

2.5. Saturated Hydraulic Conductivity

The in-situ determination of the field saturated hydraulic conductivity of the soil (mm h−1) was measured by the auger-hole method, using the Guelph Permeameter (Soilmoisture Equipment Corp., Santa Barbara, CA, USA) [36]. Hydraulic conductivity (Ks) was determined by measuring the steady-state rate of water flow out of a cylindrical well in which a constant depth of water was maintained. The Guelph Permeameter is an in-hole constant-head Permeameter, employing the Mariotte principle. The method involves measuring the steady-state rate of water recharge into unsaturated soil from a cylindrical well hole, in which a constant depth (head) of water is maintained.
The rate of a constant outflow of water, together with the diameter of the well, and height of water in the well, can be used to accurately determine the field saturated conductivity.

2.6. Crop Yield

A frame (0.25 × 0.25 m) was placed on the soil, the matter in the center of it was cut, weighed as green fodder, and then dehydrated at a temperature of 70 °C for 72 h until depletion of moisture, and so, its weight was constant. The dry fodder was taken as the dry matter weight of the crop, to calculate yield per hectare [37].

2.7. Statistical Analysis

The statistical analysis of the data was made using the R software version 2.10 [38], package agricolae version 1.2-8 [39]. Comparisons between statistical averages of the various treatments were made with the Tukey test (α ≤ 0.05). Figures were made with Excel 2016.

3. Results and Discussion

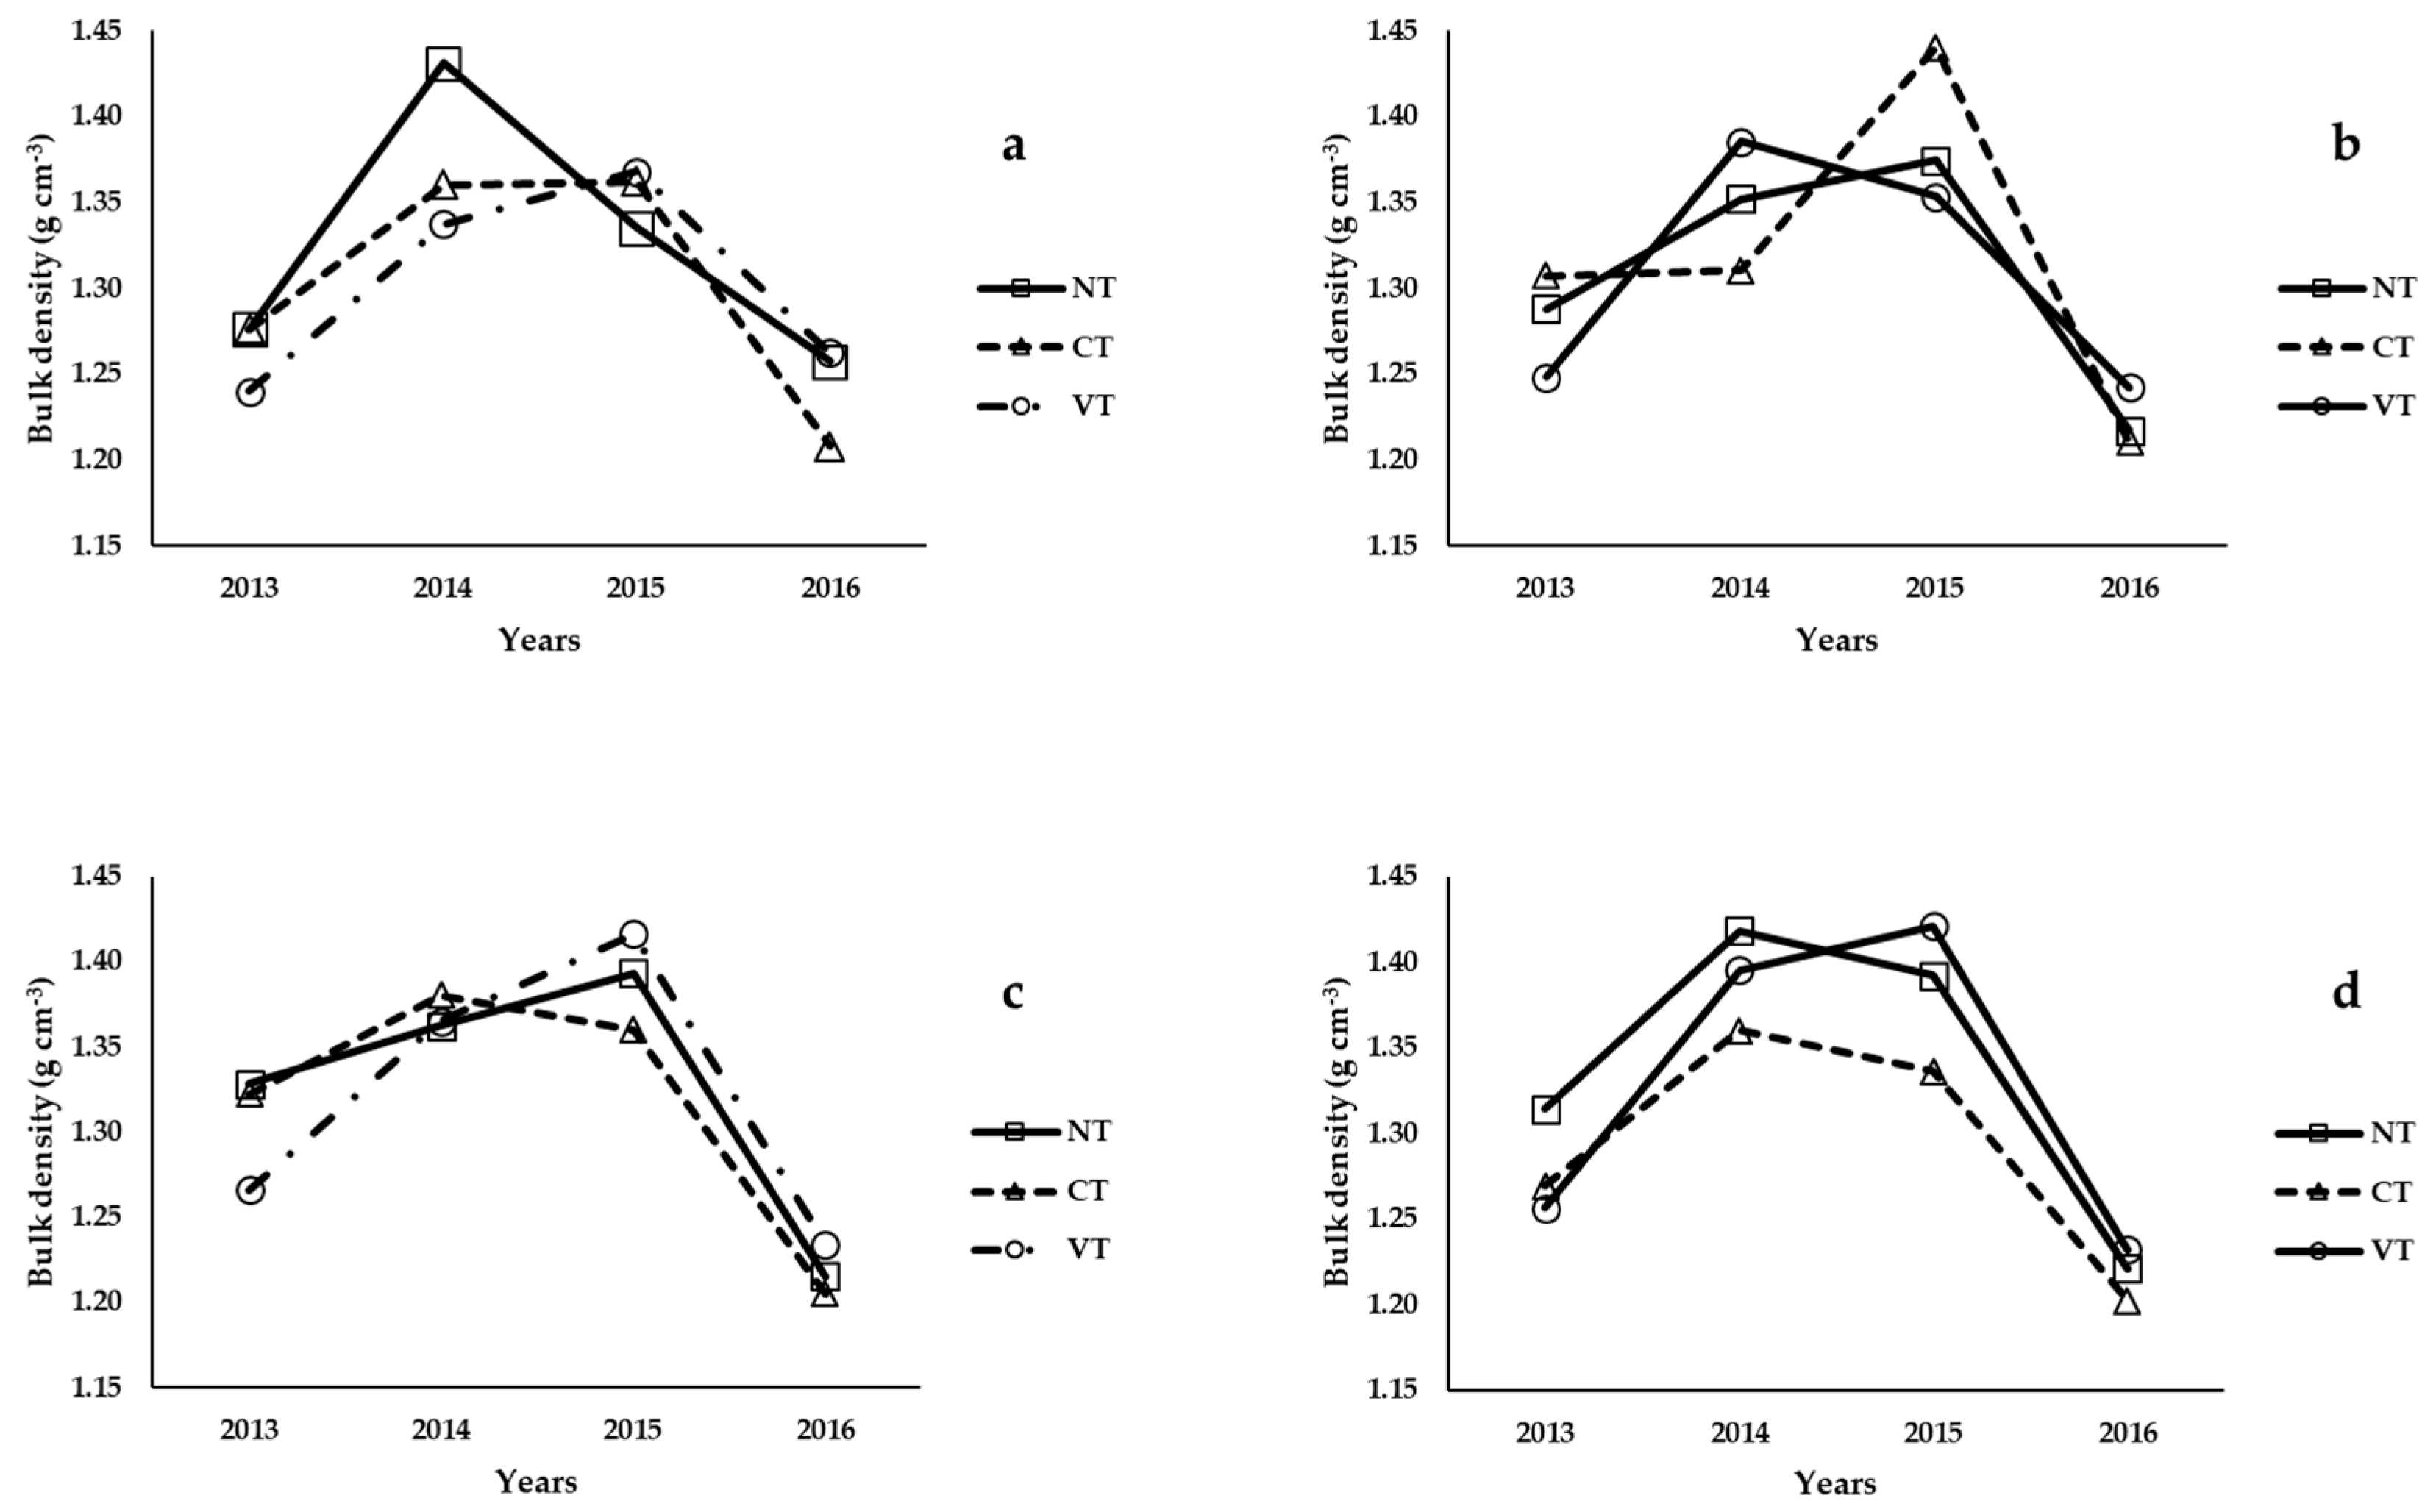
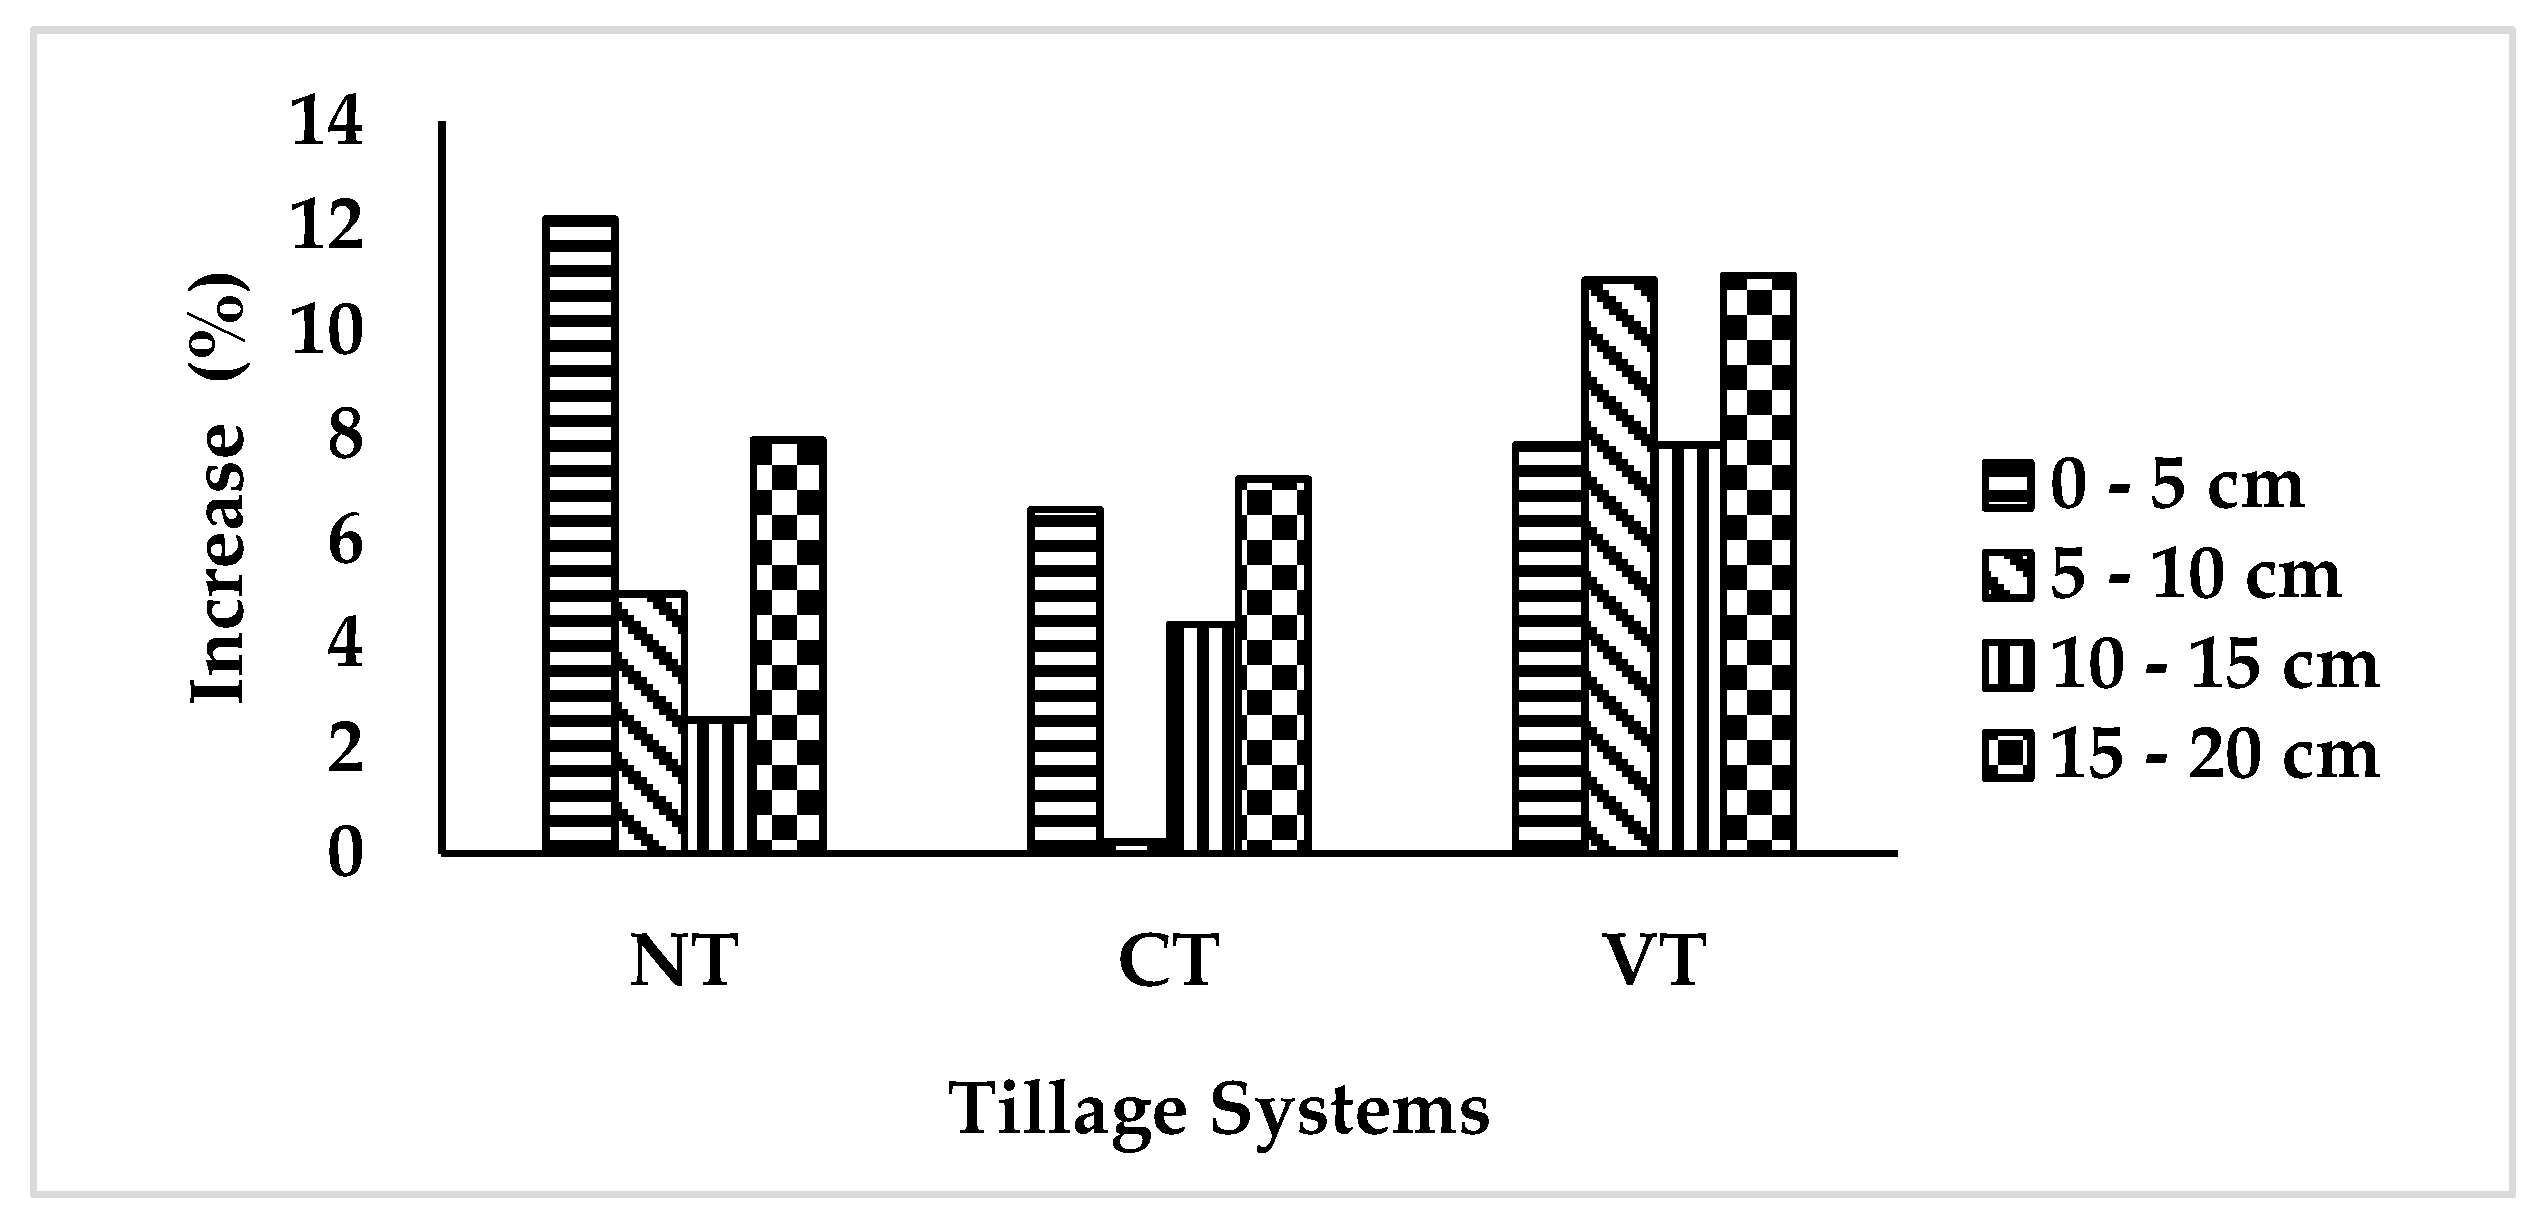
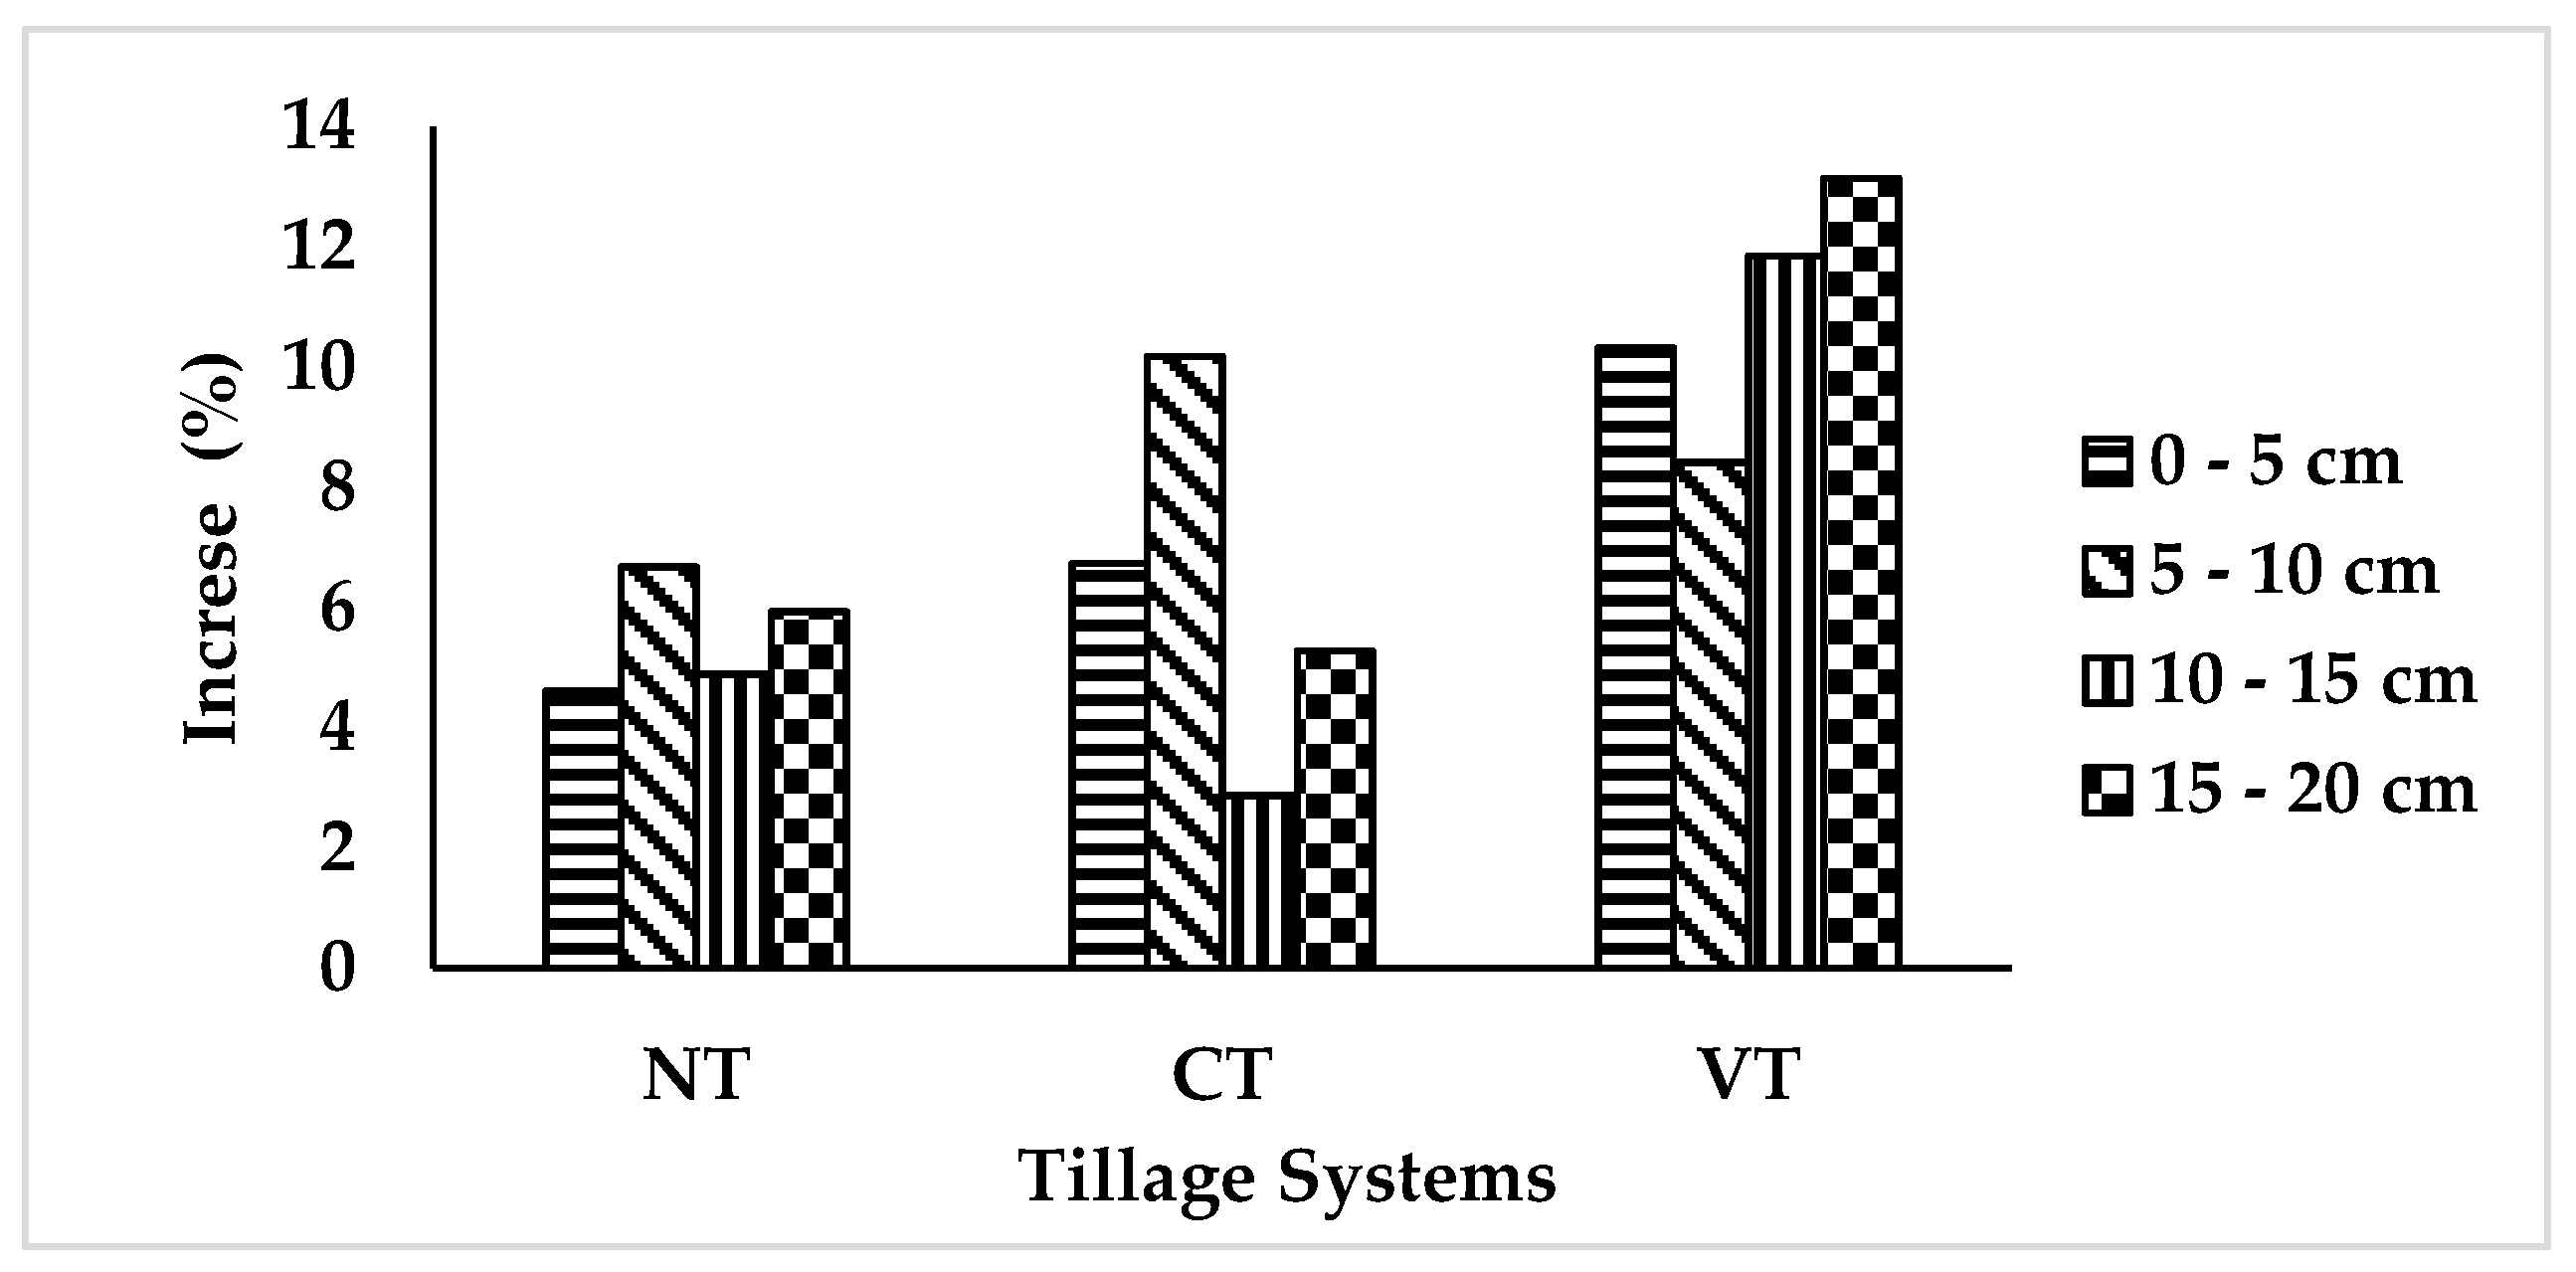
3.1. Effects on Bulk Density

Table 2 presents the values of bulk density at different depths for the tillage treatments. There was no clear tendency of increase or decrease in bulk density for any tillage treatment in the years observed. Changes in bulk density for all the treatments were in parallel, from the first to the second year increasing slightly, maintained in the third year and in the fourth year went back to very similar values registered in the first year.
The increase and decrease of the values from one year to another are in a range from 1.20 g cm−3 and 1.44 g cm−3. Most of these values fall in a range considered typical for clay loam soils, which is the soil used in the study [40,41]. Bulk density values less than, or equal to 1.40 g cm−3, are considered typical for clay loam soils [42].
Small increases and decreases of bulk density have also been found in another study evaluating the transitional effects associated with changing from conventional to no tillage; according to [43] the soil bulk density can change in time, but not necessarily in a consistent tendency.
Temporally within a season, bulk density could increase or decrease due to several factors, such as volume and intensity of rainfall, drying and wetting of soil, land position and crop type, among others [44]. However, changes of the observed parameters within the cropping season were not in the scope of the study presented.
In Figure 1, the mean values of the bulk density in the soil profile, at the different depths, are shown. In the semiarid conditions of Mexico and after four years of study, changes in bulk density for each year were not significant between the three applied tillage treatments.
In Figure 1d, in the lower-most layer studied (15 to 20 cm), although not statistically different, the values of bulk density at the end of each year from 2014 to 2016 for NT and VT were a bit higher than for CT. In Figure 1c, for the layer from 10 to 15 cm the values at each year for each system have fewer differences. For the upper layers, from 0 to 5 cm (Figure 1a) there was no a clear tendency, NT was the highest value in 2013 and in Figure 1c, from 5 to 10 cm bulk density for CT in 2014 was the highest value.
In a similar experiment, results showed that after three years, there was no significant soil bulk density differences at any depth between tillage treatments for plots without controlled traffic. In this experiment, it compared the effect of no tillage and chisel tillage on the bulk density when the wheel traffic was controlled and not controlled. The bulk density was measured in depth increments of 2 cm, in a soil profile from 0 to 30 cm in a silt soil with a crop rotation of maize and soybean [45].
Results from a similar research in Mexico have shown that after 14 years there were no significant differences in bulk density in treatments of no tillage and conventional tillage at 20 cm depth. The study was in a clay loam soil with maize, in a temperate area [46]. Another study, in a subtropical humid area of Mexico, showed that bulk density was significantly higher after three years with no tillage compared with conventional tillage. The experiment was in a clay soil with maize working at a depth of 20 cm [47].
Our results agree with another study, where the bulk density after four years and at different depths resulted in no significant differences among no tillage, shallow tillage and deep tillage in a sandy soil under sugar beet [48]. In another experiment, soil physical evaluation after four years showed no significant differences in bulk density between conventional tillage and no tillage in a silty clay soil under wheat [49]. On the other hand, differences in bulk density have been documented for a clay loam soil in the long-term (29 years) [50], where significant differences were found at the 5 to 10 cm depth. The differences were less for no tillage (1.48 g cm−3) compared to ridge tillage (1.53 g cm−3) and conventional tillage (1.61 g cm−3). In the same study, in the surface layer (0 to 5 cm) showed no significant differences among the systems.
However, even in long-term studies, there were not always significant differences. In a study in a silty clay loam under no tillage, moldboard plow, disk tandem and chisel plow, over a 35-year period, there were no significant differences in bulk density between the tillage treatments at any depth, in a soil profile from 0 to 30 cm [51].
In Figure 2, Figure 3 and Figure 4, changes are observed in bulk density for 2014, 2015 and 2016, having as a reference the values of 2013; changes are in percentage. For 2014 and 2015, it can be observed that for each of the treatment methods, at each of the soil depths, there was an increase in bulk density, from 1% to 13%.
After three years (in 2016) the values of bulk density are lower compared to those measured in 2013, except for the treatment of VT in the surface from 0 to 5 cm depth, which was a small increment. The range of decrease in bulk density is from 0.5% to 8.8% (Figure 4). Although there were no significant differences among tillage treatments, in average in the soil profile from 0 to 20 cm depth, there was a decrease on bulk density in relation of the values at the first year. This average decrease was 6.7% for CT, 5.6% for NT and 0.78% for VT.
The changes in percentage of bulk density in our experiment were similar to those obtained in a study of four seasons comparing the effects of conventional plow, ripping and planting in basins in a clay loam soil. The increases and decreases of bulk density varied from 1% to 11% with respect to the values of the first season [52].

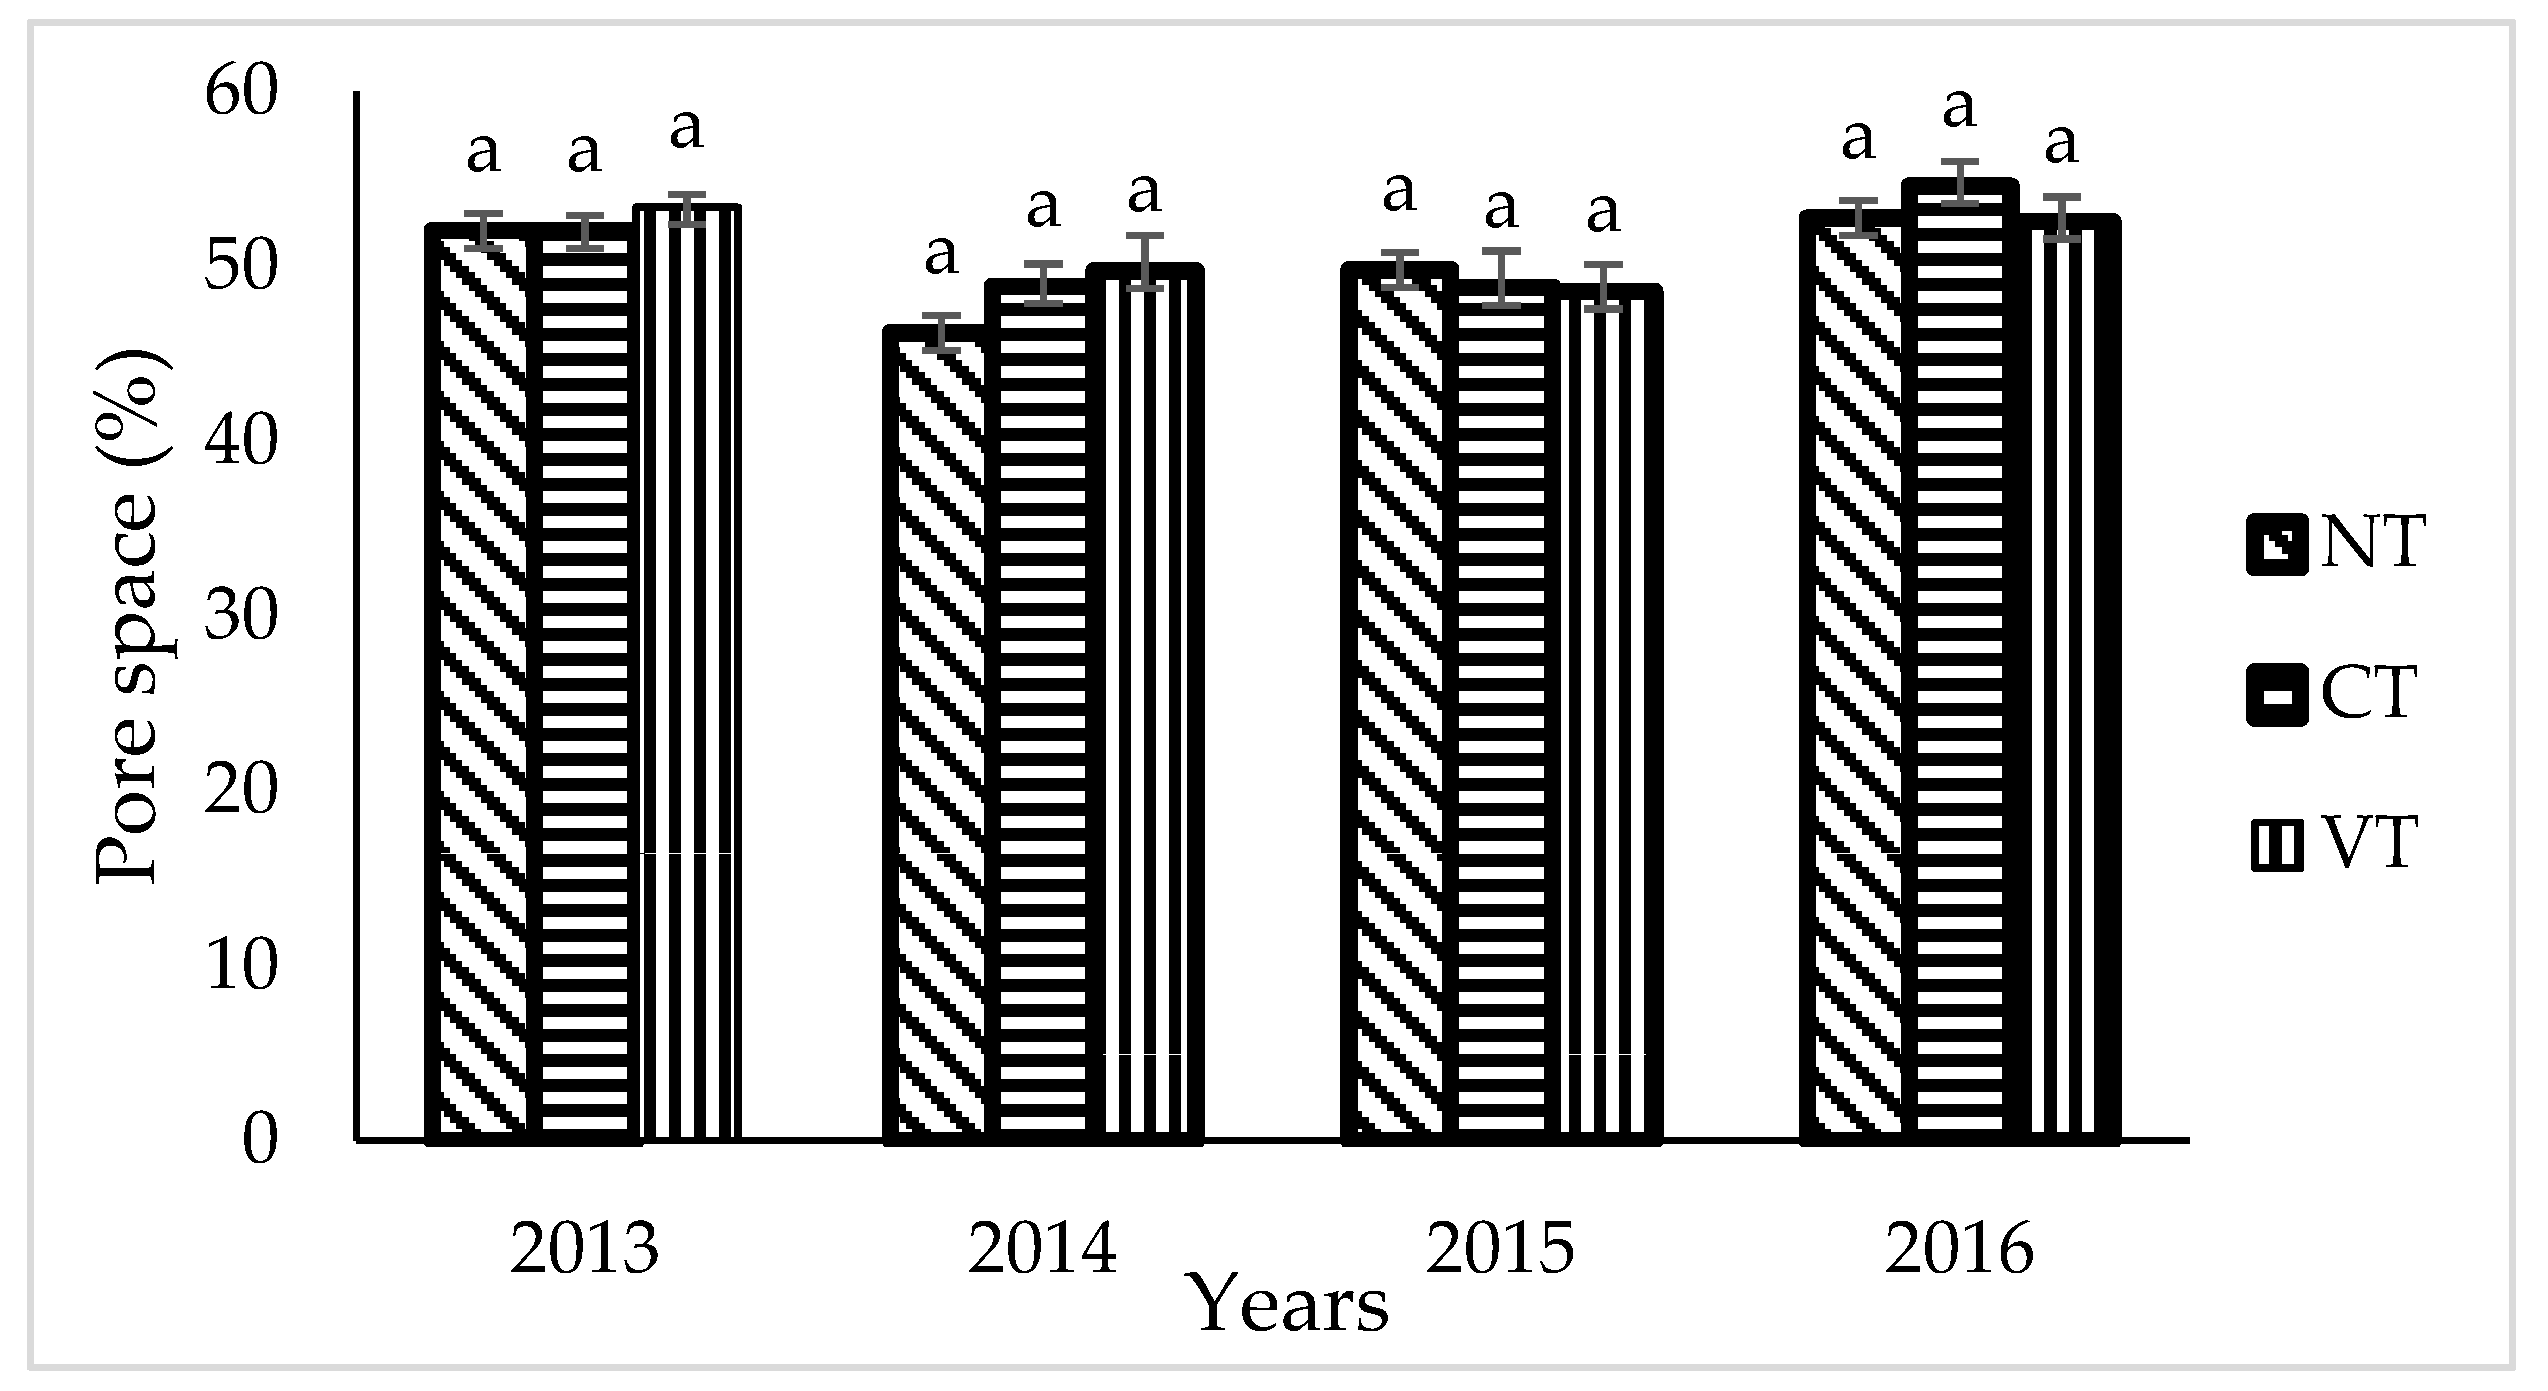
3.2. Effects on Pore Space

Figure 5 presents the variations in the values of pore space in the top layer of the soil profile. Figure 6 presents the variations for the bottom layer for each tillage system. For all the depths in 2013 to 2016, the pore space fluctuated between 45% and 55%. The variations of the pore space are linked to the values of bulk density so, values are lower in 2014 and 2015, when bulk density increased in reference to 2013.
In our study considering the values of pore space at the end of each year for each tillage treatment, there were on average in the soil profile small increases in pore space of 6% for CT, 5% for NT and 0.5% for VT. However, the differences in the pore space of the soil among tillage treatments at all depths measured were not significant.
In general, the results of the pore space in this study for all tillage systems were in a range of 45% to 55%. Soil pores can occupy from 30% to 70% of the volume, depending on many factors [53], and a soil with a 40% of pore space is considered extremely porous [54]. Considering these references, the porosities calculated in this study were in the normal range of porosity for agricultural soils.
The results in this study are similar to [55] where, in a study over three years, in a silt loam soil, pore space was from 46.6% to 51.4% at a soil depth of 0 to 10 cm, with a wheat crop under conventional tillage and reduced tillage. Also, our study agrees with other research where after four years of conventional tillage and no tillage in a sandy clay soil under wheat, the average pore space was 49% and 46% respectively, at a depth of 0 to 15 cm. Those values of porosity showed no significant differences between tillage treatments [56].

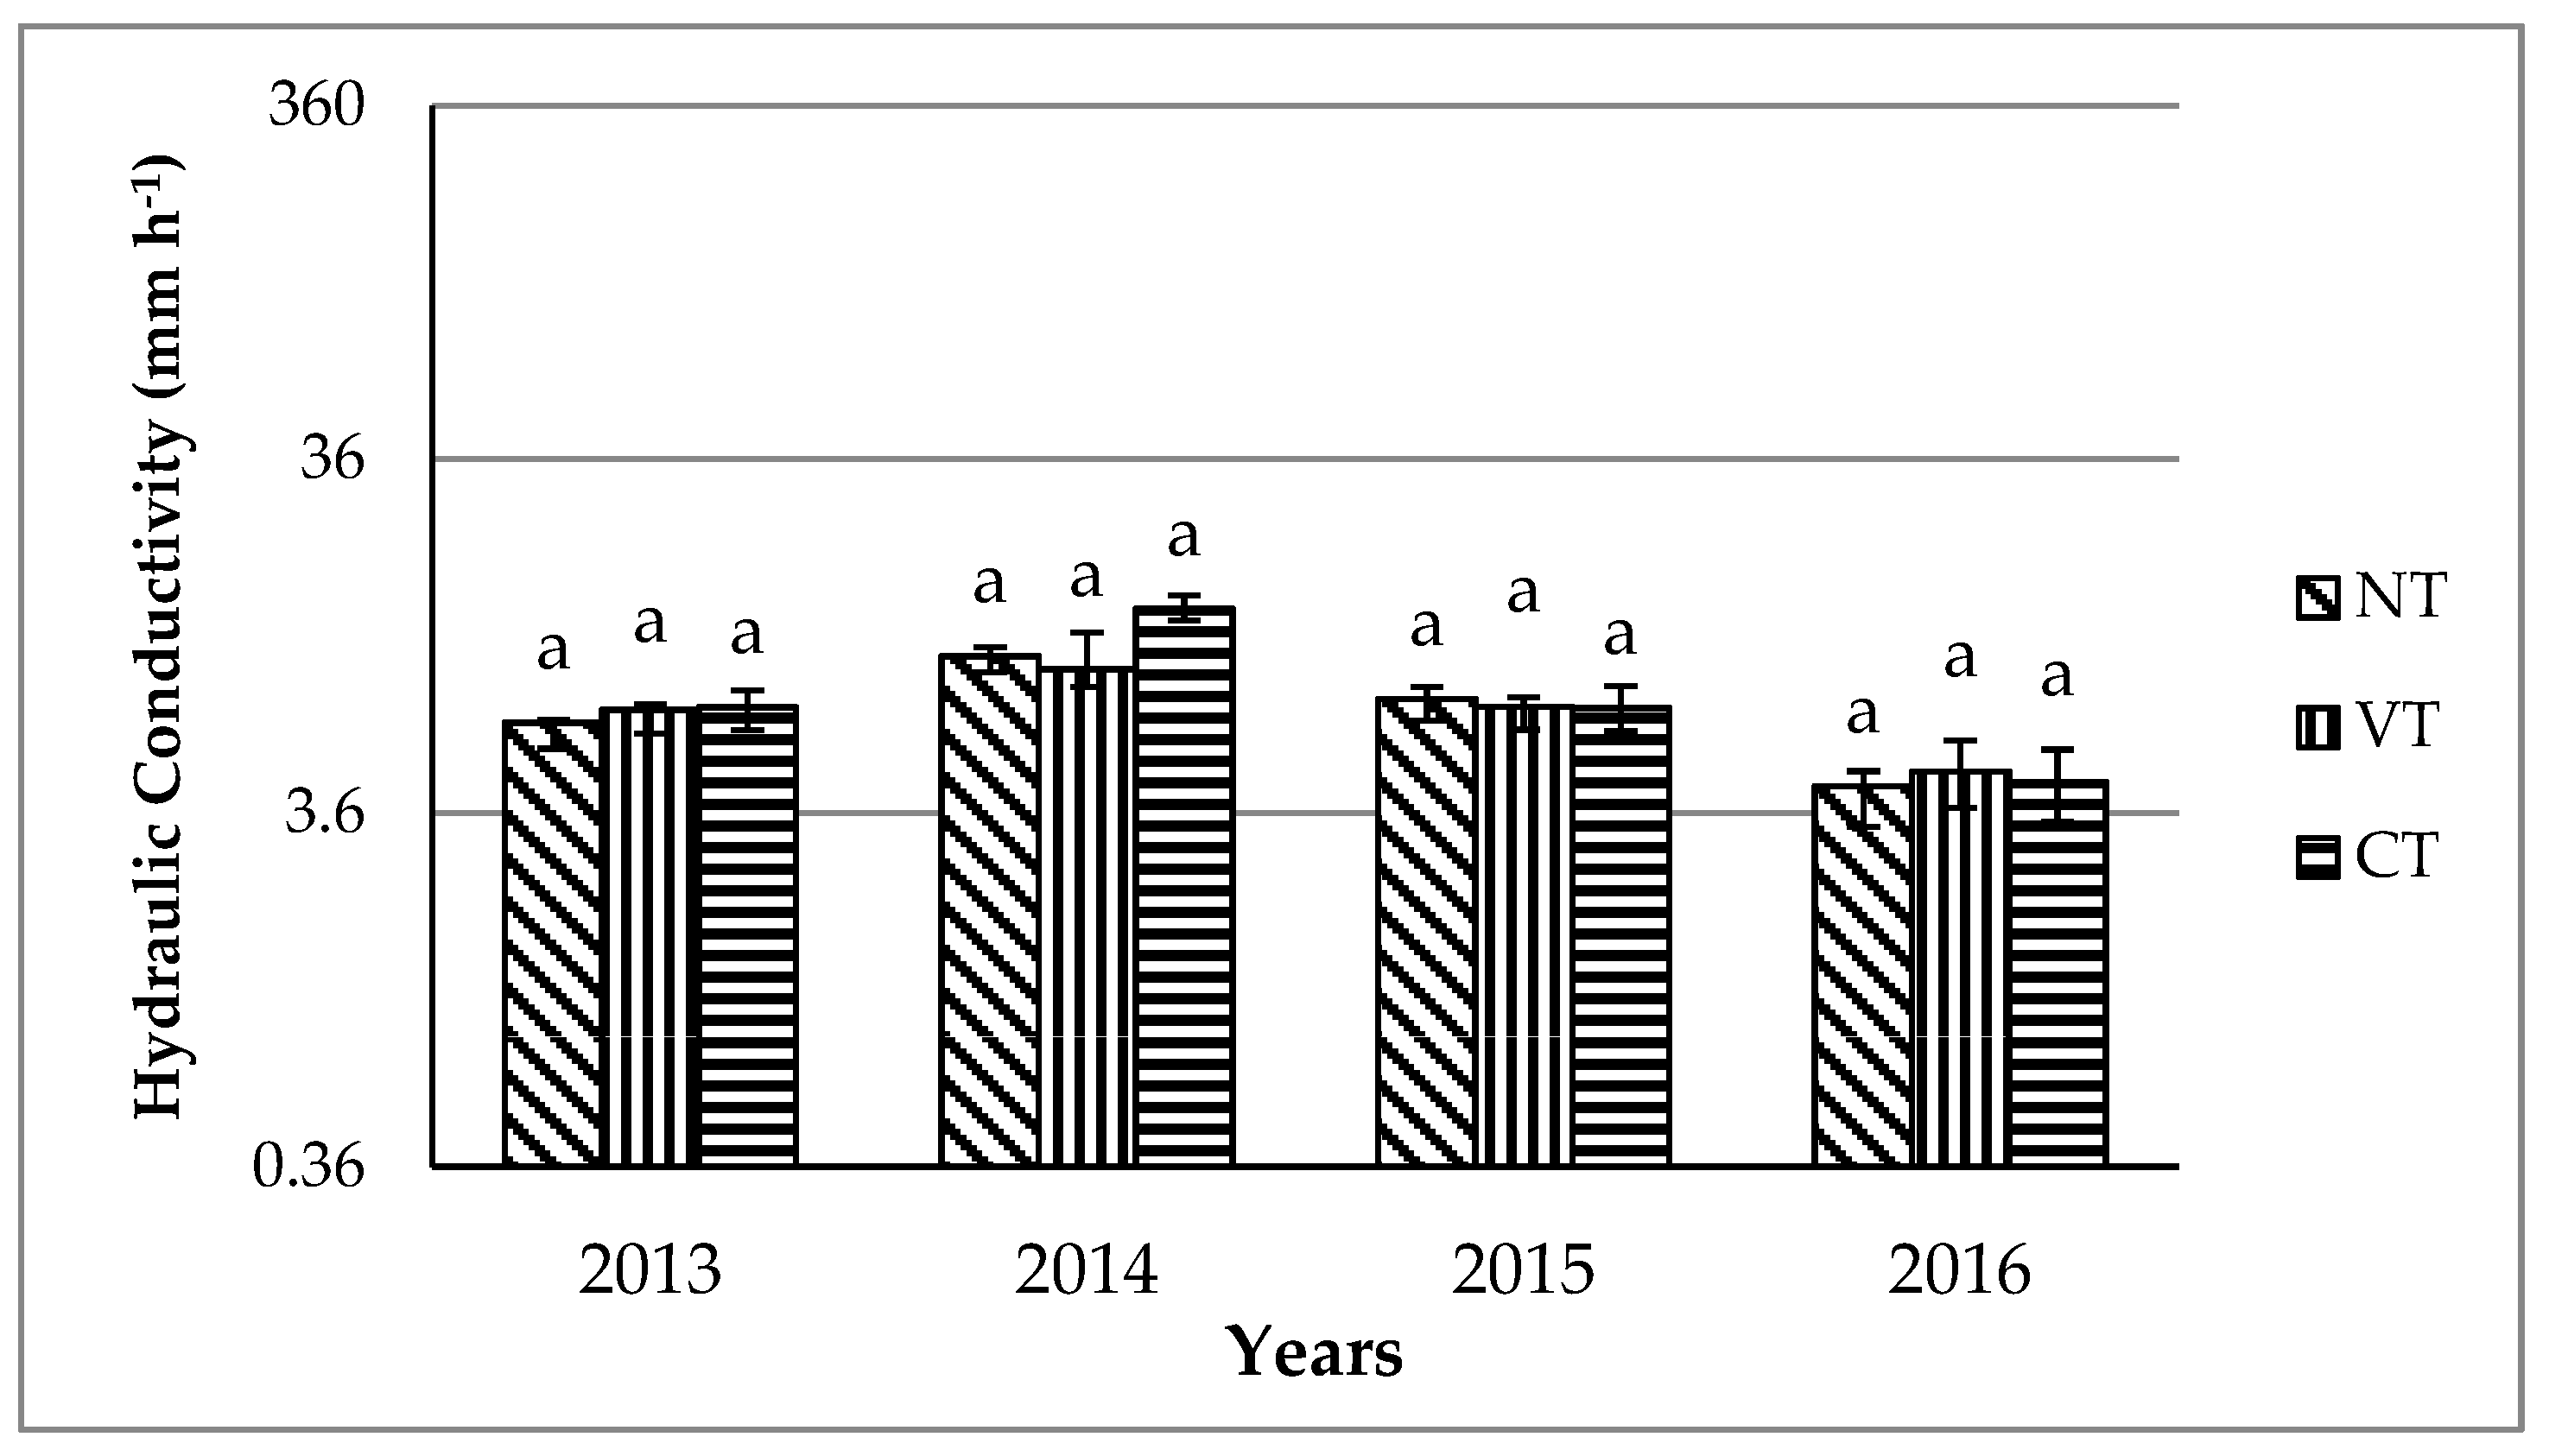
3.3. Effects on Hydraulic Conductivity

From the values presented in Figure 7, hydraulic conductivity, in the investigated period, fell in a range of 3.6 mm h−1 to 36 mm h−1, which is classified as moderately high [57]. There were no significant differences among the tillage treatments in the values for saturated hydraulic conductivity for the same year.
Some authors consider a range of 0.36 mm h−1 to 360 mm h−1 as acceptable values for saturated hydraulic conductivity of agricultural soils; among them clay loam soils [58]. The hydraulic conductivity values obtained in this research were within this range. Another study considers an ideal range of hydraulic conductivity for agricultural soils, including clay loam textures, to be from 18 mm h−1 to 180 mm h−1, in this respect the values found in this study are just below that range [59].
In Figure 8, the changes of the saturated hydraulic conductivity can be seen. Taking as a reference the values of 2013, the highest increments were in 2014 in the order CT > NT > VT. Almost no changes were registered in 2015, while the decreases observed in 2016 where in the order of CT > VT > NT. Considering the values for each system at each year, the saturated hydraulic conductivity in CT decreased 6% more than NT and VT. The increments and decrements are in a range from 0.04 mm h−1 to 6.43 mm h−1. The changes do not result in statistically significant differences among the treatments.
Our results agree with some other studies. There were no significant differences in the mean values of hydraulic conductivity in the profile of a sandy loam soil at four different depths; hydraulic conductivity across four years and four layers was not affected by tillage [48].
On the contrary, other authors have found that the hydraulic properties of soil are highly variable within a season and across the years, for different soils [60].

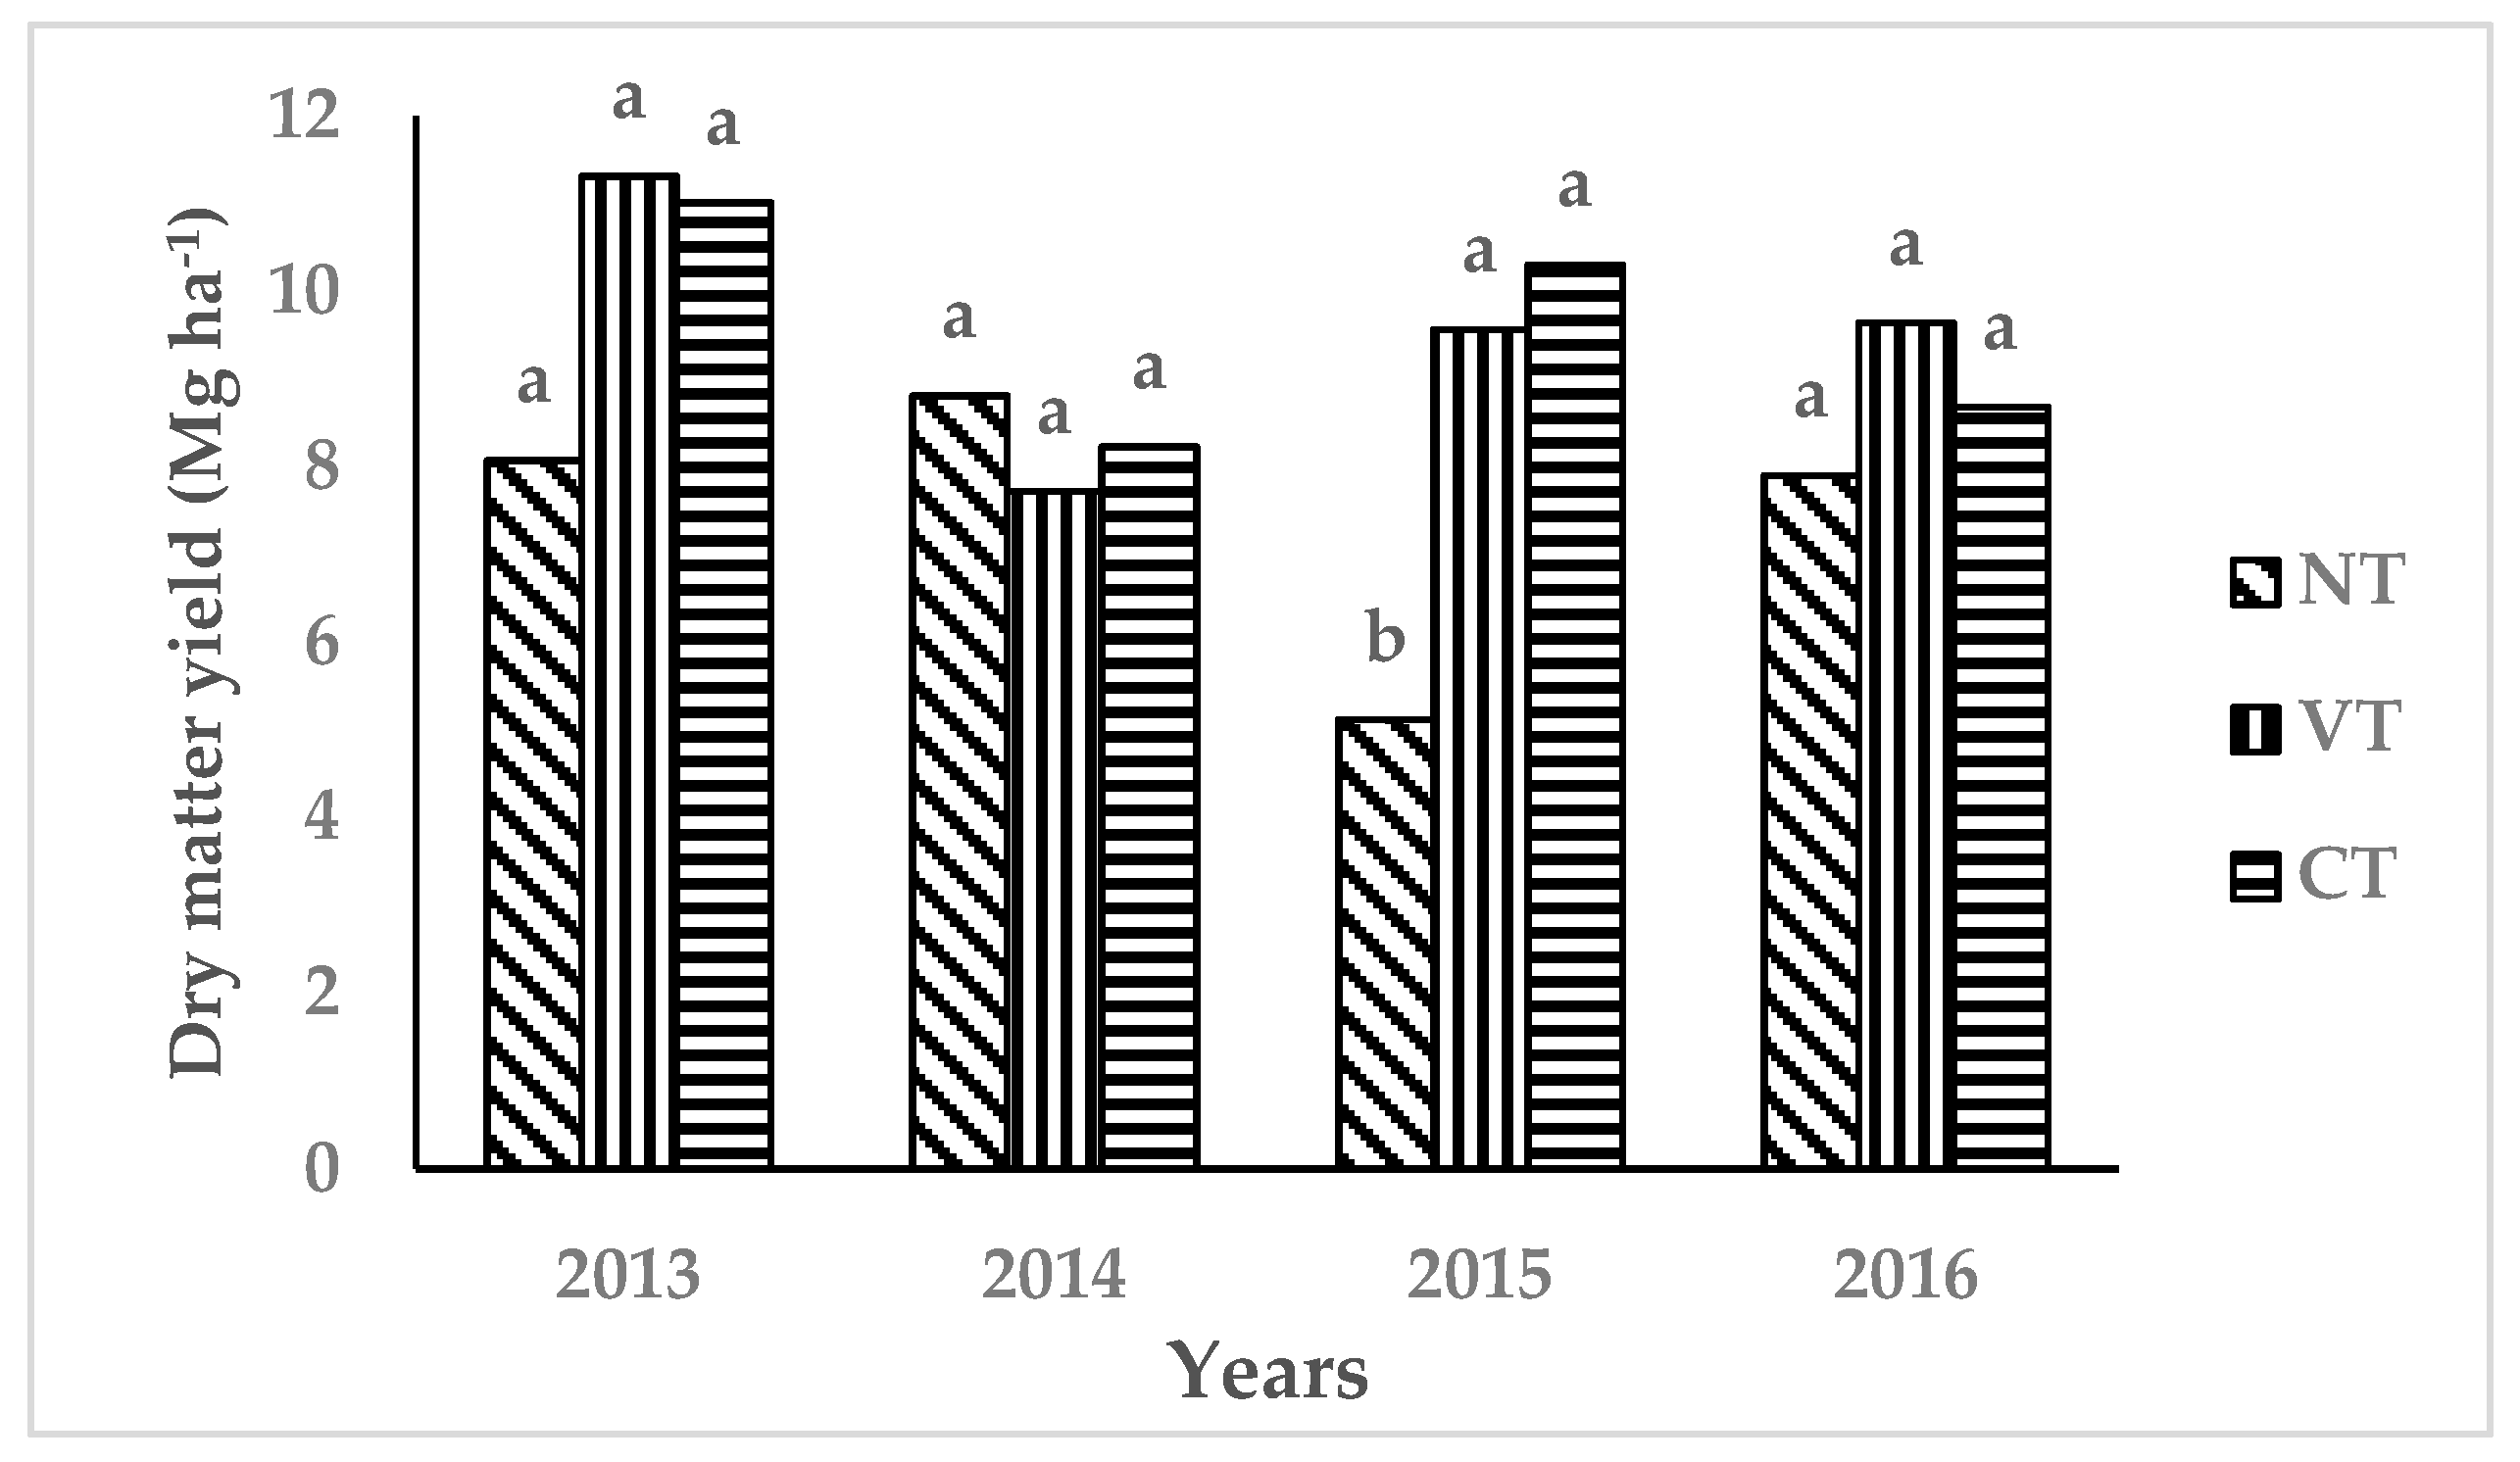
3.4. Effects on Crop Yield

Figure 9 presents the dry matter yield of the oat crop (Avena sativa L.) for the seasons of 2013, 2014 and 2016. The yield in the NT system in 2015 was significantly lower compared to CT and VT; in that year there were problems with the crop planting because many seeds were left without proper soil cover due to a great amount of mulch. This caused failures and a lower plant density in the NT treatment. Apart from the before mentioned, there were no significant differences in yield among the tillage systems. Not considering the year 2015 for NT, in average for the period of the study, the yield of NT was 13% less than that of CT and VT.
The impact of no tillage agriculture on crop yield is variable. For some crops, in the first two years, the yields are lower than those under conventional tillage. After two or three years, from no tillage implementation, yields start to be comparable to those of crops under conventional tillage [61]. In another study, comparing conventional moldboard plow tillage and vertical tillage, the results were different according to the crop type. Therefore, wheat yield decreased by 14% and sunflower yield was 5% higher in the vertical tillage compared to the conventional treatment [62].
In our study, yields were not significantly different for each year for all three methods, (except for 2015, due to the problems mentioned). So, our results agree with other studies where little variation in the yields was observed for different tillage systems. In one study with wheat, there were no significant differences in grain yield with conventional tillage and reduced tillage. Both systems using mulch cover in a silt loam after three years [55]. In another long-term study the mean yields obtained after 21 years, with conventional tillage and no tillage (direct drilling), were not significantly different in a wheat–sunflower–legume rotation [63]. Similarly, there were practically no differences in the yield of wheat in a subtropical ferralsol in an experimental site after 17 years of no tillage and conventional tillage [64]. In another study, comparing production of small grain cereals (wheat, barley, and oat) in a silt loam soil, the grain yield with conventional tillage was 5% higher than with no tillage, but no significant differences were observed with the straw yield [65].

4. Conclusions

During the period of the study, the values of bulk density (and therefore pore space) showed no significant differences among tillage systems at any depth in the soil profile. There were an observed small decrease of bulk density and increase of pore space for CT and NT and practically no changes in these variables for VT.
Hydraulic conductivity varied from year to year. In average, decreases were observed more in CT than NT and VT. However, there were no significant differences among the tillage systems. Values for hydraulic conductivity were always within a range classified as moderately high.
Dry matter yields of oats showed no significant differences among tillage treatments in 2013, 2014 and 2016. In 2015, however, there was a significantly lower yield for NT, which was due to the low plant density of the crop.
The tillage systems studied did not have a significant effect on the physical properties of the soil, nor on the yield of oats. Of course, this was a short range result. Therefore, this is not to say that there may not be longer-range effects on soil quality. It will be necessary to have longer-range studies, in order to gauge the lasting effects of tillage methods on soil properties and yields.

Author Contributions

Conceptualization, M.C.-Z., S.C.-M.; Methodology, M.C.-Z., A.Z.-G.; Validation, K.D.O.-M., A.Z.-G., M.C.-Z.; Formal analysis, K.D.O.-M., M.C.-Z.; Investigation, K.D.O.-M., A.Z.-G., M.C.-Z.; Data curation, M.C.-Z., K.D.O.-M.; Writing—Original draft preparation, K.D.O.-M.; Writing—review and editing, M.C.-Z., S.C.-M., A.Z.-G..

Funding

Universidad Autónoma Agraria Antonio Narro, grant number 2167, internally funded this research.

Acknowledgments

We acknowledge the technical staff of the Agricultural Machinery Department of UAAAN for the support given in the fieldwork.

Conflicts of Interest

The authors declare no conflict of interest. The funders had no role in the design of the study; in the collection, analyses, or interpretation of data; in the writing of the manuscript, or in the decision to publish the results.

References

  1. Adhikari, K.; Hartemink, A.E. Linking soils to ecosystem services—A global review. Geoderma 2016, 262, 101–111. [Google Scholar] [CrossRef]
  2. Pretty, J.; Bharucha, Z.P. Sustainable intensification in agricultural systems. Ann. Bot. 2014, 114, 1571–1596. [Google Scholar] [CrossRef] [PubMed] [Green Version]
  3. SEMARNAT. Informe de la Situación del Medio Ambiente en México. Compendio de Estadísticas Ambientales. Indicadores Clave y de Desempeño Ambiental; Edición 2012; Secretaria del Medio Ambiente y Recursos Naturales: México City, México, 2013; pp. 122–141. ISBN 9786078246618. [Google Scholar]
  4. Castellanos-Navarrete, A.; Rodriguez-Aragones, C.; de Goede, R.G.M.; Kooistra, M.J.; Sayre, K.D.; Brussaard, L.; Pulleman, M.M. Earthworm activity and soil structural changes under conservation agriculture in central Mexico. Soil Tillage Res. 2012, 123, 61–70. [Google Scholar] [CrossRef]
  5. Nunes, M.R.; Denardin, J.E.; Pauletto, E.A.; Faganello, A.; Spinelli-Pinto, L.F. Mitigation of clayey soil compaction managed under no-tillage. Soil Tillage Res. 2015, 148, 119–126. [Google Scholar] [CrossRef]
  6. Al-Shammary, A.A.G.; Kouzani, A.Z.; Kaynak, A.; Khoo, S.Y.; Norton, M.; Gates, W. Soil bulk density estimation methods: A review. Pedosphere 2018, 28, 581–596. [Google Scholar] [CrossRef]
  7. Wösten, J.H.M.; Van Genuchten, M.T. Using texture and other soils properties to predict the unsaturated soil hydraulic functions. Soil Sci. Soc. Am. J. 1988, 52, 1762–1770. [Google Scholar] [CrossRef]
  8. Jabro, J.D.; Stevens, W.B.; Iversen, W.M.; Evans, R.G. Bulk density, water content, and hydraulic properties of a sandy loam soil following conventional or strip tillage. Appl. Eng. Agric. 2011, 27, 765–768. [Google Scholar] [CrossRef]
  9. Castellini, M.; Ventrella, D. Impact of conventional and minimum tillage on soil hydraulic conductivity in typical cropping system in Southern Italy. Soil Tillage Res. 2012, 124, 47–56. [Google Scholar] [CrossRef]
  10. Fernandez-Ugalde, O.; Virto, I.; Bescansa, P.; Imaz, M.J.; Enrique, A.; Karlen, D.L. No-tillage improvement of soil physical quality in calcareous degradation-prone semiarid soils. Soil Tillage Res. 2009, 106, 29–35. [Google Scholar] [CrossRef]
  11. Kuzucua, M.; Dökmenb, F. The effects of tillage on soil water content in dry areas. Agric. Agric. Sci. Procedia 2015, 4, 126–132. [Google Scholar] [CrossRef]
  12. Campos-Magaña, S.G.; Cadena-Zapata, M.; Ramírez-Fuentes, G.; Pacheco-López, J.L.; Reynolds-Chavez, M.A.; Valezuela-Garcia, J.R. An experimental determination of the specific soil resistance of a sandy loam soil using vertical soil tillage in the Northeast of Mexico. Agric. Mech. Asia Afr. Lat. Am. 2015, 46, 53–57. [Google Scholar]
  13. Reicosky, D.C. Conservation tillage is not conservation agriculture. J. Soil Water Conserv. 2015, 70, 103–108. [Google Scholar] [CrossRef]
  14. Strudley, M.W.; Green, T.R.; Ascough, J.C., II. Tillage effects on soil hydraulics properties in space and time: State of the science. Soil Tillage Res. 2008, 99, 4–48. [Google Scholar] [CrossRef]
  15. Blanco-Canqui, H.; Ruis, S.J. No-tillage and soil physical environment. Geoderma 2018, 326, 164–200. [Google Scholar] [CrossRef]
  16. Alegre, J.C.; Cassel, D.K.; Amezquita, E. Tillage systems and soil properties in Latin America. Soil Tillage Res. 1991, 20, 147–163. [Google Scholar] [CrossRef]
  17. Salem, H.M.; Valero, C.; Muñoz, M.A.; Gil Rodríguez, M.; Silva, L.L. Short-term effects of four tillage practices on soil physical properties, soil water potential, and maize yield. Geoderma 2015, 237–238, 60–70. [Google Scholar] [CrossRef]
  18. Gozubuyuk, Z.; Sahin, U.; Ozturk, I.; Celik, A.; Adiguzel, M.C. Tillage effects on certain physical and hydraulic properties of a loamy soil under a crop rotation in a semi-arid region with a cool climate. Catena 2014, 118, 195–205. [Google Scholar] [CrossRef]
  19. Huang, M.; Liang, T.; Wang, L.; Zhou, C. Effects of no-tillage systems on soil physical properties and carbon sequestration under long-term wheat–maize double cropping system. Catena 2015, 128, 195–202. [Google Scholar] [CrossRef] [Green Version]
  20. Alletto, L.; Pot, V.; Giuliano, S.; Costes, M.; Perdrieux, F.; Justes, E. Temporal variation in soil physical properties improves the water dynamics modeling in a conventionally-tilled soil. Geoderma 2015, 243, 18–28. [Google Scholar] [CrossRef]
  21. Dam, R.F.; Mehdi, B.B.; Burgess, M.S.E.; Madramootoo, C.A.; Mehuys, G.R.; Callum, I.R. Soil bulk density and crop yield under eleven consecutive years of corn with different tillage and residue practices in a sandy loam soil in central Canada. Soil Tillage Res. 2005, 84, 41–53. [Google Scholar] [CrossRef]
  22. Reynolds, W.D.; Drury, C.F.; Yang, X.M.; Fox, C.A.; Tan, C.S.; Zhang, T.Q. Land management effects on the near-surface physical quality of a clay loam soil. Soil Tillage Res. 2007, 96, 316–330. [Google Scholar] [CrossRef]
  23. Tracy, S.R.; Black, C.R.; Roberts, J.A.; McNeill, A.; Davidson, R.; Tester, M.; Samec, M.; Korošak, D.; Sturrock, C.; Mooney, S.J. Quantifying the effect of soil compaction on three varieties of wheat (Triticum aestivum L.) using X-ray Micro Computed Tomography (CT). Plant Soil 2012, 353, 195–208. [Google Scholar] [CrossRef]
  24. Tracy, S.R.; Black, C.R.; Roberts, J.A.; Mooney, S.J. Exploring the interacting effect of soil texture and bulk density on root system development in tomato (Solanum lycopersicum L.). Environ. Exp. Bot. 2013, 91, 38–47. [Google Scholar] [CrossRef]
  25. Rienzner, M.; Gandolfi, C. Investigation of spatial and temporal variability of saturated soil hydraulic conductivity at the field-scale. Soil Tillage Res. 2014, 135, 28–40. [Google Scholar] [CrossRef]
  26. Schwen, A.; Bodner, G.; Scholl, P.; Buchan, G.D.; Loiskandl, W. Temporal dynamics of soil hydraulic properties and the water-conducting porosity under different tillage. Soil Tillage Res. 2011, 113, 89–98. [Google Scholar] [CrossRef]
  27. Regalado, C.M.; Muñoz-Carpena, R. Estimating the saturated hydraulic conductivity in a spatially variable soil with different permeameters: A stochastic Kozeny–Carman relation. Soil Tillage Res. 2004, 77, 189–202. [Google Scholar] [CrossRef]
  28. Lampurlanes, J.; Cantero Martinez, C. Hydraulic conductivity, residue cover and soil surface roughness under different tillage systems in semiarid conditions. Soil Tillage Res. 2006, 85, 13–26. [Google Scholar] [CrossRef]
  29. Bottinelli, N.; Menasseri-Aubry, S.; Cluzeau, D.; Hallaire, V. Response of soil structure and hydraulic conductivity to reduced tillage and animal manure in a temperate loamy soil. Soil Use Manag. 2013, 29, 401–409. [Google Scholar] [CrossRef]
  30. Roldan, A.; Caravaca, F.; Hernández, M.T.; Garcia, C.; Sánchez-Brito, C.; Velásquez, M.; Tiscareño, M. No-tillage, crop residue additions, and legume cover cropping effects on soil quality characteristics under maize in Patzcuaro watershed (Mexico). Soil Tillage Res. 2003, 72, 65–73. [Google Scholar] [CrossRef]
  31. Morris, N.L.; Miller, P.C.H.; Orson, J.H.; Froud Williams, R.J. The adoption of non-inversion tillage systems in the United Kingdom and the agronomic impact on soil, crops and the environment-A review. Soil Tillage Res. 2010, 108, 1–15. [Google Scholar] [CrossRef]
  32. Verhulst, N.; Govaerts, B.; Verachtert, E.; Castellanos-Navarrete, A.; Mezzalama, M.; Wall, P.; Deckers, J.; Sayre, K.D. Conservation Agriculture, Improving Soil Quality for Sustainable Production Systems? In Advances in Soil Science: Food Security and Soil Quality; Lal, R., Stewart, B.A., Eds.; CRC Press: Boca Raton, FL, USA, 2010; pp. 137–208. ISBN 9781439800577. [Google Scholar]
  33. Haruna, S.I.; Anderson, S.H.; Nkongolo, N.V.; Zaibon, S. Soil Hydraulic Properties: Influence of Tillage and Cover Crops. Pedosphere 2018, 28, 430–442. [Google Scholar] [CrossRef]
  34. Campbell, D.J. Determination and Use of Soil Bulk Density in Relation to Soil Compaction. Dev. Agric. Eng. 1994, 11, 113–139. [Google Scholar] [CrossRef]
  35. Flint, A.L.; Flint, L.E. Particle density. In Methods of Soil Analysis; Dane, J.H., Topp, G.C., Eds.; Part 4. Physical Methods; Soil Science Society of America: Madison, WI, USA, 2002; pp. 229–240. [Google Scholar]
  36. Reynolds, W.D. Saturated hydraulic properties: Well permeameter. In Soil Sampling and Methods of Analysis, 2nd ed.; Carter, M.R., Gregorich, E.G., Eds.; CRC Press: Boca Raton, FL, USA, 2008; pp. 1025–1042. ISBN 9780849335860. [Google Scholar]
  37. Demuner-Molina, G.; Cadena-Zapata, M.; Campos-Magaña, S.G.; Zermeño-González, A.; Sánchez-Pérez, F.J. Efecto de labranza y mejoradores de suelo en humedad y desarrollo radicular. Tecnología y Ciencias del Agua 2014, 5, 123–130. [Google Scholar]
  38. R Core Team. R: A Language and Environment for Statistical Computing. Version 2.10. 2009. Available online: https://www.R-project.org/ (accessed on 18 August 2017).
  39. Mendiburu, F.D. Agricolae: Statistical Procedures for Agricultural Research. R Package. Agricolae Package Version 1.2-8. 2017. Available online: http://CRAN.R-project.org/package=agricolae (accessed on 18 August 2017).
  40. Tammeorg, P.; Simojoki, A.; Mäkelä, P.; Stoddard, F.L.; Alakukku, L.; Helenius, J. Biochar application to a fertile sandy clay loam in boreal conditions: Effects on soil properties and yield formation of wheat, turnip rape and faba bean. Plant Soil 2014, 374, 89–107. [Google Scholar] [CrossRef]
  41. Pachepsky, Y.; Park, Y. Saturated Hydraulic Conductivity of US Soils Grouped According to Textural Class and Bulk Density. Soil Sci. Soc. Am. J. 2015, 79, 1094–1100. [Google Scholar] [CrossRef]
  42. Soil Quality Institute. Soil Compaction: Detection, Prevention, and Alleviation; National Resources Conservation Service. USDA. Soil Quality—Agronomy Technical Note No. 17; Soil Quality Institute: Auburn, AL, USA, 2003; p. 7. [Google Scholar]
  43. Logsdon, S.D.; Karlen, D.L. Bulk density as a soil quality indicator during conversion to no-tillage. Soil Tillage Res. 2004, 78, 143–149. [Google Scholar] [CrossRef]
  44. Alletto, L.; Coquet, Y. Temporal and spatial variability of soil bulk density and near-saturated hydraulic conductivity under two contrasted tillage management systems. Geoderma 2009, 152, 85–94. [Google Scholar] [CrossRef]
  45. Logsdon, S.D.; Kaspar, T.C.; Cambardella, C.A. Depth-Incremental Soil Properties under No-Till or Chisel Management. Soil Sci. Soc. Am. J. 1999, 63, 197–200. [Google Scholar] [CrossRef]
  46. Fuentes, M.; Govaerts, B.; De Leon, F.; Hidalgo, C.; Dendooven, L.; Sayre, K.D.; Etchevers, J. Fourteen years of applying zero and conventional tillage, crop rotation and residue management systems and its effect on physical and chemical soil quality. Eur. J. Agron. 2009, 30, 228–237. [Google Scholar] [CrossRef]
  47. Monneveux, P.; Quillerou, E.; Sanchez, C.; Lopez-Cesati, J. Effect of zero tillage and residues conservation on continuous maize cropping in a subtropical environment (Mexico). Plant Soil 2006, 279, 95–105. [Google Scholar] [CrossRef]
  48. Jabro, J.D.; Iversen, W.M.; Stevens, W.A.; Evans, R.G.; Mikha, M.M.; Allen, B.L. Physical and hydraulic properties of a sandy loam soil under zero, shallow and deep tillage practices. Soil Tillage Res. 2016, 159, 67–72. [Google Scholar] [CrossRef]
  49. Ferrara, R.M.; Mazza, G.; Muschitiello, C.; Castellini, M.; Stellacci, A.M.; Navarro, A.; Lagomarsino, A.; Vitti, C.; Rossi, R.; Rana, G. Short-term effects of conversion to no-tillage on respiration and chemical—Physical properties of the soil: A case study in a wheat cropping system in semi-dry environment. Ital. J. Agrometeorol. 2017, 1, 47–58. [Google Scholar] [CrossRef]
  50. Shi, X.H.; Yang, X.M.; Drury, C.F.; Reynolds, W.D.; McLaughlin, N.B.; Zhang, X.P. Impact of ridge tillage on soil organic carbon and selected physical properties of a clay loam in southwestern Ontario. Soil Tillage Res. 2012, 120, 1–7. [Google Scholar] [CrossRef]
  51. Blanco Canqui, H.; Wienhold, B.J.; Jin, V.L.; Schmer, M.R.; Kibet, L.C. Long term tillage impact on soil hydraulic properties. Soil Tillage Res. 2017, 170, 38–42. [Google Scholar] [CrossRef]
  52. Mupangwa, W.; Twomlow, S.; Walker, S. Cumulative effects of reduced tillage and mulching on soil properties under semiarid conditions. J. Arid Environ. 2013, 91, 45–52. [Google Scholar] [CrossRef]
  53. Nimmo, J.R. Porosity and Pore Size Distribution, Reference Module in Earth Systems and Environmental Sciences; Elsevier: Amsterdam, The Netherlands, 2013. [Google Scholar]
  54. Pagliai, M.; Vignozzi, N. The Soil Pore System as an Indicator of Soil Quality. Adv. Geoecol. 2002, 35, 69–80. [Google Scholar]
  55. Glab, T.; Kulib, B. Effect of mulch and tillage system on soil porosity under wheat (Triticum aestivum). Soil Tillage Res. 2008, 99, 169–178. [Google Scholar] [CrossRef]
  56. Martinez, E.; Fuentes, J.P.; Silva, P.; Valle, S.; Acevedo, E. Soil physical properties and wheat root growth as affected by no tillage and conventional tillage systems in a Mediterranean environment of Chile. Soil Tillage Res. 2008, 99, 232–244. [Google Scholar] [CrossRef]
  57. Soil Science Division Staff. Soil Survey Manual; Ditzler, C., Scheffe, K., Monger, H.C., Eds.; USDA Handbook 18; Government Printing Office: Washington, DC, USA, 2017; pp. 218–226.
  58. Topp, G.C.; Reynolds, W.D.; Cook, F.J.; Kirby, J.M.; Carter, M.R. Physical attributes of soil quality. In Soil Quality for Crop Production and Ecosystem Health; Gregorich, E.G., Carter, M.R., Eds.; Elsevier: New York, NY, USA, 1997; pp. 21–58. [Google Scholar]
  59. Reynolds, W.D.; Yang, X.M.; Drury, C.F.; Zhang, T.Q.; Tan, C.S. Effects of selected conditioners and tillage on the physical quality of a clay loam soil. Can. J. Soil Sci. 2003, 83, 318–393. [Google Scholar] [CrossRef]
  60. Jirku, V.; Kodešová, R.; Nikodem, A.; Mühlhanselová, M.; Žigová, A. Temporal variability of structure and hydraulic properties of topsoil of three soil types. Geoderma 2013, 204, 43–58. [Google Scholar] [CrossRef]
  61. Pittelkow, C.M.; Linquist, B.A.; Lundy, M.E.; Liang, X.; Kees Janvan Groenigen, K.J.; Lee, J.; van Gestel, N.; Six, J.; Venterea, R.T.; van Kessel, C. When does no-till yield more? A global meta-analysis. Field Crop. Res. 2015, 183, 156–168. [Google Scholar] [CrossRef] [Green Version]
  62. Berner, A.; Hildermann, I.; Fließbach, A.; Pfiffner, L.; Niggli, U.; Mäder, P. Crop yield and soil fertility response to reduced tillage under organic management. Soil Tillage Res. 2008, 101, 89–96. [Google Scholar] [CrossRef]
  63. Ordóñez Fernández, R.; González Fernández, P.; Giráldez Cervera, J.V.; Perea Torres, F. Soil properties and crop yields after 21 years of direct drilling trials in southern Spain. Soil Tillage Res. 2007, 94, 47–54. [Google Scholar] [CrossRef]
  64. Boddey, R.M.; Jantalia, C.P.; Conceicao, P.C.; Zanatta, J.A.; Bayer, C.; Mielniczuk, J.; Dieckow, J.; Dos Santos, H.P.; Denardin, J.E.; Aita, C.; et al. Carbon accumulation at depth in Ferralsols under zero-till subtropical agriculture. Glob. Chang. Biol. 2010, 16, 784–795. [Google Scholar] [CrossRef]
  65. Schillinger, W.F. Tillage Method and Sowing Rate Relations for Dryland Spring Wheat, Barley, and Oat. Crop Sci. 2005, 45, 2636–2643. [Google Scholar] [CrossRef]
Figure 1. Bulk density (Bd) in the soil profile 0–5 cm (a), 5–10 cm (b), 10–15 cm (c) and 15–20 cm (d) for each year, with each tillage system. NT: No Tillage, VT: Vertical Tillage, CT: Conventional Tillage.
Agriculture 09 00062 g001
Figure 2. Change of bulk density in 2014 compared to 2013.
Agriculture 09 00062 g002
Figure 3. Change of bulk density in 2015 compared to 2013.
Agriculture 09 00062 g003
Figure 4. Changes of bulk density in 2016 compared to 2013.
Agriculture 09 00062 g004
Figure 5. Pore space (P) in the surface layer from 0 to 5 cm through the years for the different tillage systems. Mean values with the same letter in the same year are not significantly different (Tukey α ≤ 0.05). Bars on top of treatment are the standard error.
Agriculture 09 00062 g005
Figure 6. Pore space at the bottom layer (15 to 20 cm) profile, over the years for the different tillage systems. Mean values with the same letter in the same year are not significantly different (Tukey α ≤ 0.05). Bars on top of treatment are the standard error.
Agriculture 09 00062 g006
Figure 7. Changes in hydraulic conductivity (Logarithmic scale) over the four-year period, for different tillage systems. Mean values with the same letter in the same year are not significantly different (Tukey α ≤ 0.05). Bars on top of treatment are the standard error.
Agriculture 09 00062 g007
Figure 8. Change of saturated hydraulic conductivity for each tillage system, having as a reference the values of 2013.
Agriculture 09 00062 g008
Figure 9. Dry matter yield of oats under the different tillage systems. Mean values with the same letter in the same year are not significantly different (Tukey α ≤ 0.05).
Agriculture 09 00062 g009
Table 1. Specifications of the implements used for the tillage systems.
ImplementType of ToolsWeight (kg)Working Width (cm)Working Depth (cm)
Mounted Disc plow ARHK-33 discs of 0.711 m diameter 5428020
Mounted Chisel plow JD 6108 tines “C” type shank 61822016
Mounted Disc harrow RI 202420 discs of 0.609 m diameter67422512
Mounted Seeder Gaspardo SC MariaDisc coulter furrow opener7352505
Table 2. Bulk density from 2013 to 2016 in the soil profile for the investigated tillage system.
YearTillage SystemDepth in the Soil Profile (cm)
0 to 55 to 1010 to 1515 to 20
Bulk Density (g cm−3)
2013NT1.28 (0.04) a1.29 (0.02) a1.33 (0.02) a1.31 (0.04) a
VT1.24 (0.03) a1.25 (0.06) a1.27 (0.04) a1.26 (0.05) a
CT1.28 (0.03) a1.31 (0.02) a1.32 (0.03) a1.27 (0.04) a
2014NT1.43 (0.04) a1.35 (0.05) a1.36 (0.07) a1.41 (0.03) a
VT1.34 (0.03) a1.38 (0.03) a1.36 (0.04) a1.39 (0.03) a
CT1.36 (0.05) a1.31 (0.04) a1.38 (0.07) a1.36 (0.08) a
2015NT1.33 (0.03) a1.37 (0.04) a1.39 (0.02) a1.39 (0.03) a
VT1.36 (0.06) a1.35 (0.04) a1.41 (0.03) a1.42 (0.06) a
CT1.36 (0.04) a 1.44 (0.05) a1.36 (0.04) a1.33 (0.03) a
2016NT1.26 (0.02) a1.22 (0.05) a1.22 (0.03) a1.22 (0.04) a
VT1.26 (0.04) a1.24 (0.05) a1.23 (0.04) a1.23 (0.02) a
CT1.21 (0.04) a1.21 (0.06) a1.21 (0.05) a1.20 (0.04) a
Mean values with the same letter in a column in the same year are not significantly different (Tukey α ≤ 0.05). The standard error is given in brackets. NT: No Tillage, VT: Vertical Tillage, CT: Conventional Tillage.

