1. Introduction
Throughout the United States, the nursery ornamental production industry has become an increasingly popular agricultural sector. The United States Department of Agriculture’s 15 state program has generated a cumulative monetary worth greater than four billion dollars since 2006. California and Florida account for 49% of the 15 state total value, and Florida ranks second in the total wholesale of floriculture crops at 24% of the nationwide supply, making this an economically important industry for the state [
1].
Large scale nursery production involves the use of containers to grow plants with the necessary medium, usually a light weight potting mix. Producers are responsible for providing appropriate nutrients for each plant with fertilizer application depending on the targeted species and age [
2]. When establishing a fertigation regime, three macro nutrients are necessary for proper plant growth; nitrogen, phosphorus, and potassium (N, P, and K, respectively) [
3]. A plant that lacks the required supplement of available N (NO
3−, NH
4+) will demonstrate various symptoms that denote feebleness such as slow or stunted growth, yellowing of foliage, leaf chlorosis, and leaf abscission [
4]. In contrast, plants with excessive N show symptoms of delayed flowering patterns and overall diminished growth potential [
5]. Nursery containers have openings at the bottom to permit aeration and drainage. This allows for water to drain, and in turn, leaching of nutrients [
6]. Nutrient leaching has detrimental effects on the environment, particularly in creating eutrophic conditions in natural water bodies [
7]. An acre of land in nursery production has the potential to house 40,000 to 300,000 containers, many of which receive excessive fertilizer application [
8]. This is a primary driver in declining water quality throughout Florida, which ultimately contributes to algal blooms. Previous studies have shown that N found in fertilizer can be lost as runoff or leach through container [
9,
10]. These findings call for a reconsideration of recommended fertilization protocols in nursery production.
Justicia brandegeana (Brandegee) is an ornamental plant native to Mexico and naturalized in Florida, based on its tropical characteristic [
11]. In its native semi-arid habitat,
J. brandegeana grows as a shrub with attractive and colorful bracts that surround small white flowers. When observed together the bracts and flowers resemble a shrimp, hence its common name “shrimp plant” [
12].
Justicia brandegeana has the potential to thrive in North America’s hardiness zones 8–11 [
13]. Due to its wide range of suitable habitat,
J. brandegeana is a resilient candidate for landscaping projects. When grown in outdoor gardens, the nectar within its flowers entice native hummingbirds and other pollinators [
14]. These factors make the shrimp plant attractive to homeowners for the purpose of landscaping [
13]. This study focuses on demonstrating the use of non-destructive handheld sensors to estimate nutritional needs for
J. brandegeana. GreenSeeker
TM (Trimble, Sunnyvale, CA, USA) gives a Normalized Difference Vegetative Index (NDVI) measurement that provides an indication of chlorophyll content within green plants material [
15]. This allows for better understanding of a plant’s overall health, vigor and nutrient content at a given time. GreenSeeker
TM handheld sensor contains two electroluminescent diodes that emit red (660 nm) and near infrared (NIR) light (770 nm) onto the canopy of the target plant [
7,
16,
17]. Plants with green color exhibit a low reflectance of blue and red, and a high reflectance of NIR radiation [
18]. The palisade layer within leaves contain the chlorophyll responsible for the reflectance of visible red light and scattering of NIR [
19]. The reflectance of NIR light can be directly attributed to the mesophyll cells and cavities present between the cells [
20]. As a result, NDVI is a ratio of NIR to red [
21], with a range from 0 to 1. Values closer to 1 have a high reflectance of NIR representing a leaf with substantial chlorophyll content, while values closer to 0 represent low chlorophyll content [
18].
As an addition to GreenSeeker
TM readings, Soil Plant Analysis Development (SPAD) meter (Konica Minolta, Ramsey, NJ, USA) was also used to estimate N. The SPAD-502 meter, similar to the GreenSeeker
TM, is a non-destructive handheld sensor that gives a numerical representation of the approximate amount of chlorophyll present in a given leaf [
17]. The SPAD meter clips onto a single leaf and records light intensity of 650 nm and 940 nm, measuring the absorbance of light emitted [
16]. The 650 nm wavelength is correlated to maximum chlorophyll activity while the 940 nm wavelength accounts for other factors including leaf thickness and moisture content [
22]. The difference of the two absorbance values for the light emitted at a given wavelength gives the user a value ranging from −9.9 to 199.99 [
23].
Past studies have been conducted for effectiveness of non-destructive handheld sensors on various crops and ornamentals in situ [
17,
24,
25,
26,
27]. However, no studies have specifically focused on
J. brandegeana and popular controlled release fertilizer (CRF) Florikan. Because
J. brandegeana is an economically popular plant in South Florida, this trial will provide useful information for nursey producers in and out of the state. As such, the primary objective of this study is to determine effectiveness of non-destructive sensors SPAD and GreenSeeker
TM for sustainable fertilizer management in the ornamental production of
J. brandegeana. Additionally, to investigate current industry fertilizer application compared to lesser rates of Florikan top-dressed fertilizer for sustainable production of this common landscaping plant. It is hypothesized that standard ornamental industry fertilization practices over-compensate with fertilizer application to prevent plant stress. Therefore, precision horticulture and non-destructive sensors can be employed to detect fertilization needs. The results of this study can provide indication for nursery producers to follow and manage adequate fertilizer amendments in appropriate intervals. Water resource contamination stemming from agricultural origins has consistently been a problem in the State of Florida [
28]. Eutrophication of water bodies has resulted in various environmental issues including toxic algal blooms [
29] and significant vegetation shifts and wildlife presence in Everglades ecosystems [
30].
2. Materials and Methods
Two weeks prior to the first sampling date,
J. brandegeana cuttings were obtained from Symphony Landscaping Nursery (Hollywood, FL, USA). The cuttings were received in 12 cm diameter containers with established roots and no prior fertilization. At Florida International University’s greenhouse (Miami, FL, USA), media was prepared using a 2:1 ratio of Sun Gro Horticulture Professional Growing Mix (Sun Gro Horticulture Inc., Bellview, WA, USA) and perlite. This media mix contained no supplementary nutrients to ensure controlled fertilizer additions. Perlite was added to allow for maximum soil aeration in each pot for optimal plant growth [
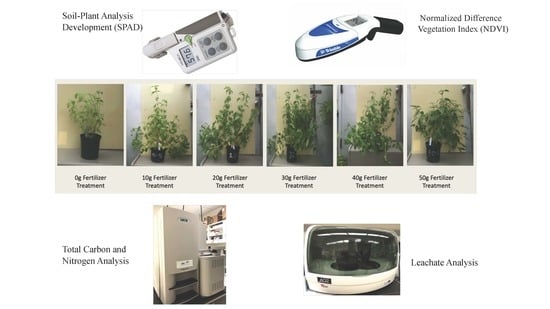
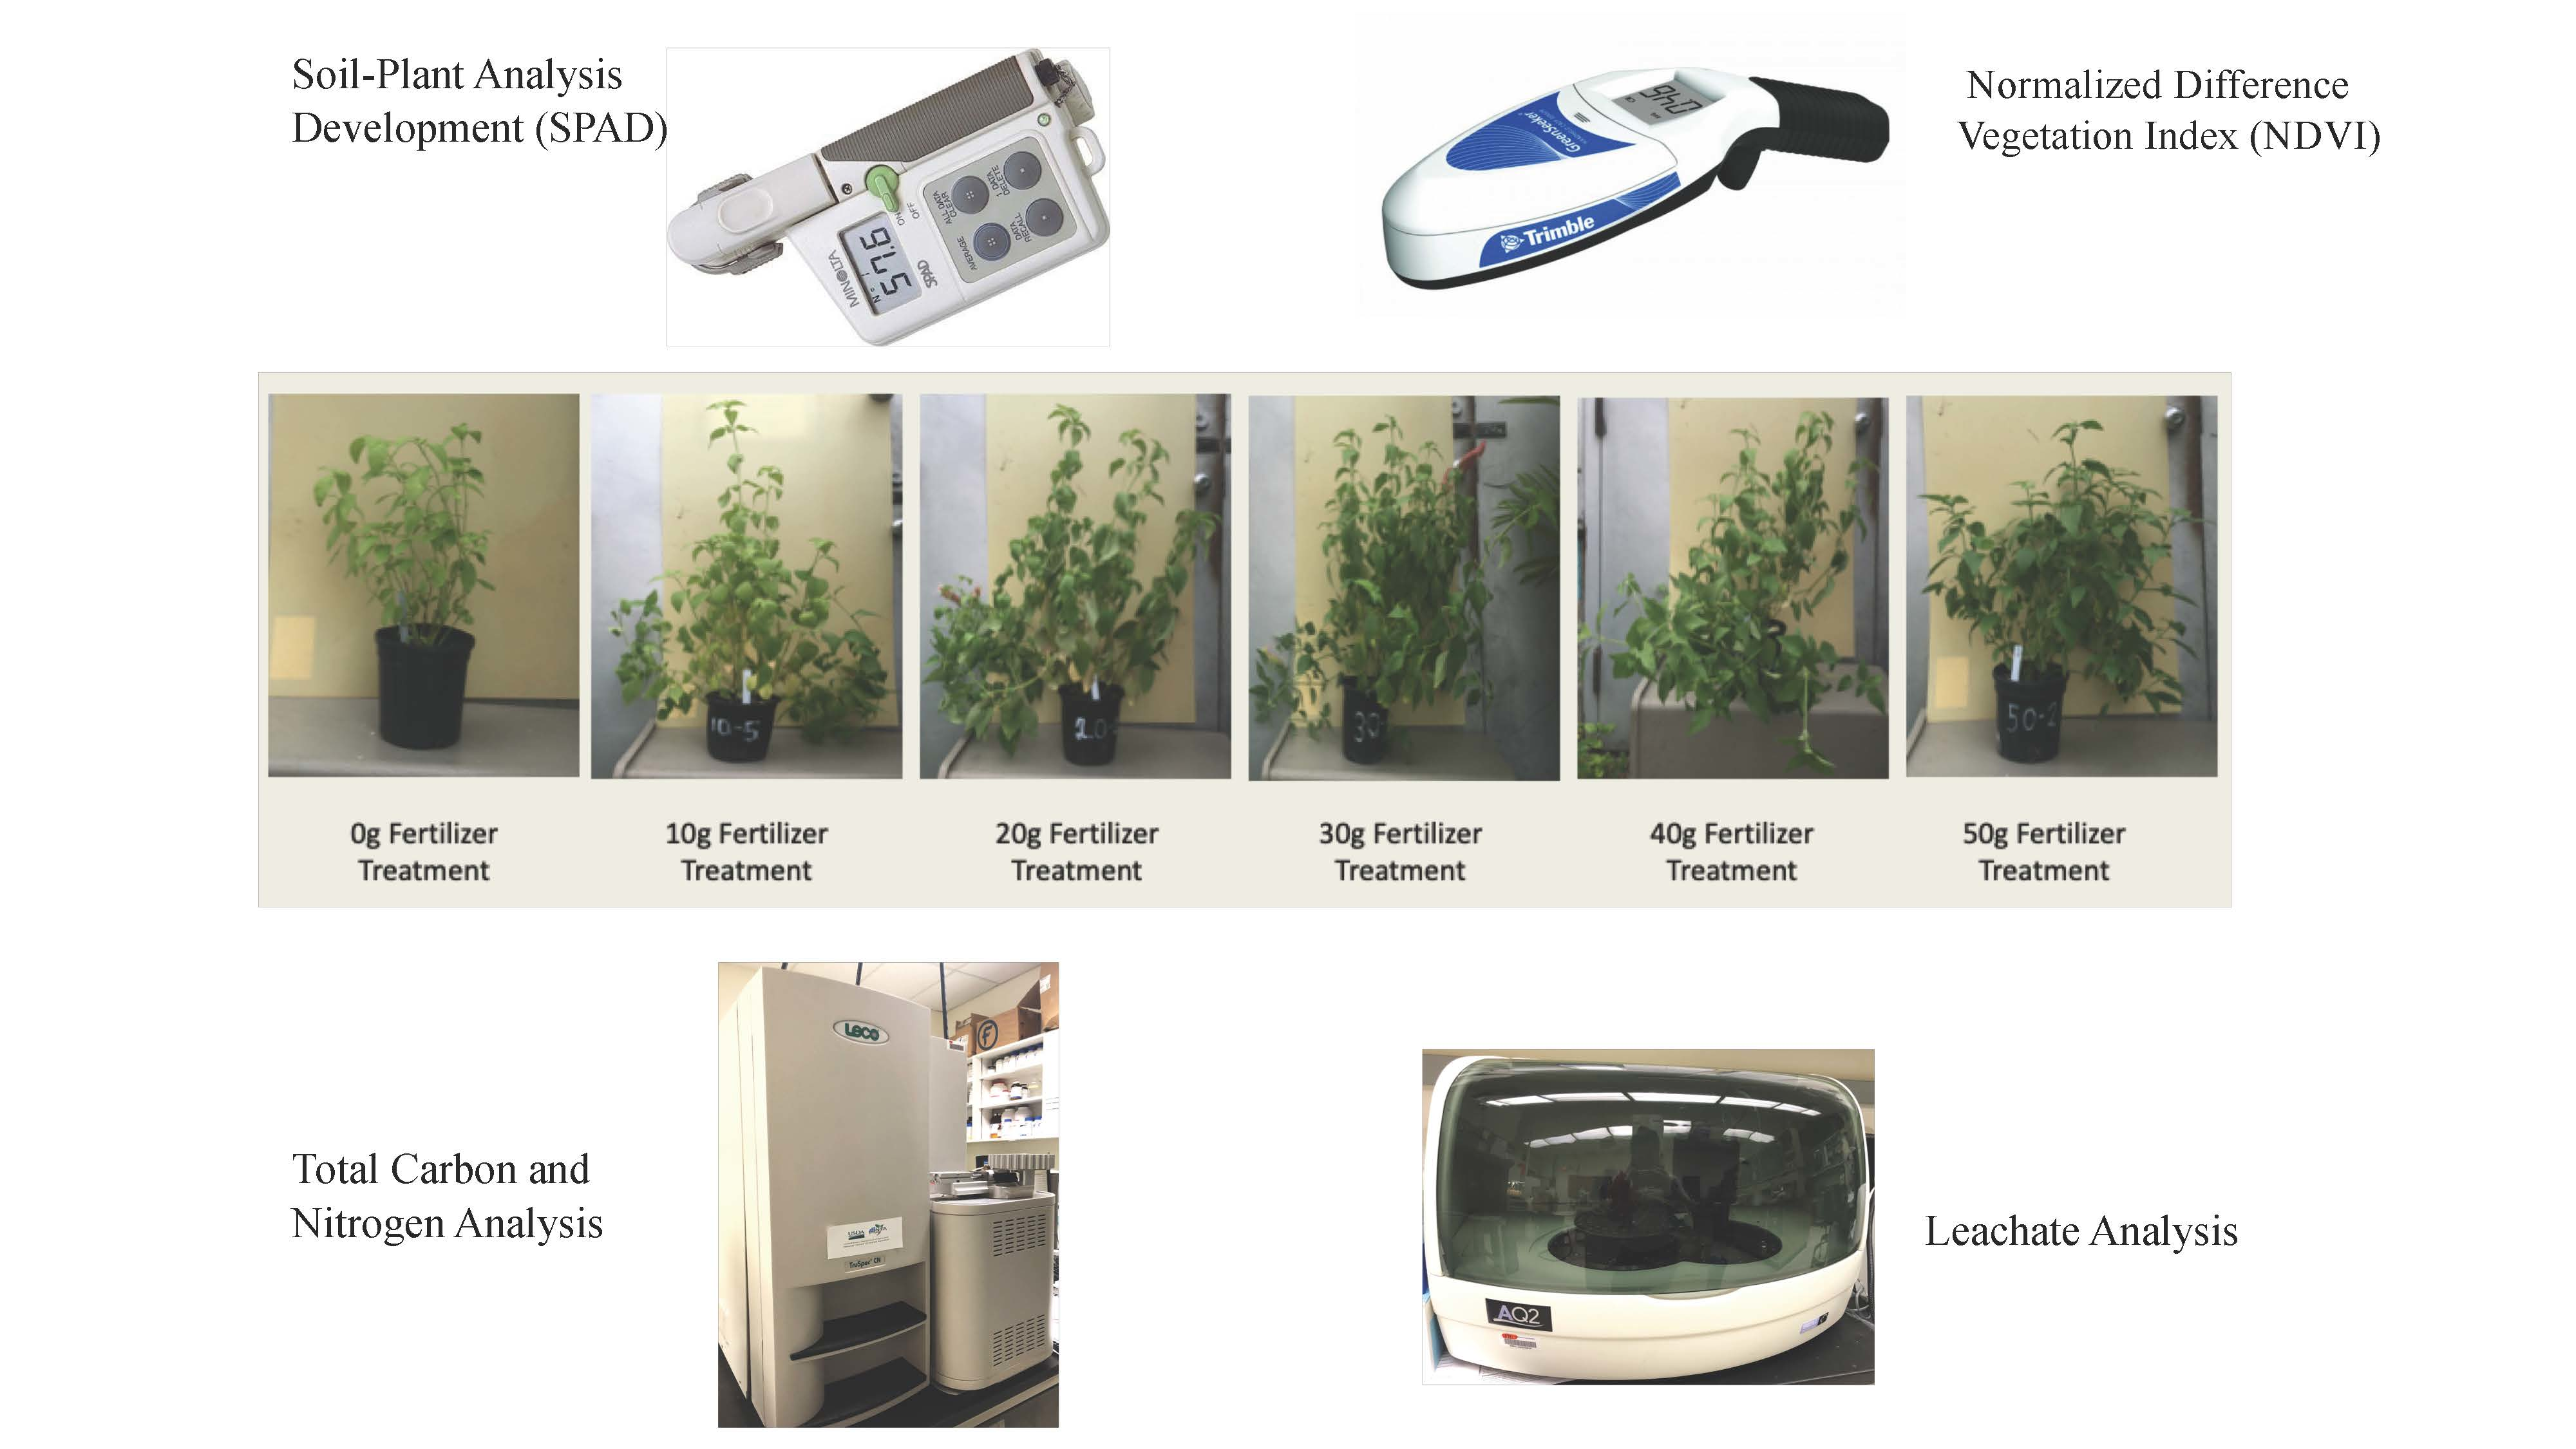
31]. Cuttings were transplanted into 16.5 cm diameter containers with the premixed media. Transplanting of cuttings assured that plants were not confined to small containers that would stunt their growth for the four-month experimental period. Containers were placed randomly onto greenhouse benches, equidistant from each other and exposed to natural photoperiods in a completely randomized design (CRD). Florikan Top-Dress fertilizer 12N-6P-8K (Florikan, Sarasota, Florida Top Dress 12-6-8 60 Series), a polymer coated CRF (2–3-month application rate) was applied in the same transplanting day to individually top-dressed each potted plant. The study included six treatments, each with five replications. Fertilizer treatments were distinguished by 10-gram increments and applied simultaneously onto pre-labeled potted plants (0, 10, 20, 30, 40, 50 g treatments/pot). This allowed the regulation of nutrient uptake for
J. brandegeana at distinct fertilization rates. The range of fertilizer treatments applied was intended to simulate deficiencies in N at one end, and excessive quantities of N at the other end. All plants were irrigated with water three times per week until fully saturated (% leachate) with average greenhouse temperature of 23–25°C.
Beginning at two weeks after treatment (WAT), GreenSeeker
TM was used to obtain NDVI measurements on a biweekly basis. The plants green canopy was the intended target, all other colored surfaces contribute background noise when utilizing the GreenSeeker
TM. For this reason, each plant was placed on top of a black surface omitting any surrounding color that would otherwise have affected the readings. The GreenSeeker
TM was held at 45 cm above the sample plant for each reading [
24]. This assured that the field of view for the sensor was ~11.85 cm in diameter [
16]. In consideration of variation in foliage on the canopy top of each plant, three measurements were taken per replicate in each treatment. The mean of the three measurements were considered when analyzing data.
A Soil Plant Analytical Development meter was used simultaneously with the GreenSeekerTM ensuring similar conditions for all plants during the sampling period. For SPAD-502 measurement, three mature leaves were selected at random from the middle to top canopy region for consistency of each plant measurement. The SPAD electrode dial was placed towards the central region of each leaf during measurement. Three mature leaves were sampled randomly with five replicates in each treatment. Initial baseline sampling took place prior to the introduction of any supplemental nutrients. Composite leaf tissue samples for each treatment were collected and analyzed for CN at the 4, 8, 12 WAT sampling periods.
Composite tissue samples of each treatment were analyzed using dry combustion via LECO Truspec Carbon and Nitrogen Analyzer (LECO Corporation, St. Joseph, MI, USA). Total carbon and N of composite leaf samples were quantified as a response of each treatment.
Additionally, the pour-through method [
32] was used to obtain leachate samples from individual containers to determine nutrient runoff rates. Each plant was irrigated until a saturated state was reached. Once containers reached the water holding capacity stage, a saucer tray was placed underneath serving as a collection reservoir. Deionized water (350 ml) was applied allowing for the collection of 50 mL of leachate. Samples were stored in 50 mL conical tubes that were immediately refrigerated at 4 °C until laboratory analysis was performed. The pH of each leachate sample was measured. Nitrate and phosphate were quantified using a SEAL AQ2 Automated Discrete Analyzer (Mequon, WI, USA).
Statistical Analysis
Five treatments and a control were established with five replications for each treatment resulting in a total of 30 potted plants which were arranged in a CRD. Containers were placed at random onto greenhouse benches and were labeled by treatment and replicate number. Continuous response variables of NDVI, SPAD chlorophyll index, NO3− and P leachate were statistically analyzed using generalized linear mixed model methods. All statistical analysis was performed at P < 0.05 level using SPSS statistical software (Version 22.0., IBM Corp., Armonk, NY, USA) Data trends were compared using one-way ANOVA and correlation tests, significant differences between variables were found using post-hoc least significant differences (LSD) method.
3. Results
Normalized Difference Vegetation Index values increased from 4 WAT to 8 WAT in most of the fertilizer rates (
Table 1). The inconsistent values associated with 2 WAT (initial reading) can be attributed to low number of leaves resulting in fertilizer background noise (white color). This led to higher recorded NDVI values for all the fertilizer treatments except the control (
Table 1). The greatest NDVI values (0.82 and 0.81) were observed at 8 WAT with 30 and 40 g fertilizer rates; although, there was no significant difference between these two values (
Table 1). In 8, 10, and 12 WAT, a decrease in NDVI values is evident. It is possible that this decrease in NDVI is due to the additional N requirement of
J. brandegeana by the 10 WAT sampling period, a crucial time for fertilizer management in nursery production (
Table 1).
Furthermore, NDVI readings were significantly correlated with leaf N results at 4 and 8 WAT, although this was not the case at 12 WAT (
Table 2).
Soil Plant Analytical Development values varied from 20 to 50 throughout the various fertilizer rates. Similar to the NDVI values, the 50 g fertilizer rate did not show the highest chlorophyll index values and varied little throughout 4, 6, 8, and 10 WAT collection periods (
Table 3).
There was no significant difference between 20, 30, and 40 g fertilizer rates with the exception of the 8 and 10 WAT sampling periods. The largest increase in chlorophyll index occurred in the transition of 2 to 4 WAT. The greatest SPAD value (50.82) was observed in 20 g fertilizer rate at 8 WAT (
Table 3). The leaf total N showed varying results based on fertilizer treatments throughout 4 to 12 WAT (
Table 4). Although not confirmed by statistical analysis, the greatest leaf total N content was observed in the 30 g fertilizer rate at 4 WAT, closely followed by the 50 g and 40 g fertilizers with 53.48, 52.23, and 52.91 mg/g dw, respectively (
Table 4).
At 8 WAT, the plants treated with 40 g fertilizer rate contained the highest leaf total N with 40.34 mg/g dw. The last reading, collected after three months after transplanting, showed the greatest leaf total N value (37.49 mg/g dw) with the 50 g fertilizer rate (
Table 4). The leaf C:N ratio results reveal that at 4 WAT fertilizer treatments 20, 30, 40, and 50 g had similar values (
Table 5). At 8 WAT C:N varied among treatments as the 10, 20, and 30 g, rates had higher ratios than the 40 g and 50 g treatments. At 12 WAT, C:N ratio values evened out and the 20, 30, and 40 g treatment showed similar values.
SPAD results were significantly correlated (
p ≤ 0.05 and
p ≤ 0.01) with leaf total N at 4, 8, and 12 WAT (
Table 2). Nitrate leachate (mg NO
3− /L) was collected from each treatment at various time intervals. The greatest NO
3− leaching occurred 4 and 6 WAT as the fertilizer had been applied closer to those time periods (
Table 6).
The newly transplanted red shrimp had not yet developed an expanded root and shoot system in comparison to the following weeks (6–8 WAT). Samples treated with 10, 20 and 30 g of fertilizer showed significantly less leaching when compared to the 40 and 50 g fertilizer rates. Towards the end of the experiment (10 and 12 WAT), samples treated with 10, 20, 30, and 40 g of fertilizer had significantly less NO
3− leaching than the 50 g fertilizer rate. The NO
3− leachate was significantly correlated (
p ≤ 0.05 and
p ≤ 0.01) with the N rate applied at 4, 8, and 12 WAT (
Table 2).
4. Discussion
Timing the precise amount of fertilizer application is the most crucial task of horticultural nursery producers. The parameters measured were intended to determine ideal fertilization application rates for J. brandegeana as a guideline for nursery producers and landscape personnel. Furthermore, information collected can be used to determine if SPAD and/or GreenSeekerTM are appropriate devices to estimate fertilizer application rates through leaf N measurements.
GreenSeeker
TM values revealed lack of significant difference between treatments at 2 WAT (
Table 1). This can be attributed to insufficient differences in biomass between plants though all the fertilizer rates received adequate amounts of N [
7,
16]. At early developmental stages of
J. brandegeana, the foliage forming the upper canopy is not completely established. Thus, vegetation does not fill the sensors field of view entirely and the soil reflectance properties can create background noise. This may lead to less accurate readings during earlier collection dates and little to no differentiation between treatments [
17,
33]. The greatest NDVI readings were observed at 8 WAT, although no significant difference between fertilizer rates occurred at this time (
Table 1). There were no notable significant differences between fertilizer rates among NDVI readings throughout the sampling times. Correlations (P ≤ 0.01) between fertilizer rates and NDVI readings at 4 and 8 WAT were significant. Therefore, it can be inferred that 20 g and 30 g of fertilizer are just as effective as 40 g and 50 g fertilizer rates according to NDVI results (
Table 1,
Table 2 ).
Readings obtained with the SPAD meter displayed the largest difference in fertilizer rate means between 2 and 4 WAT (
Table 3). These results might be attributed to
J. brandegeana coming out of a stress period during the transplanting procedure. Various metabolic processes in transplanted seedlings can be disturbed by the influence of changes in water content and root pruning [
34]. Consequently, the growth and development of seedlings temporarily stagnates and could initially hinder overall plant health [
35]. At the 4 WAT sampling period,
J. brandegeana was responsive and assimilated N input as indicated by the two sensors chlorophyll index readings [
7,
16,
36,
37]. Dunn et al. [
7] was also in line with the findings of this study, stating that SPAD reading values could differentiate fertilizer treatments clearly as early as 28 days after treatment (DAT). Similar to the NDVI results, SPAD readings were greatest at 8 WAT. The SPAD and NDVI values were only significantly correlated (
p ≤ 0.05 and
p ≤ 0.01) at the 8 WAT sampling date. The highest SPAD reading throughout the experiment was observed at 8 WAT via the 20 g fertilizer treatment. The 20 g fertilization regimen may be ideal for
J. brandegeana as SPAD and NDVI readings were similar for this measurement time.
Both NDVI and chlorophyll concentration values reached a plateau at the 8 WAT mark. A sharp decrease followed at the 10 and 12 WAT collection period. This coincides with the manufactures claims that this specific fertilizer has the ability to supplement nutrients within a 2–3-month period before additional inputs are called for. Therefore, based on GreenSeeker
TM and SPAD meter values,
J. brandegeana seems to need additional supplementation of N at around the 2-month (8 weeks) period when using Florikan Top-dress fertilizer (12N-6P-8K). Measurements from both optical sensors revealed that
J. brandegeana was not able to effectively assimilate N when fertilizer rate was greatest (50 g). Rather, the 40 g treatment maintained large values (NDVI and SPAD) indicative of sufficient N presence throughout the experiment. The leaf total N was highest at 4 WAT, then began to taper off over time (
Table 4). Leaf total N was correlated (
p ≤ 0.05 and
p ≤ 0.01) with NDVI and SPAD throughout the experiment at 4, 8, and 12 WAT, with the exception of NDVI at the last sampling time (
Table 2). These results imply that generally, SPAD and NDVI via GreenSeeker
TM can be used as reliable tools to determine leaf N in
J. brandegeana. The non-destructive optical sensors are most effective in estimating leaf total N concentration at 4 weeks after fertilizer treatment (
p ≤ 0.01) (
Table 2). At 12 WAT, the leaf total N results were nearly the same between the 20 g, 30 g, and 40 g fertilizer treatments indicating that any of these fertilization rates are suitable for the successful growth of
J. brandegeana. The C:N ratio results (
Table 5) coincide with the leaf N and SPAD/NDVI results.
These results specify that nursery growers can significantly reduce their fertilizer input without altering plant growth and salable characteristics. This is beneficial economically and environmentally, as not all N applied to crops is taken up by plants. Nitrogen is often lost by leaching into water resources and volatilization into the atmosphere [
38]. Nutrient pollution issues have arisen within the last 70 years and will continue if sustainable practices are not properly executed [
39]. The application of optical sensor technology in large production systems can allow for spot treatment of plants in need of fertilizer, rather than applying unnecessary amounts to each individual pot. Moreover, NO
3− leaching occurred heavily at the beginning of the experiment, soon after the fertilizer was applied (
Table 6). At 4 WAT, the 10 g fertilizer rate had leached significantly less NO
3− (
p ≤ 0.05 and
p ≤ 0.01) than the other treatments and continuously performed well, displaying the least leached NO
3− over time. While the 10 g treatment did show the least amount of leaching, the 20 g and 30 g fertilizer rates were not significantly different from the 10 g treatment except for the first sampling time. The 20 g and 30 g treatments did prove to be more effective than the 10 g treatment regarding leaf total N concentration. All results considered, the 20 and 30 g fertilizer rates were similar and, in some cases, showed greater sensor readings than the 40 and 50 g fertilizer rates. The NO
3− leachate analysis from the 20 g and 30 g treatments rates were significantly (
p ≤ 0.05 and
p ≤ 0.01) less than the higher fertilizer rates in some cases at 8, 10, and 12 WAT. Total P leachate was also correlated to N application rate and leaf tissue total N at all three sampling times, and NDVI readings for 4 and 8 WAT sampling times (
Table 2). This implies that GreenSeeker
TM may be used as a tool to infer relationships between total N and P. Additionally, optical sensors can be recommended to determine appropriate times for fertilizer supplements. GreenSeeker
TM and SPAD meter both showed positive correlation (
p ≤ 0.05 and
p ≤ 0.01) with N rates. Both optical sensors can be used as guidelines when establishing a fertilization regime, though further analysis of tissue samples and leachate are necessary to differentiate treatments in greater detail.


