Article

Cover Crop Influence on Soil Enzymes and Selected Chemical Parameters for a Claypan Corn–Soybean Rotation

1
School of Natural Resources, 302 Anheuser-Busch Natural Resources Building, University of Missouri-Columbia, Columbia, MO 65211, USA
2
The Center for Agroforestry, 203 Anheuser-Busch Natural Resources Building, University of Missouri-Columbia, Columbia, MO 65211, USA
3
USDA-ARS Cropping Systems and Water Quality Research Unit, Columbia, MO 65211, USA
*
Author to whom correspondence should be addressed.
Submission received: 15 May 2019 / Revised: 6 June 2019 / Accepted: 11 June 2019 / Published: 15 June 2019

Abstract

:
Cover crops (CC) improve soil quality, including soil microbial enzymatic activities and soil chemical parameters. Scientific studies conducted in research centers have shown positive effects of CC on soil enzymatic activities; however, studies conducted in farmer fields are lacking in the literature. The objective of this study was to quantify CC effects on soil microbial enzymatic activities (β-glucosidase, β-glucosaminidase, fluorescein diacetate hydrolase, and dehydrogenase) under a corn (Zea mays L.)–soybean (Glycine max (L.) Merr.) rotation. The study was conducted in 2016 and 2018 in Chariton County, Missouri, where CC were first established in 2012. All tested soil enzyme levels were significantly different between 2016 and 2018, irrespective of CC and no cover crop (NCC) treatments. In CC treatment, β-glucosaminidase activity was significantly greater at 0–10 cm depth in 2016 and at 10–20 and 20–30 cm in 2018. In contrast, dehydrogenase activity was significantly greater in NCC in 2018. Soil pH and organic matter (OM) content were found to be significantly greater in CC. Overall, CC have mixed effects on soil enzyme activities and positive effects on soil OM compared to NCC. This study highlights the short-term influence of CC and illustrates the high spatial and temporal variability of soil enzymes under farmer-managed fields.

1. Introduction

One of the major driving forces of environmental degradation, which has impacted both soil and water resources, is intensive agricultural practices [1,2]. The use of cover crops (CC) is receiving increased attention for mitigating such environmental problems, in addition to providing yield and economic benefits to farming lands [3]. The potential contribution of CC to soil fertility and improved crop performance has made CC a viable option for sustainable agriculture [4]. Cover crops play an important role in improving the physical, chemical, and biological properties of soil [5,6]. This includes improving soil organic matter content and characteristics, and thus overall soil quality [7], as well as reducing greenhouse gas emissions from agricultural ecosystems by enhancing C sequestration [8,9].
Integration of CC into standard crop rotations can considerably increase soil microbial biomass [10,11], as well as microbial enzymatic activity [12]. Cover crops can increase soil β-D-glucosaminidase and β-glucosidase activity; however, the effects are not consistent spatially or temporally [13]. A study conducted by Bandick and Dick [14] in Aurora, Oregon, showed that α-glucosidase, β-glucosidase, α-galactosidase, β-galactosidase, amidase, arylsulfatase, deaminase, fluorescein diacetate (FDA) hydrolase, invertase, cellulase and urease activities were greater in vegetable crop rotation systems with CC or organic residues compared to fields without organic amendments. Additionally, consistent increases in β-glucosidase (40%) and endocellulase (30%) activities have also been observed in fields with winter CC, mulching straw, or high organic matter content [15]. In Debosz et al. study, the increase in microbial biomass C concentration and cellobiohydrolase activity varied between 0–60% and 24–92%, respectively. These direct and CC-induced positive changes have been attributed to improvements in soil biological properties, such as soil C, microbial populations, and enzyme activities [6,10,14].
A range of soil quality indicators are positively correlated with soil enzyme activities and labile soil organic matter fractions [16]. Thus, soil enzymes and their activities can be used as indicators for identifying CC effects on soil quality. Udawatta et al. [17] reported that β-glucosidase, β-glucosaminidase, FDA, and dehydrogenase activities were good indicators of soil biogeochemical processes. Specifically, β-glucosidase enzymes catalyze the degradation of cellulose, a major component in plant biomass [16,18], while β-glucosaminidase enzymes catalyze the degradation of chitobiose and higher proteins and also control microbial nitrogen acquisition [17,19,20]. Fluorescein diacetate hydrolysis mediates the decomposition of a broad range of compounds, such as proteins, lipids, and complex organic compounds [21], and dehydrogenase is involved in decomposition of various organic materials and in mediating microbial oxidative activities [16,22].
Soil microbial enzymes are considered good indicators of soil quality due to their immediate response to changes in soil management and ease of measurement [2,23,24]. Soil microbial enzyme activities provide quantitative information on soil chemical processes, such as organic matter decomposition and soil nutrient mineralization rates [17], and are also considered early soil quality improvement indicators [16,25].
VeVerka et al. [26] emphasized the importance of long-term CC studies to quantify changes in soil enzymes and soil quality parameters. Their study, conducted at the same site as the current study, showed no difference in β-glucosidase, β-glucosaminidase, dehydrogenase and FDA activities between CC and no CC (NCC) treatments during the first two years of CC establishment. However, they suggested that CC effects could be identifiable with time. The literature also lacks information on CC effects on soil quality for highly eroded land, including Missouri claypan soils. The current study was unique as it was conducted on a farmer-operated site with highly eroded claypan soils using two years of data (2016 and 2018), representing four and six years following initial CC establishment. The objective of this study was to evaluate the differences in soil quality parameters—specifically microbial enzyme activities, pH, and soil organic matter—in response to CC management and soil depth for a corn (Zea mays L.)–soybean (Glycine max [L.] Merr.) rotation after four and six years of continuous CC management.

2. Materials and Methods

The study was conducted at the Chariton County Cover Crop Soil Health (CCSH) Research and Demonstration Farm in north central Missouri (39°50′ N, and 92°72′ W), United States, in 2016 and 2018. The 30-year mean precipitation of the area is 1026 mm and the average snow fall is 282 mm [27]. The mean annual temperature of the area is 11.7 °C with an average monthly minimum value of −7.4 °C in January and average monthly maximum of 29.9 °C in July. Soils of the study site were Armstrong loam (classified as fine, smectitic, and mesic Aquertic Hapludalfs) on 5–9% slopes.
The study design consisted of two treatments: Fall/winter CC with a corn–soybean rotation and NCC with a corn–soybean rotation. No-till management for CC and vertical tillage (Turbo Max) for NCC was practiced. The CC mix consisted of a cereal mixture with winter barley (Hordeum vulgare L.), winter cereal rye (Secale cereale L.), winter triticale (Triticosecale Wittm. Ex A. Camus), and winter oat (Avena sativa L.).
Soil samples from 0–10 cm (first), 10–20 cm (second) and 20–30 cm (third) depths were collected on 22 April 2016 and 15 May 2018 at CC flowering stage. The selected sampling dates allowed maximum expression of CC growth. Samples were collected representing three landscape positions: Summit, back slope, and foot slope in six replicates per landscape positions per CC or NCC treatment. Soils were transported and stored at 4 °C until processing.
Determination of β-glucosidase, β-glucosaminidase, FDA, and dehydrogenase enzyme activities was conducted in the United States Department of Agriculture-Agricultural Research Service (USDA-ARS) Soil Health Research Laboratory located at the University of Missouri, Columbia, USA, according to the methods adapted from Dick [28] (Table 1). Soil samples were analyzed for percent organic matter (%OM) by the loss-on-ignition (LOI) method [29] and soil pH was determined by the salt (0.01 M CaCl2) method at a 1:1 ratio.
The effects of treatment (CC vs. NCC), landscape position, soil depth, and sampling time (year) on microbial enzyme activities, soil pH, and %OM were assessed using the general linear model (GLM) procedure and analysis of variance (ANOVA). Duncan’s least significant difference (DLSD) test was used for identifying significant differences between the tested parameters at p < 0.05 level [30].

3. Results and Discussion

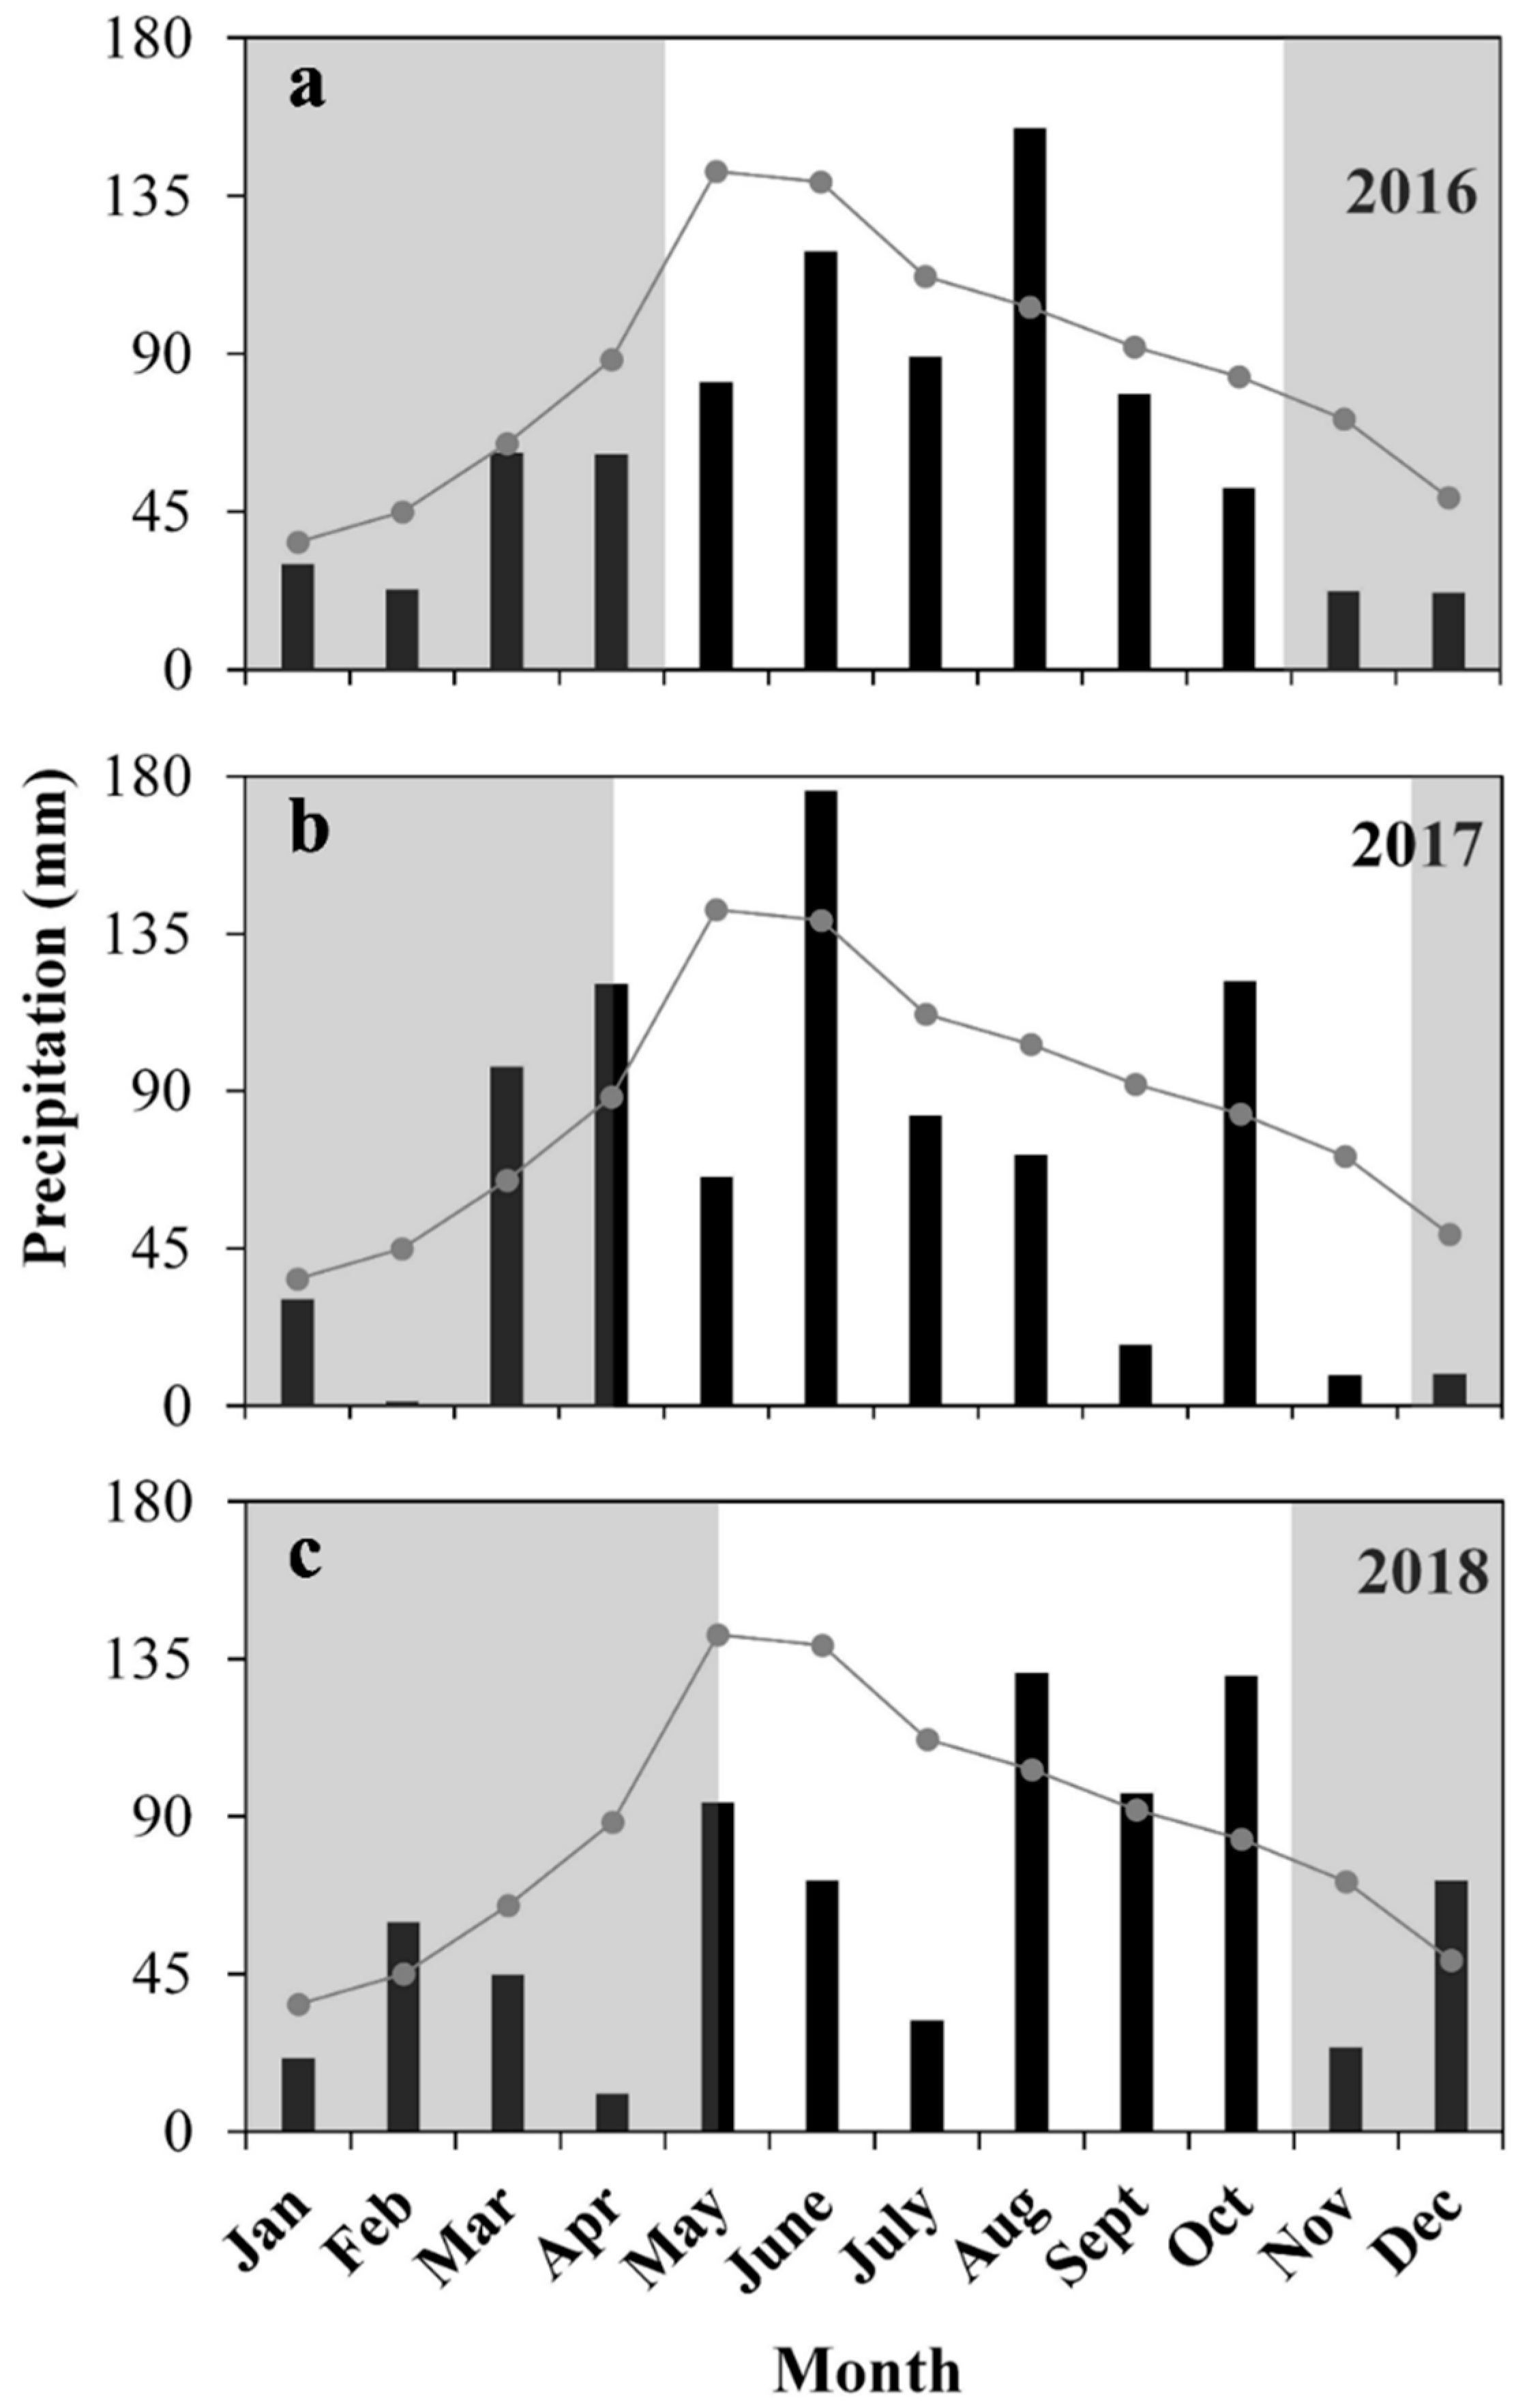
3.1. Weather Conditions and Soil Sampling

Annual rainfall in 2016, 2017, and 2018 was 22%, 22%, and 24% below the normal 30-year average of 1026 mm (Figure 1). Specifically, during the cropping periods, rainfall amounts were 15%, 33% and 31% below normal for those years. The study site received 55 mm of rain from mid-March to mid-April before sampling in 2016. In 2018, the soil was sampled in May and the study site received 91 mm of rain from mid-April to Mid-May, resulting in relatively wet conditions prior to soil sampling in 2018 compared to 2016.

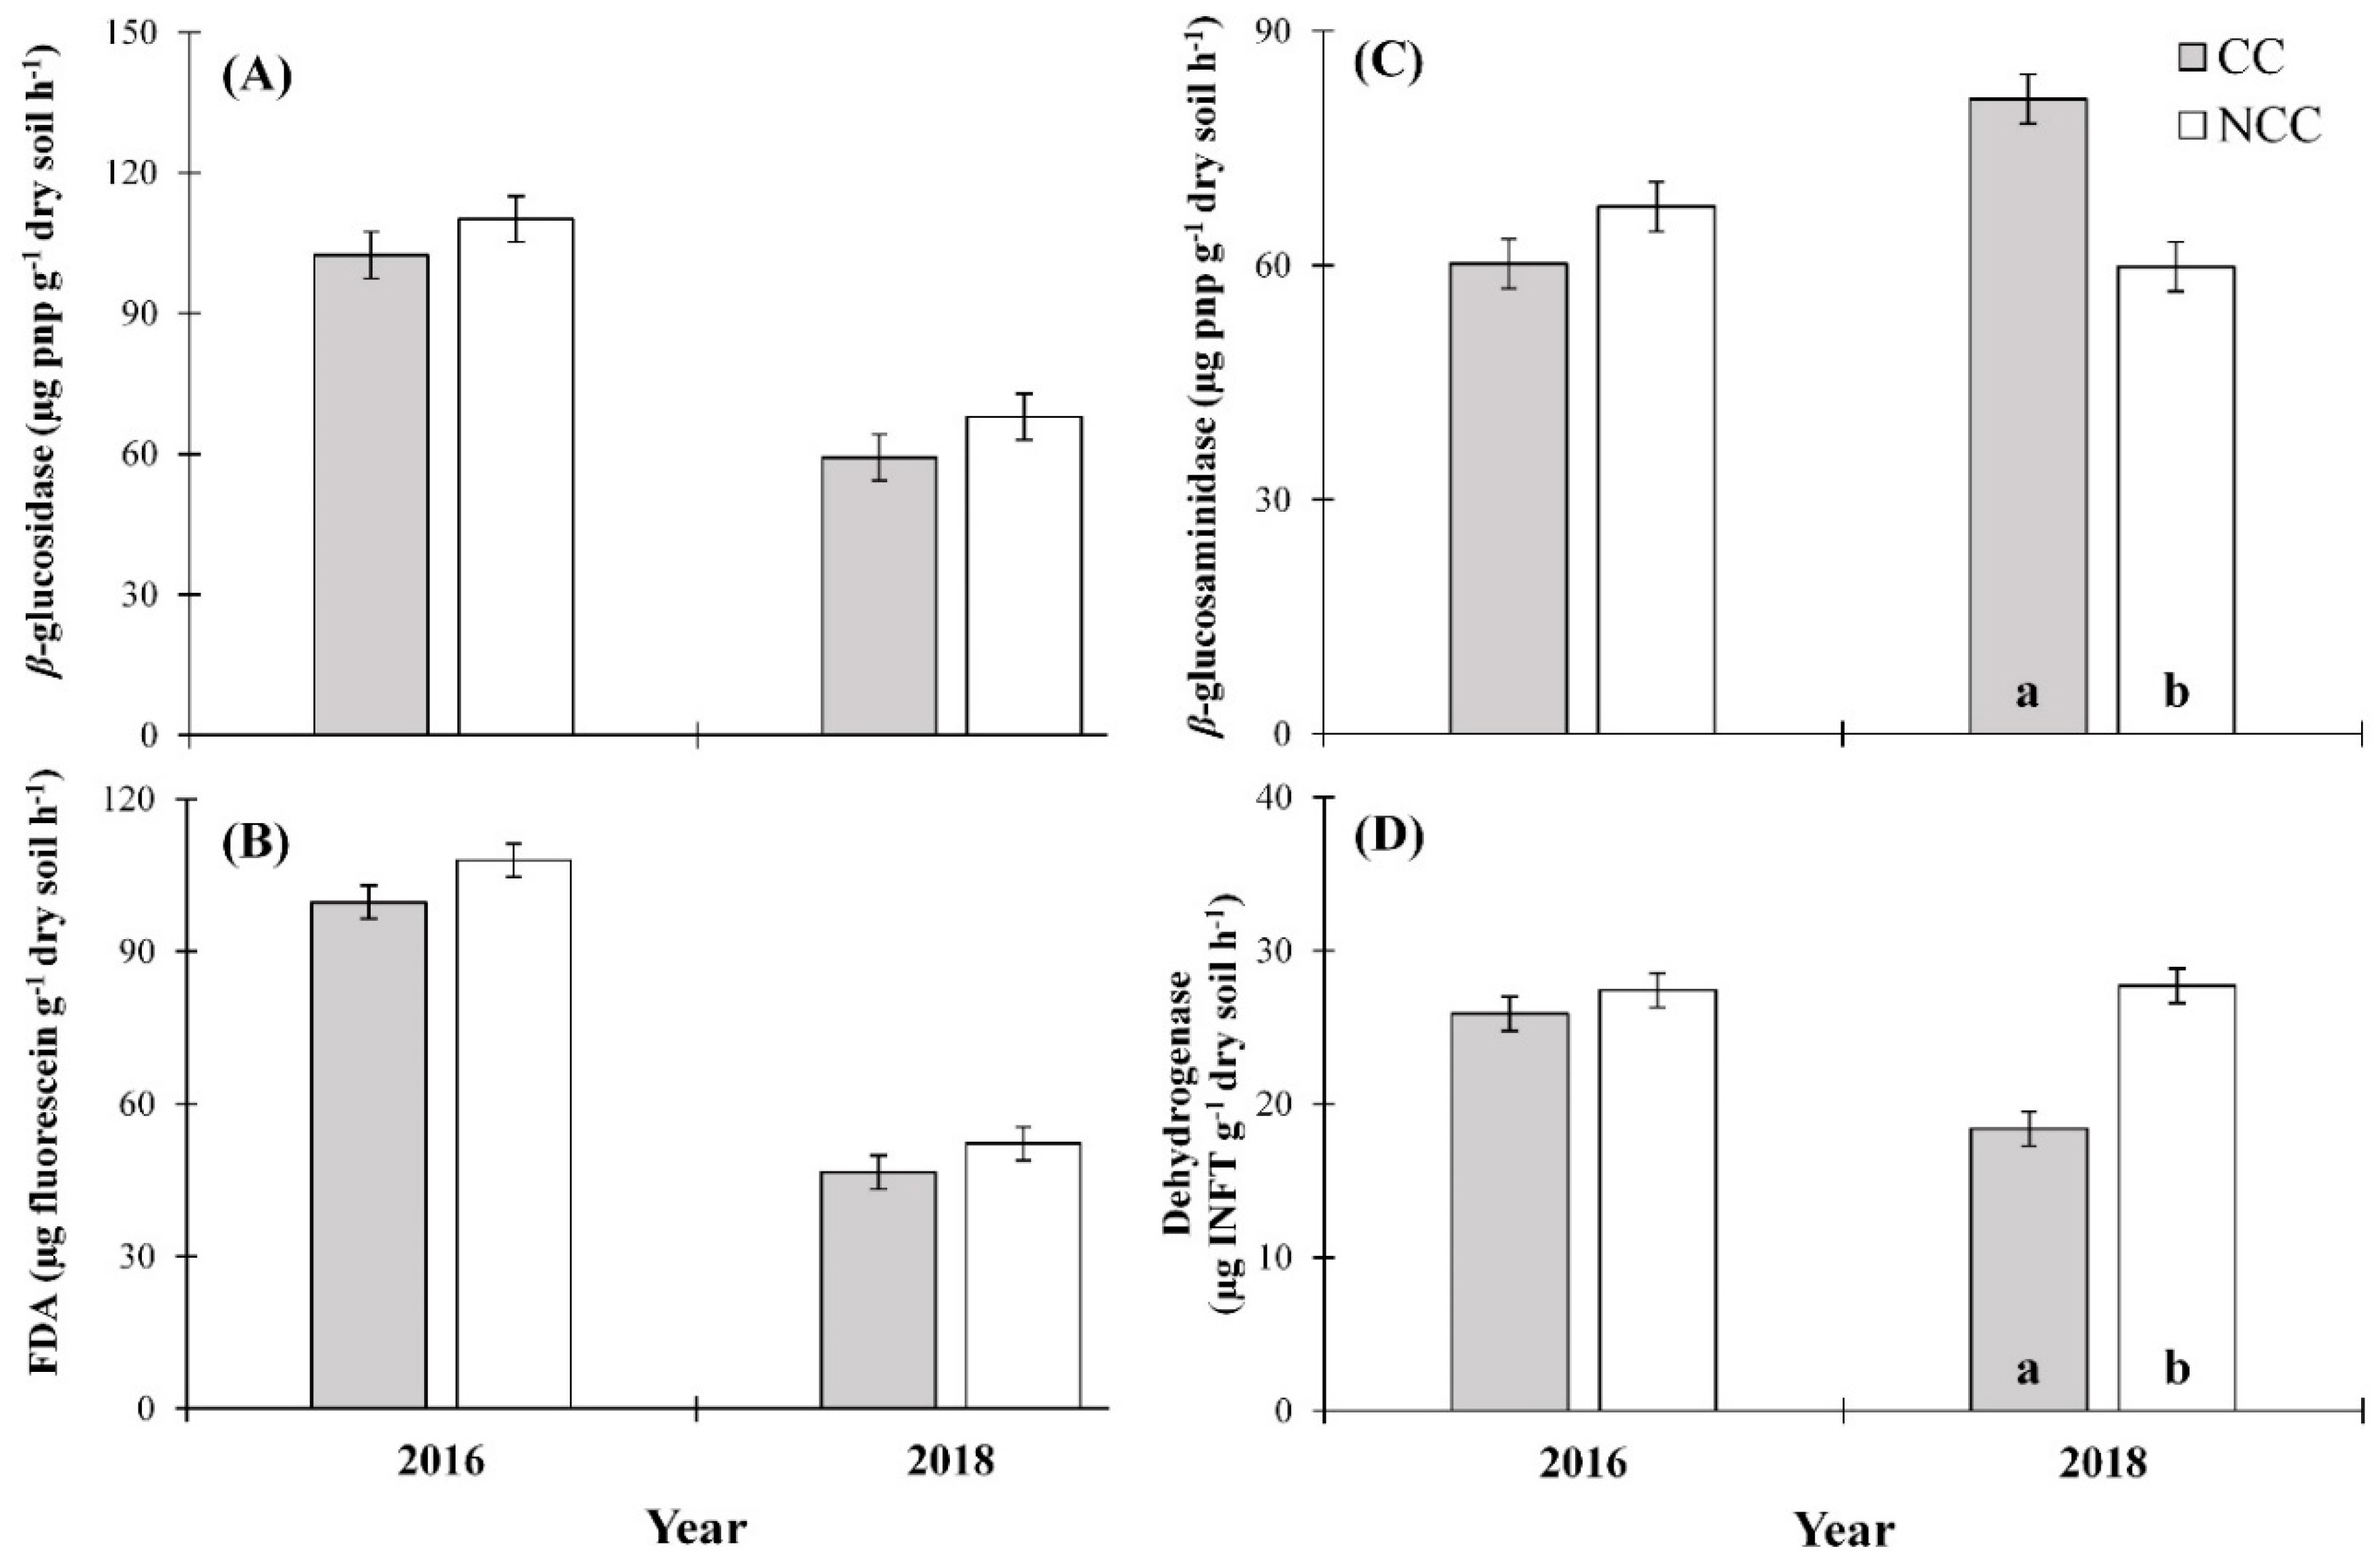
3.2. Cover Crop Effects with Time on Enzyme Activities

In 2014, two years after the initial CC establishment, VeVerka et al. [26] reported β-glucosidase levels in the range of 35–105 µg pnp g−1 dry soil h−1 under CC treatment at the same study site. In 2018, our study found the upper limit of the range had increased, with β-glucosidase levels ranging from 35 to 145 µg pnp g−1 dry soil h−1, which was six years after the initial CC establishment. Similarly, dehydrogenase levels changed from 8.5–16 µg TPF g−1 dry soil h−1 in 2014 to 10–40 µg INFT g−1 dry soil h−1 in 2018. However, the enzyme β-glucosaminidase did not show such differences from 2014 to 2018. In our study, β-glucosidase and FDA enzyme levels in 2016 were significantly greater in both CC and NCC treatments compared to 2018. In fact, the β-glucosidase level in 2016 was 1.7 times greater under CC and 1.6 times greater under NCC compared to 2018 (Figure 2A), while the FDA level in 2016 was 2.1 times greater under CC and 2.0 times greater under NCC compared to 2018 (Figure 2B). The dehydrogenase level in 2016 was 1.4 times greater in CC compared to 2018; however, no difference between 2016 and 2018 was found under NCC. In contrast, the β-glucosaminidase level in 2018 was 1.3 times greater in CC treatment compared to 2016, and in NCC, 1.1 times lower. Similarly, Mendes et al. [31] reported significant differences in β-glucosidase and FDA levels between 1995 and 1996 regardless of the treatments in a study conducted to identify winter cover crop effects on soil microbial activities. Relatively wet conditions in 2018 may have reduced overall enzyme activities in our study regardless of the treatment. It has been reported that irrigation and water management can change β-glucosidase, β-glucosaminidase and phosphodiesterase activities in cover crop–winter wheat and fallow–winter wheat rotations [32]. Soil microbial activities and soil water storage are purportedly negatively correlated, indicating the need for oxygen (O2) for aerobic respiration by microbes [26,33].
In 2018, β-glucosaminidase activity was significantly greater (p < 0.05) in CC treatment compared to NCC, wherein the CC treatment had 1.3 times higher β-glucosaminidase levels than NCC (Figure 2C). In contrast, the enzyme dehydrogenase showed significantly greater levels under NCC treatment compared to CC in 2018. However, the analysis did not show significant differences in β-glucosaminidase or dehydrogenase levels between treatments in 2016. There were no differences in β-glucosidase or FDA between CC and NCC treatments in 2016 or 2018. These enzymes decompose various organic materials [16,17,18,19,20,21,22] and higher accumulation of plant matter would presumably increase the activity of β-glucosaminidase and dehydrogenase. However, in our study, the similar enzyme activities in CC and NCC treatments imply the requirement of different plant materials to act as substrates for different microbial groups. Mbuthia et al. [34] found significantly higher rates of β-glucosaminidase in non-tilled CC treatment soil samples compared to tilled NCC treatment soil samples in a study conducted in Jackson, Tennessee. Nivelle et al. [35] reported differences in dehydrogenase levels due to tillage practices, but no significant difference due to CC treatment. In addition, VeVerka et al. [26] found no significant effects of CC and NCC on β-glucosidase, β-glucosaminidase, FDA, or dehydrogenase.

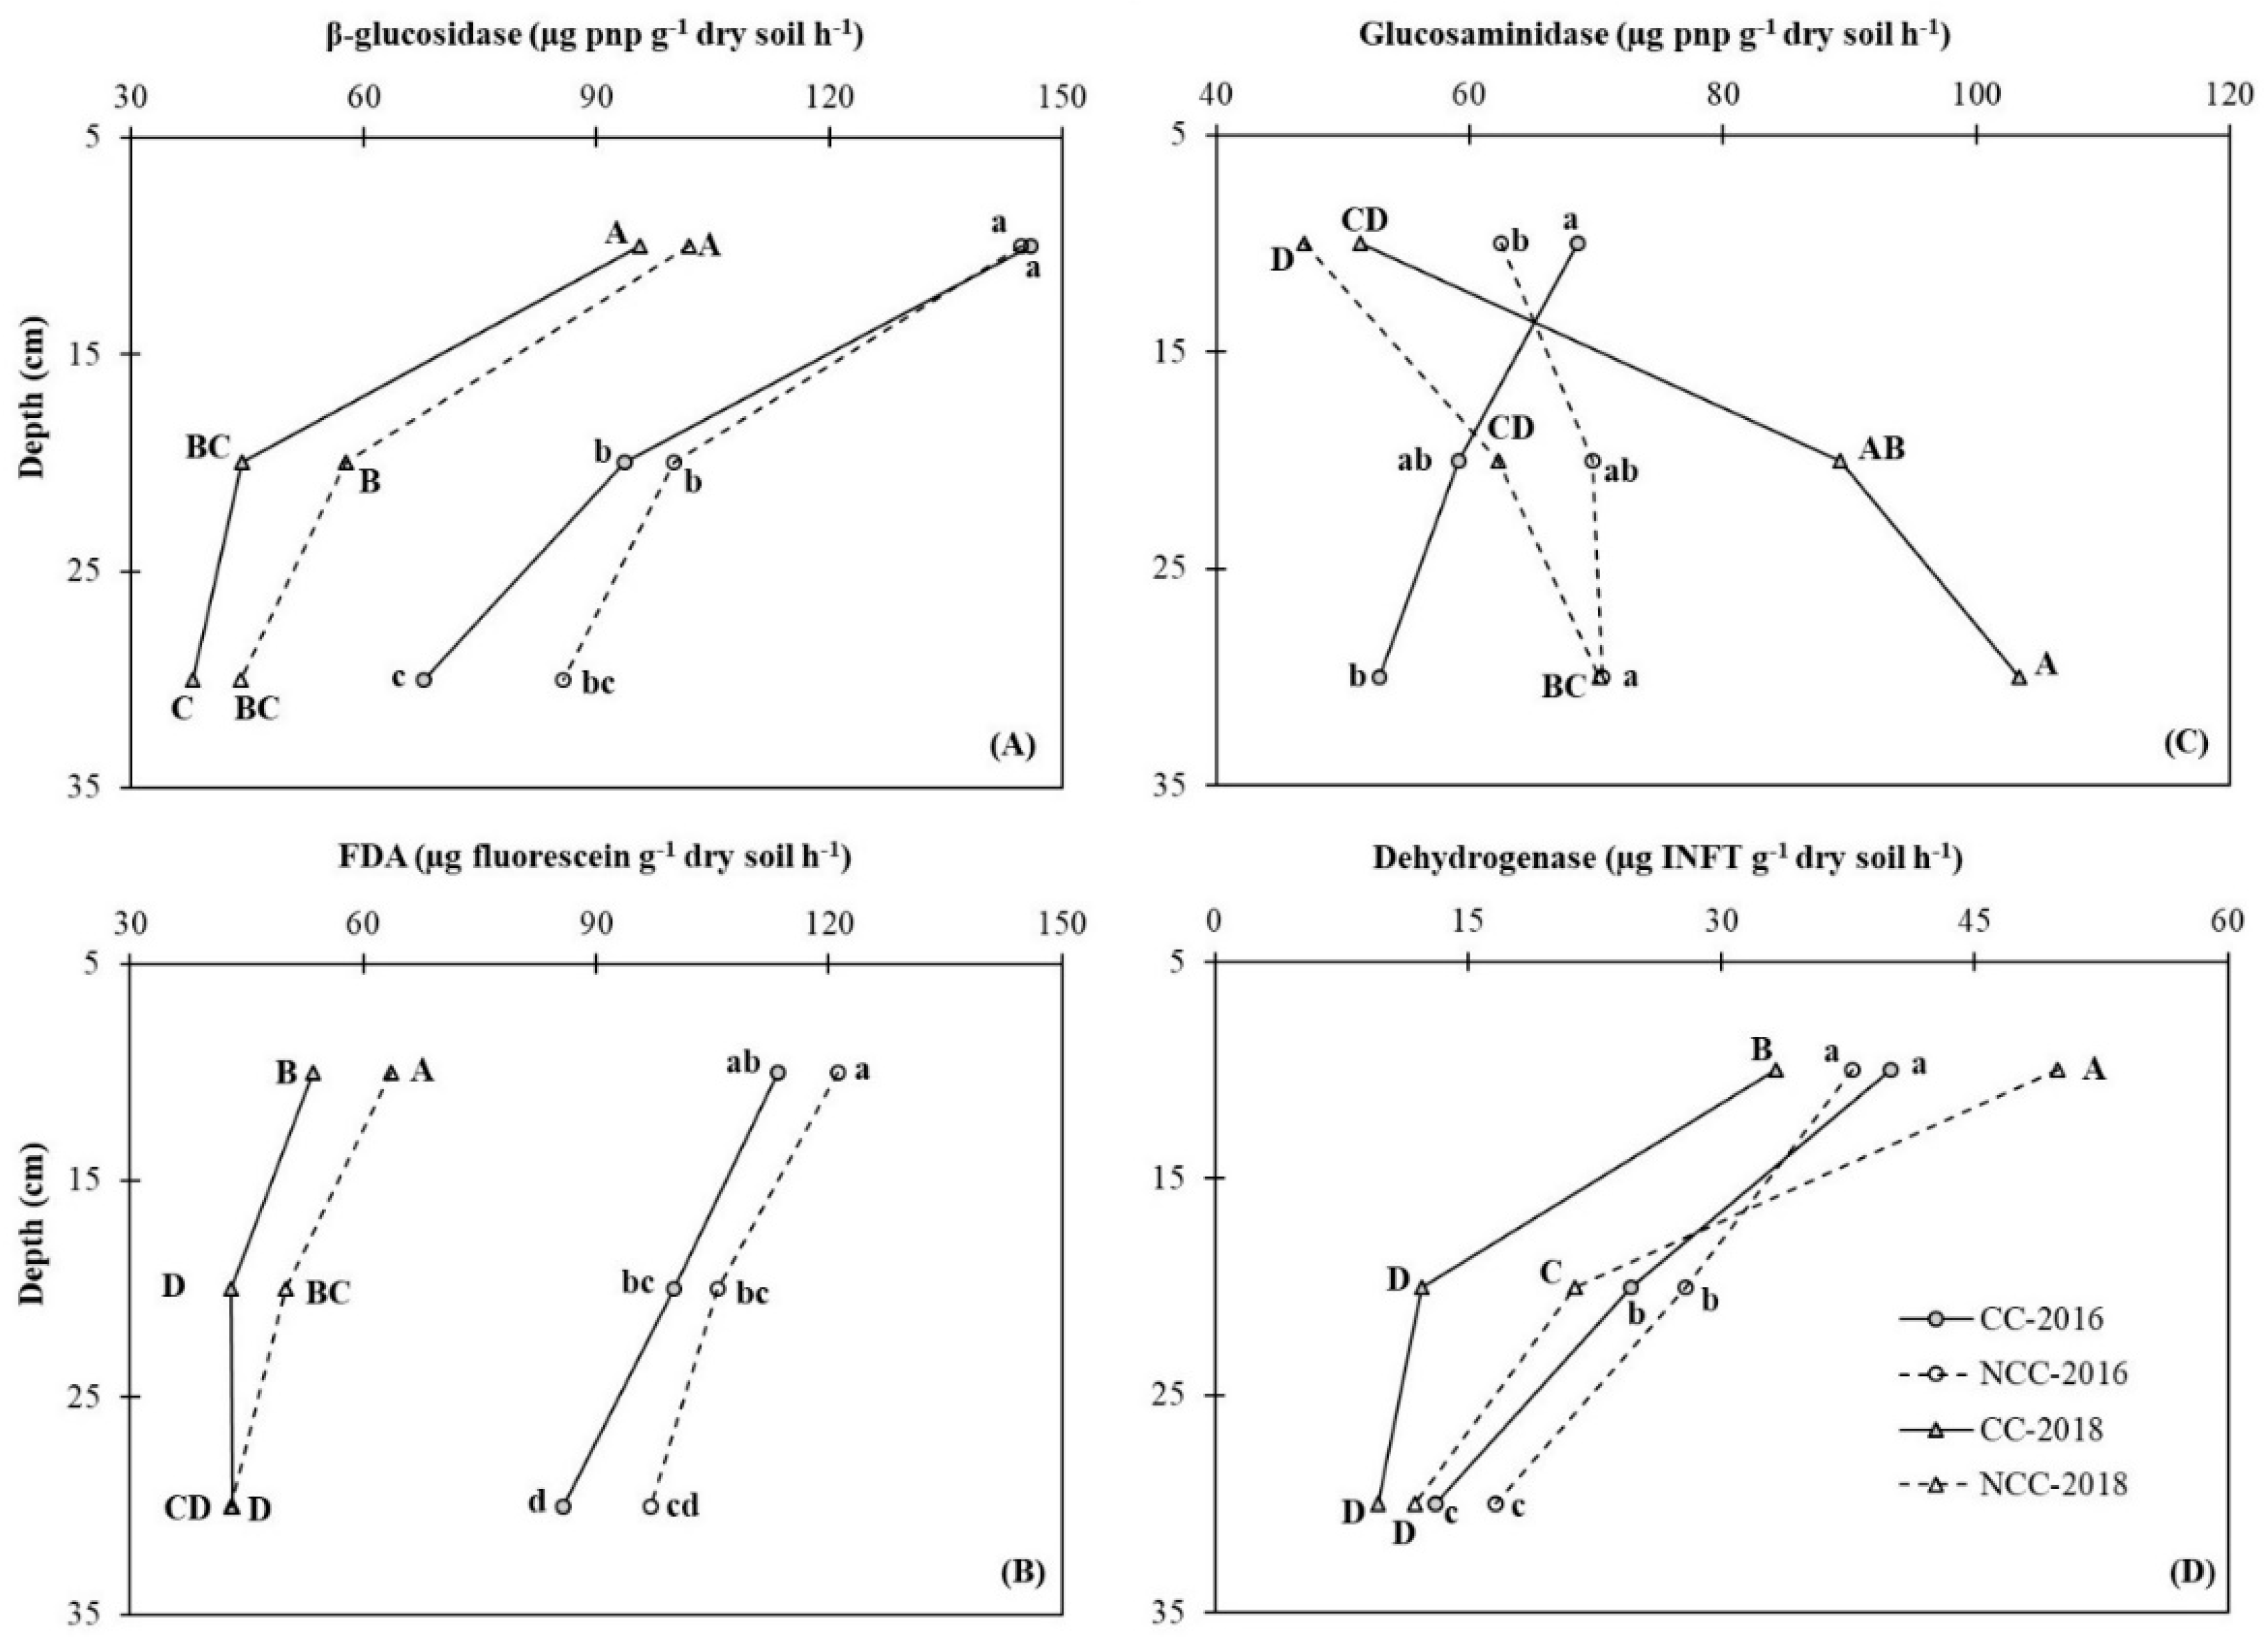
3.3. Variation of Enzyme Levels with Soil Depth

The β-glucosidase level significantly declined with increasing soil depth, both in 2016 and 2018 (Figure 3A). In 2016, the 0–10 cm soil depth revealed a 1.5 times greater β-glucosidase level compared to the 10–20 cm depth and 1.8 times compared to the 20–30 cm depth. In 2018, the 0–10 cm depth had a 1.9 times greater β-glucosidase level compared to 10–20 cm and 2.4 times greater compared to 20–30 cm. However, β-glucosidase levels did not show differences between CC and NCC treatments at 0–10, 10–20 or 20–30 cm soil depths in 2016 or 2018. Levels of the enzyme FDA also significantly declined with increasing soil depth in both 2016 and 2018 (Figure 3B). In 2016, the first (0–10 cm) and third (20–30 cm) soil depths had FDA levels of 121 and 86 µg fluorescein g−1 dry soil h−1, respectively, exhibiting a significant decline. This was reflected in the 2018 results, wherein the FDA levels again dropped significantly from 63 to 43 µg fluorescein g−1 dry soil h−1 for the first and third soil depths, respectively. Interestingly, in 2016, FDA levels did not show statistically significant differences between CC and NCC treatments at 0–10, 10–20 or 20–30 cm soil depths. However, in 2018, FDA levels were significantly greater at 0–10 and 10–20 cm soil depths in NCC compared to CC, with NCC having 10 µg fluorescein g−1 dry soil h−1 greater at 0–10 cm depth and 7 µg fluorescein g−1 dry soil h−1 at 10–20 cm. In contrast, β-glucosaminidase did not show a clear pattern with soil depth. The NCC treatment showed an increase in β-glucosaminidase with increasing soil depth from 0–10 cm to 20–30 cm in both years, while CC showed an increase with depth in 2018 and a reduction in 2016. VeVerka et al. [26] reported similar findings of significant increases (p < 0.01) in β-glucosaminidase activity with increasing soil depth. Further, in our study, β-glucosaminidase levels were significantly greater (9.7%) at 0–10 cm soil depth in CC compared to NCC in 2016; however, the difference was not significant in 2018 (Figure 3C). In contrast, β-glucosaminidase levels at 10–20 and 20–30 cm soil depths were significantly greater (1.4 and 1.5 times, respectively) in CC compared to NCC in 2018. Dehydrogenase levels also significantly declined with increasing soil depth, both in 2016 and 2018. The dehydrogenase level at 0–10 cm was 2.6 times greater compared to 20–30 cm in 2016 and 3.8 times greater in 2018. In 2018, dehydrogenase levels were significantly greater at 0–10 and 10–20 cm soil depths in NCC compared to CC. The differences were not significant in 2016 (Figure 3D). Other studies also have reported decreased enzymatic activities (arylsulphatase, β-glucosidase, phosphomonoesterases, urease, dehydrogenase, FDA hydrolysis, α-glucosidase, β-xylosidase, cellobiohydrolase) with increasing soil depth [36,37]. The influence of a changing soil environment with increasing soil depth reduces the abundance, composition and functions of soil microbes [36]. An increase in clay content with soil depth in claypan soils decreases porosity and organic matter content, thereby decreasing aeration [26]. This, in turn, reduces the microbial population density and leads to lower soil enzyme concentrations with increasing soil depth. Also, compositional changes in microbes with increasing soil depth can change the types of soil enzymes secreted. This may also be a factor in the reported reduction in soil enzyme activities with increasing soil depth.

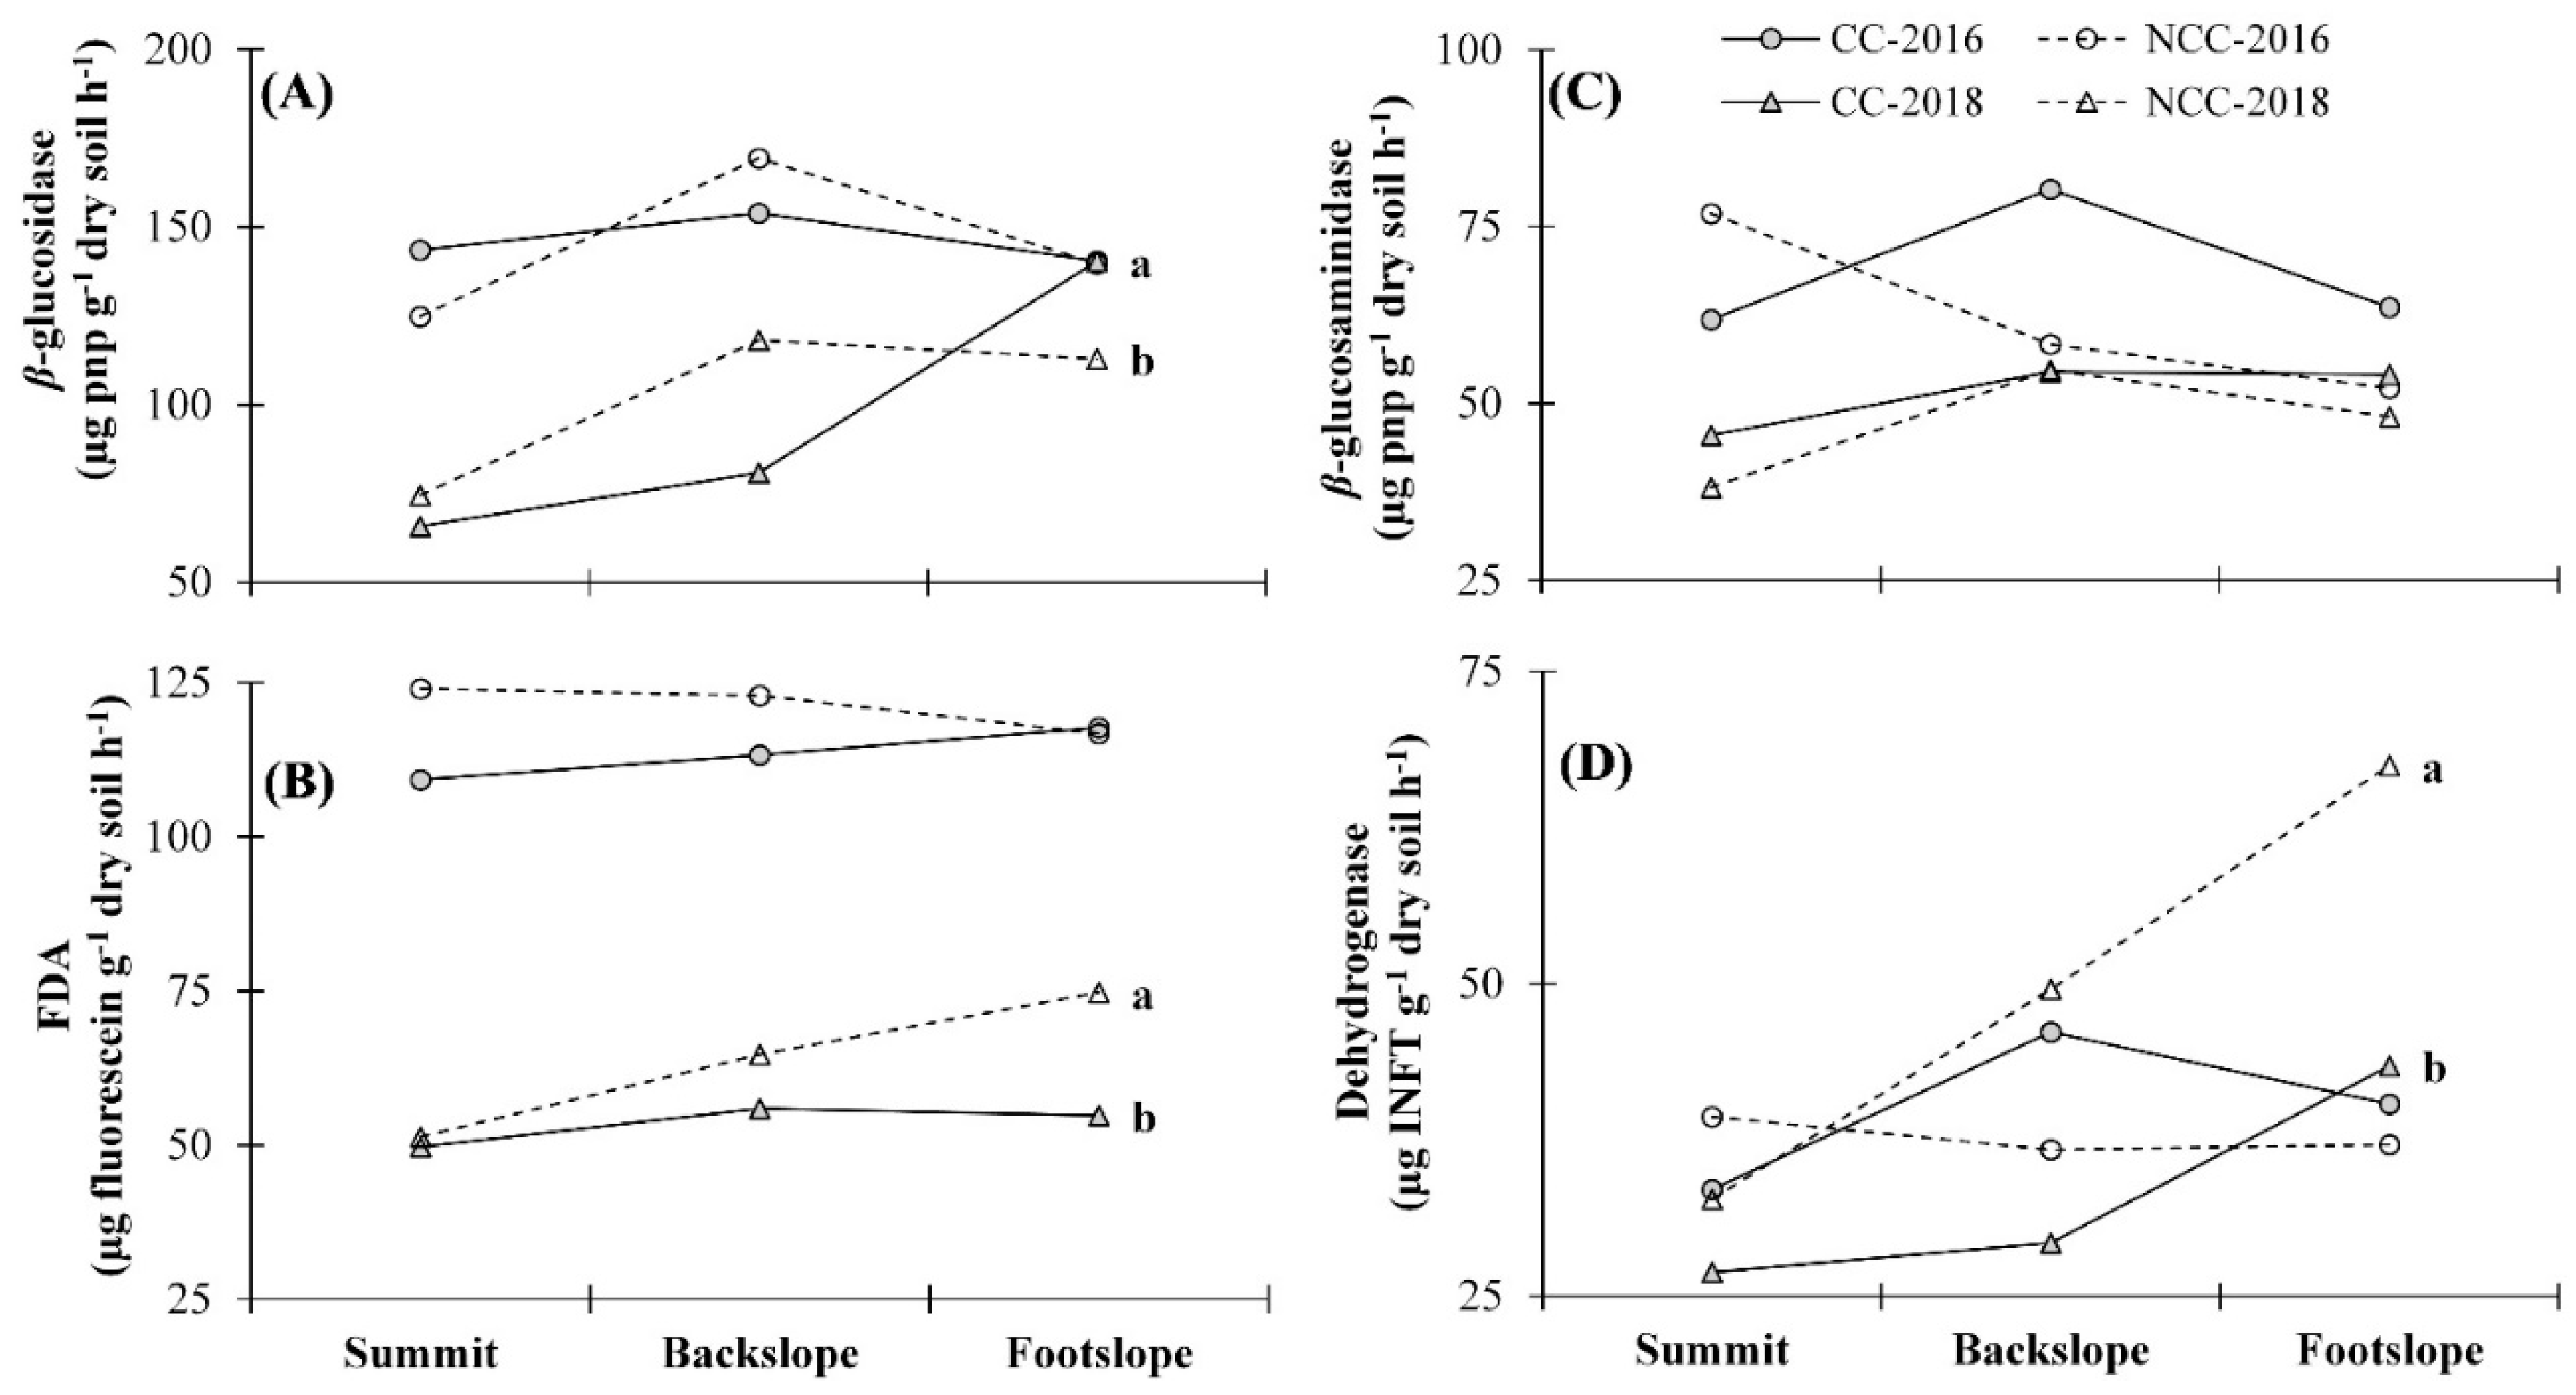
3.4. Variation of Enzyme Levels with Landscape Position

In 2016 at the first soil depth, the β-glucosidase level was significantly greater at the summit (1.9 times) and backslope positions (1.6 times) compared to 2018. At the footslope position, there was no difference between the two years. In 2018 at the first soil depth, the β-glucosidase level was significantly greater (24%) at the footslope site under CC treatment compared to NCC (Figure 4A). However, β-glucosidase at the first soil depth did not show significant differences between treatments at the summit or backslope positions in 2016 or 2018. Similarly, no significant differences were found between CC and NCC treatments for any landscape position at the second and third soil depths in 2016 or 2018. The FDA level at the first depth was significantly greater at the summit (3.4 times), backslope (2.9 times), and footslope (2.7 times) positions in 2016 compared to 2018. In 2018, the FDA level was significantly greater (36%) at the footslope site in NCC compared to CC. Dehydrogenase activity at the first soil depth did not show differences between the two years. However, in 2018, the dehydrogenase level was significantly greater (1.5 times) at the footslope position under NCC compared to CC. The differences between CC and NCC for dehydrogenase activity were not significant at other landscape positions. Finally, activity of the enzyme β-glucosaminidase was not different between treatments at any landscape position in 2016 or 2018.
Overall, the results did not show significant differences in the enzyme levels among landscape positions. Similar results were reported by VeVerka et al. [26] on the same study site. Several other studies have also shown that cover crops can affect β-glucosidase and β-glucosaminidase activities; however, the effects are not consistent across locations and landscape positions [13]. For example, Udawatta et al. [17] reported no significant effects of landscape on enzyme activities in a study conducted in a temperate agroforestry practice after eight years of establishment. Another study conducted in Ohio reported similar findings with no significant changes in soil enzyme activities in response to different landscape positions [38]. The authors of these reports suggested that the influence of landscape position may have been masked by other factors affecting enzyme activity, such as soil organic matter quantity and quality, litter quantity, soil moisture, exchangeable Ca, and other soil physicochemical differences.

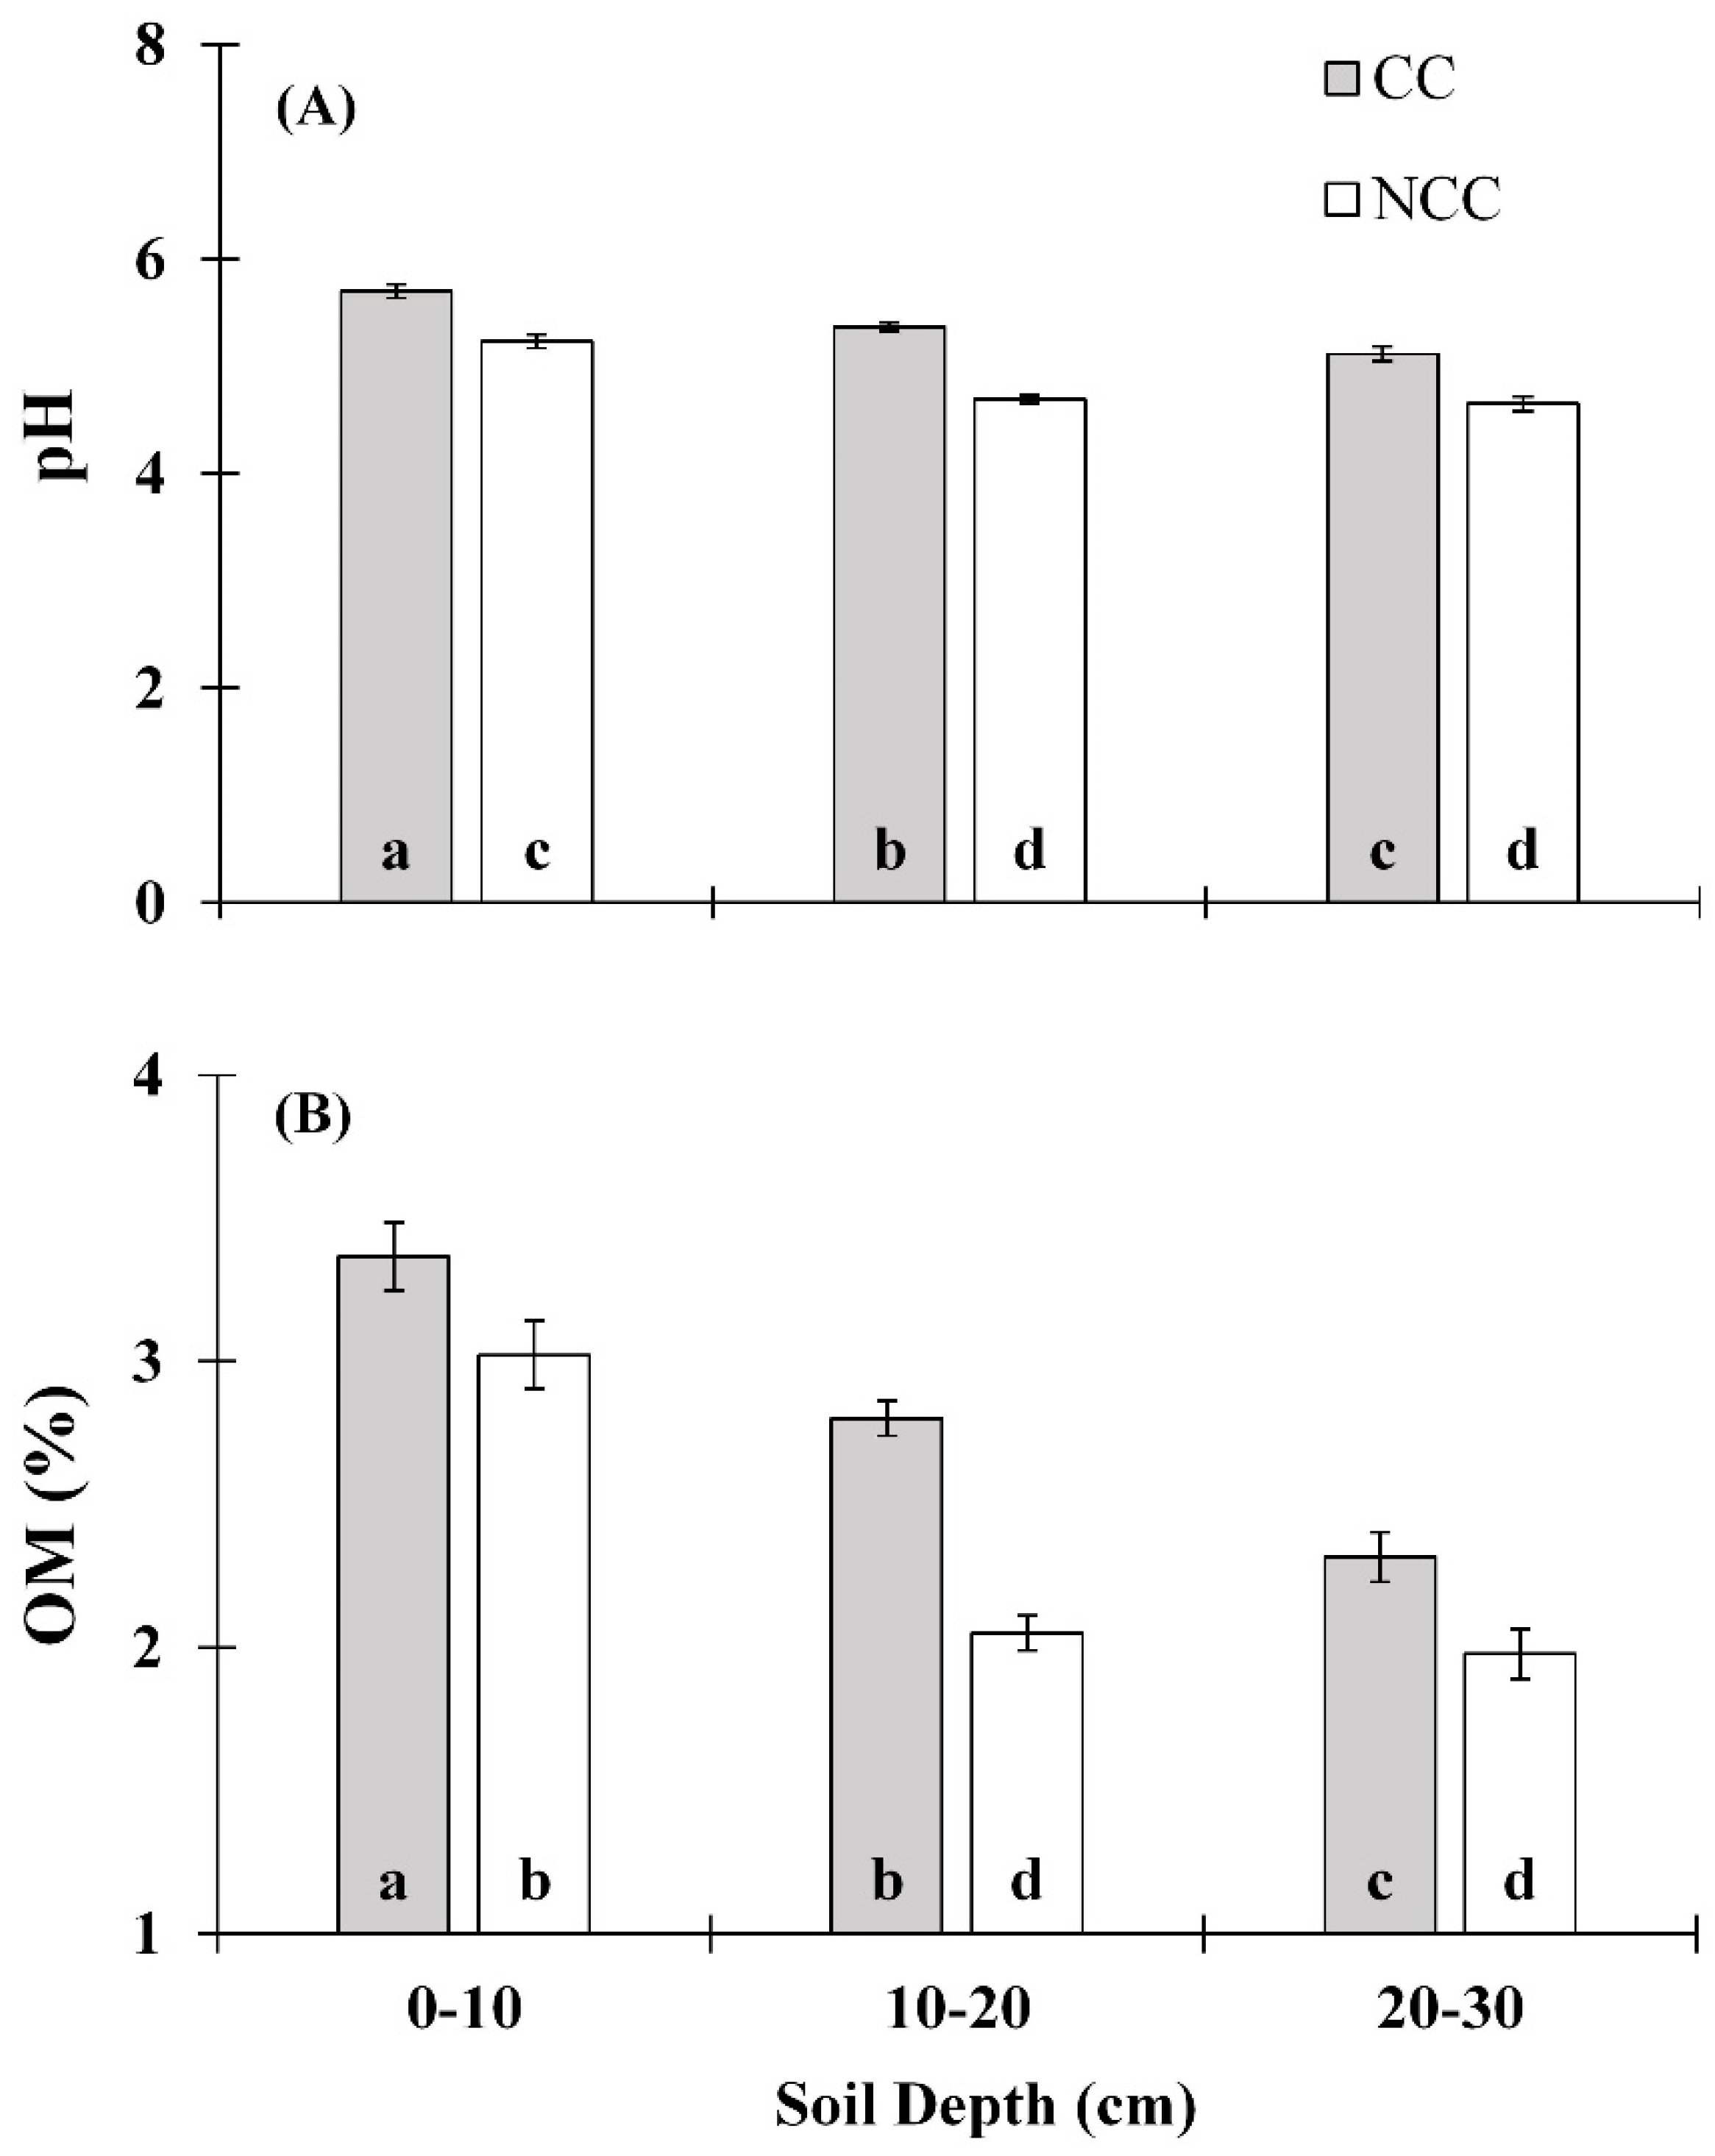
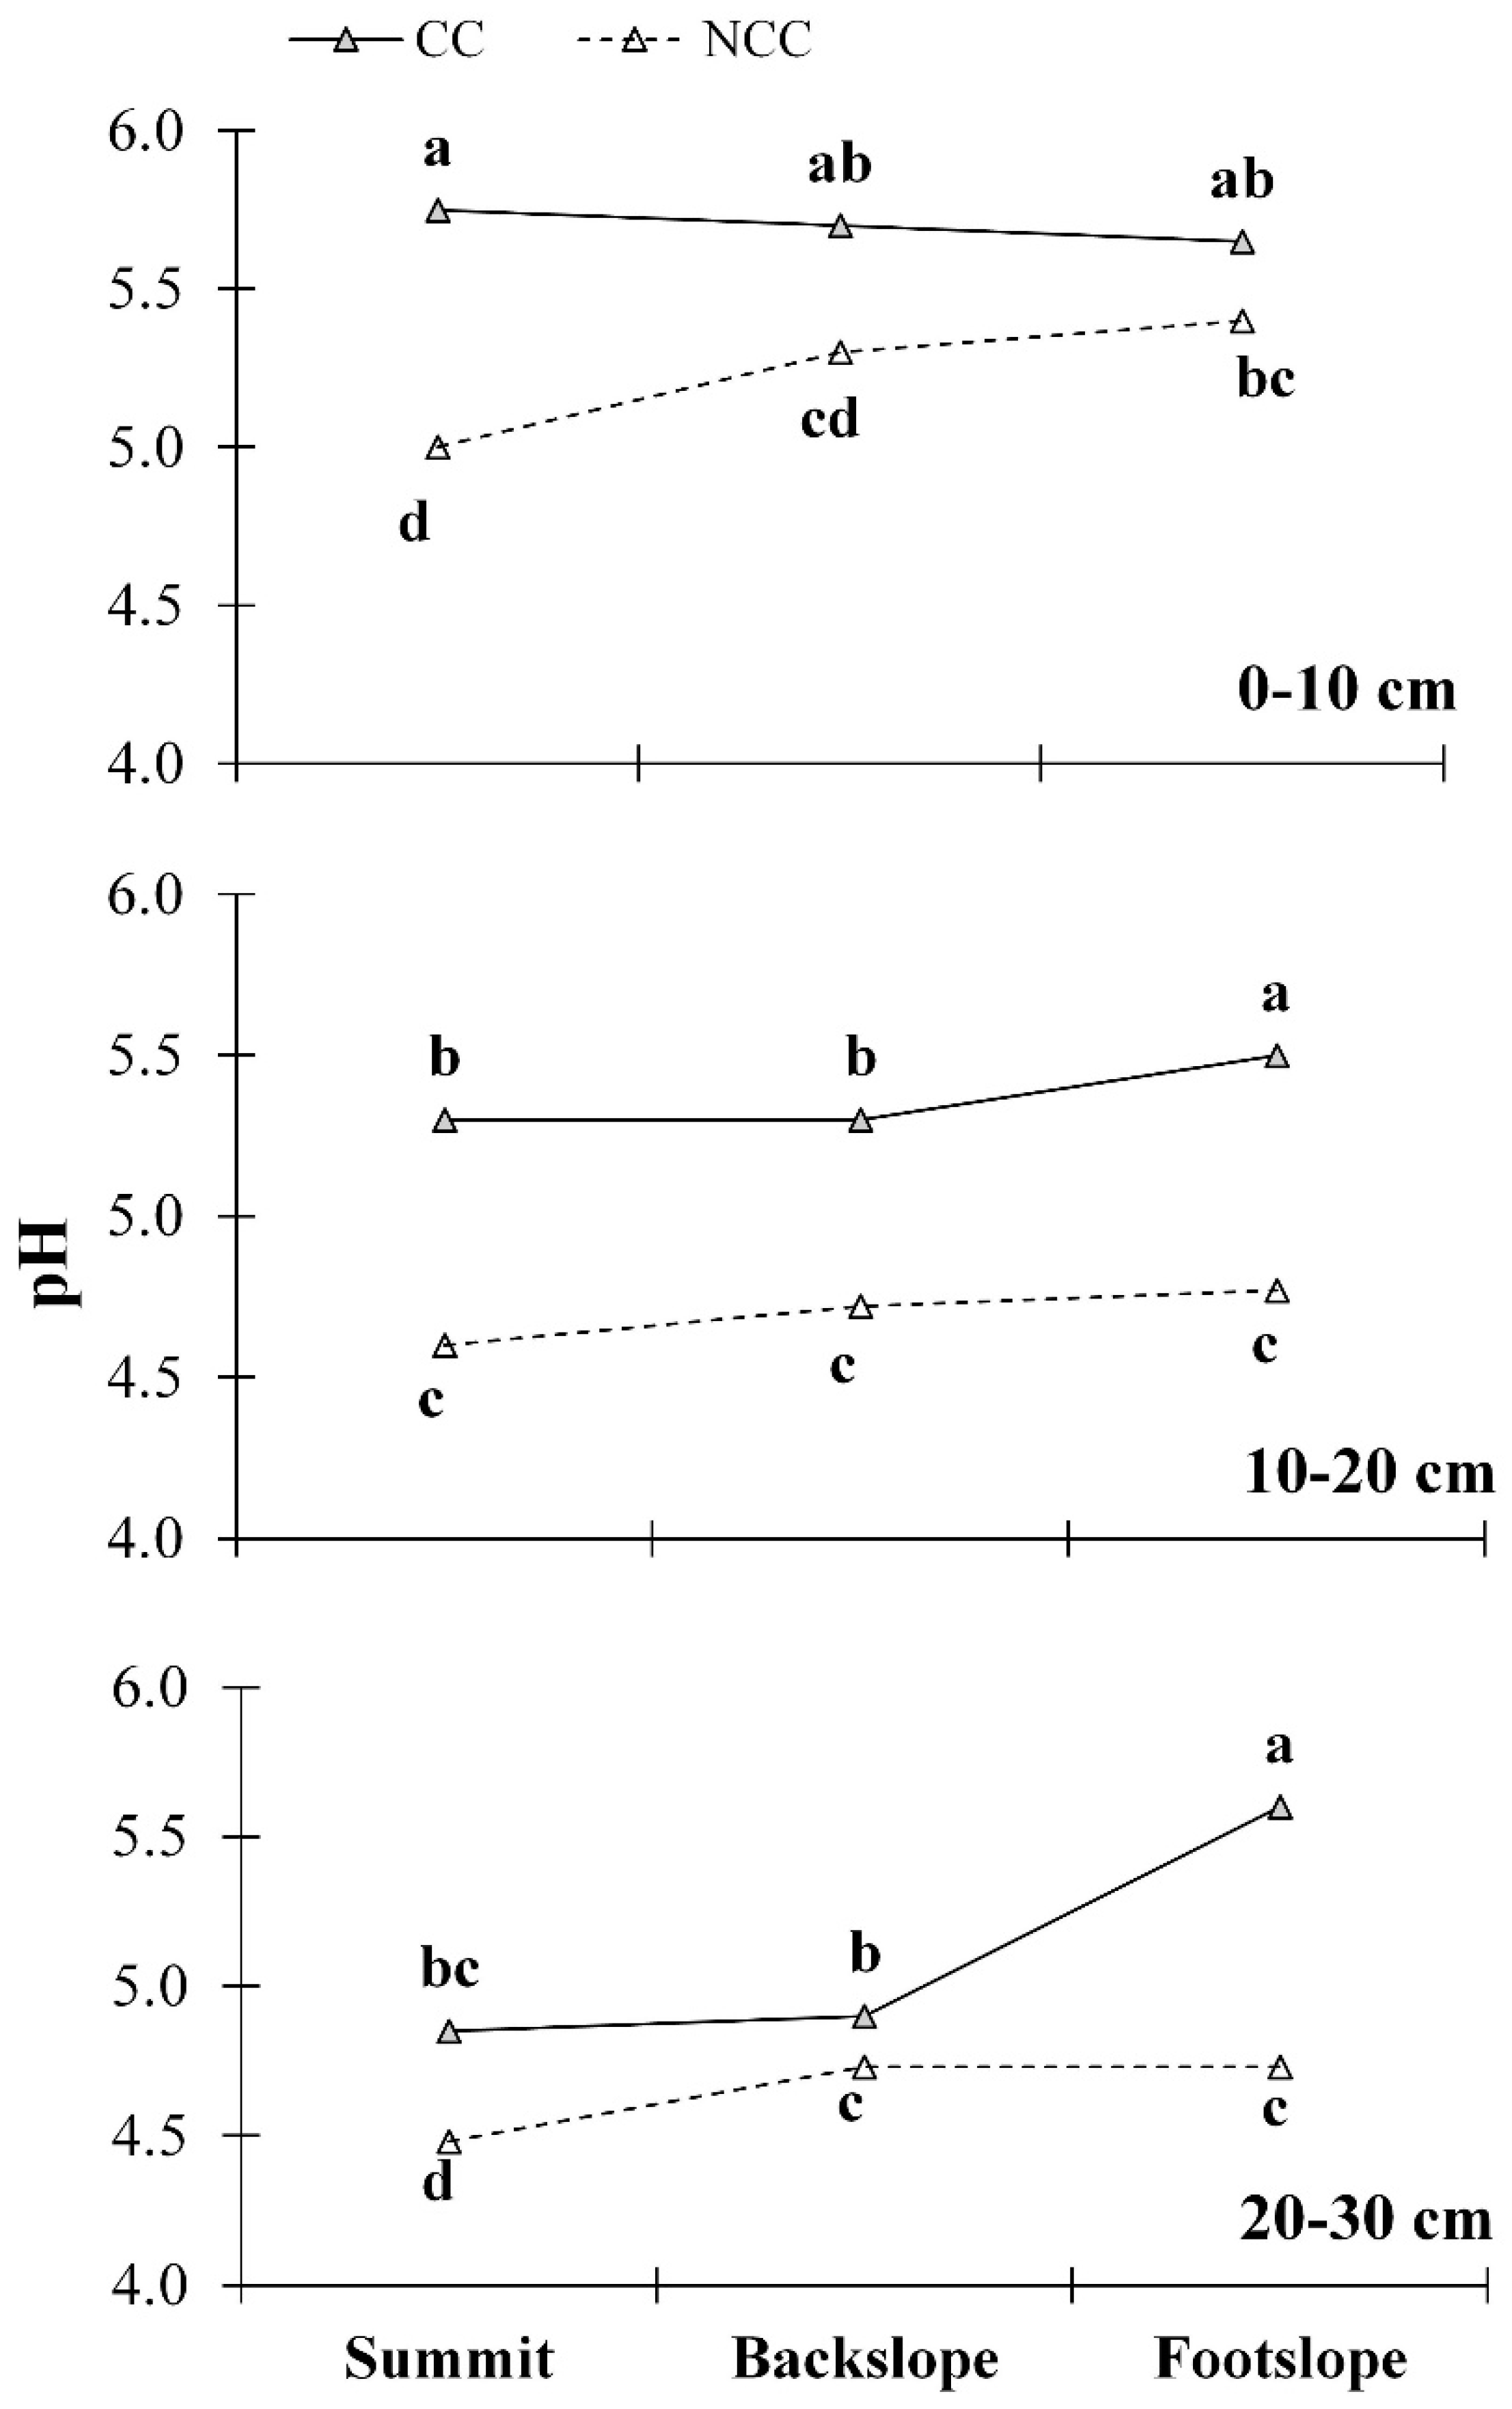
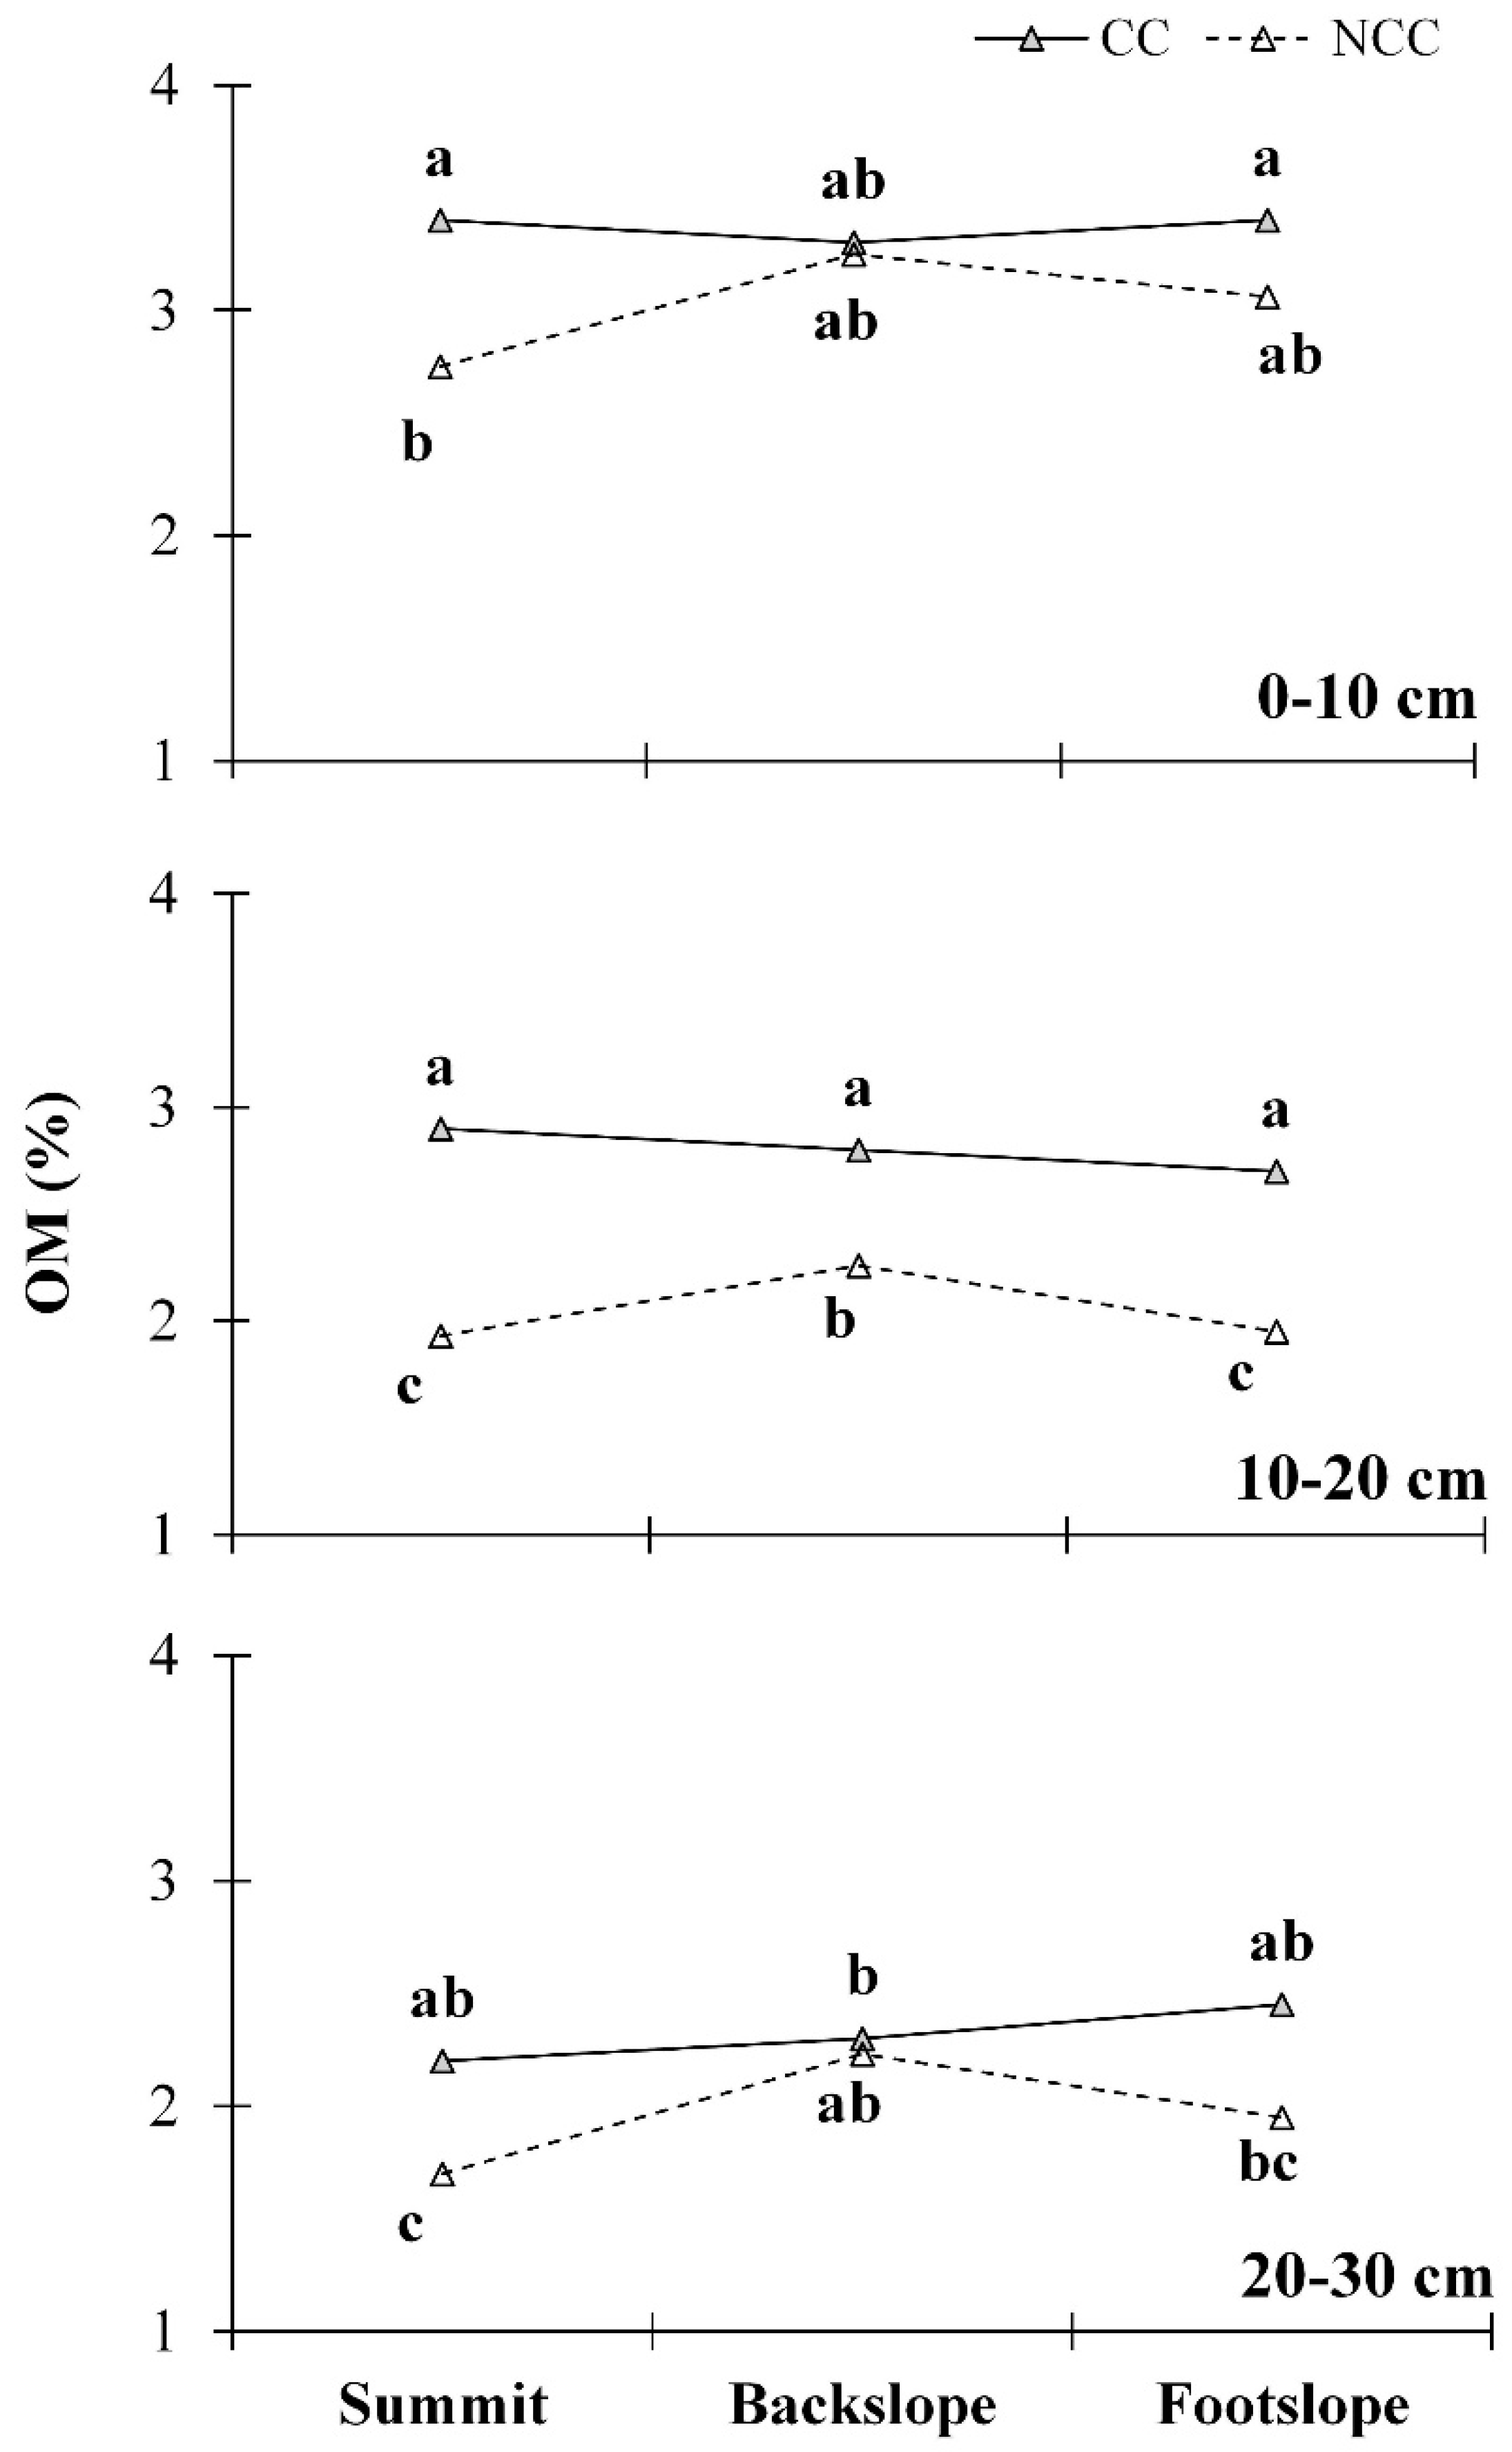
3.5. Cover Crop Effects on Soil pH and Percent Organic Matter

Soil pH was significantly greater in CC treatment compared to NCC at all three soil depths in 2018 (Figure 5A), demonstrating reduced acidity in CC soils compared to NCC. A similar outcome was reported in a study by Chavarría et al. [39], wherein significantly greater pH levels were obtained in CC (pH = 5.78) compared to NCC (pH = 5.52). However, interestingly, a contradictory result was obtained from a long-term study conducted in Tennessee, which found no significant differences in soil pH between CC and NCC treatments [34].
In this study, CC treatment showed significantly greater pH levels at the summit, backslope, and footslope positions for all three soil depths compared to NCC (Figure 6). Within the CC treatment, soil pH was not significantly different among summit, backslope, and footslope landscape positions at the 0–10 cm depth. In contrast, within the CC treatment, pH at the footslope showed significantly greater levels at the second and third depths compared to summit and back slopes. Within NCC treatment, pH was significantly greater at the footslope compared to the summit at the first and third soil depths.
The %OM was also significantly greater in CC compared to NCC at all three soil depths in 2018 (Figure 5B). For the same study site, VeVerka et al. [26] reported no changes in %OM in CC treatment from 2012 to 2014, wherein the values for 2014 were 1.5–1.8% for 0–10 cm and 1.1–1.4% for 20–30 cm. In our study, the %OM in CC treatment ranged from 3.2–3.6% at 0–10 cm depth and 2.2–2.5% at 20–30 cm in 2018, six years after the initial CC establishment. Thus, according these results, CC management did not changed the %OM within the first two years after the initial CC establishment (2012 to 2014); however, CC was able to double the %OM from two to six years after the initial establishment, over the four years between 2014 and 2018. Although soil organic matter accumulation occurs over a longer period, the introduction of CC at this eroded site increased OM as compared to NCC in a short period. This suggests that even though the soil microbial enzyme activities did not show clear, consistent relationships with CC treatment and soil depth, CC was able to increase soil organic matter content. Chavarría et al. [39] found significant increases in soil organic carbon (SOC) in response to CC growth, finding that CC had 8.8% higher SOC compared to the control treatment. Ding et al. [7] also reported significantly greater soil organic matter (SOM) levels under CC compared to NCC in a study conducted in Massachusetts, USA.
At the 10–20 cm depth, %OM was significantly greater in CC compared to NCC at the summit, backslope, and footslope landscape positions—specifically 1.5, 1.2 and 1.4 times greater, respectively. In the first and third soil depths, CC treatment showed significantly greater %OM levels only at the summit site compared to NCC (Figure 7). Within the CC treatment, organic matter percentage was not significantly different among landscape positions at any soil depth. VeVerka et al. [26] reported that the greatest organic carbon value was found at the summit position for both CC and NCC treatments, but the depth and landscape position effects were not significant between the two tested years (2012 and 2014) for soil organic carbon at the same study site. The results of our study demonstrated that CC growth increased soil organic matter levels at the summit position over the entire 0–30 cm depth and at backslope and footslope positions at 10-20 cm depth compared to NCC with time. The summit areas of the study site were flat and that may have allowed higher accumulation of organic matter under CC treatment. Sedimentation and accumulation of organic materials eroded from the backslope areas may have increased the organic matter levels in the footslope positions of the CC treatment.
Previous studies indicate that cover crops and organic matter addition can increase soil microbial population and diversity [40], and that the quantity and biochemical characteristics of available OM may contribute to differences in enzyme activities [17,41]. The results of our study indicate a clear increase of OM content with CC use, but the observed patterns of enzyme activities in response to CC was neither consistent with time nor significantly greater for all four tested enzymes compared to NCC.

4. Conclusions

All tested soil enzyme levels were significantly different between the two years—2016 and 2018—irrespective of CC or NCC treatment. We found significantly greater (p < 0.05) β-glucosaminidase concentration in the CC treatment compared to NCC in 2018, with the CC treatment having a 1.3 times higher β-glucosaminidase level compared to NCC. In contrast, the enzyme dehydrogenase showed a significantly greater level in the NCC treatment compared to CC in 2018. Most enzyme activities significantly decreased with increasing soil depth. The interaction of landscape position with enzyme activity was not significant. Soil pH and %OM was found to be significantly greater in CC compared to NCC in 2018.
Short-term and long-term studies conducted with clear statistical designs in research centers have shown increased soil microbial enzyme activities in response to CC management, tillage, and crop rotations [34,39,42]. However, with on-farm research, the real farmer field conditions are different from managed, small-scale research plot studies. Our study—conducted on a farmer-managed field—demonstrated higher spatial and temporal variability in soil microbial enzyme activities, soil pH, and %OM in response to CC and NCC treatments, landscape positions, and soil depth. The findings from this study emphasize the importance of long-term farmer field studies with standardized management and sampling protocols to confirm CC effects on soil microbial enzyme activities and other soil quality parameters.

Author Contributions

Formal analysis, L.M.R.; Funding acquisition, R.P.U.; Investigation, L.M.R.; Project administration, L.M.R., R.P.U. and S.J.; Resources, K.S.V.; Supervision, R.P.U.; Validation, K.S.V.; Visualization, L.M.R.; Writing—original draft, L.M.R.; Writing—review & editing, K.S.V., S.J. and S.A.

Funding

This research was funded by the USDA-NRCS National CIG Award (grant number 69-3A75-12-192Udawatta) and USDA-NRCS-MO CIG Award (grant number 69-6424-12-144).

Acknowledgments

We gratefully acknowledge the funding from USDA-NRCS National Program, USDA-NRCS Missouri State Office, Missouri Department of Natural Resources, and Missouri Department of Conservation for the study. We also thank the Chariton County Soil and Water Conservation District and Associated Electric Cooperative, Inc., for the study site and their support. The research was also supported by The Center for Agroforestry, University of Missouri, Columbia, USA.

Conflicts of Interest

The authors declare no conflict of interest.

References

  1. Zalidis, G.; Stamatiadis, S.; Takavakoglou, V.; Eskridge, K.; Misopolinos, N. Impacts of agricultural practices on soil and water quality in the Mediterranean region and proposed assessment methodology. Agric. Ecosyst. Environ. 2002, 88, 137–146. [Google Scholar] [CrossRef]
  2. Weerasekara, C.; Udawatta, R.P.; Jose, S.; Kremer, R.J.; Weerasekara, C. Soil quality differences in a row-crop watershed with agroforestry and grass buffers. Agroforest Syst. 2016, 90, 829–838. [Google Scholar] [CrossRef]
  3. Dunn, M.; Ulrich-Schad, J.D.; Prokopy, L.S.; Myers, R.L.; Watts, C.R.; Scanlon, K. Perceptions and use of cover crops among early adopters: Findings from a national survey. J. Soil Water Conserv. 2016, 71, 29–40. [Google Scholar] [CrossRef]
  4. Teasdale, J.R. Contribution of cover crops to weed management in sustainable agricultural systems. J. Prod. Agric. 1996, 9, 475–479. [Google Scholar] [CrossRef]
  5. Doran, J.W.; Zeiss, M.R. Soil health and sustainability: Managing the biotic component of soil quality. Appl. Soil Ecol. 2000, 15, 3–11. [Google Scholar] [CrossRef]
  6. Fageria, N.K.; Baligar, V.C.; Bailey, B.A. Role of cover crops in improving soil and row crop productivity. Commun. Soil Sci. Plant Anal. 2005, 36, 2733–2757. [Google Scholar] [CrossRef]
  7. Ding, G.; Liu, X.; Herbert, S.; Novak, J.; Amarasiriwardena, D.; Xing, B. Effect of cover crop management on soil organic matter. Geoderma 2006, 130, 229–239. [Google Scholar] [CrossRef]
  8. Delgado, J.A.; Gantzer, C.J. The 4Rs for cover crops and other advances in cover crop management for environmental quality. J. Soil Water Conserv. 2015, 70, 142A–145A. [Google Scholar] [CrossRef] [Green Version]
  9. Lal, R. Soil carbon sequestration and aggregation by cover cropping. J. Soil Water Conserv. 2015, 70, 329–339. [Google Scholar] [CrossRef]
  10. Buyer, J.S.; Teasdale, J.R.; Roberts, D.P.; Zasada, I.A.; Maul, J.E. Factors affecting soil microbial community structure in tomato cropping systems. Soil Biol. Biochem. 2010, 42, 831–841. [Google Scholar] [CrossRef]
  11. Nair, A.; Ngouajio, M. Soil microbial biomass, functional microbial diversity, and nematode community structure as affected by cover crops and compost in an organic vegetable production system. Appl. Soil Ecol. 2012, 58, 45–55. [Google Scholar] [CrossRef]
  12. Hoorman, J.J. Using Cover Crops to Improve Soil and Water Quality; Agriculture and Natural Resources, The Ohio State University Extension: Lima, OH, USA, 2009; Available online: http://www.northcentralsare.org/content/download/68294/968475/Using_Cover_crops_to_improve_Soil_and_Water_pdf (accessed on 12 August 2018).
  13. Fernandez, A.L.; Sheaffer, C.C.; Wyse, D.L.; Staley, C.; Gould, T.J.; Sadowsky, M.J. Associations between soil bacterial community structure and nutrient cycling functions in long-term organic farm soils following cover crop and organic fertilizer amendment. Sci. Total. Environ. 2016, 566, 949–959. [Google Scholar] [CrossRef] [PubMed]
  14. Bandick, A.K.; Dick, R.P. Field management effects on soil enzyme activities. Soil Biol. Biochem. 1999, 31, 1471–1479. [Google Scholar] [CrossRef]
  15. Debosz, K.; Rasmussen, P.H.; Pedersen, A.R. Temporal variations in microbial biomass C and cellulolytic enzyme activity in arable soils: Effects of organic matter input. Appl. Soil Ecol. 1999, 13, 209–218. [Google Scholar] [CrossRef]
  16. Veum, K.S.; Goyne, K.W.; Kremer, R.J.; Miles, R.J.; Sudduth, K.A. Biological indicators of soil quality and soil organic matter characteristics in an agricultural management continuum. Biogeochemistry 2014, 117, 81–99. [Google Scholar] [CrossRef]
  17. Udawatta, R.P.; Kremer, R.J.; Adamson, B.W.; Anderson, S.H. Variations in soil aggregate stability and enzyme activities in a temperate agroforestry practice. Appl. Soil Ecol. 2008, 39, 153–160. [Google Scholar] [CrossRef]
  18. Stott, D.E.; Andrews, S.S.; Leibig, M.A.; Wienhold, B.J.; Karlen, D.L. Evaluation of β-glucosidase activity as a soil quality indicator for the soil management assessment framework. Soil Sci. Soc. Am. J. 2010, 74, 107–119. [Google Scholar] [CrossRef]
  19. Sinsabaugh, R.L.; Moorhead, D.L. Resource allocation to extracellular enzyme production: A model for nitrogen and phosphorus control of litter decomposition. Soil Biol. Biochem. 1995, 26, 1305–1311. [Google Scholar] [CrossRef]
  20. Parham, J.A.; Deng, S.P. Detection, quantification, and characterization of β-glucosaminidase activity in soils. Soil Biol. Biochem. 2000, 32, 1183–1190. [Google Scholar] [CrossRef]
  21. Dick, R.P.; Breakwell, D.P.; Turco, R.F. Soil enzyme activities and biodiversity measurements as integrative microbiological indicators. In Methods of Assessing Soil Quality; Doran, J.W., Jones, A.J., Eds.; SSSA Special Publication 49: Madison, WI, USA, 1996; pp. 247–271. [Google Scholar]
  22. Tabatabai, M.A.; Dick, W.A. Enzymes in soil: Research and developments in measuring activities. In Enzymes in the Environment: Activity, Ecology, and Applications; Burns, R.G., Dick, R.P., Eds.; Marcel Dekker, Inc.: New York, NY, USA, 2002; pp. 567–596. [Google Scholar]
  23. Karlen, D.L.; Mausbach, M.J.; Doran, J.W.; Cline, R.G.; Harris, R.F.; Schuman, G.E. Soil quality: A concept, definition, and framework for evaluation (a guest editorial). Soil Sci. Soc. Am. J. 1997, 61, 4–10. [Google Scholar] [CrossRef]
  24. Gregorich, E.G.; Beare, M.H.; McKim, U.F.; Skjemstad, J.O. Chemical and biological characteristics of physically uncomplexed organic matter. Soil Sci. Soc. Am. J. 2006, 70, 975–985. [Google Scholar] [CrossRef]
  25. Dick, R.P. Soil enzyme activity as an indicator of soil quality. In Defining Soil Quality for a Sustainable Environment; Doran, J.W., Coleman, D.C., Stewart, B.A., Bezdicek, D.F., Eds.; SSSA special publication 35: Madison, WI, USA, 1994; pp. 107–124. [Google Scholar]
  26. VeVerka, J.S.; Udawatta, R.P.; Kremer, R.J. Soil health indicator responses on Missouri claypan soils affected by landscape position, depth, and management practices. J. Soil Water Conserv. 2019, 74, 126–137. [Google Scholar] [CrossRef]
  27. Midwestern Regional Climate Center. 2015, p. 528. Available online: http://mrcc.isws.illinois.edu/ (accessed on 16 July 2017).
  28. Dick, R.P. Methods of soil enzymology. In Methods of Soil Enzymology; Dick, R.P., Ed.; Book Series No. 9; Soil Science Society of America: Madison, WI, USA, 2011; pp. 104–197. [Google Scholar]
  29. Ball, D.F. Loss-on-ignition as an estimate of organic matter and organic carbon in non-calcareous soils. J. Soil Sci. 1964, 15, 84–92. [Google Scholar] [CrossRef]
  30. SAS. SAS User’s Guide: Statistics; SAS Institute: Cary, NC, USA, 2013. [Google Scholar]
  31. Mendes, I.C.; Bandick, A.K.; Dick, R.P.; Bottomley, P.J. Microbial biomass and activities in soil aggregates affected by winter cover crops. Soil Sci. Soc. Am. J. 1999, 63, 873–881. [Google Scholar] [CrossRef]
  32. Calderon, F.J.; Nielsen, D.; Acosta-Martinez, V.; Vigil, M.F.; Drew, L.Y.O.N. Cover crop and irrigation effects on soil microbial communities and enzymes in semiarid agroecosystems of the Central Great Plains of North America. Pedosphere 2016, 26, 192–205. [Google Scholar] [CrossRef]
  33. Skopp, J.; Jawson, M.; Doran, J. Steady-state aerobic microbial activity as a function of soil water content. Soil. Sci. Soc. Am. J. 1990, 54, 1619–1625. [Google Scholar] [CrossRef]
  34. Mbuthia, L.W.; Acosta-Martínez, V.; DeBruyn, J.; Schaeffer, S.; Tyler, D.; Odoi, E.; Mpheshea, M.; Walker, F.; Eash, N. Long term tillage, cover crop, and fertilization effects on microbial community structure, activity: Implications for soil quality. Soil Biol. Biochem. 2015, 89, 24–34. [Google Scholar] [CrossRef]
  35. Nivelle, E.; Verzeaux, J.; Habbib, H.; Kuzyakov, Y.; Decocq, G.; Roger, D.; Lacoux, J.; Duclercq, J.; Spicher, F.; Nava-Saucedo, J.E.; et al. Functional response of soil microbial communities to tillage, cover crops and nitrogen fertilization. Appl. Soil Ecol. 2016, 108, 147–155. [Google Scholar] [CrossRef]
  36. Stone, M.M.; DeForest, J.L.; Plante, A.F. Changes in extracellular enzyme activity and microbial community structure with soil depth at the Luquillo Critical Zone Observatory. Soil Biol. Biochem. 2014, 75, 237–247. [Google Scholar] [CrossRef]
  37. Taylor, J.P.; Wilson, B.; Mills, M.S.; Burns, R.G. Comparison of microbial numbers and enzymatic activities in surface soils and subsoils using various techniques. Soil Biol. Biochem. 2002, 34, 387–401. [Google Scholar] [CrossRef]
  38. Decker, K.L.M.; Boerner, R.E.J.; Morris, S.J. Scale dependent patterns of soil enzyme activity in a forested landscape. Can. J. For. Res. 1999, 29, 232–241. [Google Scholar] [CrossRef]
  39. Chavarría, D.N.; Verdenelli, R.A.; Serri, D.L.; Restovich, S.B.; Andriulo, A.E.; Meriles, J.M.; Vargas-Gil, S. Effect of cover crops on microbial community structure and related enzyme activities and macronutrient availability. Europ. J. Soil Biol. 2016, 76, 74–82. [Google Scholar] [CrossRef]
  40. Kirchner, M.J.; Wollum, A.G.; King, L.D. Soil microbial populations and activities in reduced chemical input agroecosystems. Soil Sci. Soc. Am. J. 1993, 57, 1289–1295. [Google Scholar] [CrossRef]
  41. Myers, R.T.; Zak, D.R.; White, D.C.; Peacock, A. Landscape-level patterns of microbial community composition and substrate use in upland forest ecosystems. Soil Sci. Soc. Am. J. 2001, 65, 359–367. [Google Scholar] [CrossRef]
  42. McDaniel, M.D.; Grandy, A.S. Soil microbial biomass and function are altered by 12 years of crop rotation. Soil 2016, 2, 583–599. [Google Scholar] [CrossRef] [Green Version]
Figure 1. Monthly rainfall distribution (bars) for 2016 (a), 2017 (b) and 2018 (c) and 30-year average (line) in Chariton County, Missouri. Shaded area represents the cover crop growing period.
Agriculture 09 00125 g001
Figure 2. Variation in β-glucosidase (A), fluorescein diacetate (FDA) (B), β-glucosaminidase (C) and dehydrogenase (D) enzyme levels between cover crop (CC) and no cover crop (NCC) treatments in 2016 and 2018 at the Chariton County Cover Crop Soil Health Research and Demonstration Farm, Missouri, USA. Different letters within each year show significant differences between CC and NCC treatments at p < 0.05 level.
Agriculture 09 00125 g002
Figure 3. Variation in β-glucosidase (A), FDA (B), β-glucosaminidase (C) and dehydrogenase (D) enzyme levels with soil depth under cover crop (CC) and no cover crop (NCC) treatments in 2016 and 2018 at the Chariton County Cover Crop Soil Health Research and Demonstration Farm, Missouri, USA. Different lower case letters show significant differences between treatments (CC and NCC) by soil depth in 2016 and upper case letters for 2018 at p < 0.05 level.
Agriculture 09 00125 g003
Figure 4. Variation in β-glucosidase (A), FDA (B), β-glucosaminidase (C) and dehydrogenase (D) enzyme levels between cover crop (CC) and no cover crop (NCC) treatments at 0–10 cm depth at three landscape positions in 2016 and 2018 at the Chariton County Cover Crop Soil Health Research and Demonstration Farm, Missouri, USA. Different letters within each year show significant differences between treatments by landscape position at p < 0.05 level.
Agriculture 09 00125 g004
Figure 5. Change in pH (A) and percent organic matter (%OM; B) between cover crop (CC) and no cover crop (NCC) treatments at 0–10, 10–20 and 20–30 cm depth in 2018 at the Chariton County Cover Crop Soil Health Research and Demonstration Farm, Missouri, USA. Different letters show significant differences between treatments by soil depth at p < 0.05 level.
Agriculture 09 00125 g005
Figure 6. Change in pH between cover crop (CC) and no cover crop (NCC) treatments by landscape position (summit, backslope and footslope) at 0–10, 10–20 and 20–30 cm depth in 2018 at the Chariton County Cover Crop Soil Health Research and Demonstration Farm, Missouri, USA. Different letters at each depth show significant differences between treatments by landscape position at p < 0.05 level.
Agriculture 09 00125 g006
Figure 7. Change in percent organic matter (%OM) between cover crop (CC) and no cover crop (NCC) treatments by landscape position (summit, backslope and footslope) at 0–10, 10–20 and 20–30 cm depth in 2018 at the Chariton County Cover Crop Soil Health Research and Demonstration Farm, Missouri, USA. Different letters at each depth show significant differences between treatments by landscape position at p < 0.05 level.
Agriculture 09 00125 g007
Table 1. Laboratory enzyme assays and procedures used according to Dick [28] in the United States Department of Agriculture-Agricultural Research Service (USD-ARS) Soil Health and Research Lab, University of Missouri, USA.
Enzyme AssaySubstrateIncubation Temperature (°C)Incubation Period (h)ProductSpectrophotometer Wavelength (nm)
β-glucosidasep-nitrophenyl-β-d-glycopyanoside (PNG)371p-nitrophenol405
β-glucosaminidasep-nitrophenyl-N-acetyle-β-d-glycopyanoside (PNNAG)371p-nitrophenol405
Fluorescien diacetate (FDA) hydrolaseFluorescien diacetate373Fluorescien490
DehydrogenaseIodonitrotetrazolium chloride (INT)372Iodonitrotetrazolium formazan (INFT)464

