Article

Temporal Effects of Biochar and Dairy Manure on Physicochemical Properties of Podzol: Case from a Silage-Corn Production Trial in Boreal Climate

1
School of Science and the Environment, Memorial University of Newfoundland, Corner Brook, NL A2H 5G4, Canada
2
Department of Earth Sciences, Stellenbosch University, Private Bag X1, Matieland 7602, South Africa
*
Author to whom correspondence should be addressed.
Submission received: 11 June 2019 / Revised: 3 August 2019 / Accepted: 13 August 2019 / Published: 16 August 2019

Abstract

:
A field experiment was conducted to evaluate the effects of biochar and dairy manure (DM) on physicochemical properties of podzolic soils, as well as to establish the relationships between selected physicochemical properties and soil electrical conductivity (EC) in a silage-corn production system. Nutrient requirements of the crop were met through different nutrient sources considering soil nutrient status, nutrient availability from DM (DM, DM + biochar) and regional crop nutrient recommendations. Experimental treatments included control, inorganic nitrogen (IN), IN + biochar, IN + DM, and IN + DM + biochar. DM was applied at 30,000 L ha−1, whereas biochar was applied at 20 Mg ha−1 and mixed within the top 20 cm of the soil. Disturbed soil samples as well as time domain reflectometry (TDR) measurements were collected from treatment plots on four field days. Results showed no significant (p > 0.05) treatment effects on soil pH and cation exchange capacity (CEC) within each field day. However, significant temporal effects were recorded for pH, EC, apparent electrical conductivity (ECa) and electrical conductivity of the soil solution (ECw). Soil depth (0–10 cm and 10–20 cm) had no significant effect on treatments. Significant positive correlations were recorded for EC with soil organic carbon and CEC (ECa, ECw 0–10 cm, & 10–20 cm, p = 0.000). Correlation results show that ECa measurements as a proxy to investigate the variability of key soil properties over large areas, but further investigation between ECa data and soil properties should be carried out to address uncertainties associated in predicting these properties.

1. Introduction

The Government of Newfoundland and Labrador (NL) recognized that local food production needs to be increased from its current 10% to 20% by 2022 [1] in an attempt to improve the food security by supporting the advancement and development of management decisions to increase the productivity and sustainable growth. NL farmers use different agronomic practices to increase land productivity to contribute to food security. These include adding inorganic fertilizer or dairy manure (DM) alone or in various combinations to meet the crop nutrient requirements. It is important, however, to use the beneficial management practices that not only enhance the crop production, but also minimize the negative impacts on soil, water, and the environment. If excessive inorganic fertilizer or DM is applied to the soil, mineral nutrients can leach into groundwater, potentially leading to water contamination and eutrophication or emission to the atmosphere as greenhouse gases (GHGs), a major driver of global warming [2,3]. Therefore, it is important to investigate the effects of such management practices on podzol soils in boreal ecosystem prone to nutrient leaching and GHGs emissions. Boreal soils, podzols, in nature are known to have high hydrogen (H+) and aluminum (Al3+) ion levels leading to low soil pH characteristics [4]. The low soil pH limits the nutrients uptake, thus limiting crop yields in podzols. Biochar, a recalcitrant black carbon (C) material produced by the baking of organic matter under low oxygen conditions, when applied as an amendment to acidic soils, showed positive effects on soil pH [5,6]. This can in turn reduce the concentration of H+ and Al3+ ions, since Al3+ precipitates as hydroxy-Al polymers at higher pH, increasing essential nutrient availability and crop yield [5,7].
Biochar is very stable due to the aromatic C structure [8] and can alter the physicochemical properties of soil. Biochar has multifaceted benefits including reduction of GHGs emission, soil compaction [9], increased soil pH, and the aggregate stability [10]. It also resulted in enhanced soil permeability, porosity and water holding capacity leading to better nutrient availabilities in plant root zones [11,12]. Furthermore, biochar increases the C sequestration and soil organic matter [13,14,15]. Cation exchange capacity (CEC) is also reported to increase as a result of biochar amendments along with pollutant degradation whereas microbial growth as well as optimum microbial activities are enhanced [16,17,18]. Recent studies have shown that biochar increases cation exchange capacity (CEC) of soils [5,19]. When biochar is exposed to oxygen and water (i.e., when added to the soil) spontaneous oxidation reactions take place, most likely enhanced through microbial activity, resulting in high CEC [20]. As biochar ages, CEC increases due to increase oxygenated functional groups attached to the biochar [20], therefore contributing to higher absorption capacity of cations perhaps even better than soil organic matter (SOM) [19].
Electrical conductivity (EC) is a measurement that correlates with properties of the soil affecting crop productivity [21]. Soil physicochemical properties, including CEC, soil salinity, subsoil characteristics, soil texture, clay content, bulk density (BD), and SOM content, all influence the soil EC [21,22]. Another measurement, the apparent electrical conductivity (ECa) is often easy to measure, but does not always relate to the crop production [22]. Ristolainen et al. [23] discussed how ECa has mostly been correlated with soil salinity and water content of saline soils, while in non-saline soils, ECa depends mostly on the SOM content, soil texture—especially clay content and plant available nutrients. It is assumed that NL’s soils are non-saline, due to high leaching potentials with high amounts of well-distributed precipitation received each year. Therefore, it would be expected that the ECa measurements obtained will depend on the non-saline soil properties discussed above. Various studies have shown that biochar can also influence soil EC by increasing the EC values through holding more soluble salts [5,6]. Efficient use of inorganic fertilizer, DM, and biochar will maintain soil health, reduce GHGs emissions, as well as increase crop productivity. Effects of DM, and biochar as soil amendments and agronomic practices to enhance crop productivity as well as to minimize the environmental damage are important considerations particularly on podzols used for agriculture in boreal ecosystems [24,25,26,27].
Soil organic C (SOC) is known to be the largest C stock in the terrestrial ecosystems [28,29]. Soils store three times more organic C than the plants [30]. The soils of Canada’s boreal region contain large C reservoirs [31]. Owing to this high C storage, it is important to ensure that agricultural practices do not release this stored C as CO2 into the atmosphere, considering this could increase the risk of global temperature rise. Decomposition of these large stocks of SOC in ecosystems of northern latitudes in response to rising temperatures may be one of the largest feedbacks with respect to climate change [32]. Thus, it is important to investigate whether the effects of using these soils for agriculture purposes would affect its C storage, since biochar has been shown to be a good soil amendment for sequestering C [33,34].
Currently, very little is known concerning how intensive agriculture as well as the use of DM and biochar affects the physicochemical properties and productivity of podzols in boreal climates. The objectives of this research are therefore: (i) to evaluate the effect of different soil amendments on physicochemical properties of a loamy sand podzolic soil, and (ii) to test if a relationship for ECa and electrical conductivity of soil solution (ECw) can be obtained with the other tested soil properties. The long-term goal of our research group is to map the spatio-temporal variability of soil’s physicochemical properties over larger agricultural fields by using the proxy parameters such as ECa through the electromagnetic induction (EMI) method in support of precision agriculture on podzolic soils in boreal ecosystems.

2. Materials and Methods

2.1. Field Experiment

An agronomic field experiment was established at the Pynn’s Brook Research Station (PBRS), Pasadena (49 ° 04′21″ N; 57 ° 33′36” W), western NL, Canada to evaluate the production potential of five silage corn genotypes using different nutrient management practices [35]. Experimental soil was a loamy sand (sand 82.0% ± 3.4, silt 11.6% ± 2.4 and clay 6.4% ± 1.2) with an average bulk density of 1.31 (± 0.07) g cm−3 [26] and measured soil organic matter and CEC were of 3.10% and 12 cmol kg−1, respectively. Experimental treatments were: (1) T1—control with no inorganic fertilizer or soil amendment; T2—inorganic N (IN); T3—Biochar + IN; T4—DM + IN; T5—DM + biochar + IN.Treatment details can be found in Table 1. Each experimental plot was 1.5 m × 6 m, with all plots arranged in a randomly distributed order with four replicates. DM was applied at the rate of 30,000 L ha−1 according to local farmer’s practice. Nutrients from DM (0.6 kg P, 1.5 kg N, 4.1 kg K per 1000 L of DM) were supplemented with inorganic fertilizer to meet the crop nutrient requirements. Each plot (except controls) received equal amounts of nutrients (225 kg ha−1 N, 225 kg ha−1 K and 110 kg ha−1 P) after considering nutrient availability from DM, inorganic fertilizer, initial soil nutrient status and regional recommendations for silage-corn. Biochar used in this experiment was produced from Yellow Pine Wood by slow pyrolysis at 500 °C for 30 min and obtained from AirTerra Inc. (Alberta, Canada) and basic properties of biochar are given in Table 2. Biochar (with pH = 9; H = 0.68%; O = 7.84%; N = 0.22%; N, total ash = 7.1%; recalcitrant C = 7.1%; bulk density = 0.19 Mg m−3; and particle density 1.57 Mg m−3)was applied @ 20 t ha−1 and mixed within the top 20 cm of the experimental plots [36]. DM and biochar were added to soil on May 23, 2016—approximately two months before the first sampling day.
For the current study, four field days (FDs) were selected including July 28 (65 days after sowing silage corn [DAS]), August 4 (72 DAS), September 30 (129 DAS) and October 6, 2016 (135 DAS). On each FD, soil sampling and in-situ measurements of soil moisture, ECa and temperature were carried using a portable time domain reflectometry (TDR) sensor (HD2 Imko GmbH, Germany). Composite soil samples were made by mixing soil collected from three sampling locations from 0–10 cm (D1) and 10–20 cm (D2) depths in each treatment plot. Soil samples were transported to Boreal Ecosystem Research Facility (BERF), Grenfell Campus, Memorial University of NL to measure further soil physicochemical properties (pH, SOC, CEC, and ECw).

2.2. Laboratory Analysis

ECw was measured using air-dried soil samples diluted in a 1:2 soil to distilled water ratio as suggested by Brady and Weil [37]. A portable pH/EC/TDS/Temperature meter (HANNA—HI9813–6 with CAL Check) was used to measure ECw, pH, TDS and temperature of soil solution. For SOC analysis, the Walkley-Black chromic acid wet oxidation method [38] was followed using the automatic titrator (Mettler Toledo G20 compact Titrator). At the same time, 20 mL of sulfuric acid (H2SO4) at 95–98% purity was added to the solution. The titrant used in this method was ferrous sulfate solution (FeSO4) and SOC was calculated using the following Equation (1).
SOC % = 3   ( 1 T S ) W
where T is the volume of the FeSO4 used in titrating the sample (mL), S is the volume of FeSO4 used in the blank titration (mL), and W is the soil sample weight used for titration, corrected for oven-dried weight (g) [38].
CEC of soil samples were measured by exchanging soil’s cations with sodium acetate [38]. CEC was estimated using 100 soil samples from both depths on the first (65 DAS) and the last FD (135 DAS), and only from 0–10 cm soil depth on the third FD (65 DAS). Samples were analyzed for sodium concentration using ion chromatography (Dionex ICS-5000+ DC-5 detector/chromatography module). No interference was observed among sodium and ammonium peaks (Figure 1), and values were corrected for actual concentration (cmol kg−1) by the following Equation;
Exchangeable   sodium = a   ×   b   ×   m c f ( d ) × ( 23 ) × s
where a is sodium concentration in ppm, mcf is the moisture correction factor for oven-dried weight of soil, s is the air-dried sample weight (g), b is the ammonium acetate solution (33 mL), d is the conversion factor (10) from ppm to cmol kg−1, and 23 is the molecular weight of Na [39].

2.3. Statistical Analysis

Data were analyzed using Microsoft Excel. Treatment effects were analyzed by grouping all five treatments into two main groups representing two soil depths. The analyses were done, after verifying the data normality, within each field day using ANOVA technique whereas treatment means were tested by Minitab using Tukey’s Honesty Significant Difference (HSD) at 5% confidence level. Correlation analyses between EC (ECw and ECa) and SOC and CEC were also carried out.

3. Results and Discussion

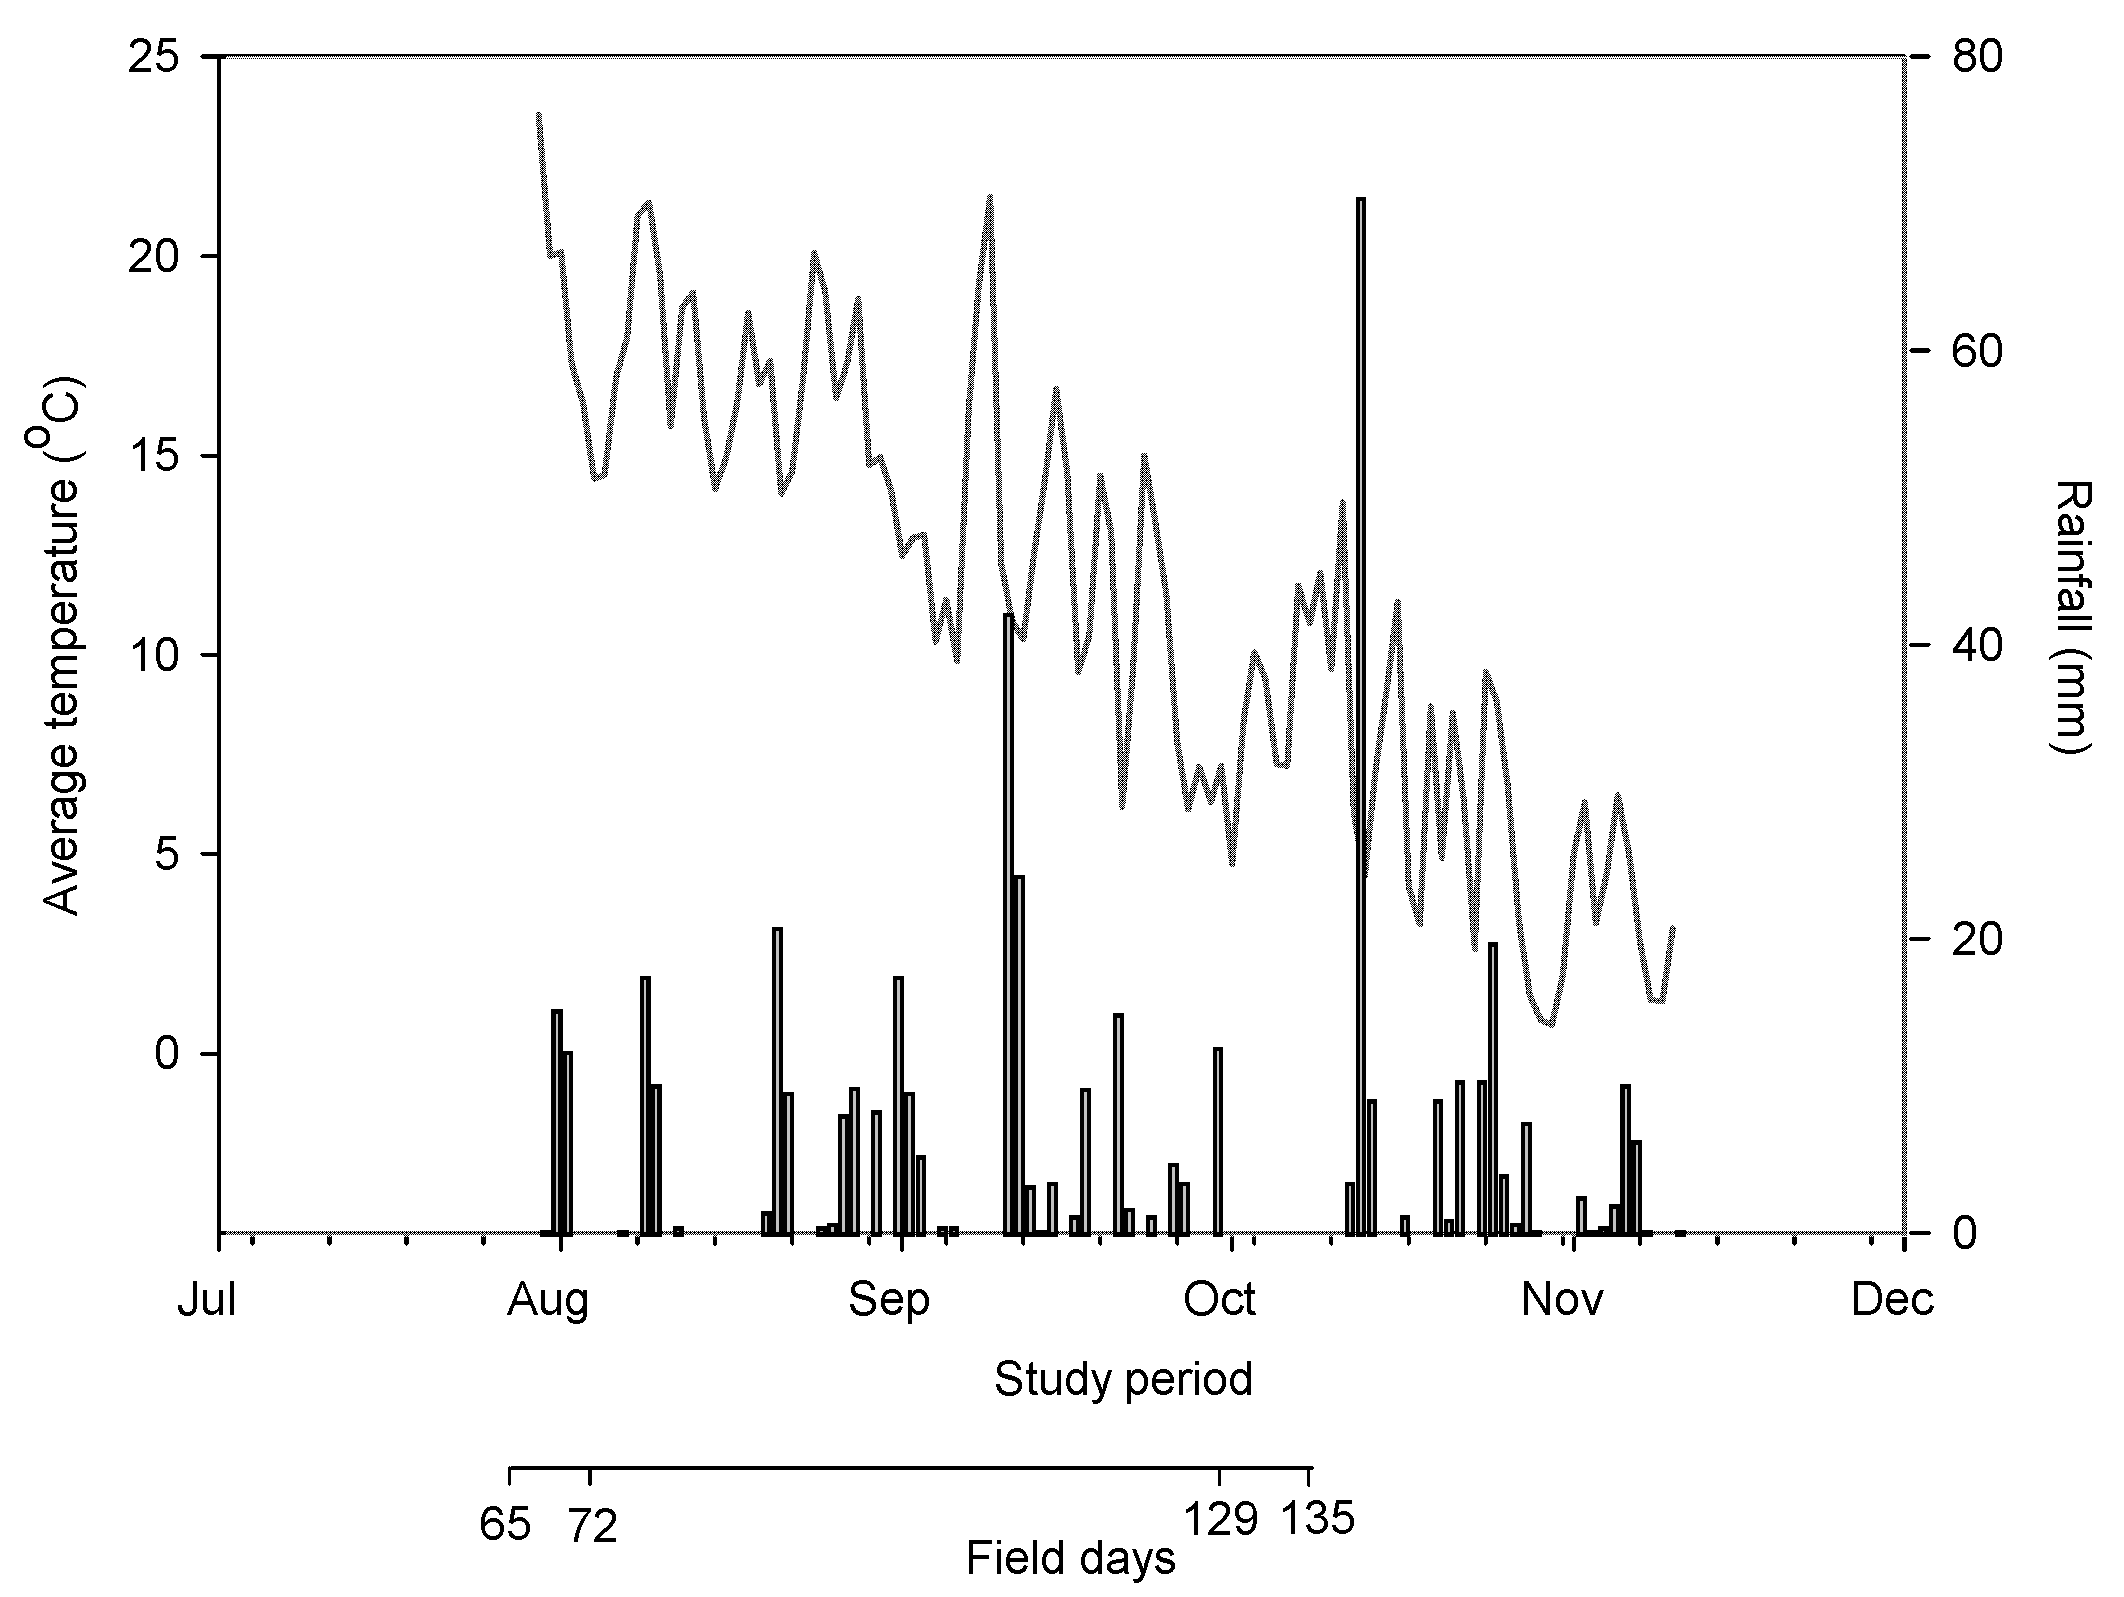
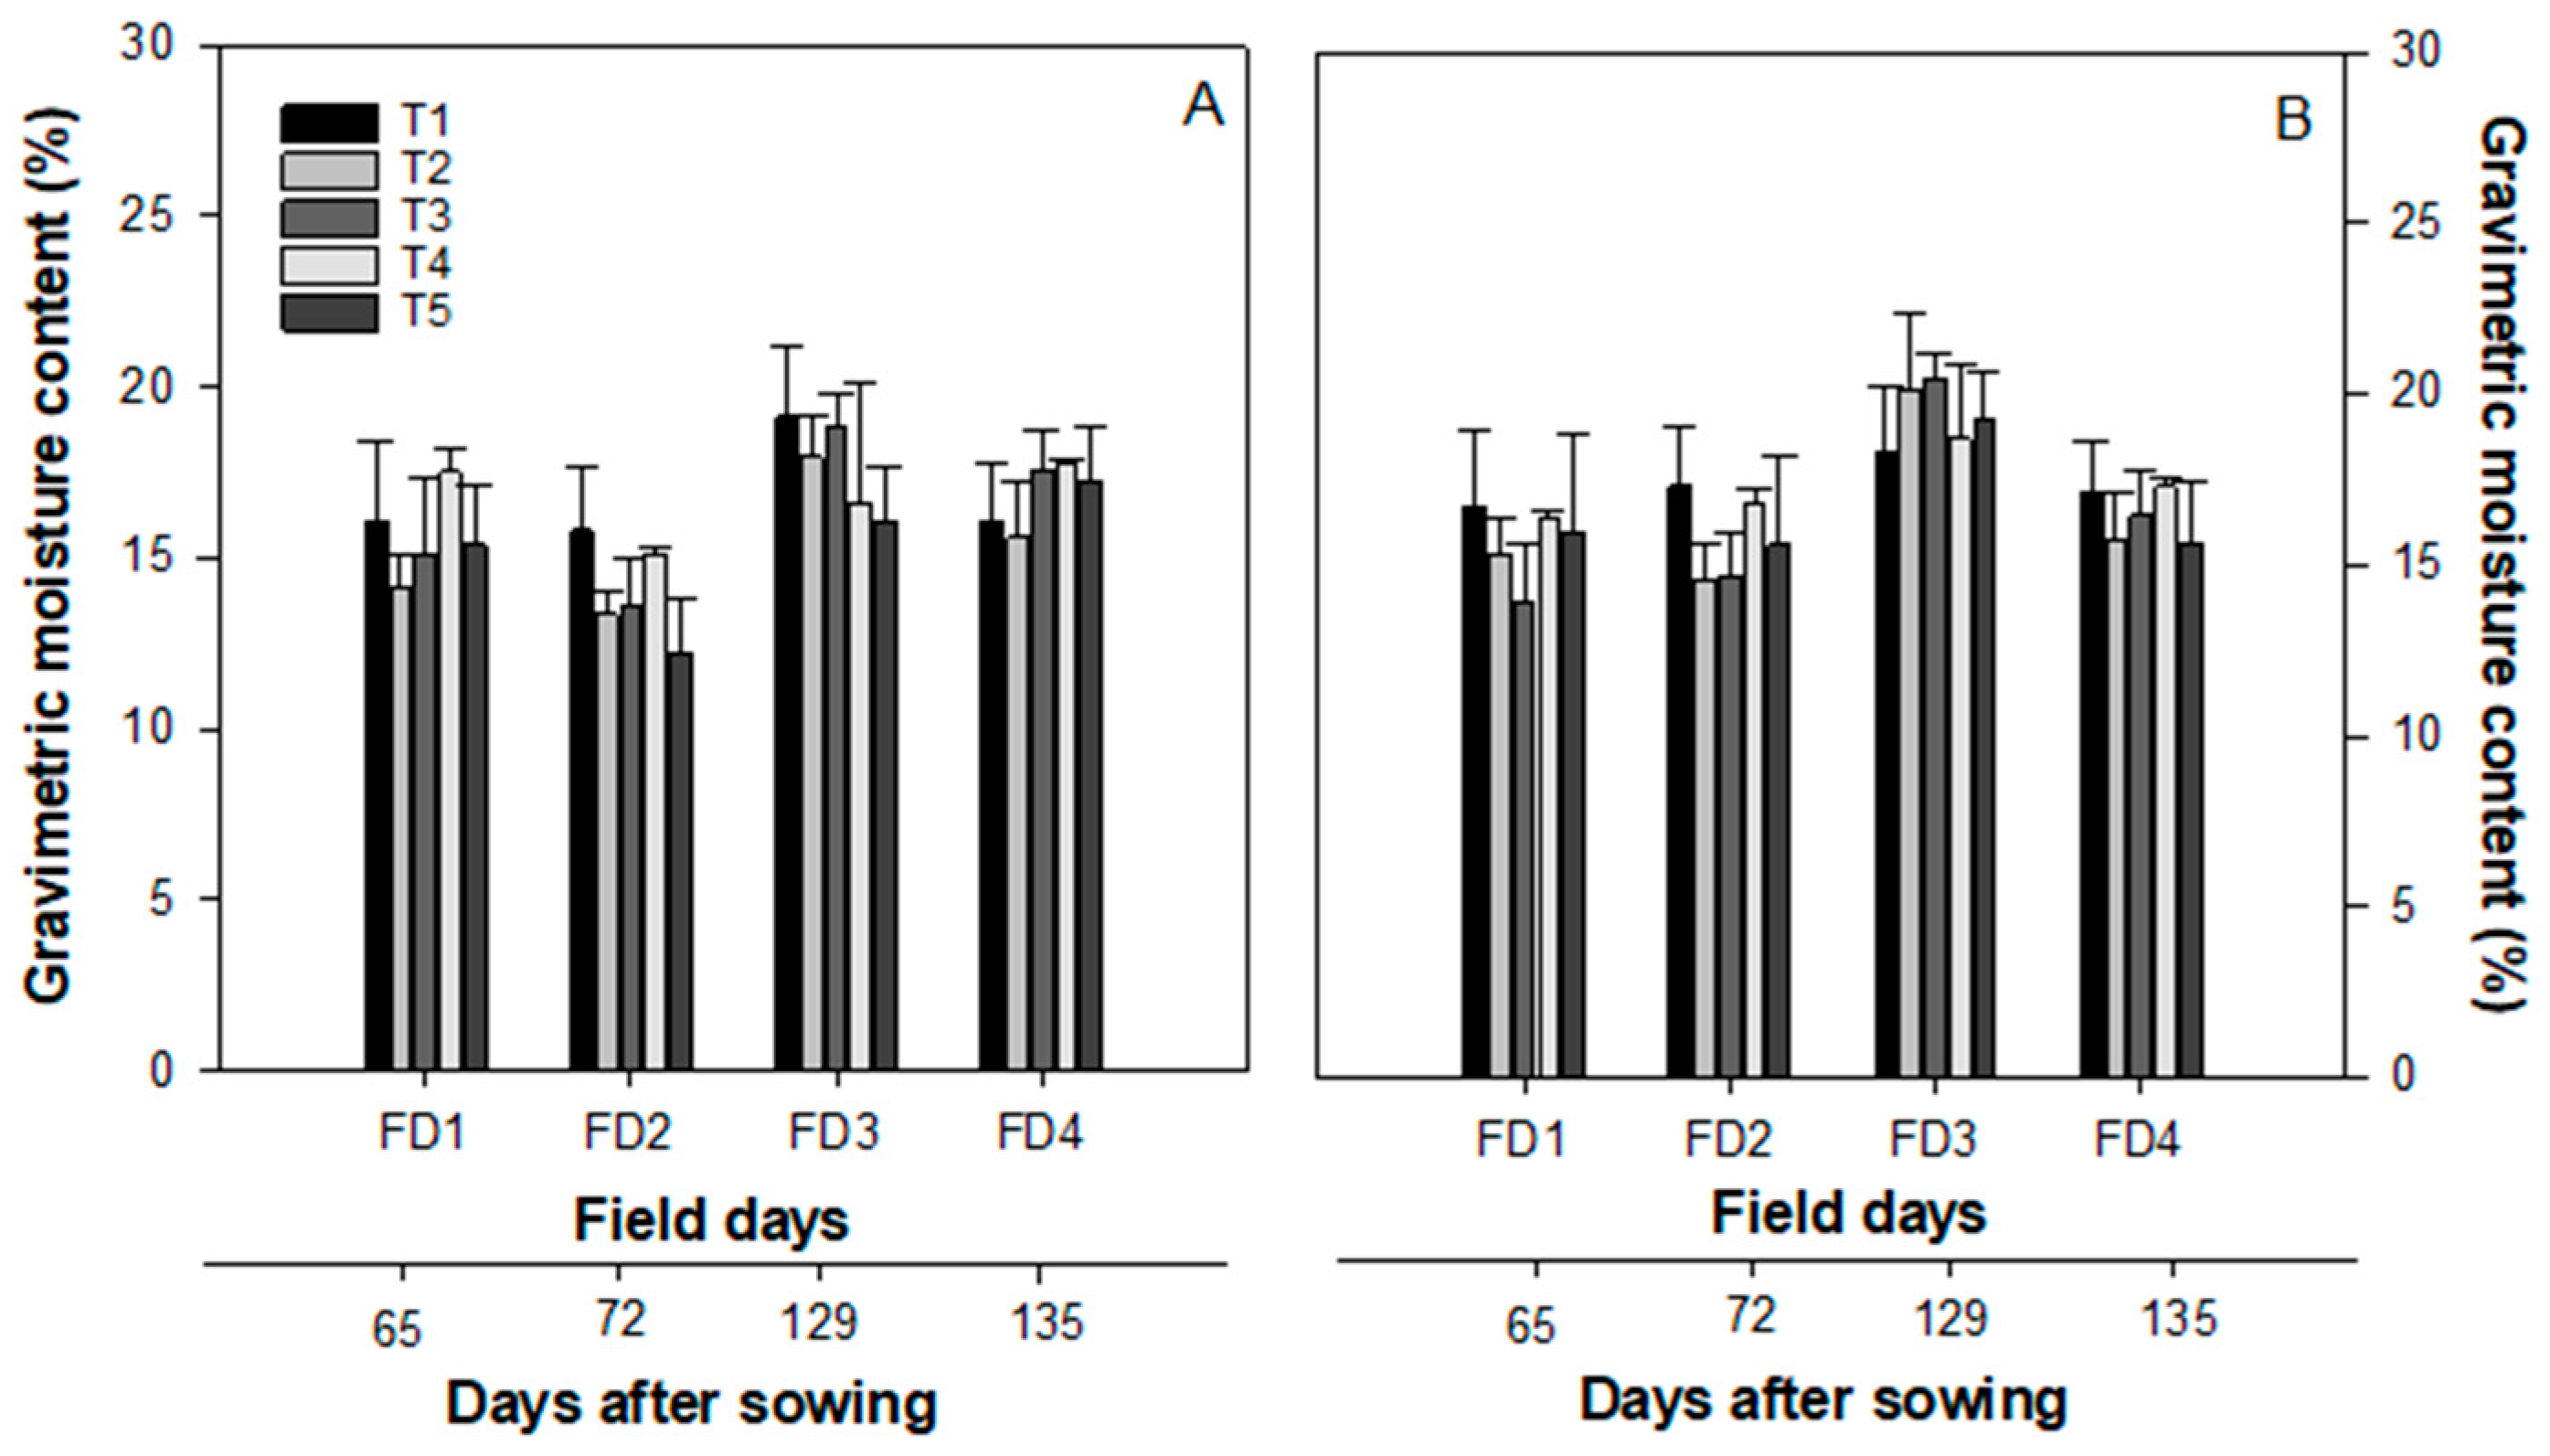
3.1. Climatic Conditions and Soil Gravimetric Moisture Contents

Significant temporal changes have been observed in average air temperature and rainfall during the study period (Figure 2). The observed average air temperature was higher on FD1 (23.5 °C) compared to lowest on FD4 (10.8 °C), whereas the temperature varies in order of FD1 > FD2 > FD3 FD4 (Figure 2). Overall, 444 mm rainfall was received on the experimental site from FD1 to November 8, where significantly higher rainfall was recorded on September 8 (42 mm) and October 10 (70 mm) as depicted in Figure 2. However, the rainfall was <1 mm on the observed FDs during the study period (Figure 2).
No significant effects of different soil amendments were recorded on gravimetric moisture contents of soil on each FD; however, the temporal variations were recorded, although non-significant at 0–10 cm (Figure 3A) and 10–20 cm (Figure 3B) soil depths. The gravimetric moisture contents varied from 12.24% to 19.12% at shallow soil depths (Figure 3A), whereas these values ranged from 13.90% to 20.48% at deep soil depth (Figure 3B).

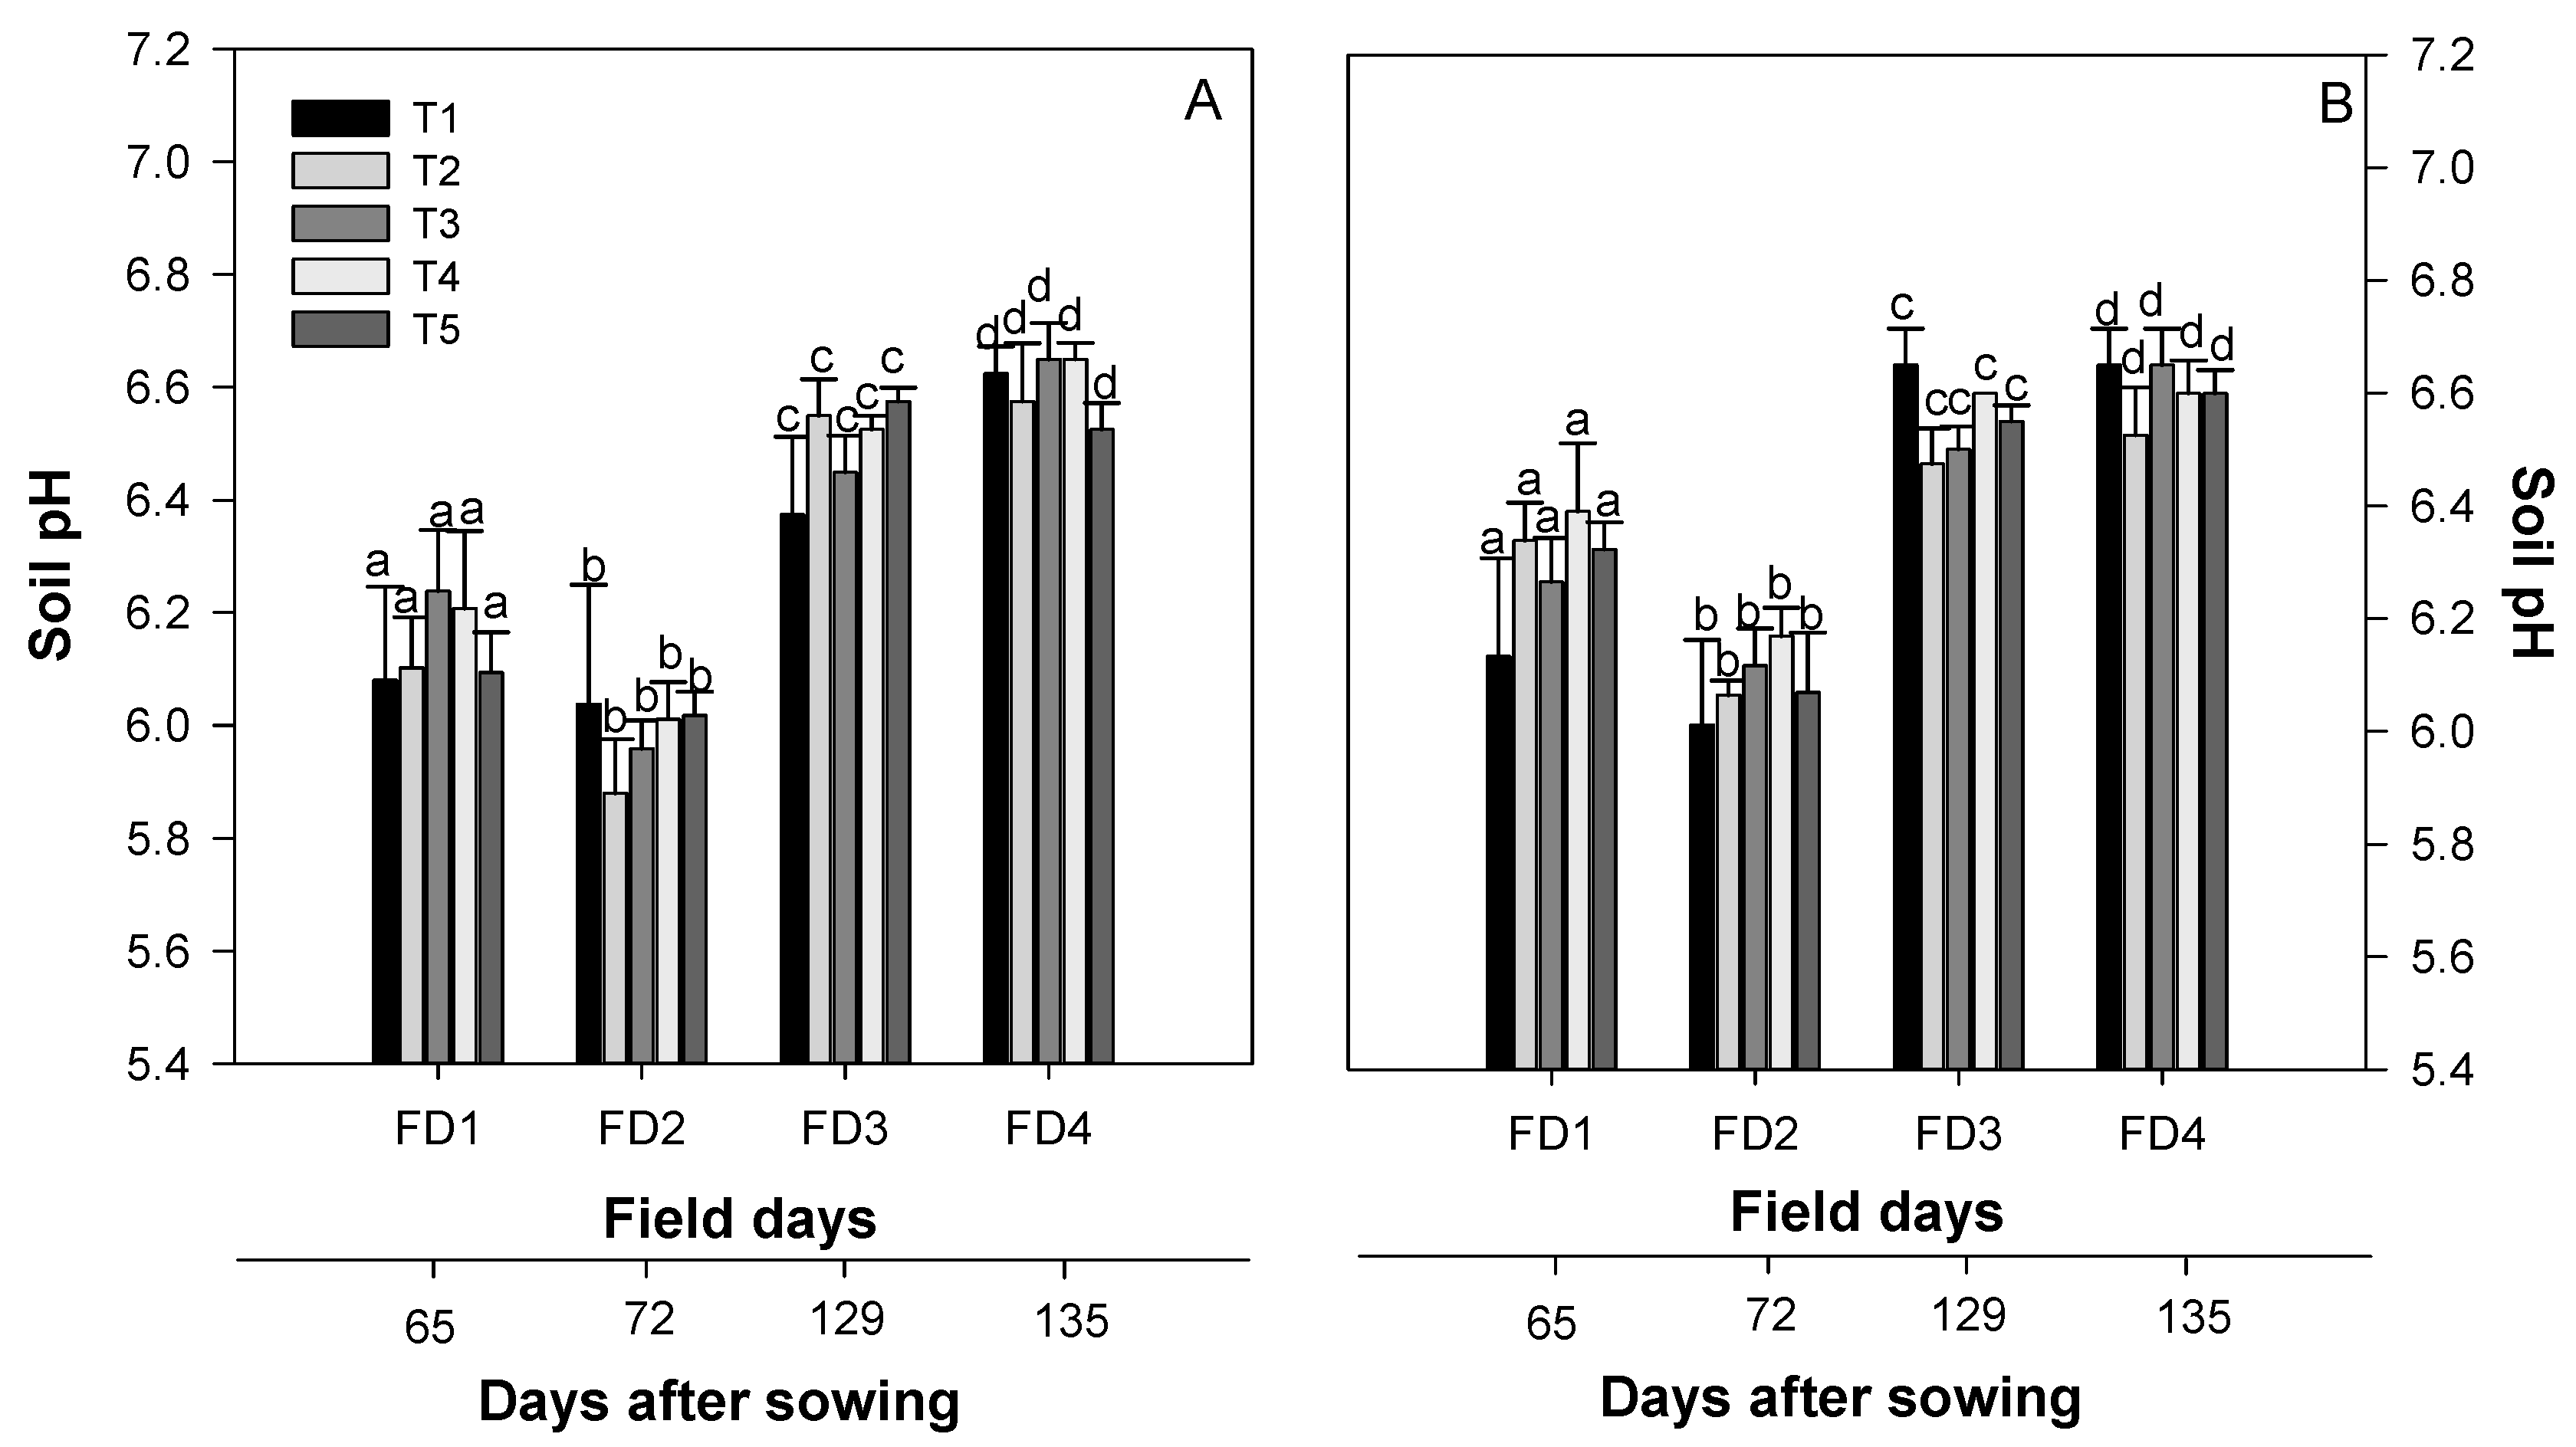
3.2. Effect of Soil Amendments on pH

There was no significant difference (p > 0.05) for soil pH among nutrient management treatments within each FD at 0–10 cm (Figure 4A), and 10–20 cm soil depths (Figure 4B). However, significant (p < 0.05) temporal variations were recorded in soil pH across the four FDs on both soil depths where soil pH varies in order of FD1 > FD2 < FD3 < FD4 (Figure 4). It is also important to note that the soil pH initially decreased non-significantly from the first to the second FD, and thereafter increased significantly for all treatments except in the control treatment (T1Figure 4B), reaching more favorable soil conditions for crop growth on last two FDs. Referencing the results for the soil pH, all treatments increased temporally (Figure 4A,B). Perhaps this may be attributed to the period of no rainfall from September 10 to 29. Biochar does increase soil pH, as demonstrated by the T3 plots; however, this was not significant as suggested by Chintala et al. [5] and Molnár et al. [6]. As mentioned earlier, when soil pH increases, Al3+ precipitates as hydroxy-Al polymers, allowing more space for adsorption of other cations to the clay particle surfaces [7].

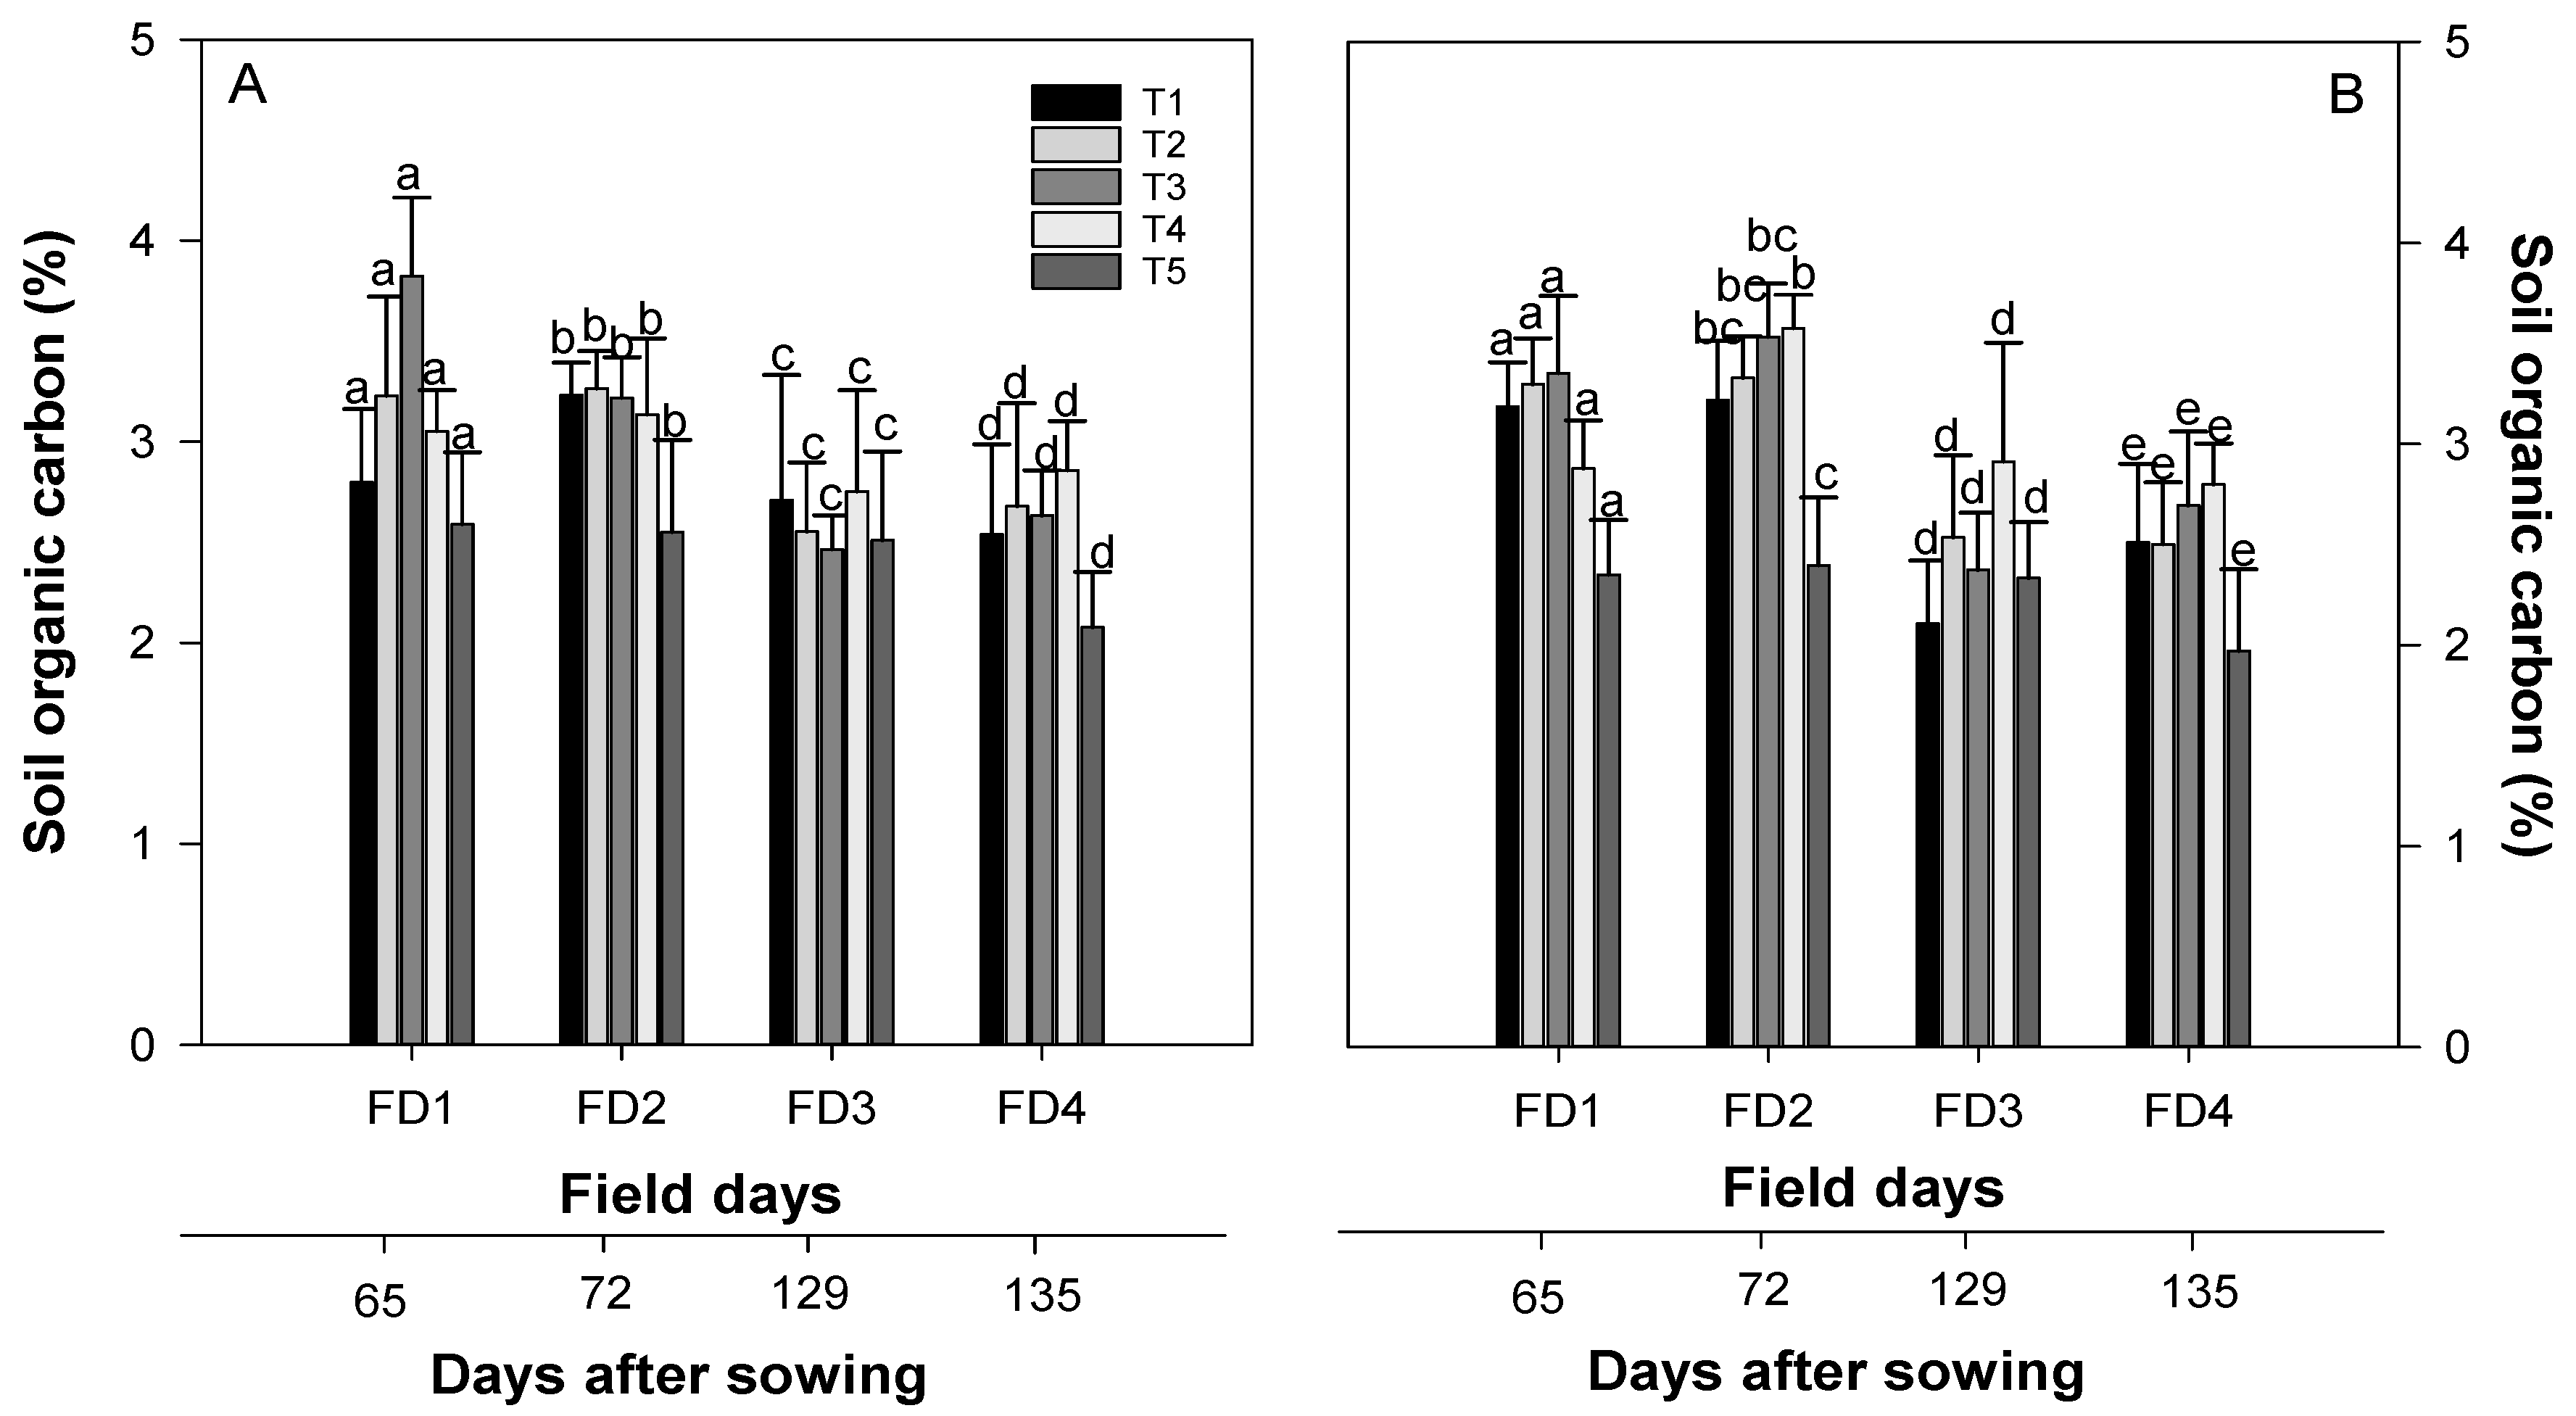
3.3. Effect of Soil Amendments on Soil Organic Carbon

SOC varied non-significantly (p > 0.05) among the five studied nutrient management treatments within each FD at 0–10 cm soil depth (Figure 5A). However, T3 treatment comparatively had a higher amount of SOC on the FD1 (65 days after treatment application) compared to the other treatments. Significant (p > 0.05) temporal variations were observed in SOC in order of FD1 > FD2 > FD3 > FD4 (Figure 5A). Significant (p = 0.04) differences were recorded in SOC at 10–20 cm soil depth between T4 and T5 on FD2 (72 DAS) as depicted in Figure 5B. However, no-significant differences (p > 0.05) were found among the other treatments on FD1, FD3 and FD4 (Figure 5B). There were no significant temporal variations among all nutrient management treatments across all four FDs (Figure 5B). As observed at 0–10 cm soil depth (Figure 5A), T3 again had higher SOC values on FD1. However, T4 had higher SOC on all other FDs. T5 had the lowest SOC values throughout most FDs at both soil depths. These results follow the norm and suggest that SOC does not change within short time periods. SOC content varied from 1.27% to 4.58%, with an average value of 2.85% irrespective of treatment or field day in the experimental field. These values are typical of most agricultural soils in NL. SOC remained fairly constant for all treatments temporally, as was expected over the time frame of the experiment. The effect of biochar was slightly high for T3, as it initially had the highest SOC at both the 0–10 cm and 10–20 cm depths (Figure 5A,B). This was expected, as biochar has been shown to increase SOC [33,34]. T5, however, did not increase SOC, but rather decreased it, as it was lower than the control for most FDs. This (SOC) was significantly lower than T4 at the 10–20 cm depth on the second FD (72 DAS), indicating that the combination of DM + biochar, over a short period of time, decreases SOC. If the experiment was conducted over a longer time frame, this might be different. DM seems to increase SOC, as it had the highest SOC content for the 0–10 cm and 10–20 cm depth. This is expected, and consistent with the findings of Haynes and Naidu [7] who also demonstrated that adding DM to soils does increase SOC.

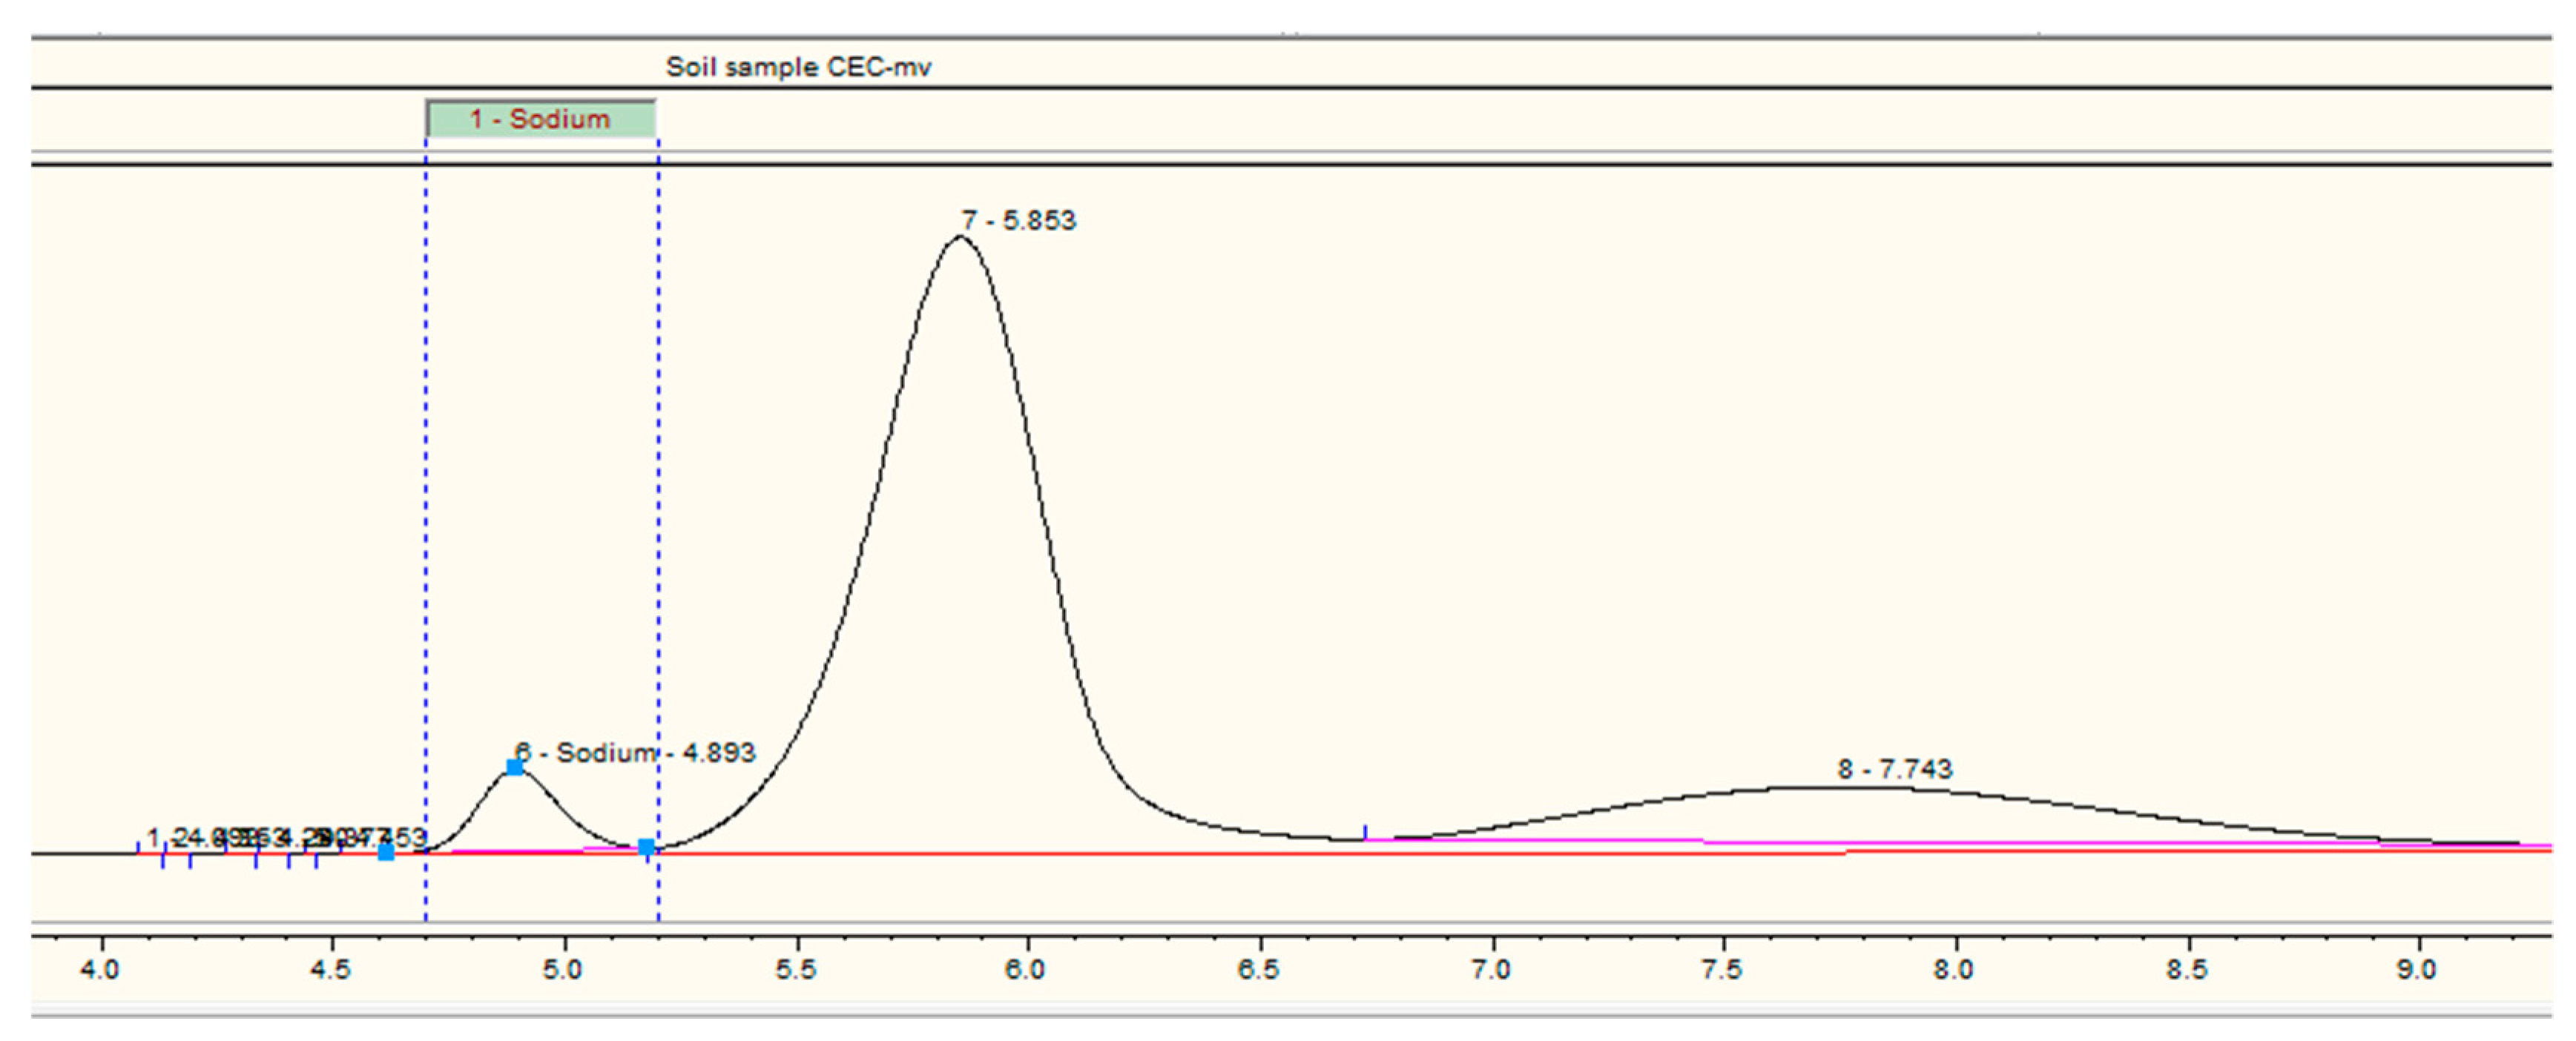
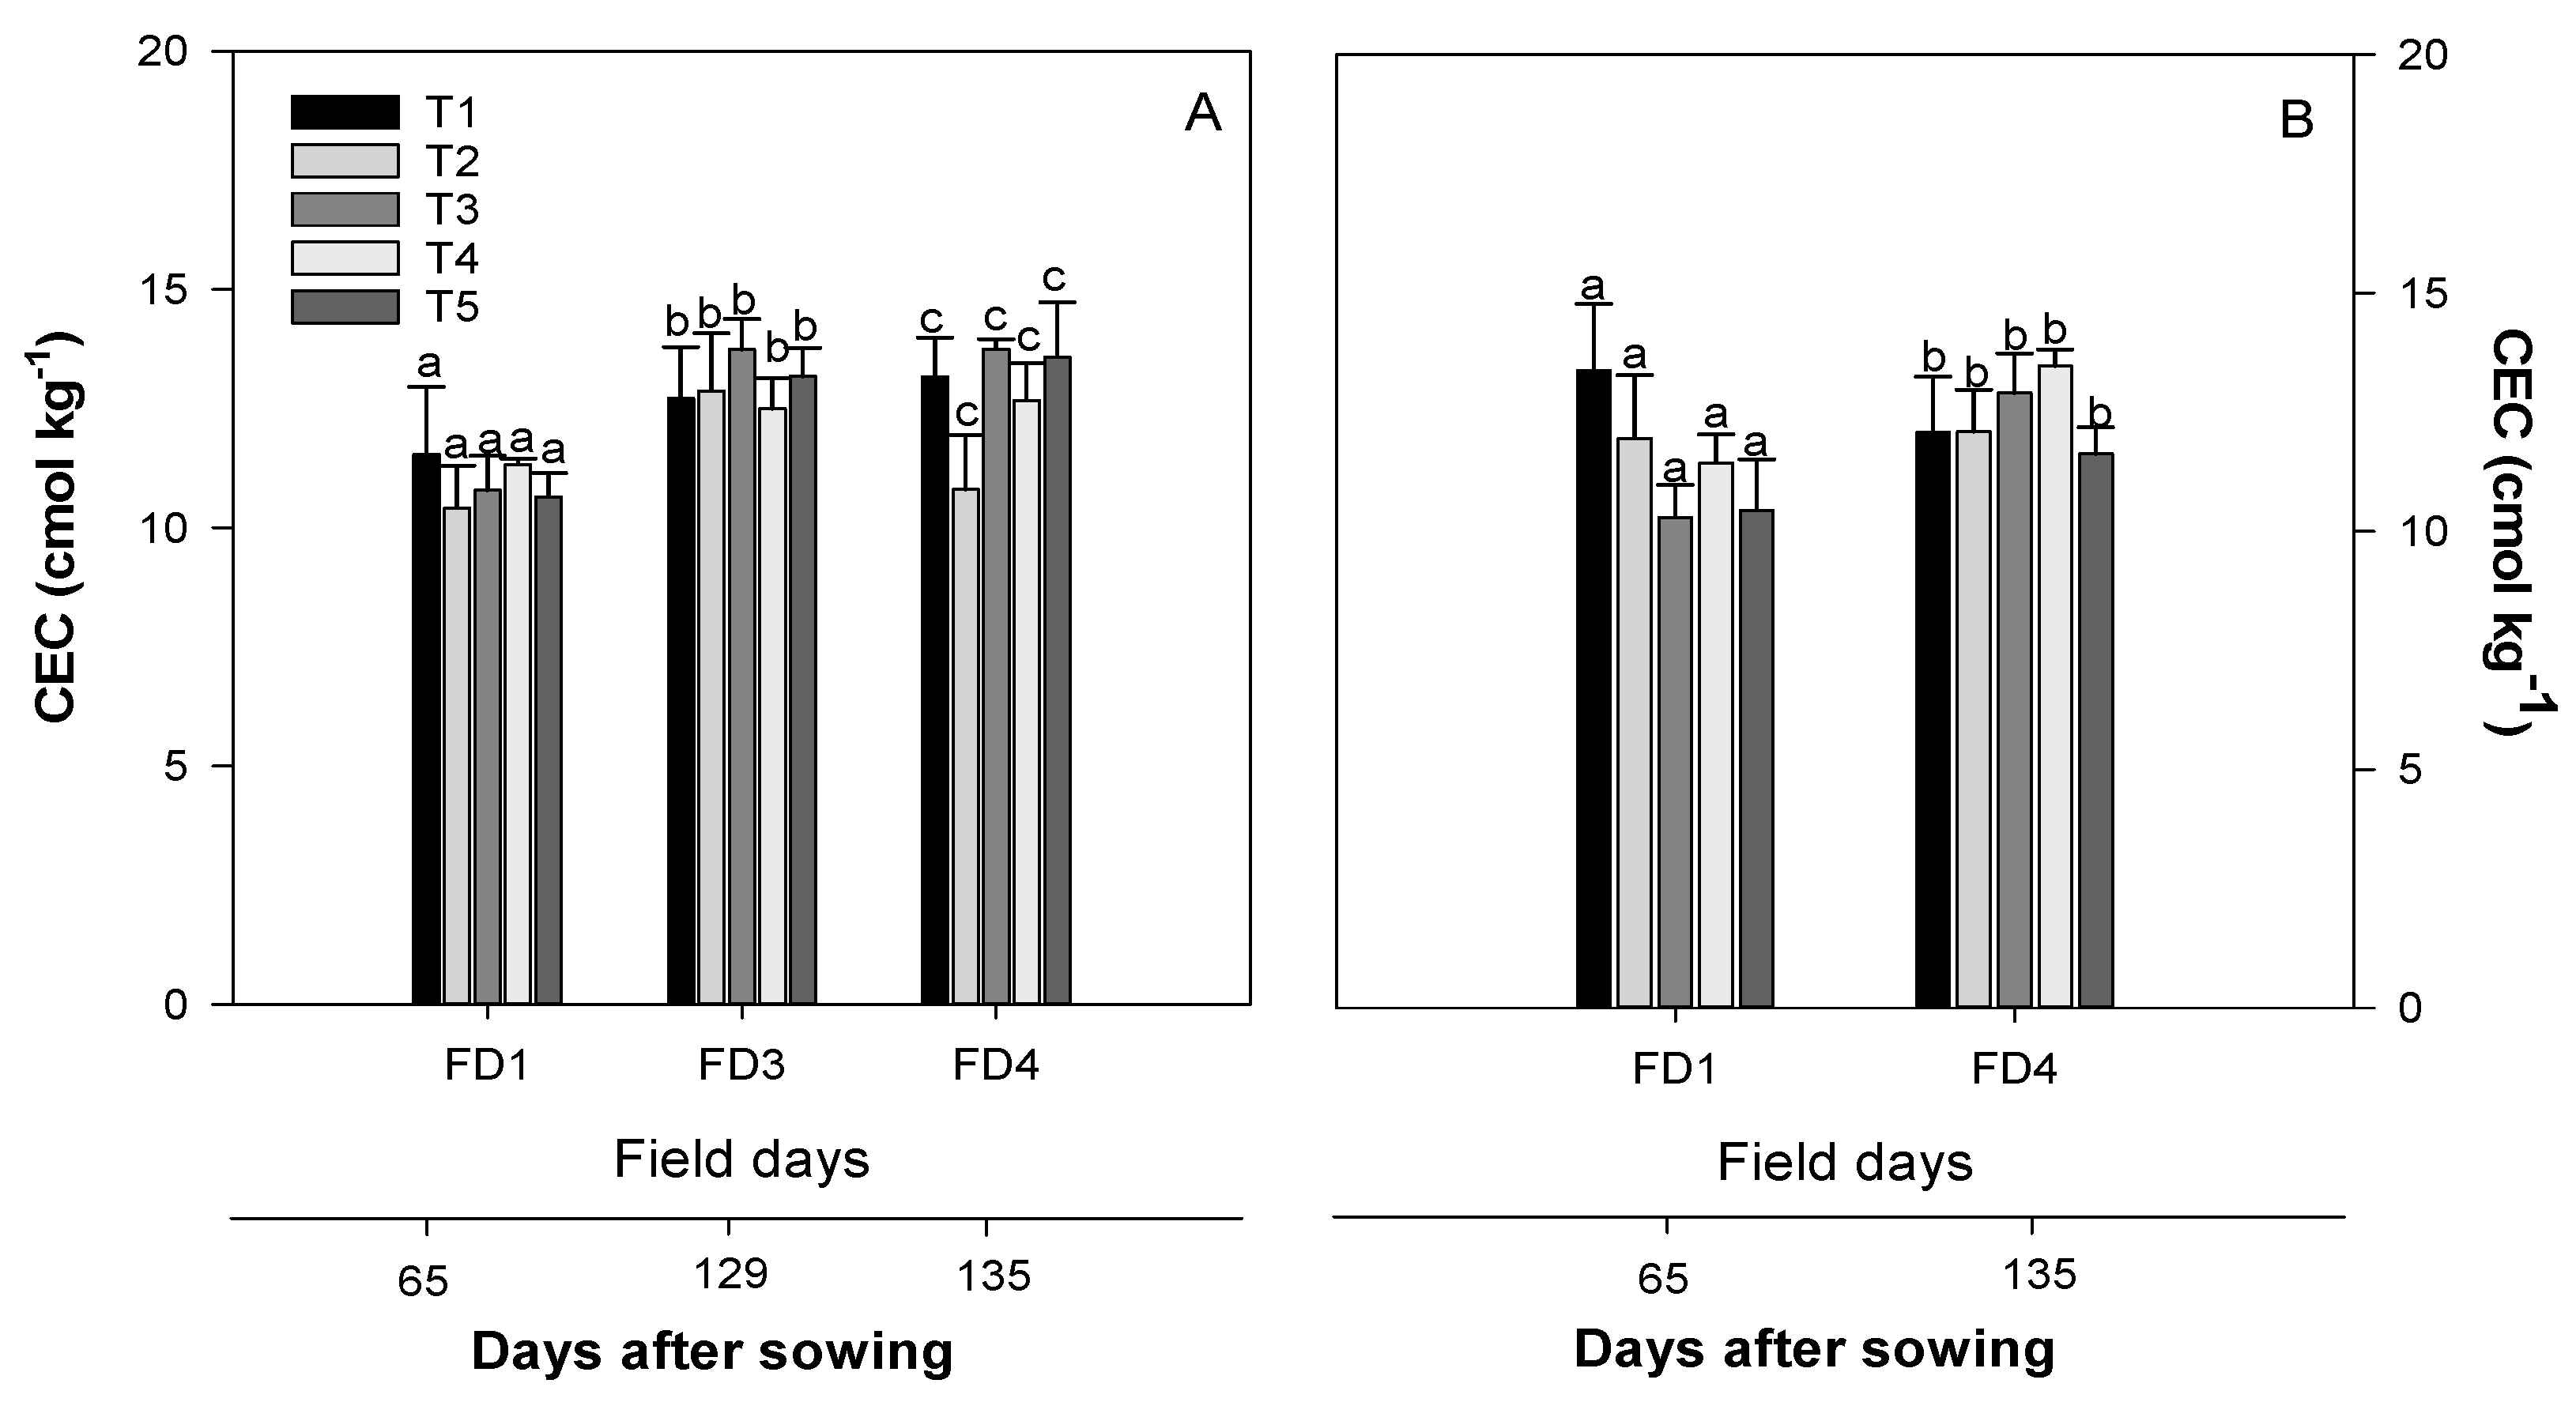
3.4. Effect of Soil Amendments on Cation Exchange Capacity

The average CEC value based on a soil report at the beginning of 2016 was 12.5 cmol kg−1 [40]. The CEC values obtained in this study ranged from approximately 8.2 to 15.7 cmol kg−1 for all treatments tested, with an average CEC of 12.6 cmol kg−1. This value falls within the range of CEC values expected for agricultural soils. No significant differences (p > 0.05) were observed among soil nutrient management treatments for CEC at 0–10 cm (Figure 6A) and 10–20 cm soil depths (Figure 6B). However, T1 treatment had higher CEC values on FD1 (65 DAS) at 0–10 cm soil depth (Figure 6A), and T3 expressed similar trends on FD3 (30 September) and FD4 (135 DAS). The values for CEC slightly increased (not significant) across field days at 0–10 cm depth, but remained fairly stable at 10–20 cm depth. T3 and T5 also increased across the field days, although not statistically significant (Figure 6A,B), indicating that biochar does potentially have an effect on increasing CEC over time within one field season [5,19]. A positive effect of DM on CEC could also be observed for T4. On the other hand, CEC decreased substantially for T2 from FD3 to FD4. However, since the heterogeneity in the field conditions are very high, the study should be conducted over a longer time frame to test the effect of biochar on CEC values. T1 appeared to have higher CEC values on FD1 (65 DAS) at 10–20 cm soil depth (Figure 6B), whereas T4 expressed similar trends on FD4 (135 DAS). T3 and T4 significantly increased the CEC from the first to the fourth field day at this depth (Figure 4B). T2, T3, T4, and T5 had no significant effect on increasing CEC during the 3.5 month time period at 0–10 cm depth. However, there was no statistically significant difference between the two depths for all treatments. In general, these results indicate CEC tends to increase over time for the experimental plots treated with biochar (T3 and T5), as expected [12,14]. However, it is important to note that the testing period was too short for this study to observe a significant effect on CEC for the biochar treatments, as CEC increases when biochar ages [20]. On the other hand, a general trend of slightly increasing CEC values can be observed for all treatments (except T2, which decreased on October 6) for the 0–10 cm depth. This could be attributable to the gradual increase in soil pH (Figure 6A,B), as an increase in soil pH has been shown to increase CEC [41]. CEC remained fairly constant for all treatments temporally, as would be expected over a short period of time. The effect of biochar could also be seen in T3 and T5, as CEC increased, although not significantly, across the FDs [5,19]. T5 had the second highest CEC value at the 0–10 cm depth for the last day, while T3 had the highest at both depths on the last day (Figure 6A,B). As biochar ages, the spontaneous oxidation reactions that occur will cause CEC to increase through addition of functional oxygenated groups, thereby causing its surface charge to be more negative, due to more cations being adsorbed onto its surface [20].
As a result, it is recommended to test CEC over long-term experiments [20]. CEC increased for all other treatments at the 0–10 cm depth (except for T2, which decreased on October 6). This may be attributed to the soil pH, as an increase in soil pH has been shown to increase CEC [37].

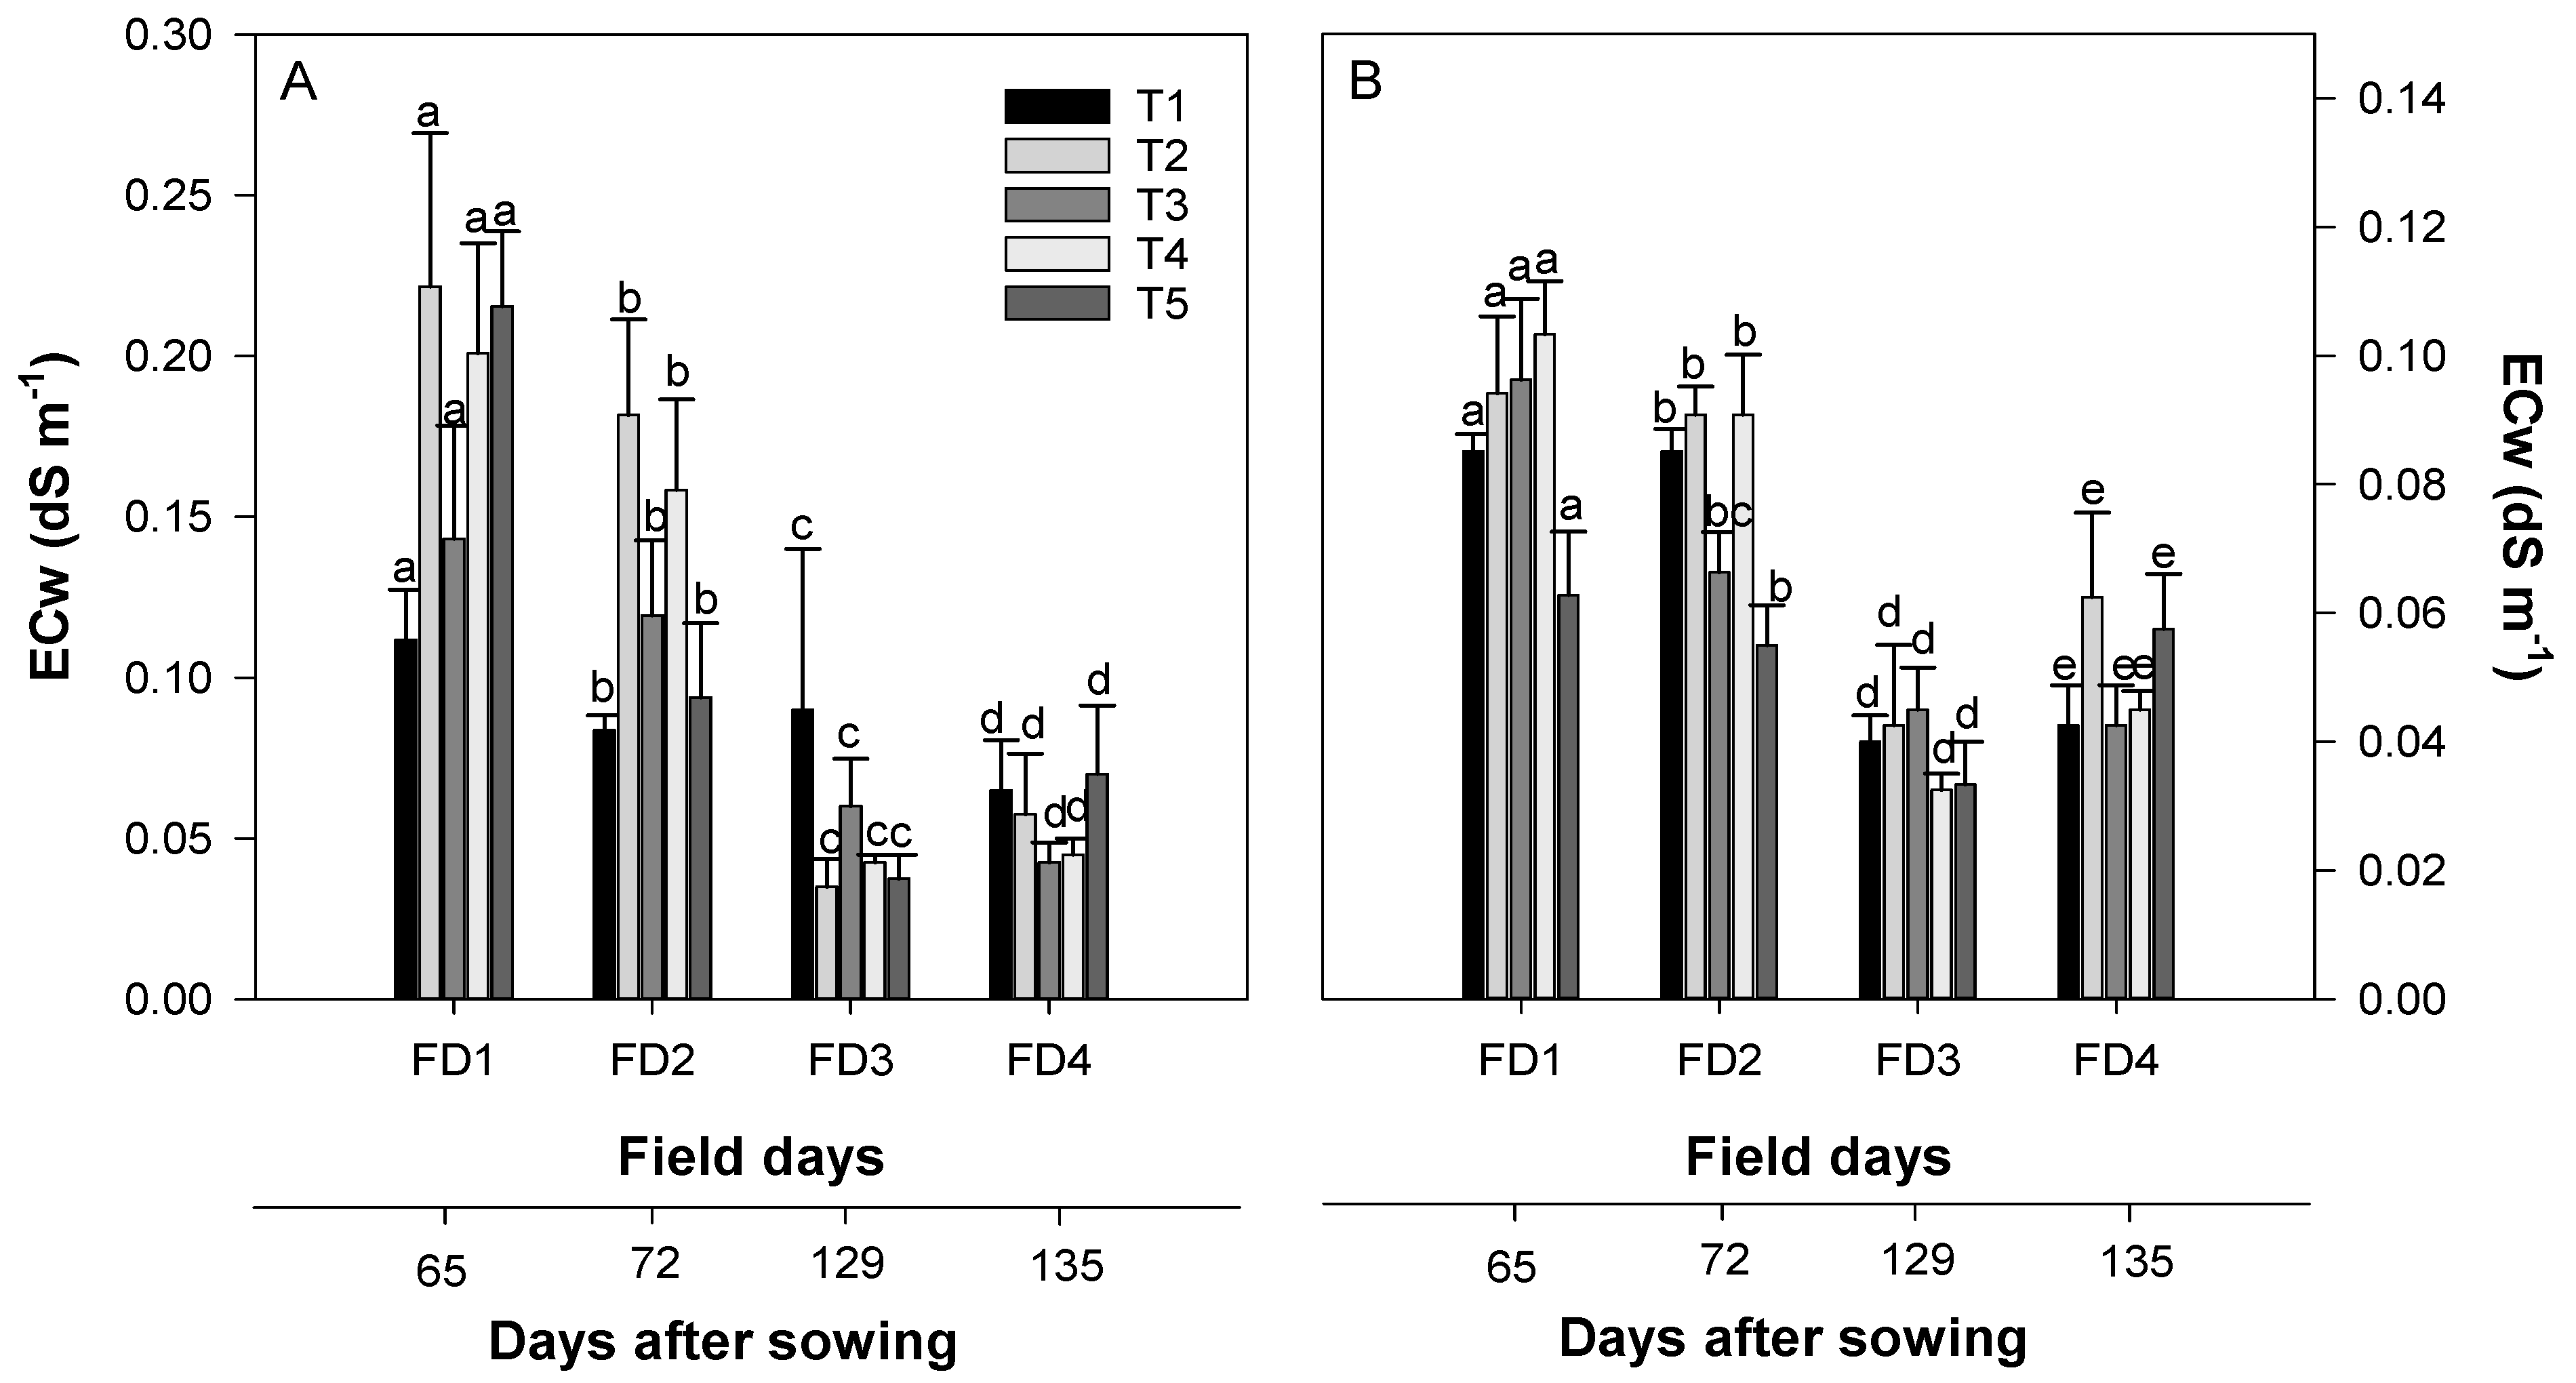
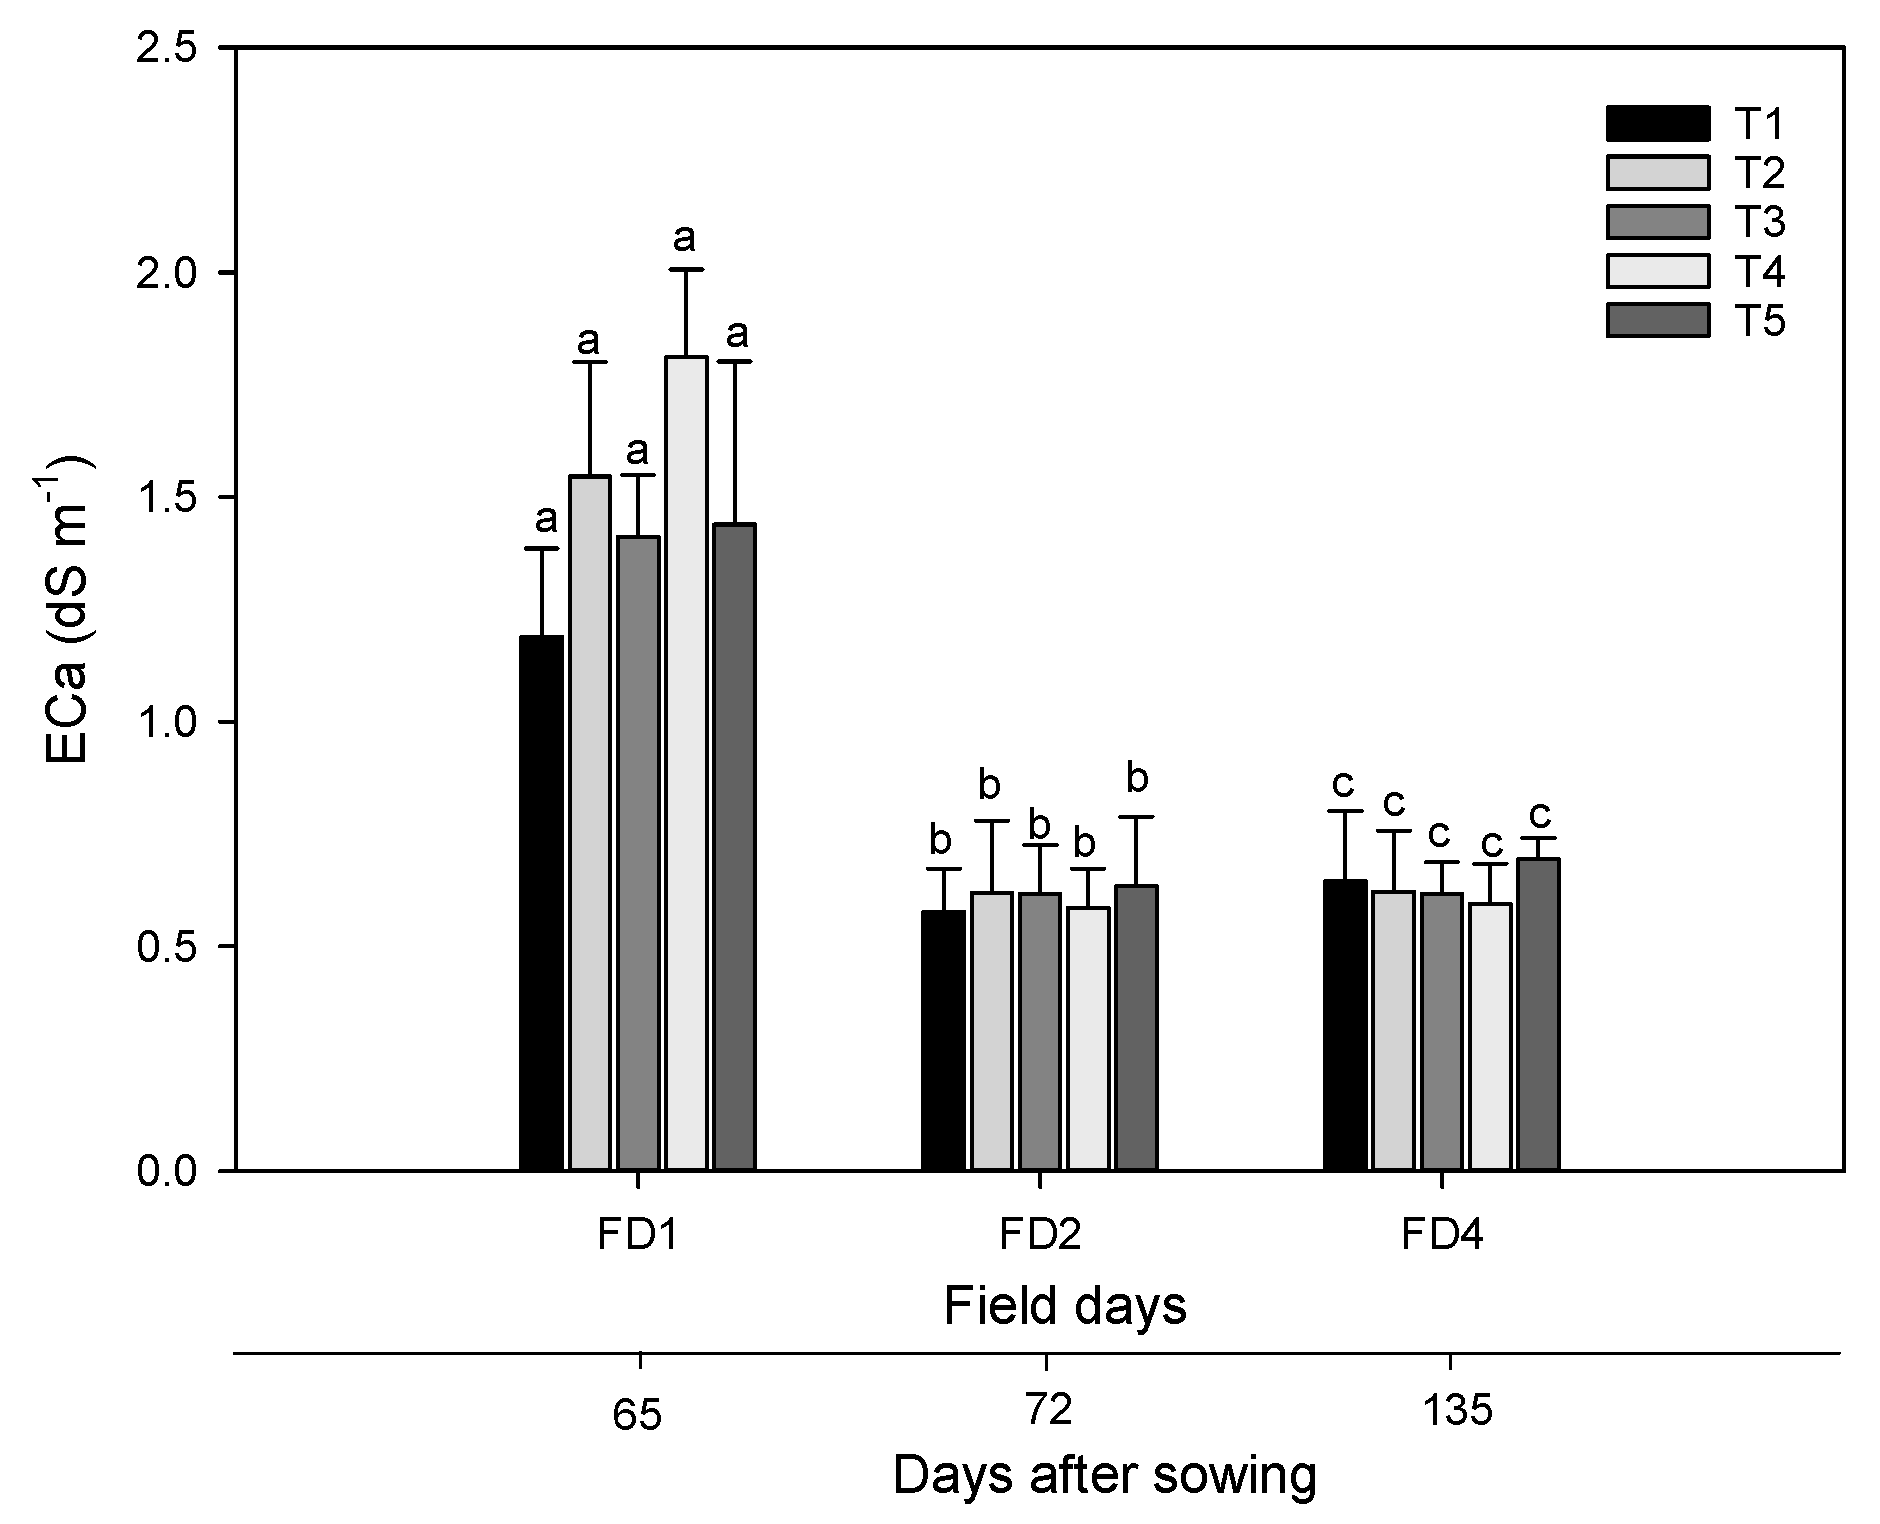
3.5. Effect of Soil Amendments on ECw and ECa

There was no significant difference (p > 0.05) among soil nutrient management treatments on ECw at 0–10 cm soil depth (Figure 7A). T2 had the highest value on the first and second days (65 DAS and 72 DAS), which could be due to an increase in ionic concentration with applications of inorganic fertilizer (Figure 7A). However, significant temporal variations were observed for ECw at 0–10 cm soil depth and varied in order of FD1 > FD2 > FD3 > FD4 (Figure 7A). DM application (T4) had relatively high ECw values for FD1 and FD2, potentially due to the higher nutrient concentrations in DM.
A significant reduction in ECw was observed from T2 to T5 on FD3 (129 DAS) and FD4 (135 DAS) at 0–10 cm depth, potentially due to absorption of nutrients by plants, or most probably due to gaseous or leaching losses (Figure 7A). ECw values were quite low at 10–20 cm soil depth, although there was no significant difference between the values across the two soil depths evaluated in this study. A significant difference was recorded among different soil nutrient management treatments on FD2 (T1–T5, p = 0.028; T2–T5, p = 0.008; T4–T5, p = 0.008) as depicted in Figure 7B; however, no significant differences were observed on other FDs. DM applications (T4) showed the highest ECw on FD1 (65 DAS), while IN (T2) and IN + biochar (T3) had the highest values on FD2 (72 DAS). IN + biochar (T3) had the highest ECw values on FD3, whereas T2 and T5 expressed higher ECw values on FD4 (135 DAS). ECw values increased slightly on FD4 (except T3) compared to FD3, more than likely due to slow release properties of the fertilizer, or leaching of the fertilizer into the deeper layers of the soil.
In general, ECw decreased over the crop growth period in all soil amendments, which might be attributed to uptake of nutrients by growing plants, immobilization, or losses due to leaching and volatilization. An increase in soil ECw can be expected when ion concentrations are high. In DM and IN, it could be expected that ammonium concentration would be high initially. As ammonium-nitrogen (NH4+-N) is water-soluble, ECw will primarily measure these and other water-soluble ions. This can be seen from the initial high ECw values for T2 and T4 especially [42]. Adding biochar to these plots may increase the concentration of these water-soluble ions more in the long run, decreasing losses of these ions, and causing ECw to decrease at a slower rate [5,6].
For the ECa values (only for 0–11 cm depth based on the probe length) obtained using the HD2 probe (IMKO GmbH, Germany), there was no significant difference among treatments (p > 0.05) within each field day. When referring to Figure 8, T4 had the highest value on the first field day (65 DAS). On the third and last FDs (129 DAS and 135 DAS), T5 had the highest value. ECa values also decreased significantly from FD1 to FD3 (day 2 data are not available for T2, T3, T4, and T5 and not included in this analysis). The field measured ECa shows the same trend as the laboratory measured ECw. This behavior clearly shows the reduction in ionic concentration of soil across the growing season due to nutrient uptake by plants, or losses due to leaching and volatilization [5].
For ECw and ECa measurements, values decreased temporally. ECw values were mostly lower in the 10–20 cm depth than the 0–10 cm depth as a result of ion presence being higher on the top layers of the soil initially, where the fertilizer and biochar were applied. The effect of biochar on EC could be seen for T5 [13], as the values again increased on the last field day for ECa and both depths for ECw (135 DAS). The effect could not be seen for T3. However, values for T3 would more than likely also increase over a longer time frame. T2 and T4 had high ECw and ECa values initially, which was also expected, as EC has been shown to increase when there are high ion concentrations in the soil [9]. Hence, the temporal decrease for most treatments can be attributed to the decrease in ion concentrations due to leaching or uptake by plants.
Another potential cause for different variability could be due to the sampling locations and number of samples collected from the plots. Each plot has an area of 1 m x 6 m, and stratified samples were collected only from three locations within each plot. Due to high soil variability and manual mixing of biochar, this might have affected on the high variability observed in biochar treated plots. On the other hand, DM was applied as a liquid, and so it is possible for it to be mixed better within the entire treatment plot compared to that of biochar.

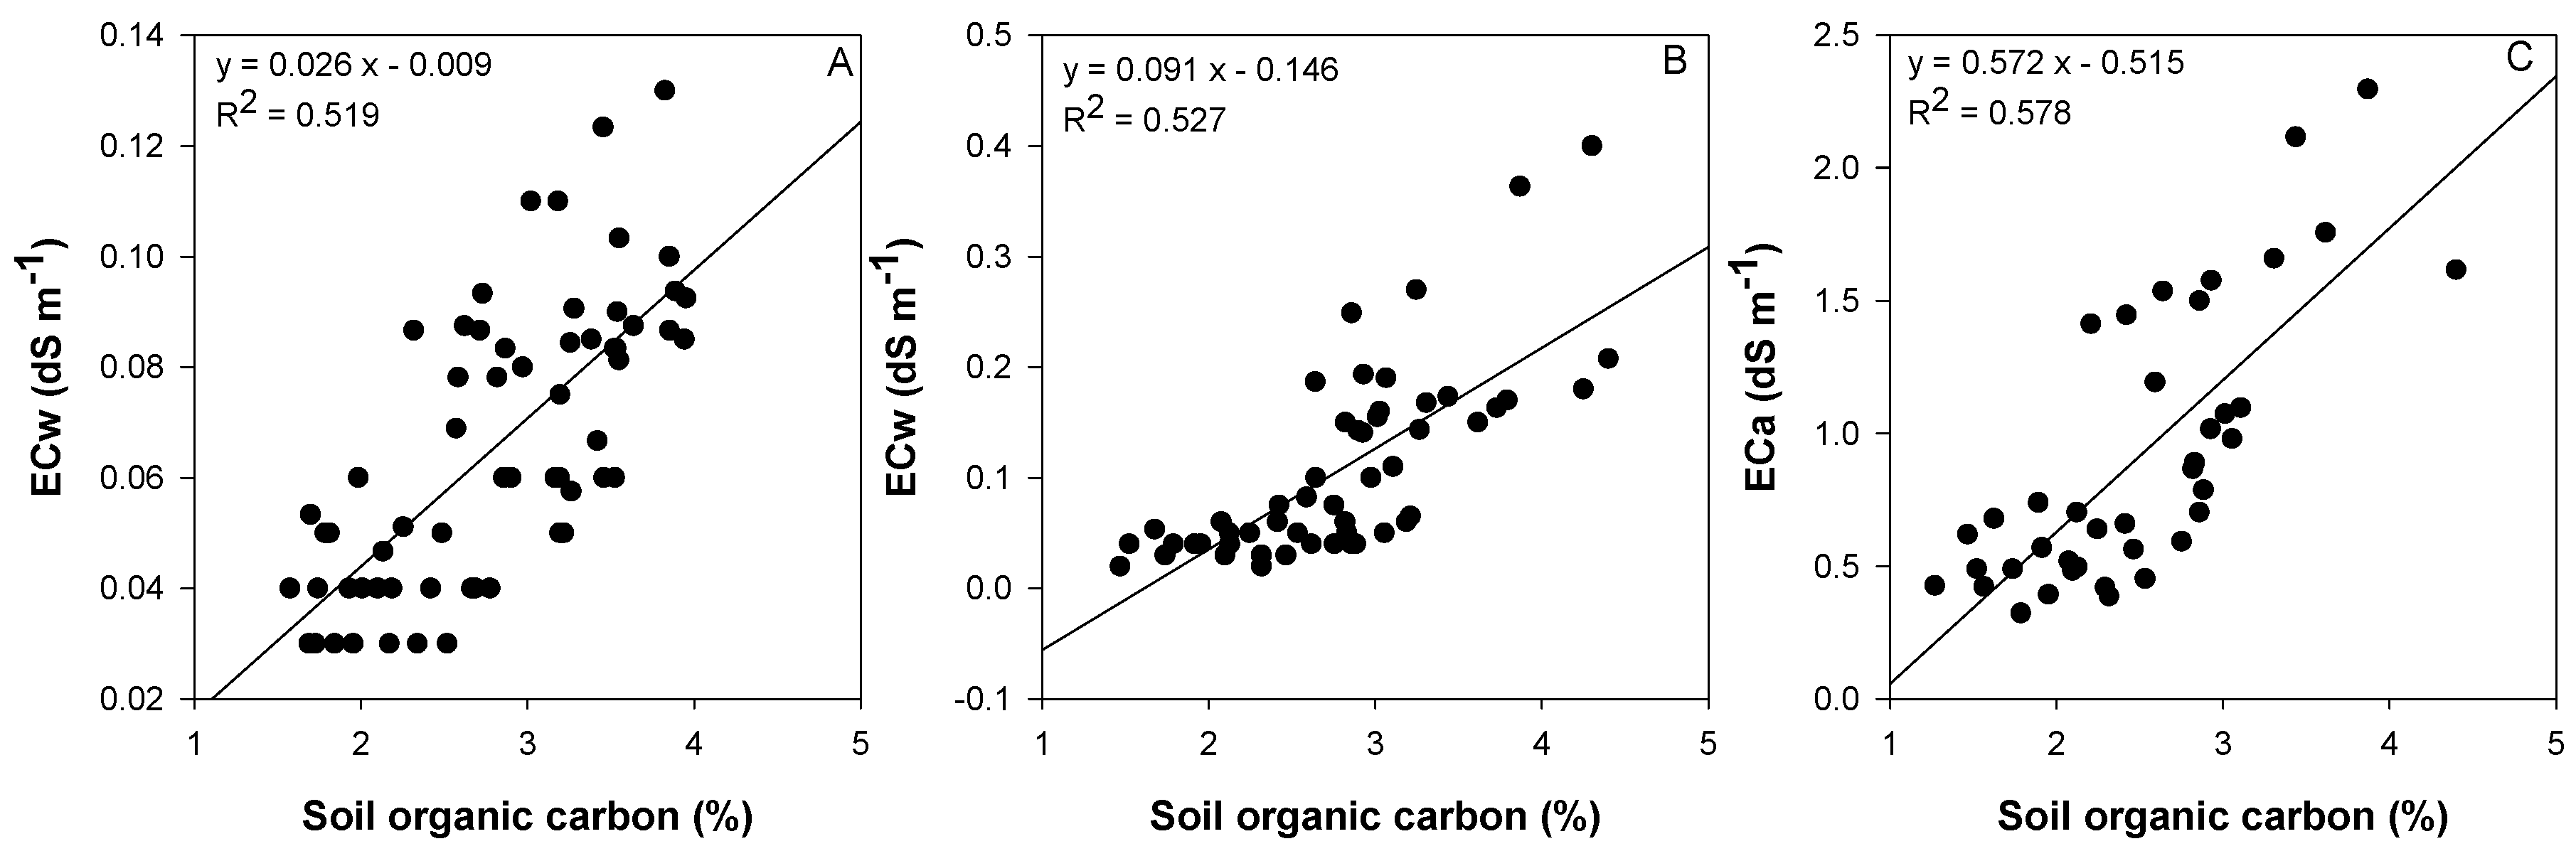
3.6. Relationship among Soil EC and Soil Organic Carbon

A significant (p = 0.000) positive Pearson’s correlation (r = 0.578) was recorded between soil ECa and SOC (Figure 9A). A similar trend was observed between soil ECa and SOC at 0–10 cm (p = 0.000 and r = 0.5276) (Figure 9B) and 10–20 cm soil depths (p = 0.000, r = 0.51974) irrespective of FDs. However, SOC has a stronger correlation (r = 0.57814) with ECa than ECw (r = 0.5276 or r = 0.51974), which may indicate that ECa is more closely correlated with SOC. When referring to Figure 9A–C, it can be seen that significant correlations were obtained for SOC with ECa [43] and ECw at both depths (ECa, ECw 0–10 cm, & ECw 10–20 cm, p = 0.000). It would be assumed that SOC is more closely correlated with ECa than ECw, as ECa measures the bulk properties of the soil, such as SOC.

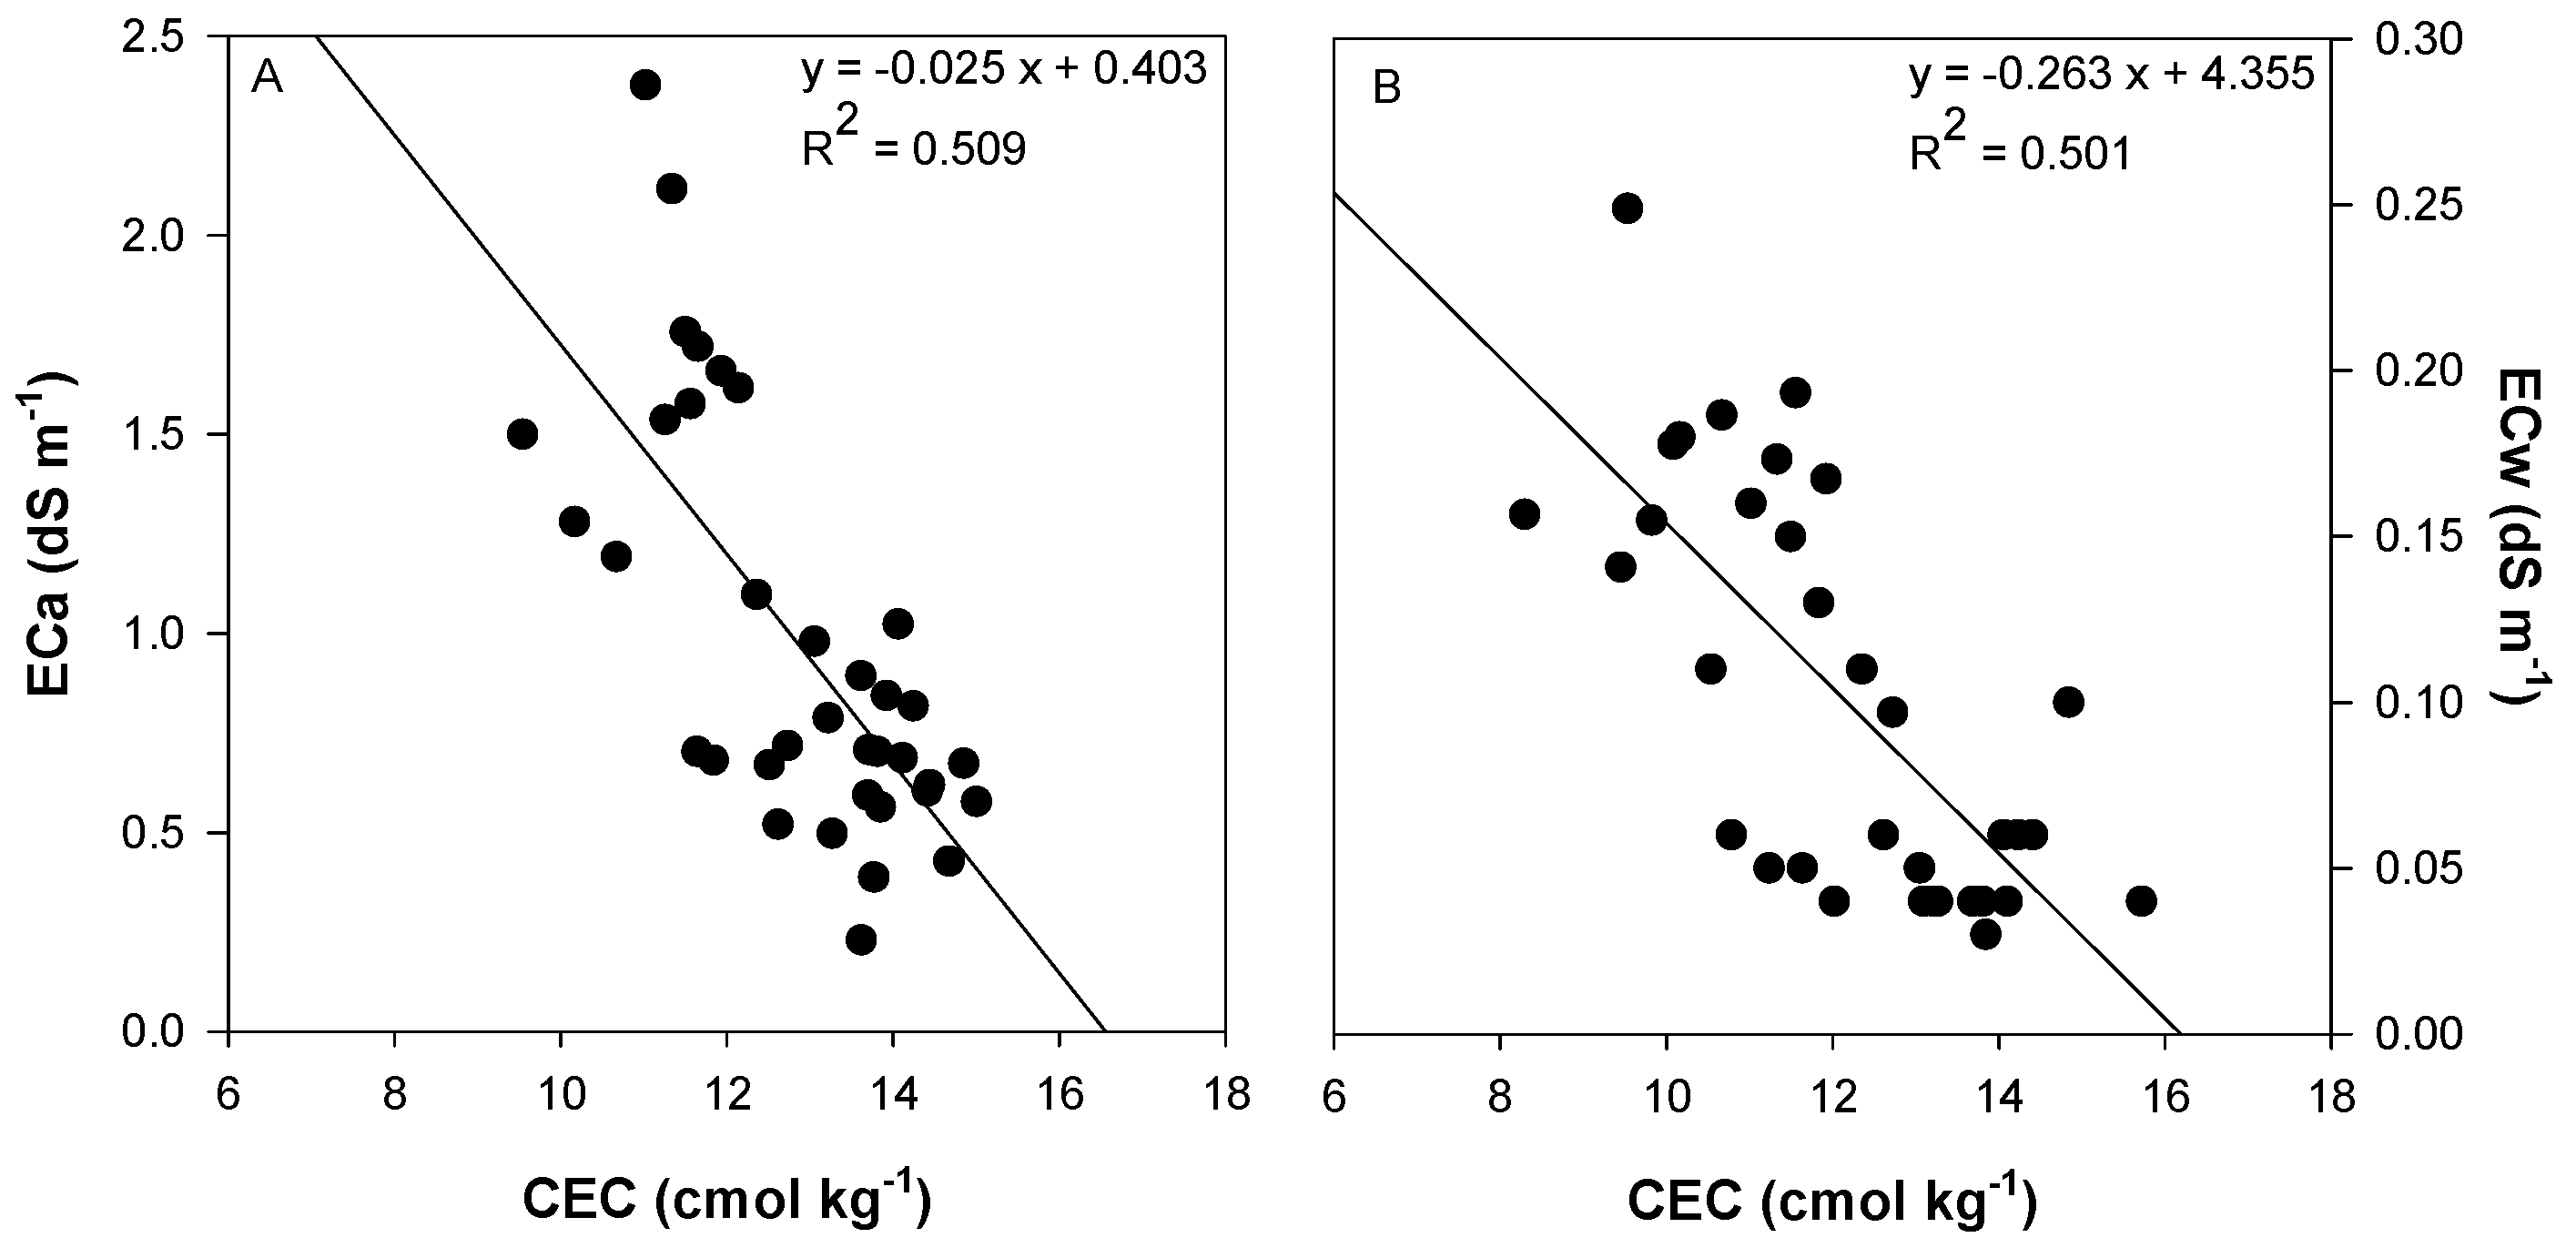
3.7. Relationship among Soil ECa, ECw and CEC

Significant negative correlations (p = 0.000) were observed between CEC, ECw (Figure 10A) and ECa (Figure 10B) at 0–10 cm depth when comparing CEC with ECa and ECw across all FDs irrespective of treatments. This can be accounted for by the increase in CEC, while ECa and ECw decreased temporally, as discussed earlier.
We observed that ECw and ECa can be correlated significantly with SOC (Figure 9) and CEC (Figure 10) with reasonably acceptable R2 values regardless of FDs and treatments. Considering significant associations were obtained, ECa measurements alone can be made and related back to the SOC and CEC measurements without these having to be measured directly, saving money, time, and labor.

4. Conclusions

Biochar was shown to have positive effects on the measured physicochemical properties of the soils obtained in the silage corn field at PBRS over the 3.5 month time frame of this experiment. pH decreased on FD2, and then increased significantly at FD3 and FD4 within days, irrespective of treatments. SOC was highest initially for T3, while T5 had fairly low SOC for all field days. T3 and T5 did increase CEC the most out of all treatments in the 0–10 cm depth. For ECw and ECa, T5 increased on the last day, indicating that the combination of DM + biochar is effective in increasing ECw. If these tests were to be done over a longer time frame, it is assumed that the positive effects of BC will be amplified, showing significant increases of these physicochemical properties. Enhancing these soil properties may potentially enhance soil health, and as a result, soil fertility and crop productivity. Significant correlations were found for ECw and ECa with SOC and CEC data. However, further investigation between ECa data and soil properties should be carried out to address uncertainties associated in predicting these properties before using ECa as soil proxy to map soil’s physicochemical properties over large areas. If EMI can be used, continuous, large, and non-point scale measurements can be made without having to disturb the soil, saving a lot of labor, time, and money. This will be used to map the spatio-temporal variability of important soil properties of Newfoundland. From this study, it can be concluded that DM has great potential to be used as a soil amendment in podzolic soils to provide nutrients for growing crops, whereas biochar could increase the cation exchange capacity and pH of podzolic boreal soils, reducing the liming requirement and benefiting the environment. Further studies are required to evaluate the effects of different rates of biochar, its sources, and particle size along with nutrient management strategies on physicochemical properties of podzol soils in boreal ecosystems.

Author Contributions

Conceptualization, L.G., M.C.; methodology, M.V., M.N., L.G.; formal analysis, M.V., M.N.; investigation, M.V., L.G., data collection, M.V.; resources, L.G., M.C.; writing—original draft preparation, M.V., L.G., M.N.; writing—review and editing, M.V., L.G., M.N., M.C., R.T.; funding acquisition, L.G.; project administration and supervision, L.G.

Funding

This research was funded by Research and Development Corporation (RDC) of Newfoundland (Ignite R&D program 5404-1962-101), Department of fisheries and land resources, Government of Newfoundland and Labrador for providing site and facilities for field works, the School of Science and the Environment of Memorial University of Newfoundland for providing lab facilities.

Acknowledgments

The authors would like to thank Dinushika Wanniarachchi, Meghan Power, Bumo Mgabe, Emmanuel Badewa, Kamalesh Sadatcharam, Crystal McCall, and Yuan Tao for helping during field and laboratory works.

Conflicts of Interest

The authors declare no conflict of interest. The funders had no role in the design of the study; in the collection, analyses, or interpretation of data; in the writing of the manuscript, or in the decision to publish the results.

References

  1. Gov, N.L. The Way Forward: A Vision for Sustainability and Growth in Newfoundland and Labrador. Available online: https://www.flr.gov.nl.ca/agriculturesummit/workplan.html (accessed on 10 July 2016).
  2. Amon, B.; Kryvoruchko, V.; Amon, T.; Zechmeister-Boltenstern, S. Methane, nitrous oxide and ammonia emissions during storage and after application of dairy cattle slurry and influence of slurry treatment. Agric. Ecosyst. Environ. 2006, 112, 153–162. [Google Scholar] [CrossRef]
  3. Huang, J.; Sui, P.; Gao, W.; Chen, Y. Effect of maize-soybean intercropping on soil nitrous oxide emissions in silt loam soil of the North China plain. Pedosphere 2017. [Google Scholar] [CrossRef]
  4. Sanborn, P.; Lamontagne, L.; Hendershot, W. Podzolic soils of Canada: Genesis, distribution, and classification. Can. J. Soil Sci. 2011, 91, 843–880. [Google Scholar] [CrossRef]
  5. Chintala, R.; Mollinedo, J.; Schumacher, T.E.; Malo, D.D.; Julson, J.L. Effect of biochar on chemical properties of acidic soil. Arch. Agron. Soil Sci. 2014, 60, 393–404. [Google Scholar] [CrossRef]
  6. Molnár, M.M.; Vaszita, E.; Farkas, É.; Ujaczki, É.; Fekete-Kertész, I.; Tolner, M.; Klebercz, O.; Kirchkeszner, C.; Gruiz, K.; Uzinger, N.; et al. Acidic sandy soil improvement with biochar—A microcosm study. Sci. Total Environ. 2016, 563, 855–865. [Google Scholar] [CrossRef] [PubMed]
  7. Haynes, R.J.; Naidu, R. Influence of lime, fertilizer and manure applications on soil organic matter content and soil physical conditions: A review. Nutr. Cycl. Agroecosyst. 1998, 51, 123–137. [Google Scholar] [CrossRef]
  8. Li, H.; Dong, X.; da Silva, E.B.; de Oliveira, L.M.; Chen, Y.; Ma, L.Q. Mechanisms of metal sorption by biochars: Biochar characteristics and modifications. Chemosphere 2017, 178, 466–478. [Google Scholar] [CrossRef] [PubMed]
  9. Woolf, D.; Amonette, J.E.; Street-Perrott, F.A.; Lehmann, J.; Joseph, S. Sustainable biochar to mitigate global climate change. Nat. Commun. 2010, 1, 56. [Google Scholar] [CrossRef] [Green Version]
  10. Wang, D.; Fonte, S.J.; Parikh, S.J.; Six, J.; Scow, K.M. Biochar additions can enhance soil structure and the physical stabilization of C in aggregates. Geoderma 2017, 303, 110–117. [Google Scholar] [CrossRef] [Green Version]
  11. Randolph, P.; Bansode, R.R.; Hassan, O.A.; Rehrah, D.; Ravella, R.; Reddy, M.R.; Watts, D.W.; Novak, J.M.; Ahmedna, M. Effect of biochars produced from solid organic municipal waste on soil quality parameters. J. Environ. Manag. 2017, 192, 271–280. [Google Scholar] [CrossRef]
  12. Subedi, R.; Taupe, N.; Ikoyi, I.; Bertora, C.; Zavattaro, L.; Schmalenberger, A.; Leahy, J.J.; Grignani, C. Chemically and biologically-mediated fertilizing value of manure-derived biochar. Sci. Total Environ. 2016, 550, 924–933. [Google Scholar] [CrossRef] [PubMed]
  13. Atkinson, C.J.; Fitzgerald, J.D.; Hipps, N.A. Potential mechanisms for achieving agricultural benefits from biochar application to temperate soils: A review. Plant Soil 2010, 337, 1–18. [Google Scholar] [CrossRef]
  14. Khare, P.; Dilshad, U.; Rout, P.K.; Yadav, V.; Jain, S. Plant refuses driven biochar: Application as metal adsorbent from acidic solutions. Arab. J. Chem. 2017, 10, S3054–S3063. [Google Scholar] [CrossRef] [Green Version]
  15. Matovic, D. Biochar as a viable carbon sequestration option: Global and Canadian perspective. Energy 2011, 36, 2011–2016. [Google Scholar] [CrossRef]
  16. Amendola, C.; Montagnoli, A.; Terzaghi, M.; Trupiano, D.; Oliva, F.; Baronti, S.; Miglietta, F.; Chiatante, D.; Scippa, G.S. Short-term effects of biochar on grapevine fine root dynamics and arbuscular mycorrhizae production. Agric. Ecosyst. Environ. 2017, 239, 236–245. [Google Scholar] [CrossRef]
  17. Reed, E.Y.; Chadwick, D.R.; Hill, P.W.; Jones, D.L. Critical comparison of the impact of biochar and wood ash on soil organic matter cycling and grassland productivity. Soil Biol. Biochem. 2017, 110, 134–142. [Google Scholar] [CrossRef] [Green Version]
  18. Tan, X.-F.; Liu, S.-B.; Liu, Y.-G.; Gu, Y.-L.; Zeng, G.-M.; Hu, X.-J.; Wang, X.; Liu, S.-H.; Jiang, L.-H. Biochar as potential sustainable precursors for activated carbon production: Multiple applications in environmental protection and energy storage. Bioresour. Technol. 2017, 227, 359–372. [Google Scholar] [CrossRef] [PubMed]
  19. Githinji, L. Effect of biochar application rate on soil physical and hydraulic properties of a sandy loam. Arch. Agron. Soil Sci. 2014, 60, 457–470. [Google Scholar] [CrossRef]
  20. Lehmann, J.; Joseph, S. Biochar for Environmental Management; Earthscan: London, UK, 2009. [Google Scholar]
  21. Grisso, R.D.; Alley, M.M.; Wysor, W.G.; Holshouser, D.; Thomason, W. Precision Farming Tools: Soil Electrical Conductivity; Virginia Cooperative Extension; Virginia Tech University: Blacksburg, USA, 2009; Volume 1–6, pp. 442–508. [Google Scholar]
  22. Corwin, D.L.; Lesch, S.M. Apparent soil electrical conductivity measurements in agriculture. Comput. Electron. Agric. 2005, 46, 11–43. [Google Scholar] [CrossRef]
  23. Ristolainen, A.; Farkas, C.; Tóth, T. Prediction of soil properties with field geo-electrical probes. Commun. Soil Sci. Plan. 2009, 40, 555–565. [Google Scholar] [CrossRef]
  24. Altdorff, D.; Galagedara, L.; Unc, A. Impact of projected land conversion on water balance of boreal soils in western Newfoundland. J. Water Clim. Chang. 2017, 8, 613–626. [Google Scholar] [CrossRef]
  25. Altdorff, D.; Galagedara, L.; Nadeem, M.; Cheema, M.; Unc, A. Effect of agronomic treatments on the accuracy of soil moisture mapping by electromagnetic induction. Catena 2018, 164, 96–106. [Google Scholar] [CrossRef]
  26. Badewa, E.; Unc, A.; Cheema, M.; Kavanagh, V.; Galagedara, L. Soil moisture mapping using multi-Ffrequency and multi-coil electromagnetic induction sensors on managed podzols. Agronomy 2018, 8, 224. [Google Scholar] [CrossRef]
  27. Wanniarachchi, D.; Cheema, M.; Thomas, R.; Kavanagh, V.; Galagedara, L. Impact of soil amendments on the hydraulic conductivity of boreal agricultural podzols. Agriculture 2019, 9, 133. [Google Scholar] [CrossRef]
  28. Lugato, E.; Panagos, P.; Bampa, F.; Jones, A.; Montanarella, L. A new baseline of organic carbon stock in European agricultural soils using a modelling approach. Glob. Chang. Biol. 2014, 20, 313–326. [Google Scholar] [CrossRef] [PubMed]
  29. Zhao, G.; Bryan, B.A.; King, D.; Luo, Z.; Wang, E.; Song, X.; Yu, Q. Impact of agricultural management practices on soil organic carbon: Simulation of Australian wheat systems. Glob. Chang. Biol. 2013, 19, 1585–1597. [Google Scholar] [CrossRef] [PubMed]
  30. Häkkinen, M.; Heikkinen, J.; Mäkipää, R. Soil carbon stock increases in the organic layer of boreal middle-aged stands. Biogeosciences 2011, 8, 1279–1289. [Google Scholar] [CrossRef]
  31. Bhatti, J.S.; Apps, M.J.; Jiang, H. Examining the carbon stocks of boreal forest ecosystems at stand and regional scales. In Assessment Methods for Soil Carbon; Lal, R., Kimble, J.M., Follett, R.F., Stewart, B.A., Eds.; Lewis Publications: Boca Raton, FL, USA, 2011; pp. 513–532. [Google Scholar]
  32. He, Y.; Zhuang, Q.; Harden, J.W.; McGuire, A.D.; Fan, Z.; Liu, Y.; Wickland, K.P. The implications of microbial and substrate limitation for the fates of carbon in different organic soil horizon types of boreal forest ecosystems: A mechanistically based model analysis. Biogeosciences 2014, 11, 4477–4491. [Google Scholar] [CrossRef]
  33. Li, H.; Yutong, W.; Tianpei, W.; Hongrui, M. Effect of biochar on organic matter conservation and metabolic quotient of soil. Environ. Prog. Sustain. Energy 2015, 34, 1467–1472. [Google Scholar] [CrossRef]
  34. Sorrenti, G.; Masiello, C.A.; Dugan, B.; Toselli, M. Biochar physico-chemical properties as affected by environmental exposure. Sci. Total Environ. 2016, 563, 237–246. [Google Scholar] [CrossRef]
  35. Nadeem, M.; Pham, T.H.; Thomas, R.; Galagedara, L.; Kavanagh, V.; Zhu, X.; Ali, W.; Cheema, M. Potential role of root membrane phosphatidic acid in superior agronomic performance of silage-corn cultivated in cool climate cropping systems. Physiol. Plant. 2018, 1–12. [Google Scholar] [CrossRef] [PubMed]
  36. Liu, X.-y.; Qu, J.-j.; Li, L.-q.; Zhang, A.f.; Jufeng, Z.; Zheng, J.-w.; Pan, G.-x. Can biochar amendment be an ecological engineering technology to depress N2O emission in rice paddies?—A cross site field experiment from South China. Ecol. Eng. 2012, 42, 168–173. [Google Scholar] [CrossRef]
  37. Brady, N.C.; Weil, R.R. The Nature and Properties of Soils, 14th ed.; Pearson Prentice Hall: New Jersey, NJ, USA, 2008. [Google Scholar]
  38. Haluschak, P. Laboratory Methods of Soil Analysis, Canada-Manitoba Soil Survey; Haluschak, P., Ed.; Government of Manitoba: Winnipeg, MB, Canada, 2006. [Google Scholar]
  39. Van Reeuwijk, L.P. Procedures for Soil Analysis, 6th ed.; International Soil Reference and Information Centre: Wageningen, The Netherlands, 2002. [Google Scholar]
  40. Department of Natural Resources. Soil Test Report; Government of Newfoundland and Labrador: St. John’s, NL, Canada, 2014.
  41. Van Erp, P.J.; Houba, V.J.G.; van Beusichem, M.L. Actual cation exchange capacity of agricultural soils and its relationship with pH and content of organic carbon and clay. Commun. Soil Sci. Plan. 2001, 32, 19–31. [Google Scholar] [CrossRef]
  42. Manitoba Agriculture. Properties of Manure; Government of Manitoba: Winnipeg, MB, Canada, 2015.
  43. Martinez, G.; Muriel, J.L.; Vanderlinden, K.; Ordóñez, R. Can apparent electrical conductivity improve the spatial characterization of soil organic carbon? Vadose Zone J. 2009, 8, 586–593. [Google Scholar] [CrossRef]
Figure 1. Ion chromatography peaks showing clearly separated sodium and ammonium.
Agriculture 09 00183 g001
Figure 2. Mean average temperature (°C, solid line) and rainfall (mm, vertical bars) during the study period.
Agriculture 09 00183 g002
Figure 3. Temporal variations and effects of different soil amendments on gravimetric moisture content of soil at 0–10 cm (A) and 10–20 cm (B) depth in podzolic soils under various nutrient management practices. Each vertical bar represents mean whereas bar errors show ± standard error of three replications.
Agriculture 09 00183 g003
Figure 4. Effects of different soil amendments on temporal variations of soil pH at 0–10 cm (A) and 10–20 cm (B) sowing depth in podzolic soils under various nutrient management practices. Each vertical bar represents mean whereas bar errors show ± standard error for three replications. Lettering is independent of each other.
Agriculture 09 00183 g004
Figure 5. Effect of different soil amendments on temporal variations in soil organic carbon at 0–10 cm (A) and 10–20 cm (B) sowing depth in podzolic soils under various nutrient management practices. Each vertical bar represents mean whereas bar errors show ± standard error for three replications. Lettering is independent of each other.
Agriculture 09 00183 g005
Figure 6. Effect of different soil amendments on temporal variations in cation exchange capacity at 0–10 cm (A) and 10–20 cm (B) sowing depth in podzolic soils under various nutrient management practices. Each vertical bar represents mean whereas bar errors show ± standard error for three replications. Lettering is independent of each other.
Agriculture 09 00183 g006
Figure 7. Effect of different soil amendments on temporal variations in electrical conductivity of soil solution at 0–10 cm (A) and 10–20 cm (B) sowing depth in podzolic soils under various nutrient management practices. Each vertical bar represents mean whereas bar errors show ± standard error for three replications. Lettering is independent of each other.
Agriculture 09 00183 g007
Figure 8. Effect of different soil amendments on temporal variations in apparent electrical conductivity at 0–10 cm sowing depth in podzolic soils under various nutrient management practices. Each vertical bar represents mean whereas bar errors show ±standard error for three replications. Lettering is independent of each other.
Agriculture 09 00183 g008
Figure 9. Relationship between soil organic carbon and bulk electrical conductivity, ECa (A) at 0–10 cm depth, electrical conductivity of soil solution, ECw at 0–10 cm (B) and 10–20 cm (C) soil depths in podzolic soils under various nutrient management practices.
Agriculture 09 00183 g009
Figure 10. Relationship between cation exchange capacity and electrical conductivity of soil solution, ECw (A) and bulk electrical conductivity, ECa (B) at 0–10 cm soil depths in podzolic soils under various nutrient management practices.
Agriculture 09 00183 g010
Table 1. Experimental treatments including different nutrient management practices to produce silage-corn in Newfoundland, Canada.
TreatmentsSoil Amendments
T1Control—no fertilization or soil amendment
T2Inorganic nitrogen @ 225 kg ha−1
T3Inorganic nitrogen + biochar @ 20 t ha−1
T4Inorganic nitrogen + dairy manure @ 30,000 L ha−1
T5Inorganic nitrogen + dairy manure + biochar
Table 2. Properties of biochar used in current study obtained from AirTerra Inc. (Alberta, Canada).
ParameterDetails
Bulk density (BD)0.23 g cm−3
pH9.4
Electrical conductivity (EC)0.43 dS m−1
Total organic carbon88.6%
Void space 87.50% (dry weight basis)
Solid space12.50% (dry weight basis)
Water holding capacity74.90 mL 100 g−1 dry biochar
Moisture15.20%
Total volatile fractions78.70%
Total ash6.00%

