
Late Quaternary Marine Terraces and Tectonic Uplift Rates of the Broader Neapolis Area (SE Peloponnese, Greece)

 ,
,  ,
,  and
and
Abstract
:1. Introduction
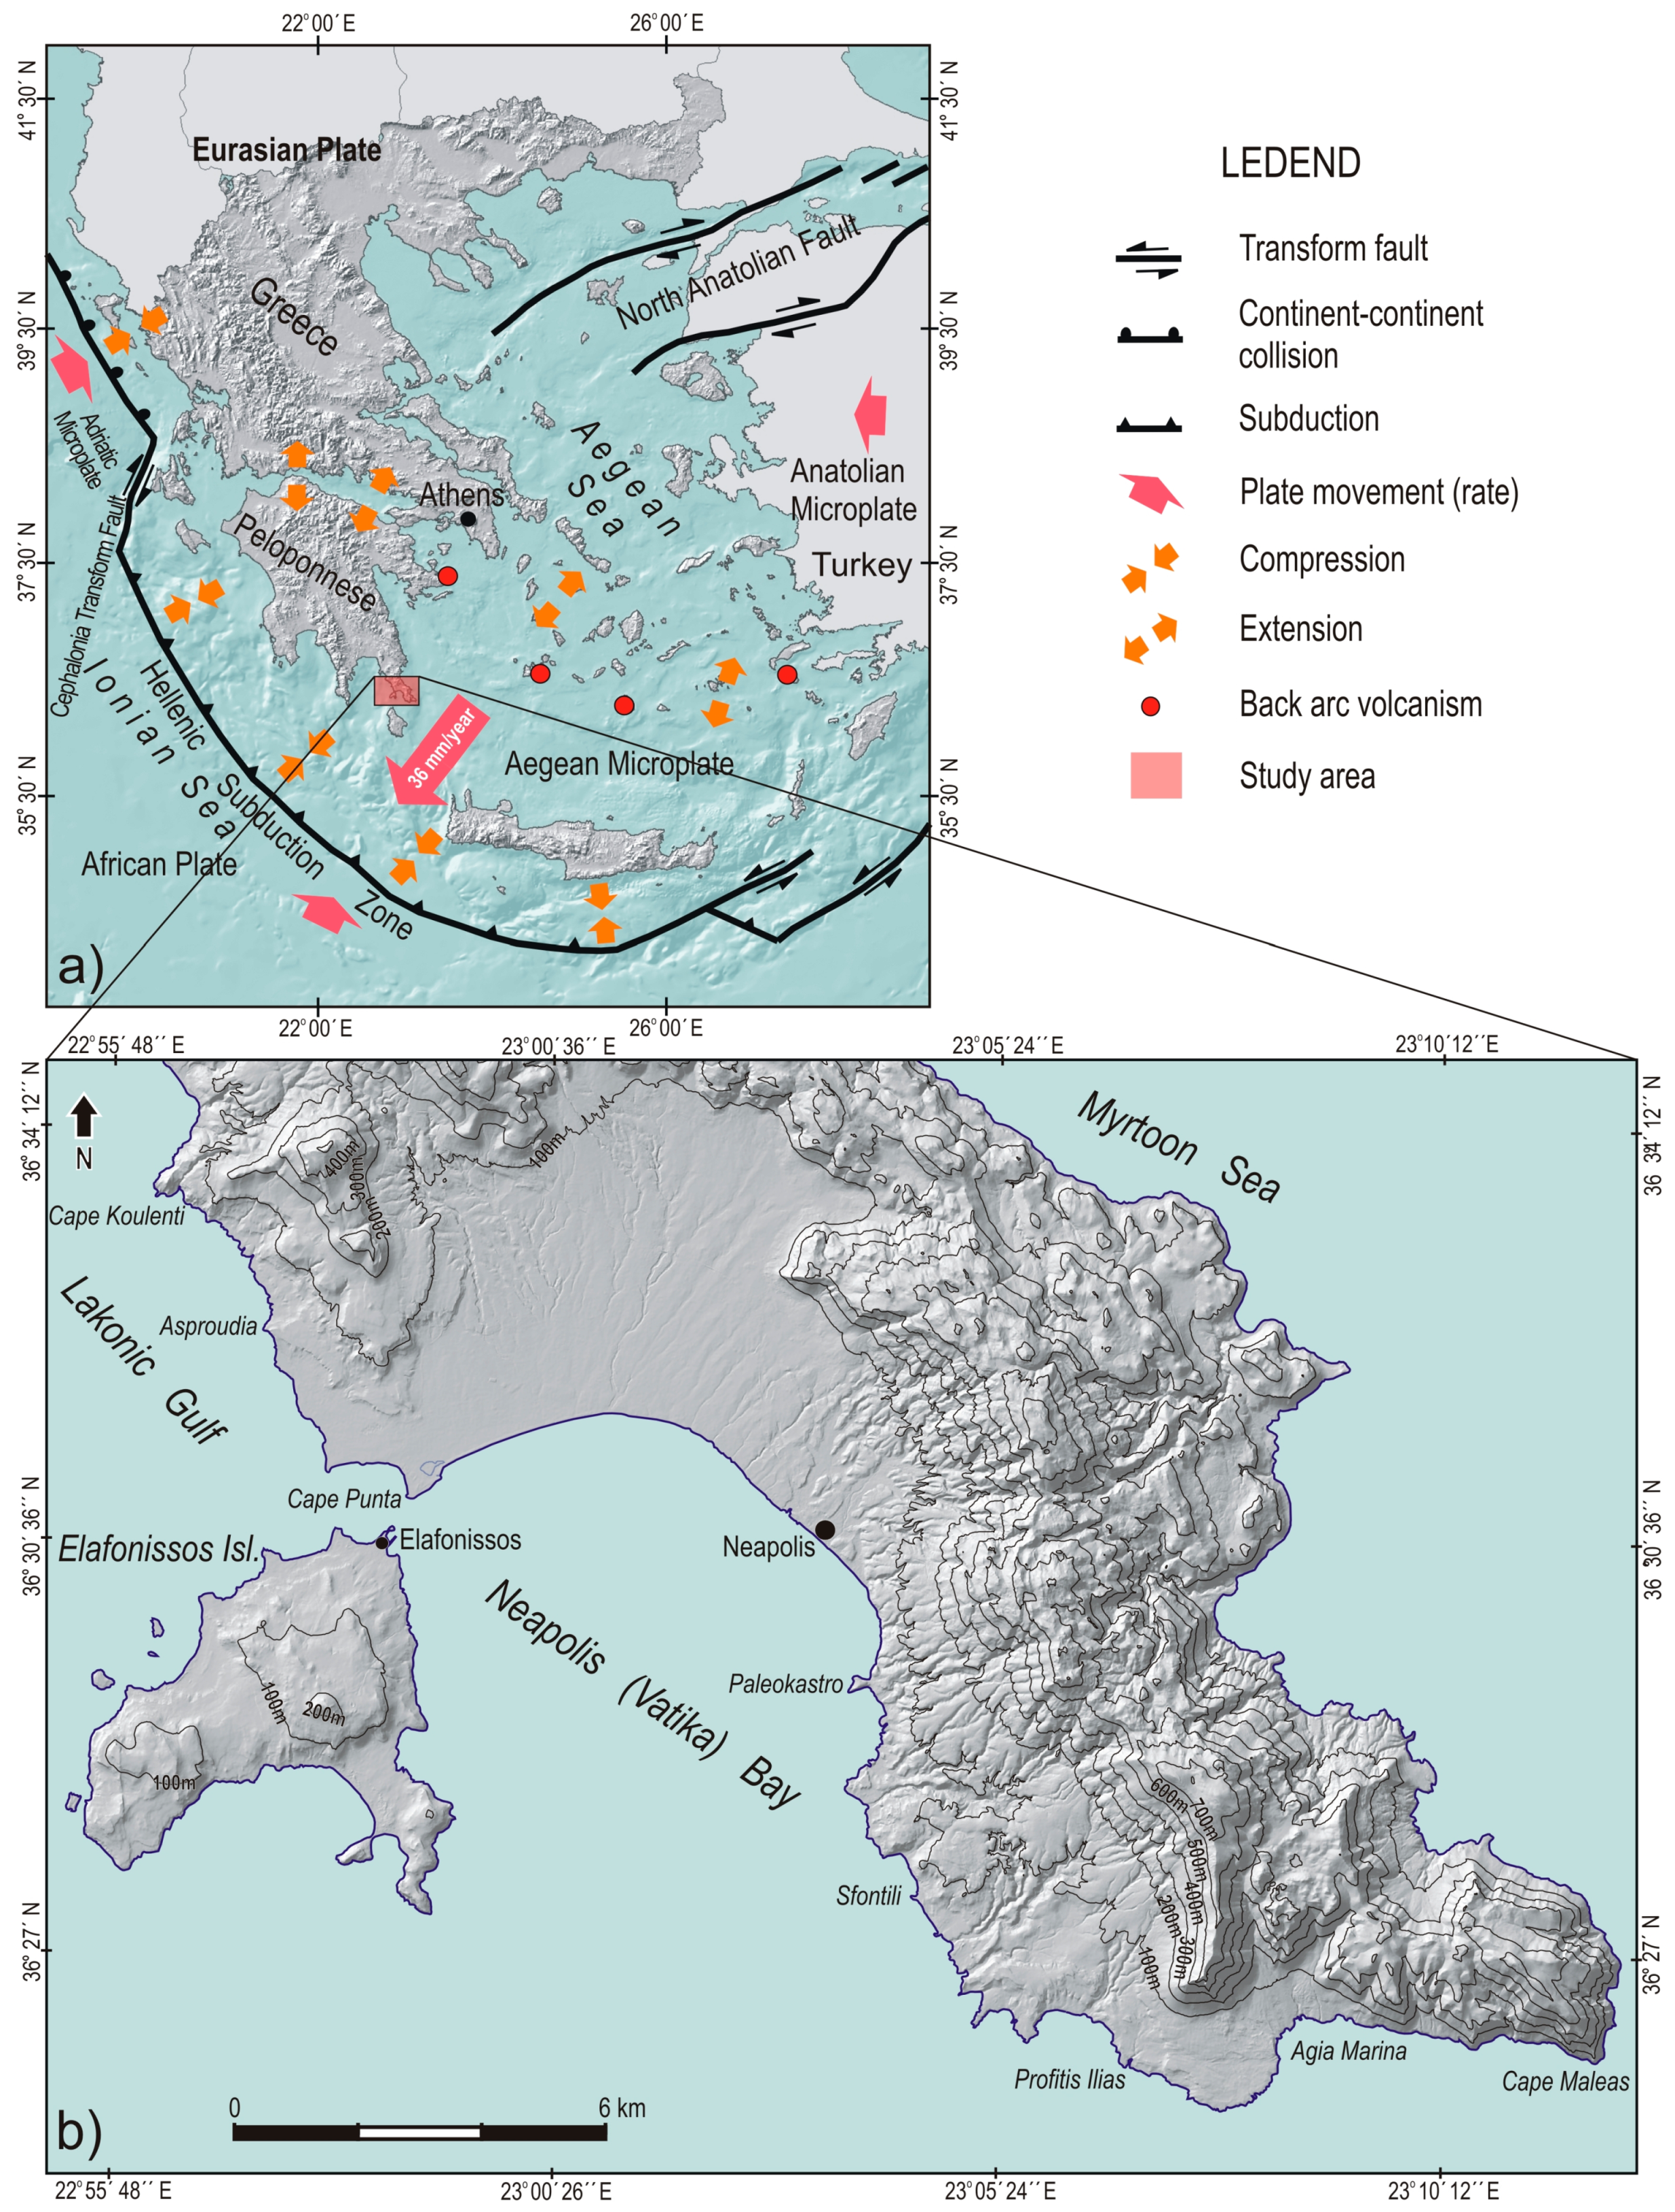
2. Study Area
3. Materials and Methods
3.1. Mapping
3.2. Optically Stimulated Luminescence (OSL) Dating
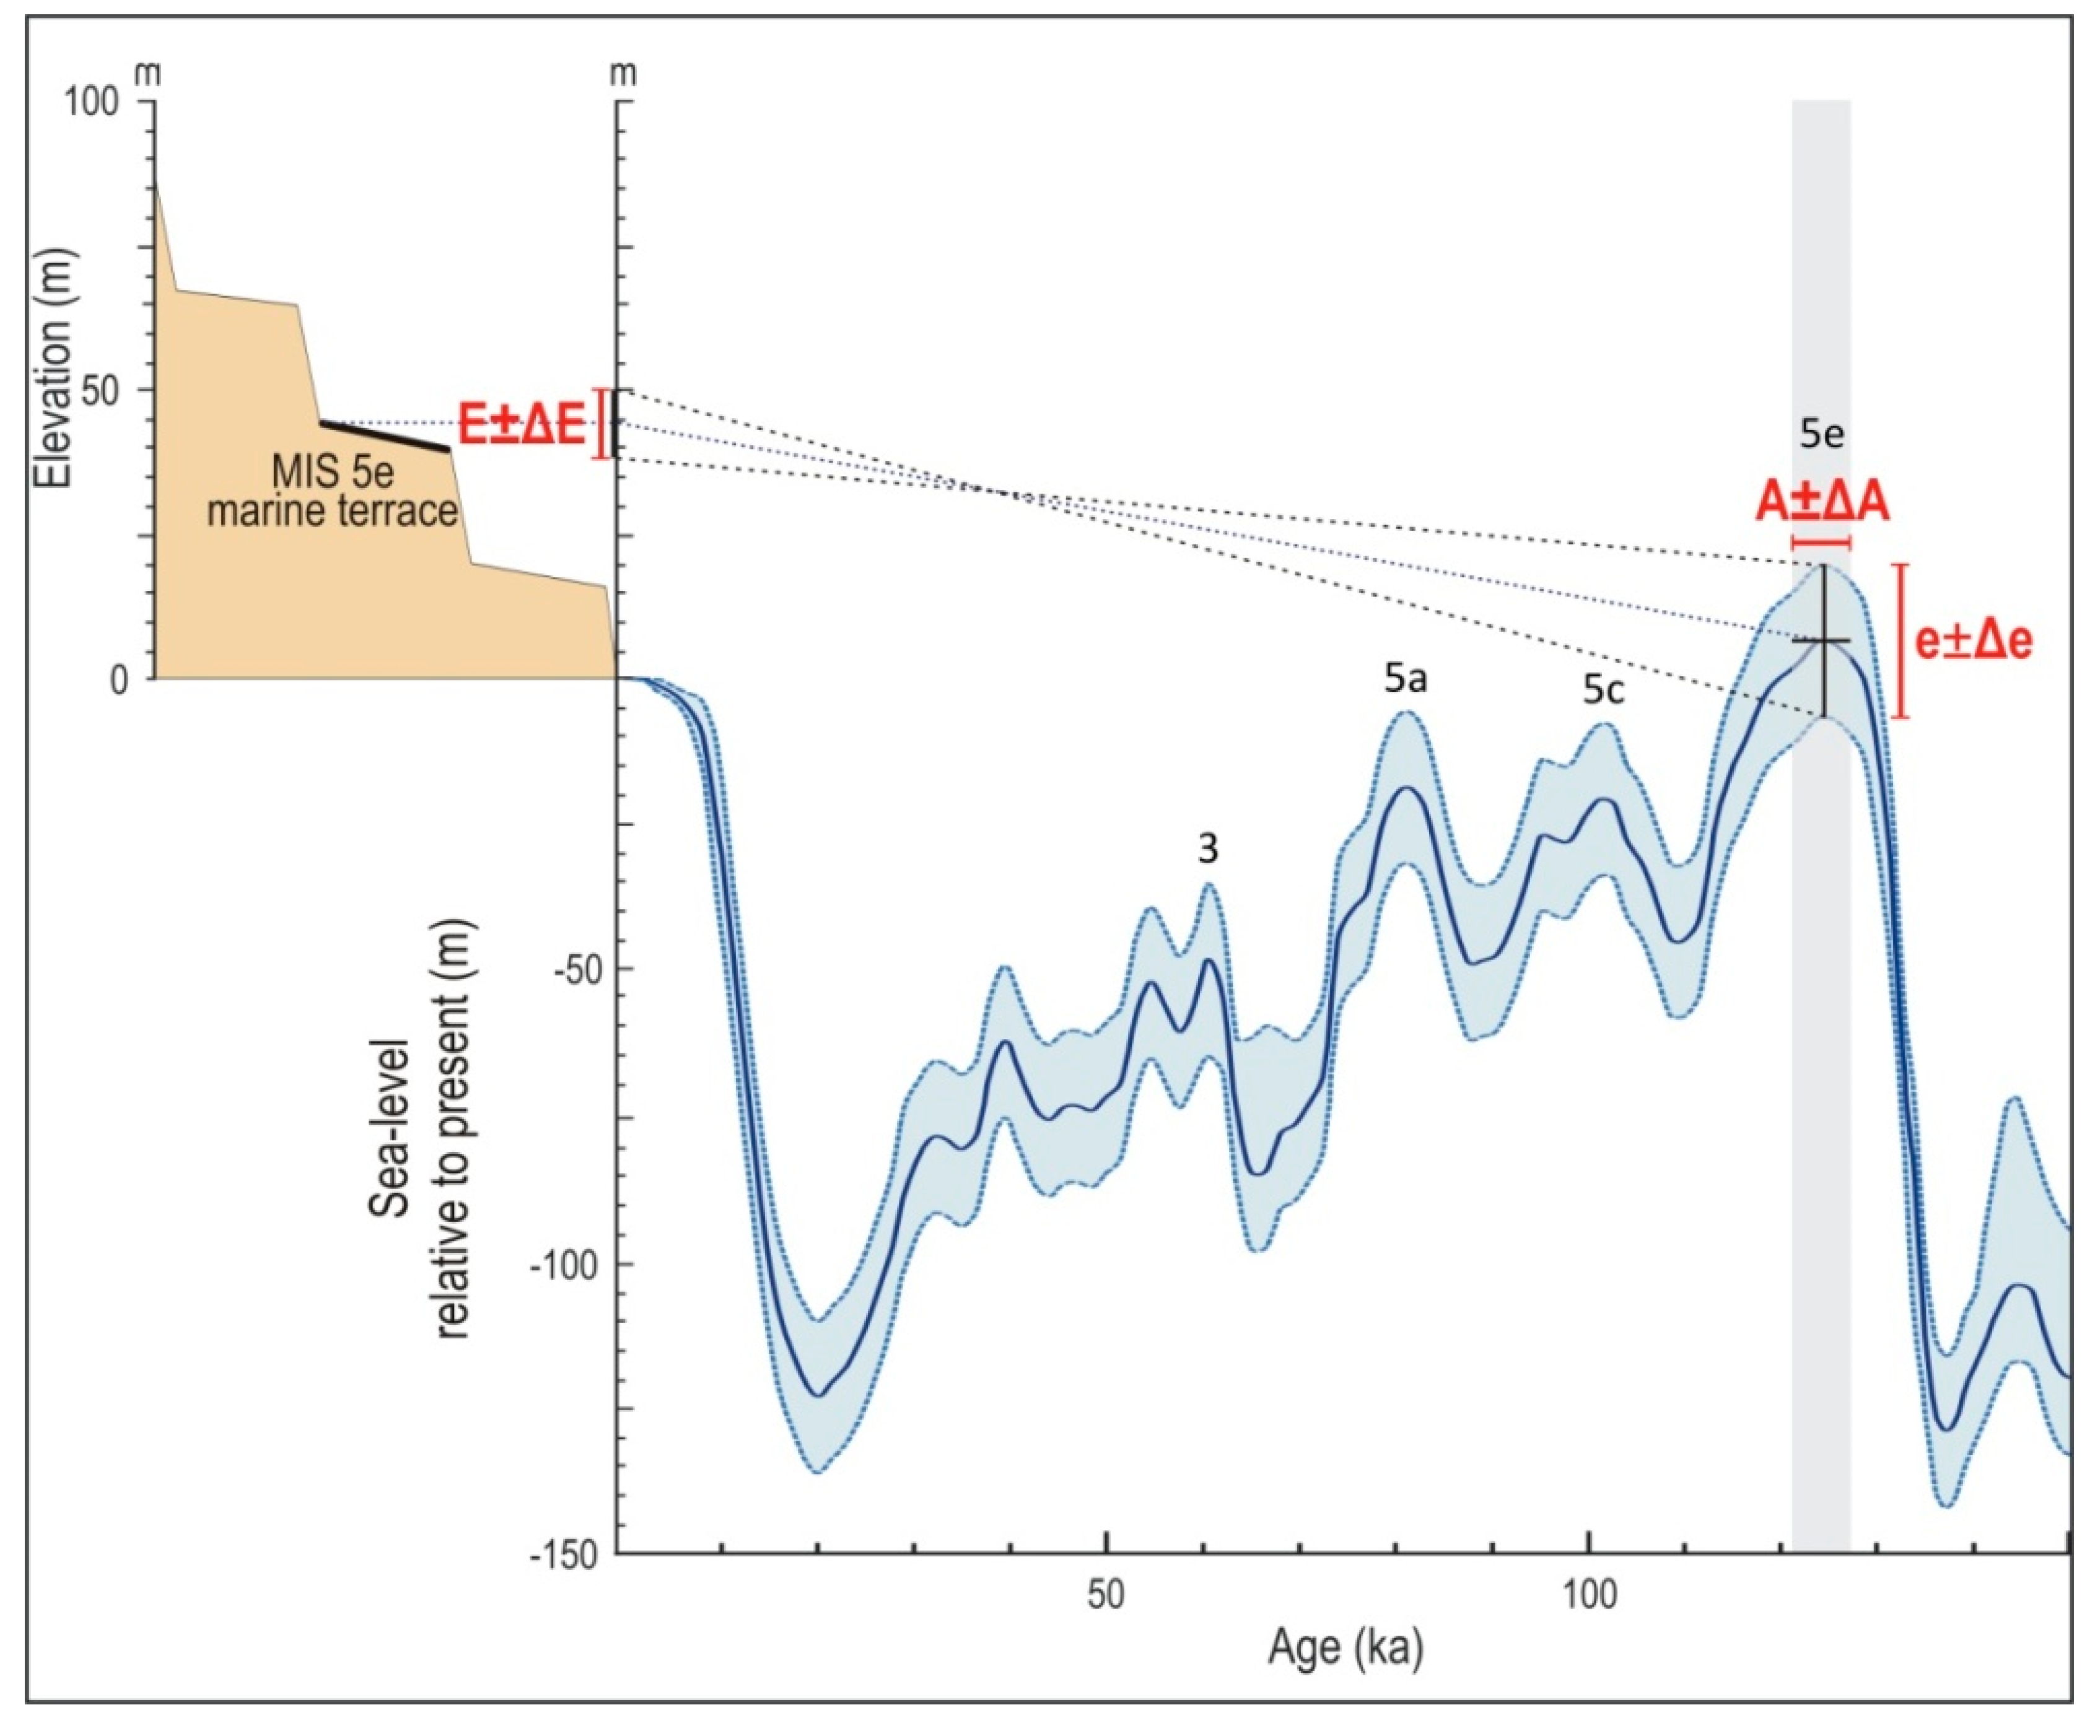
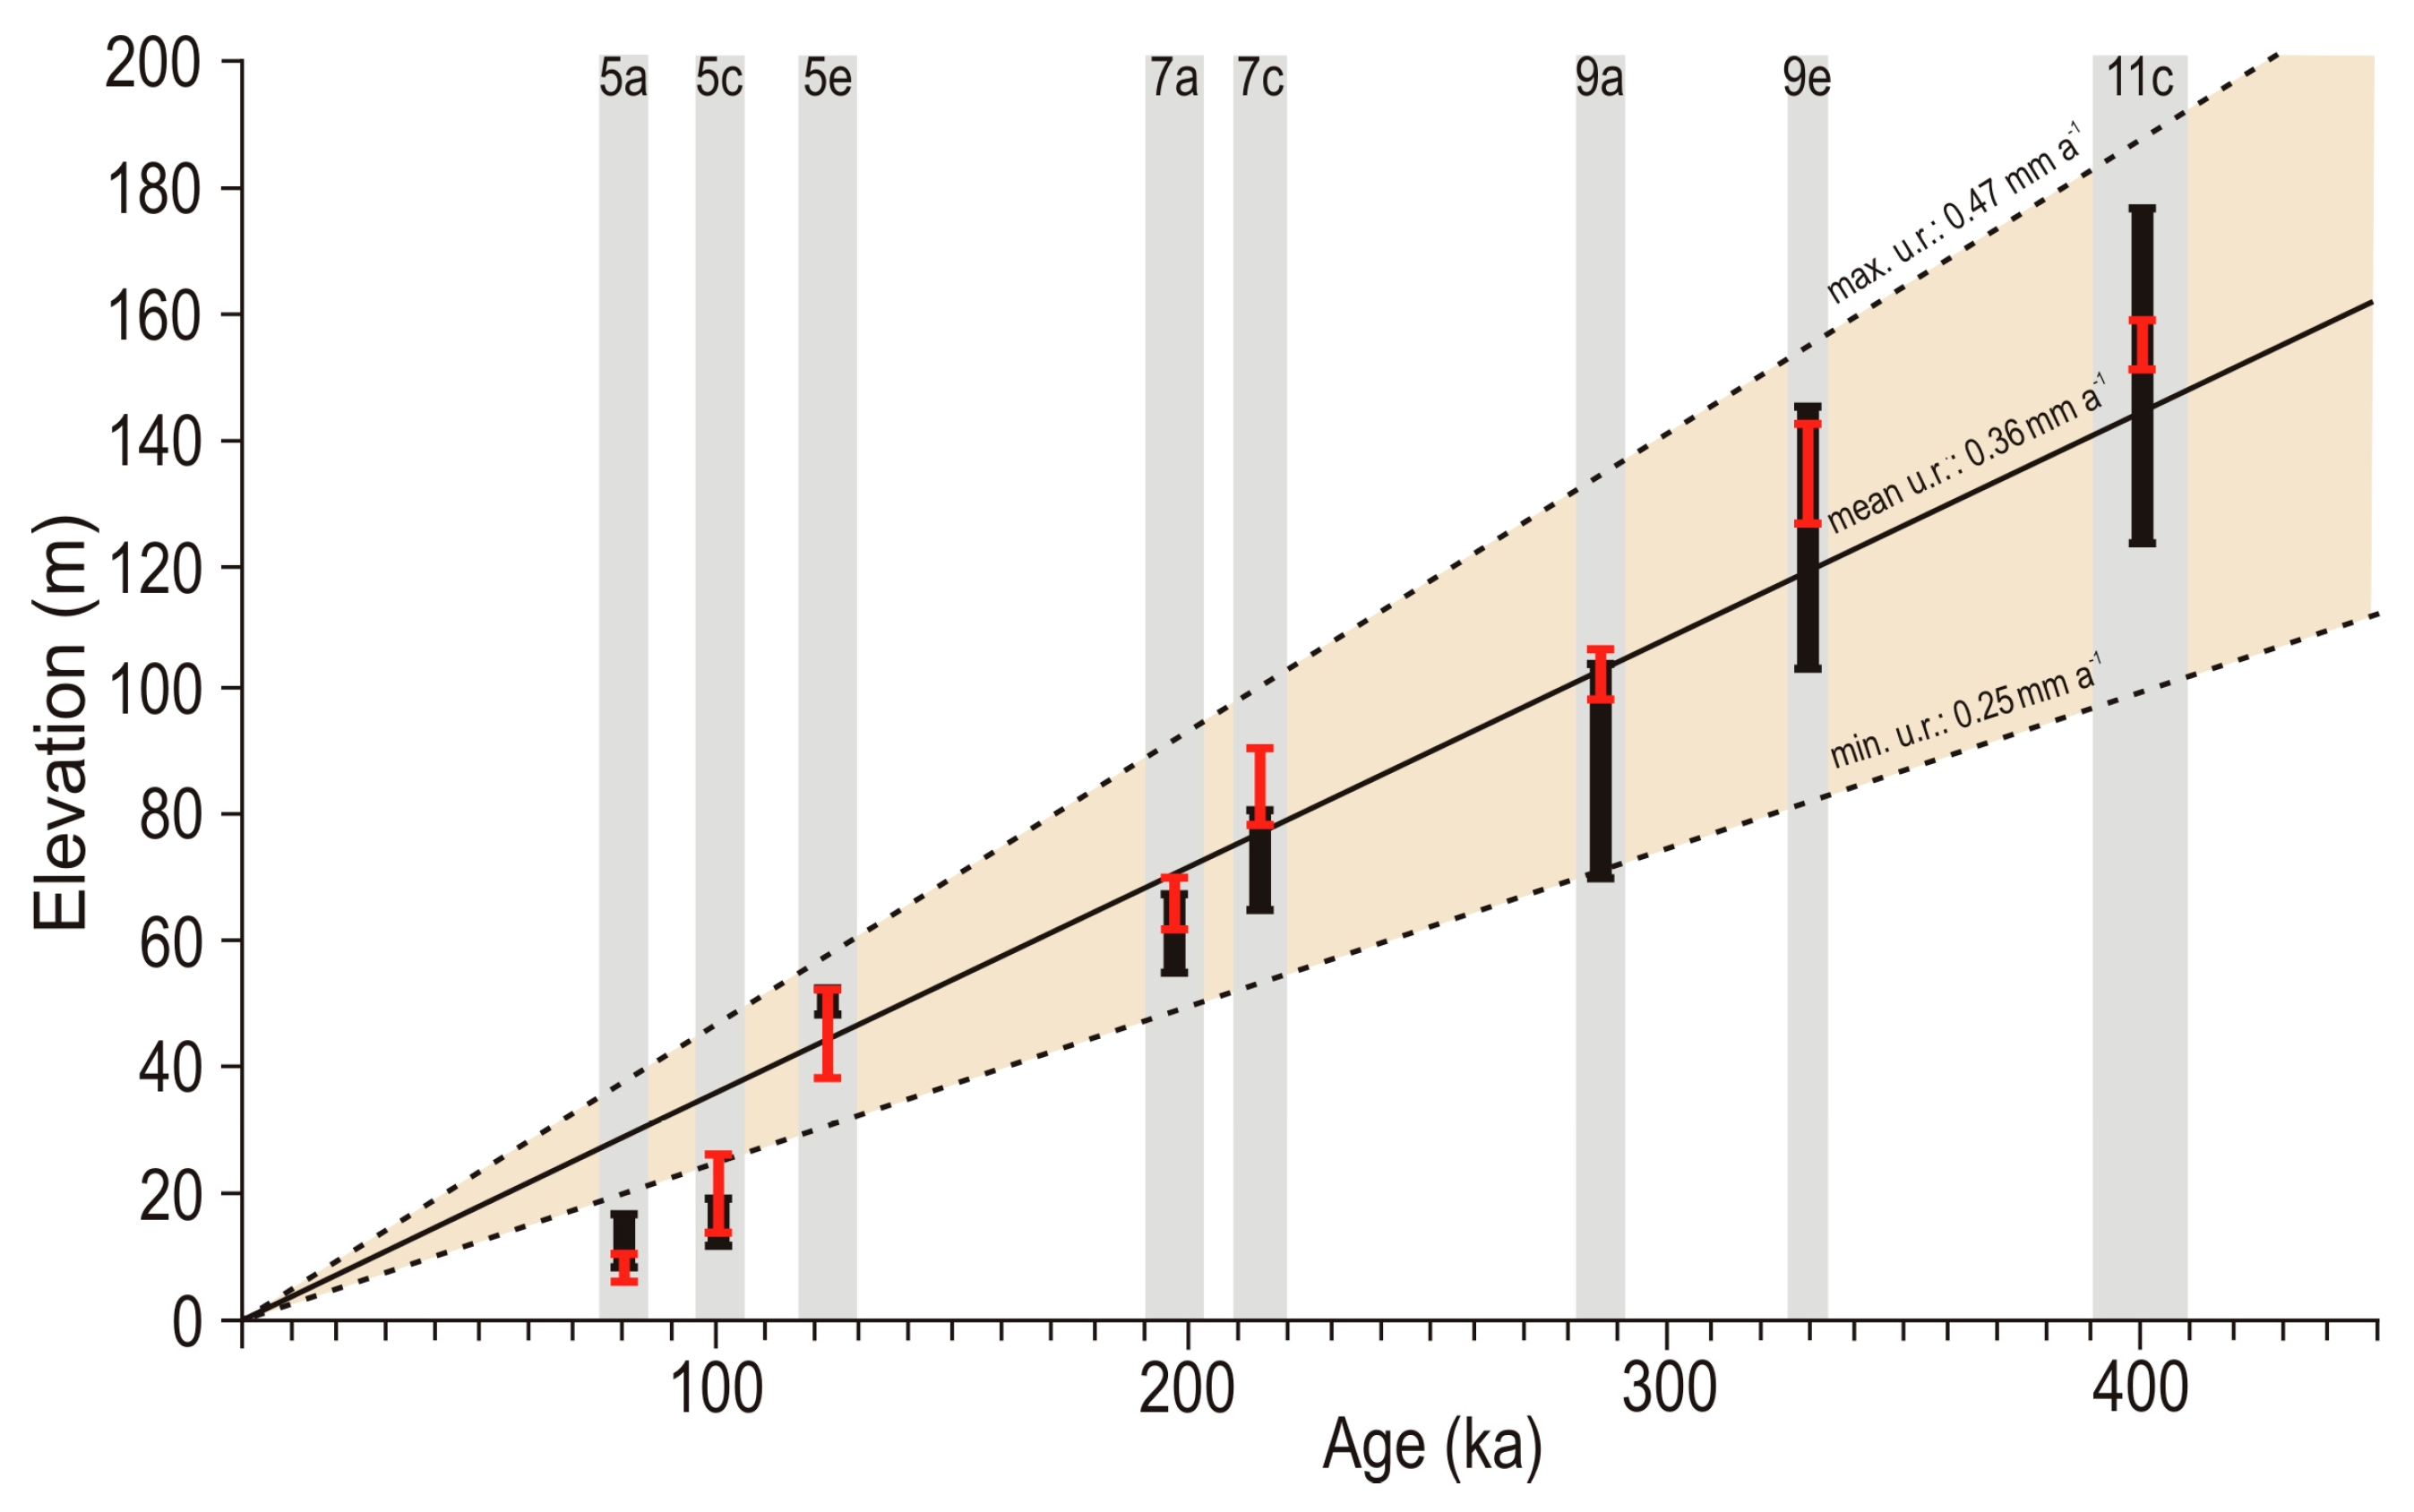
3.3. Rates of Coastal Uplift Estimation and Eustatic Correlations
4. Results and Discussion
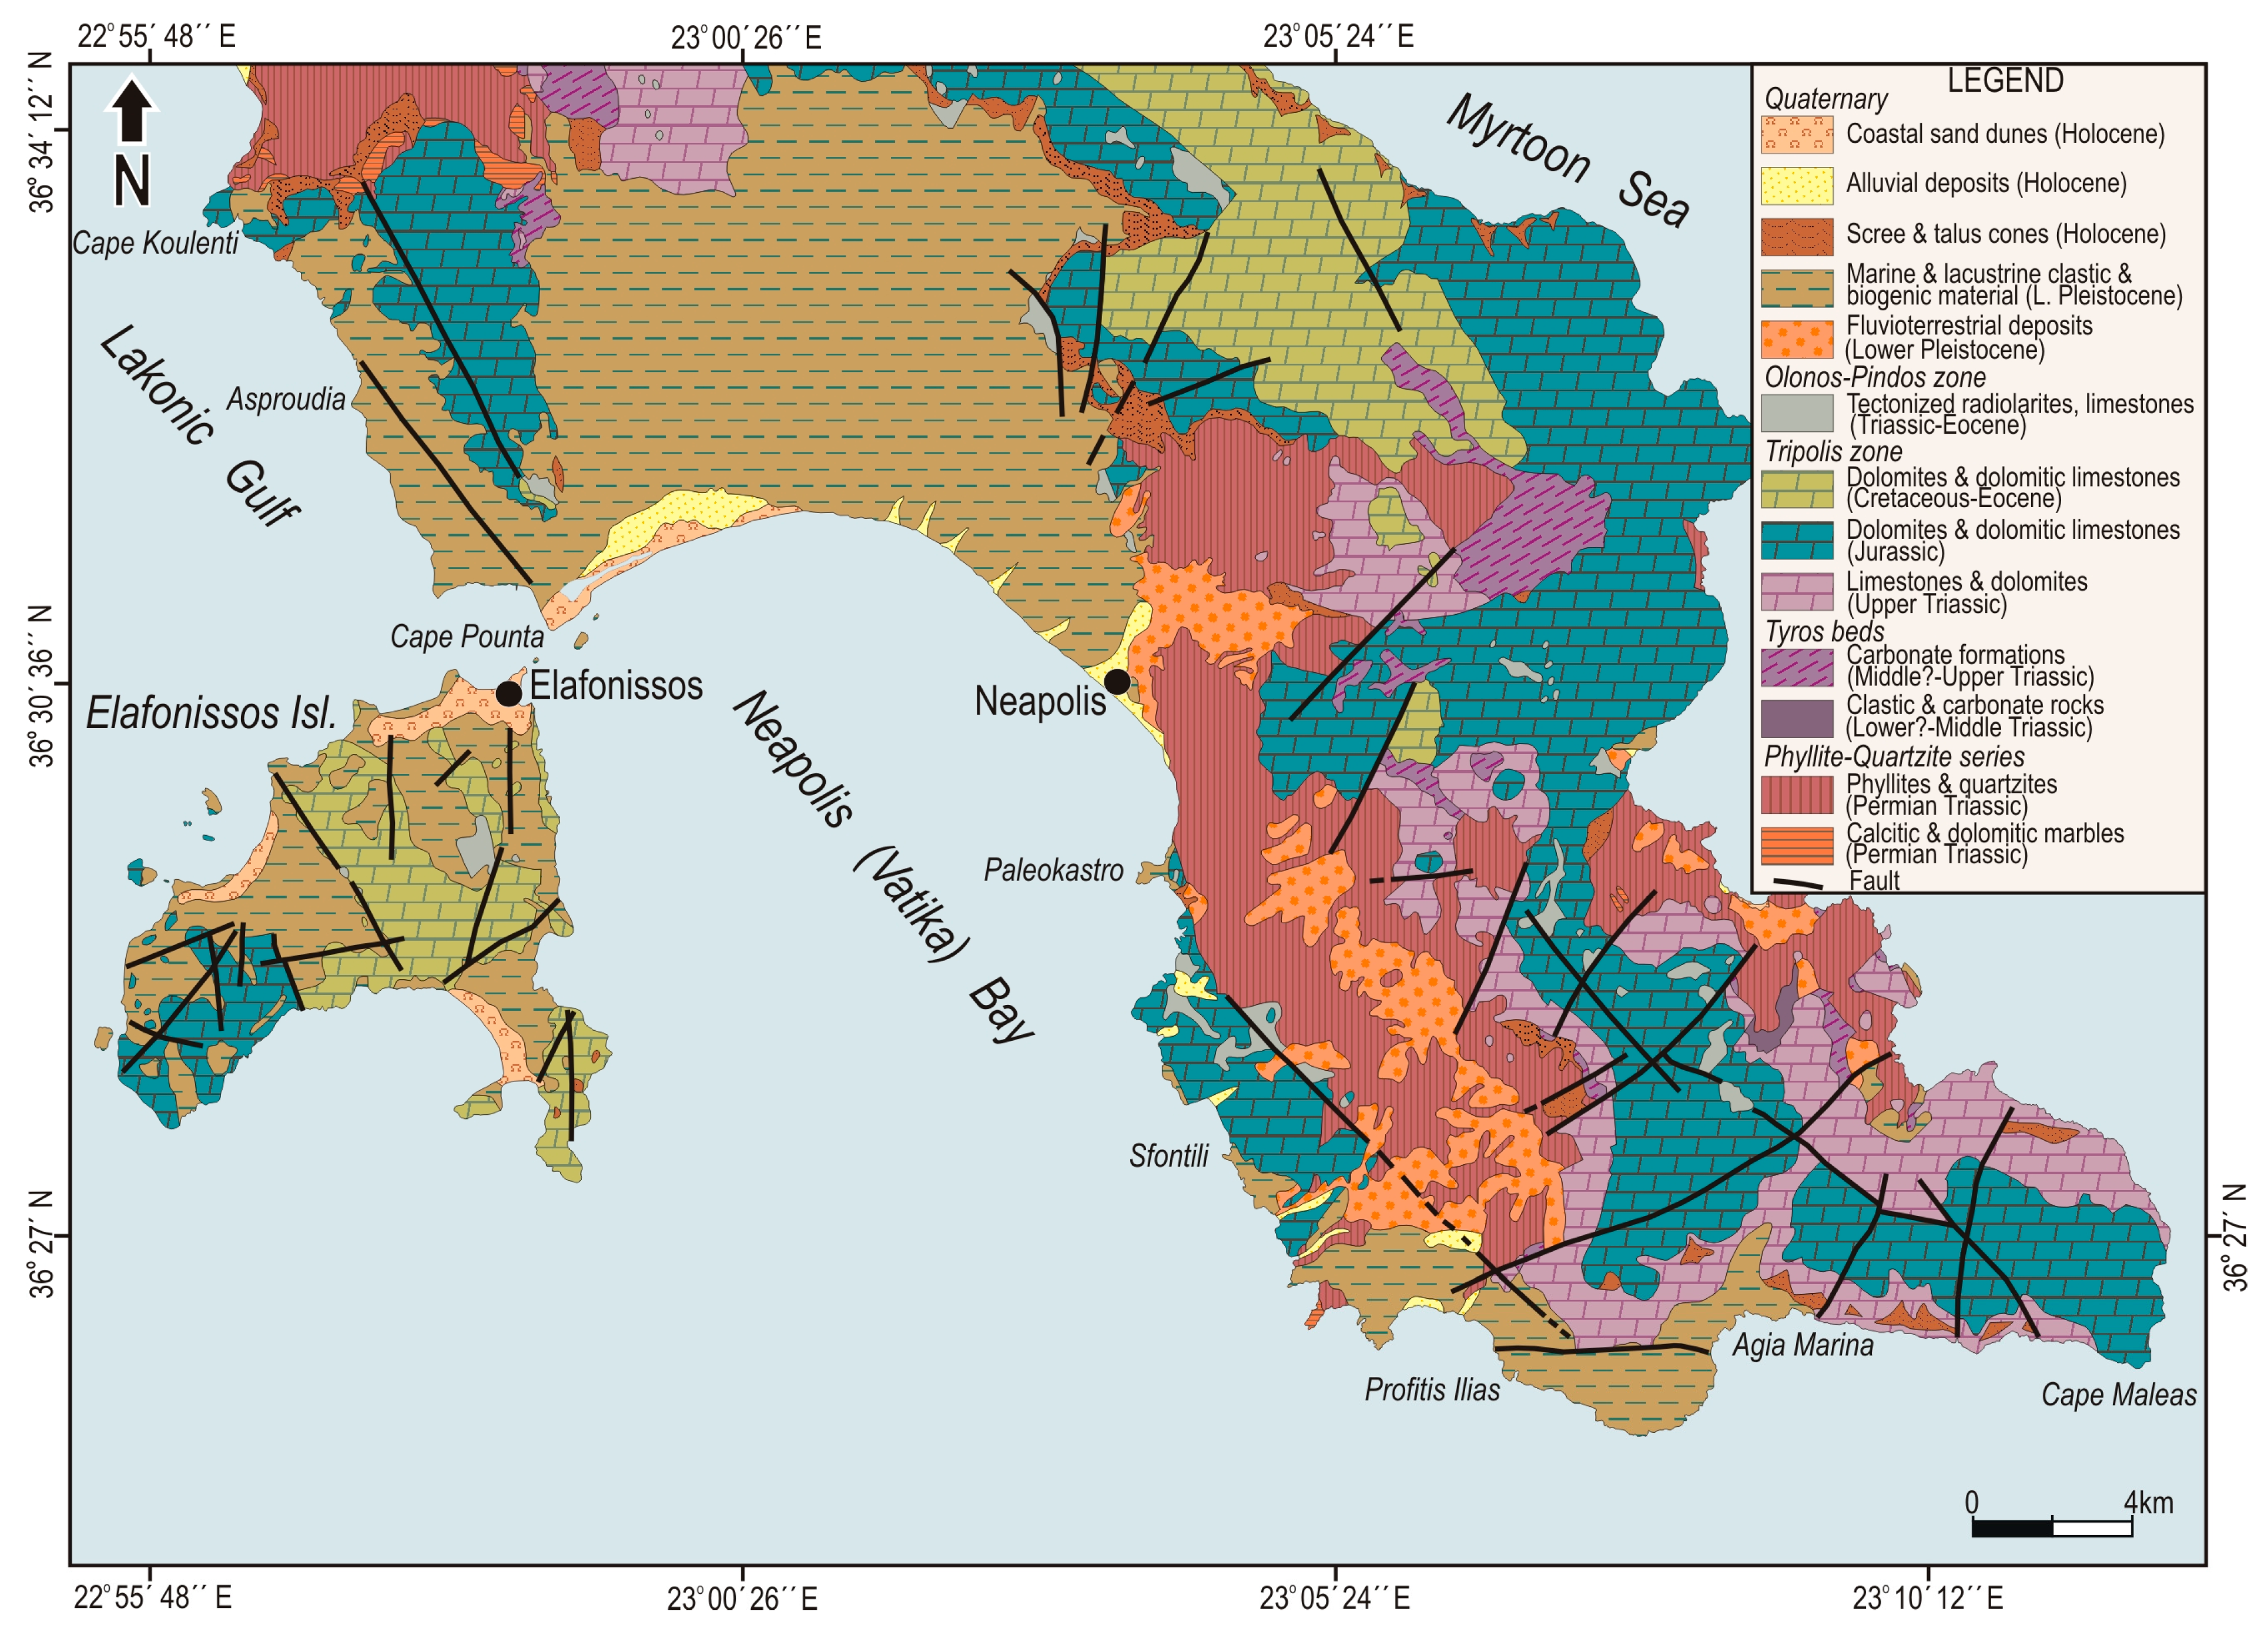
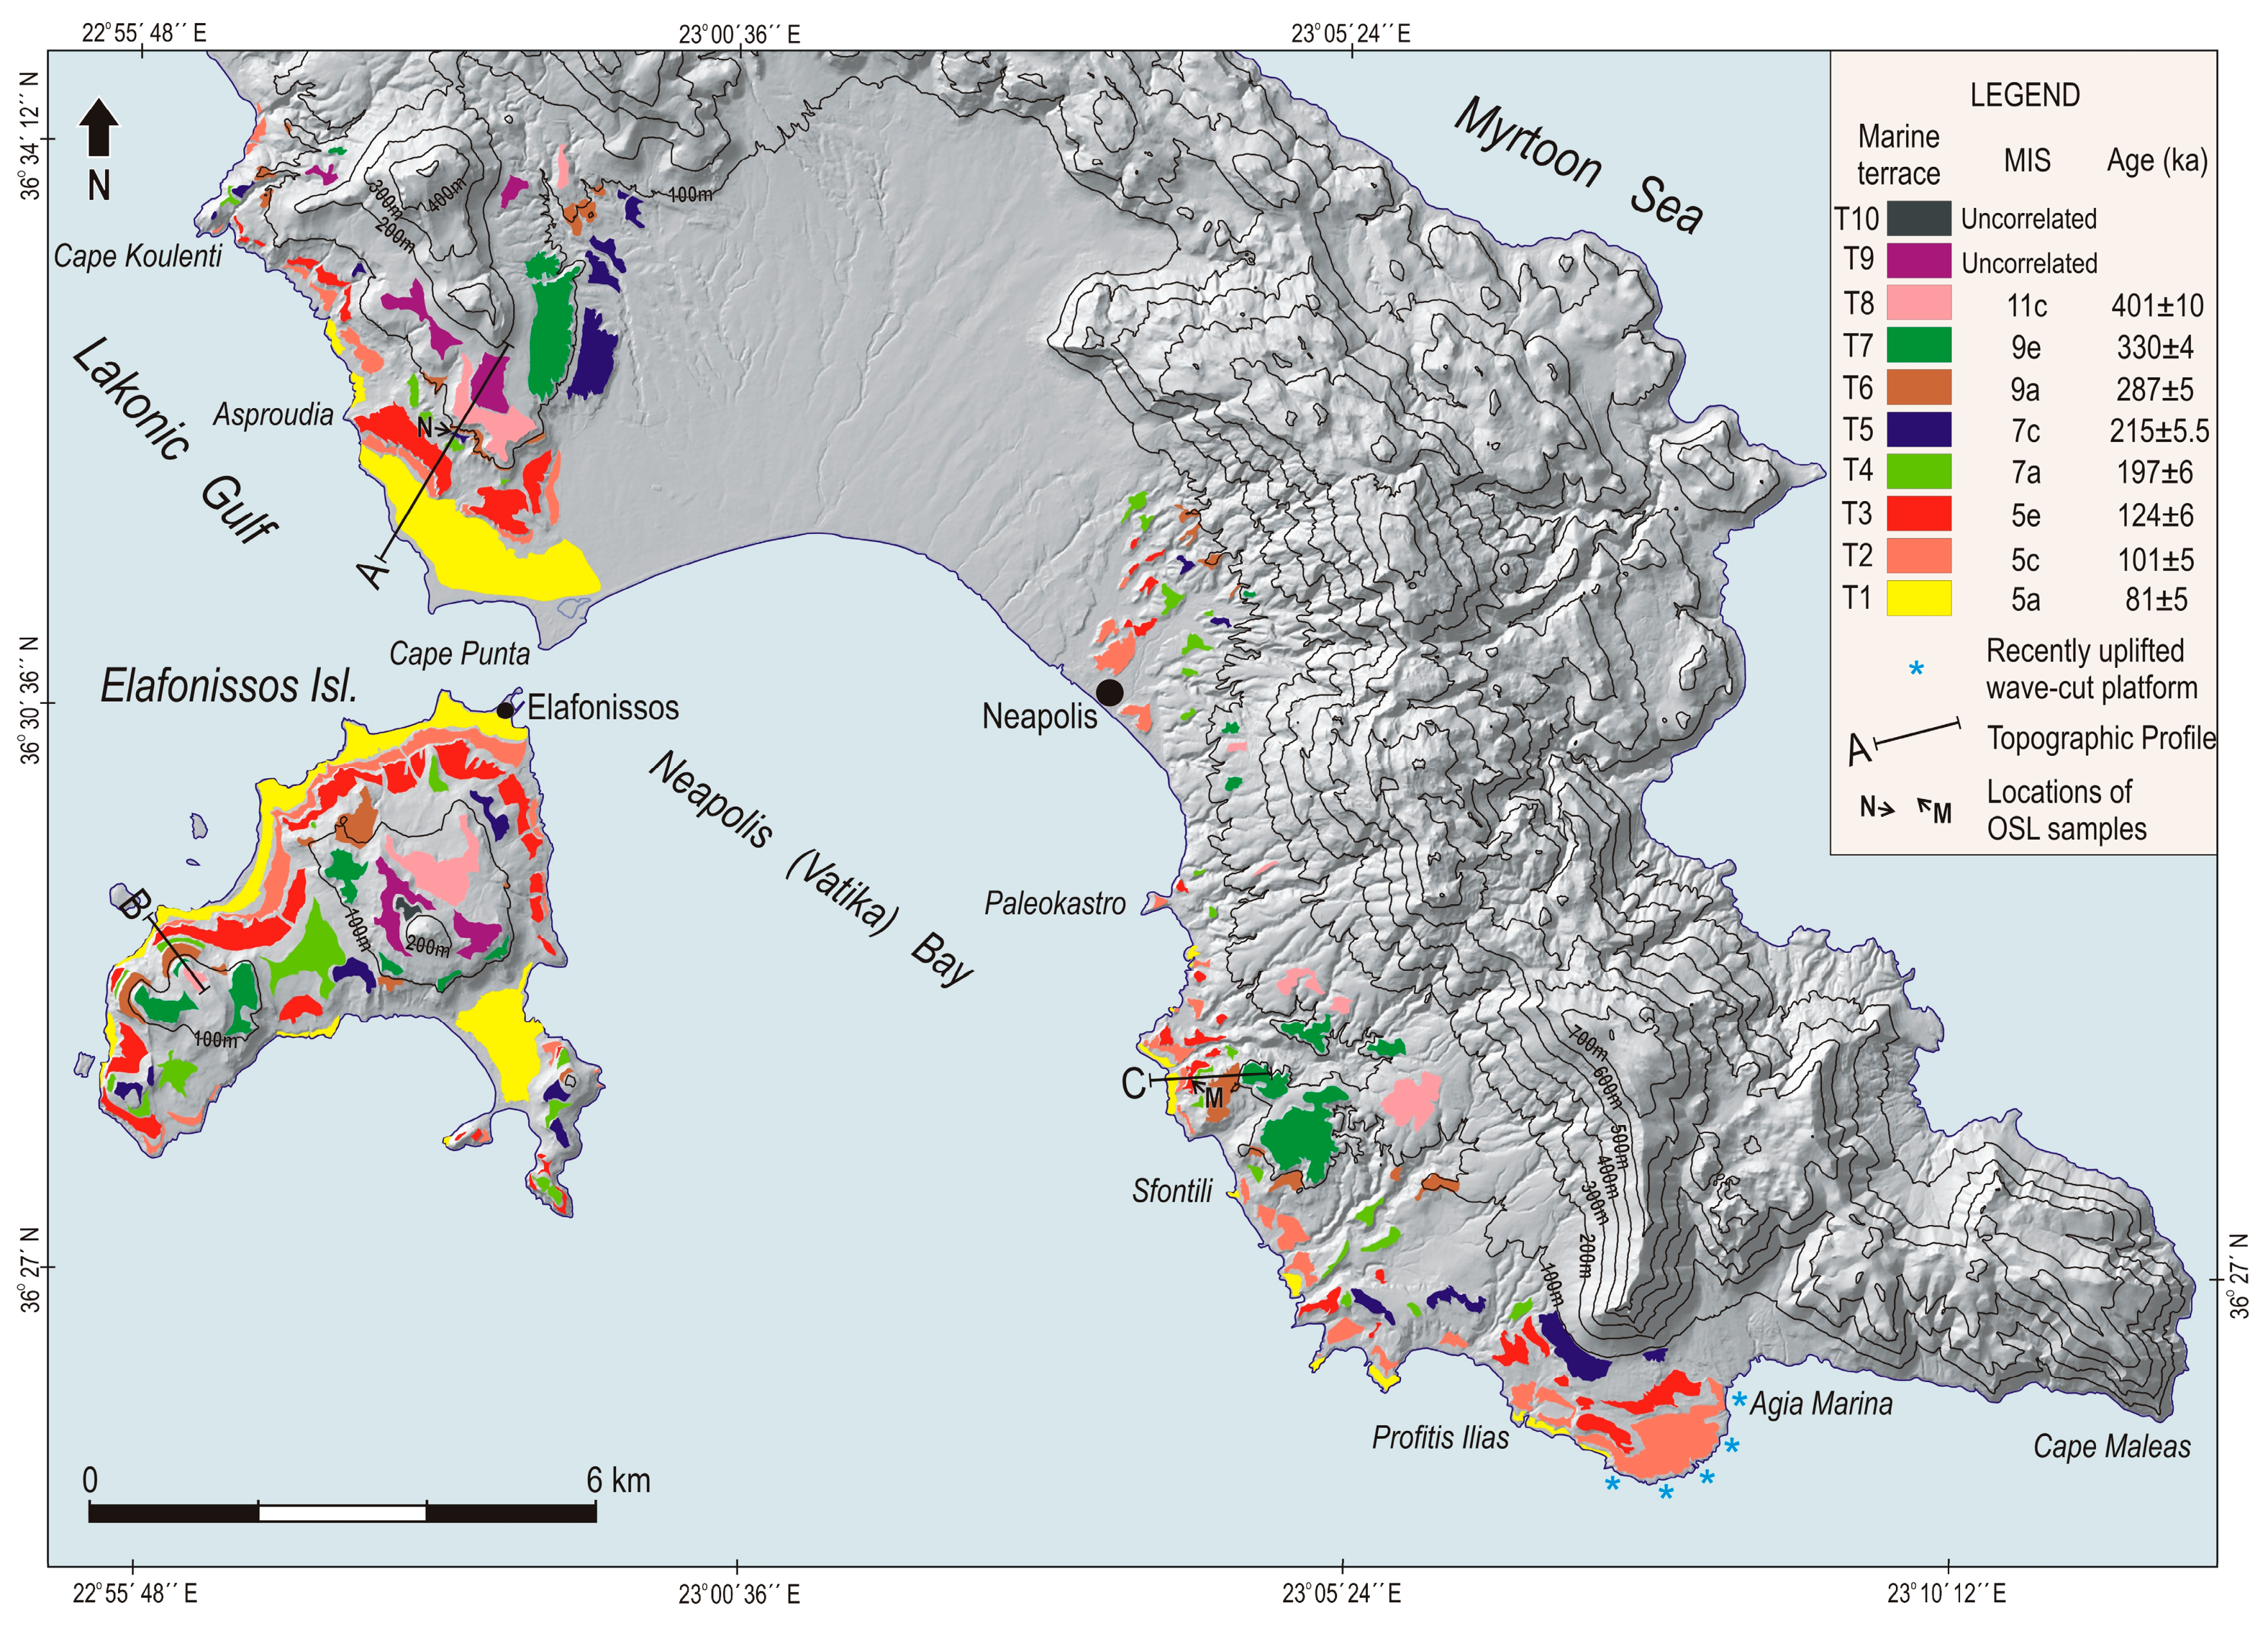
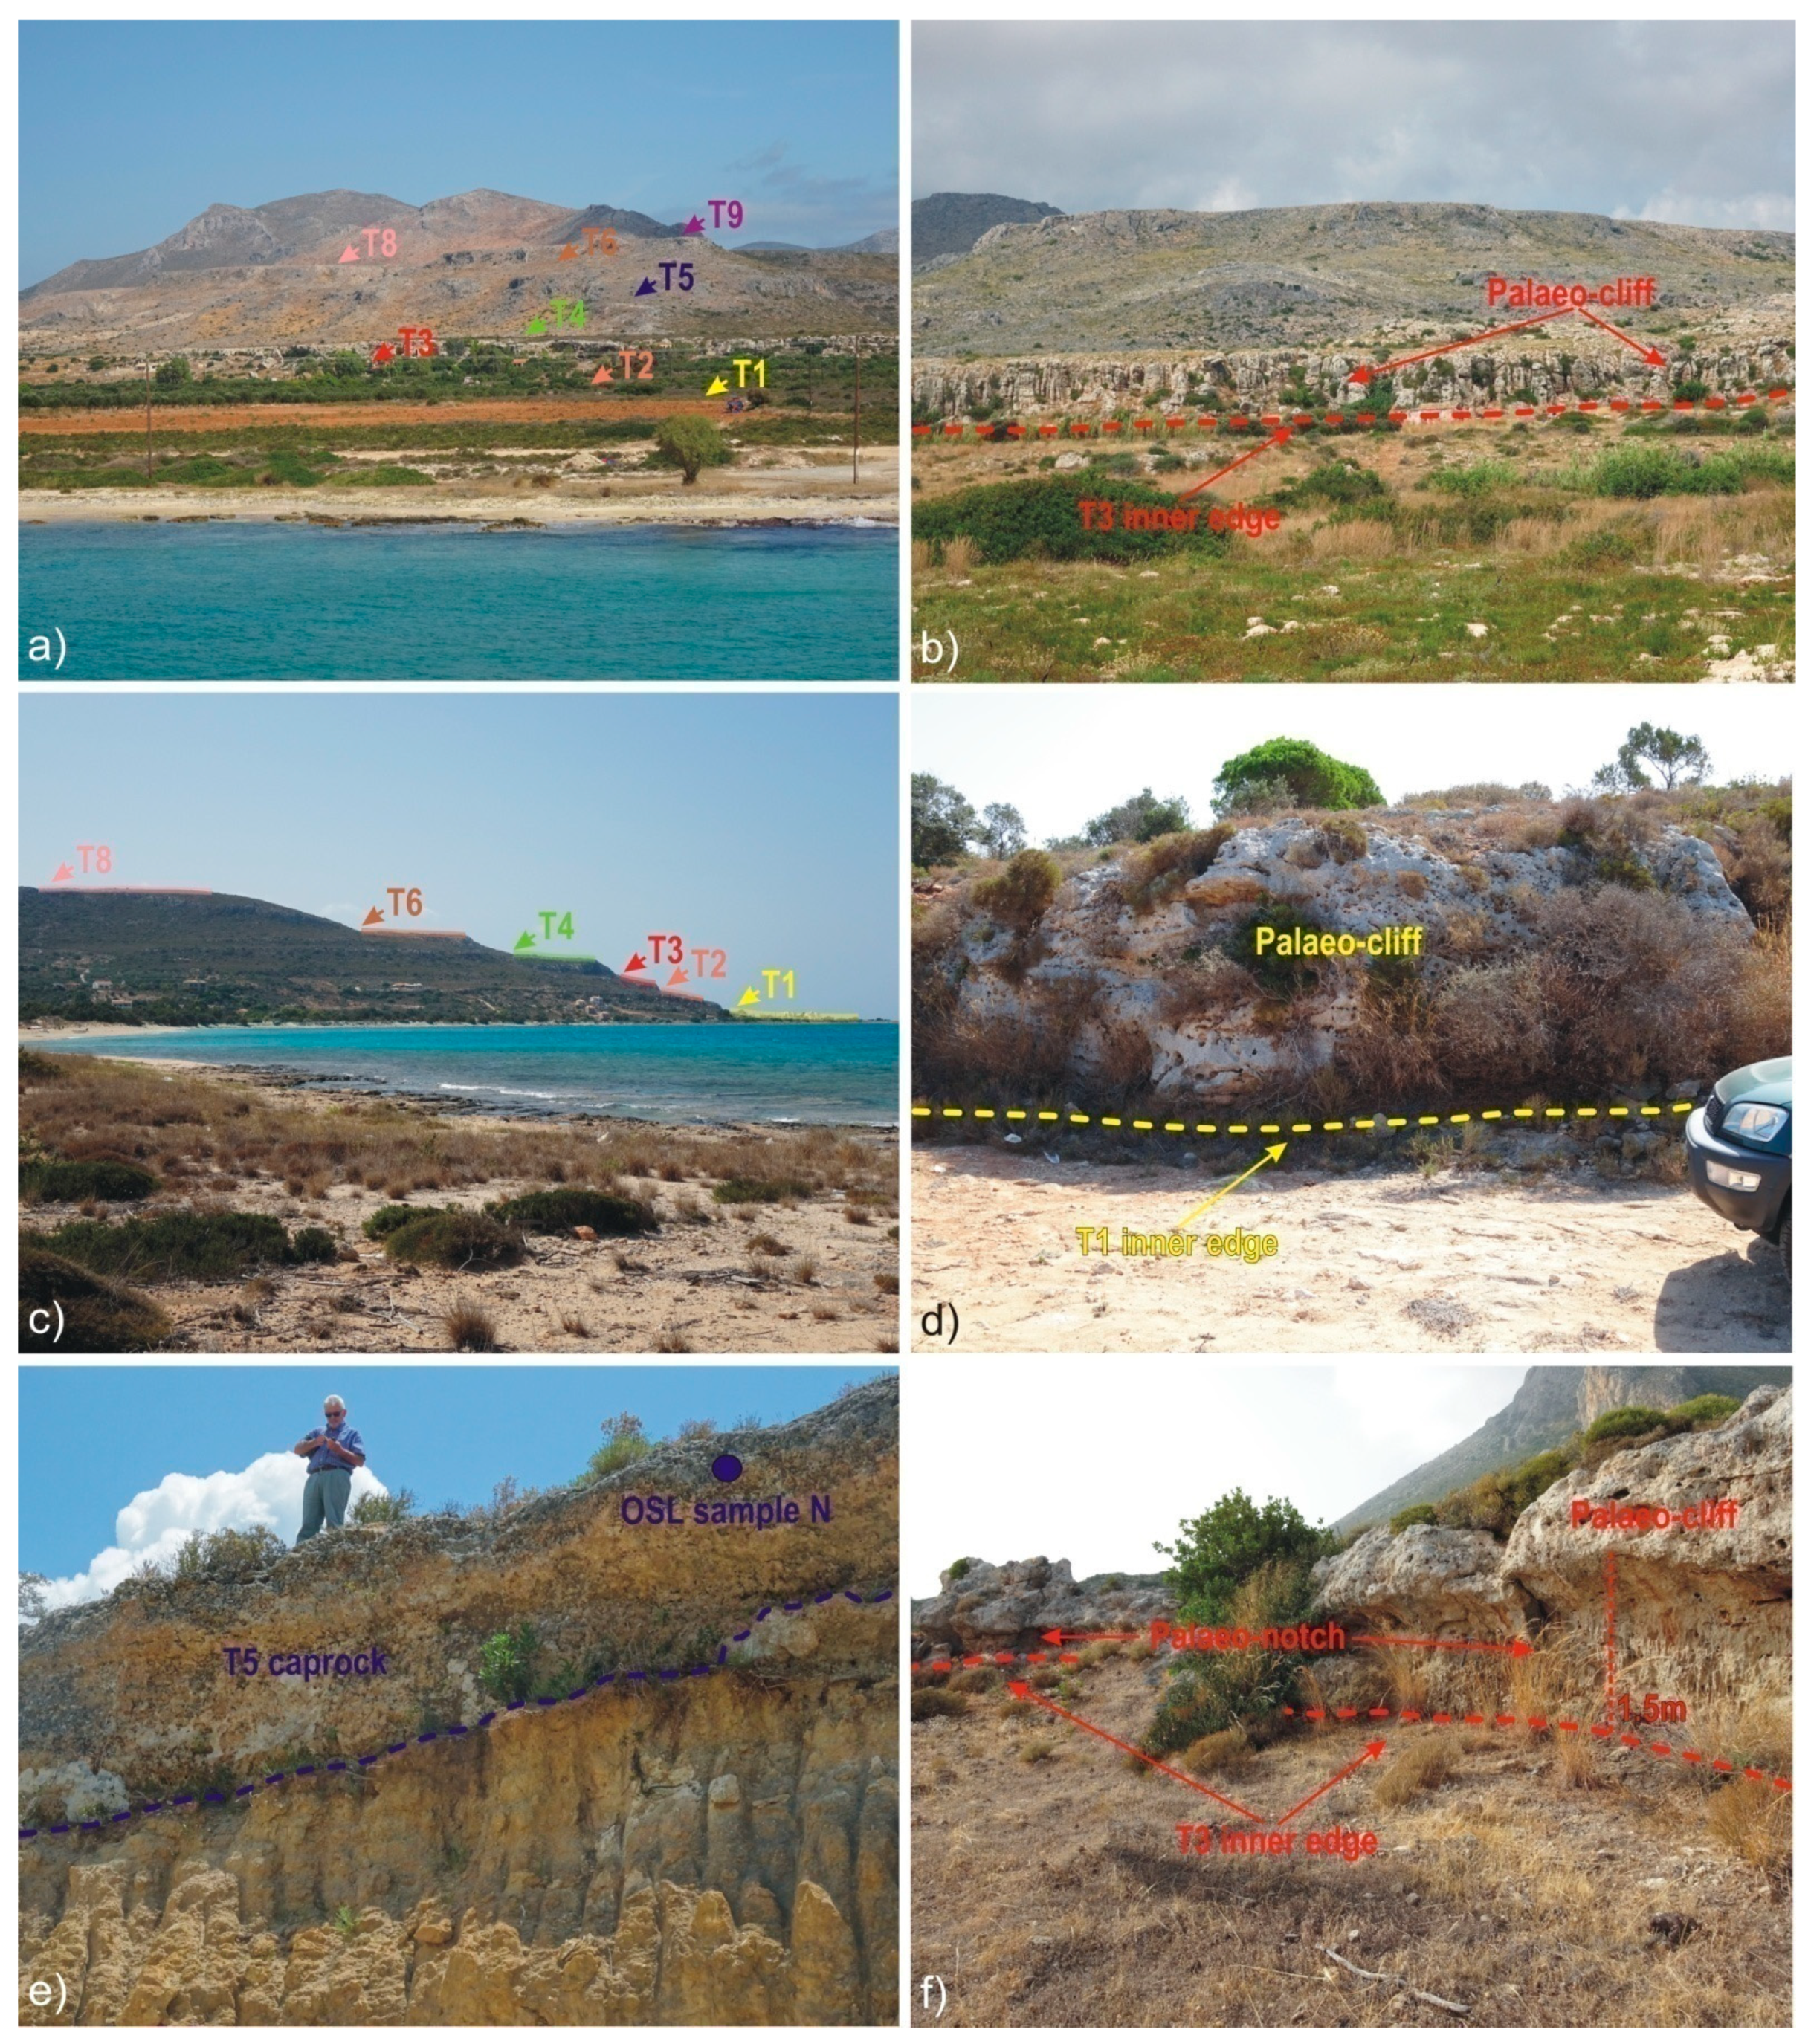
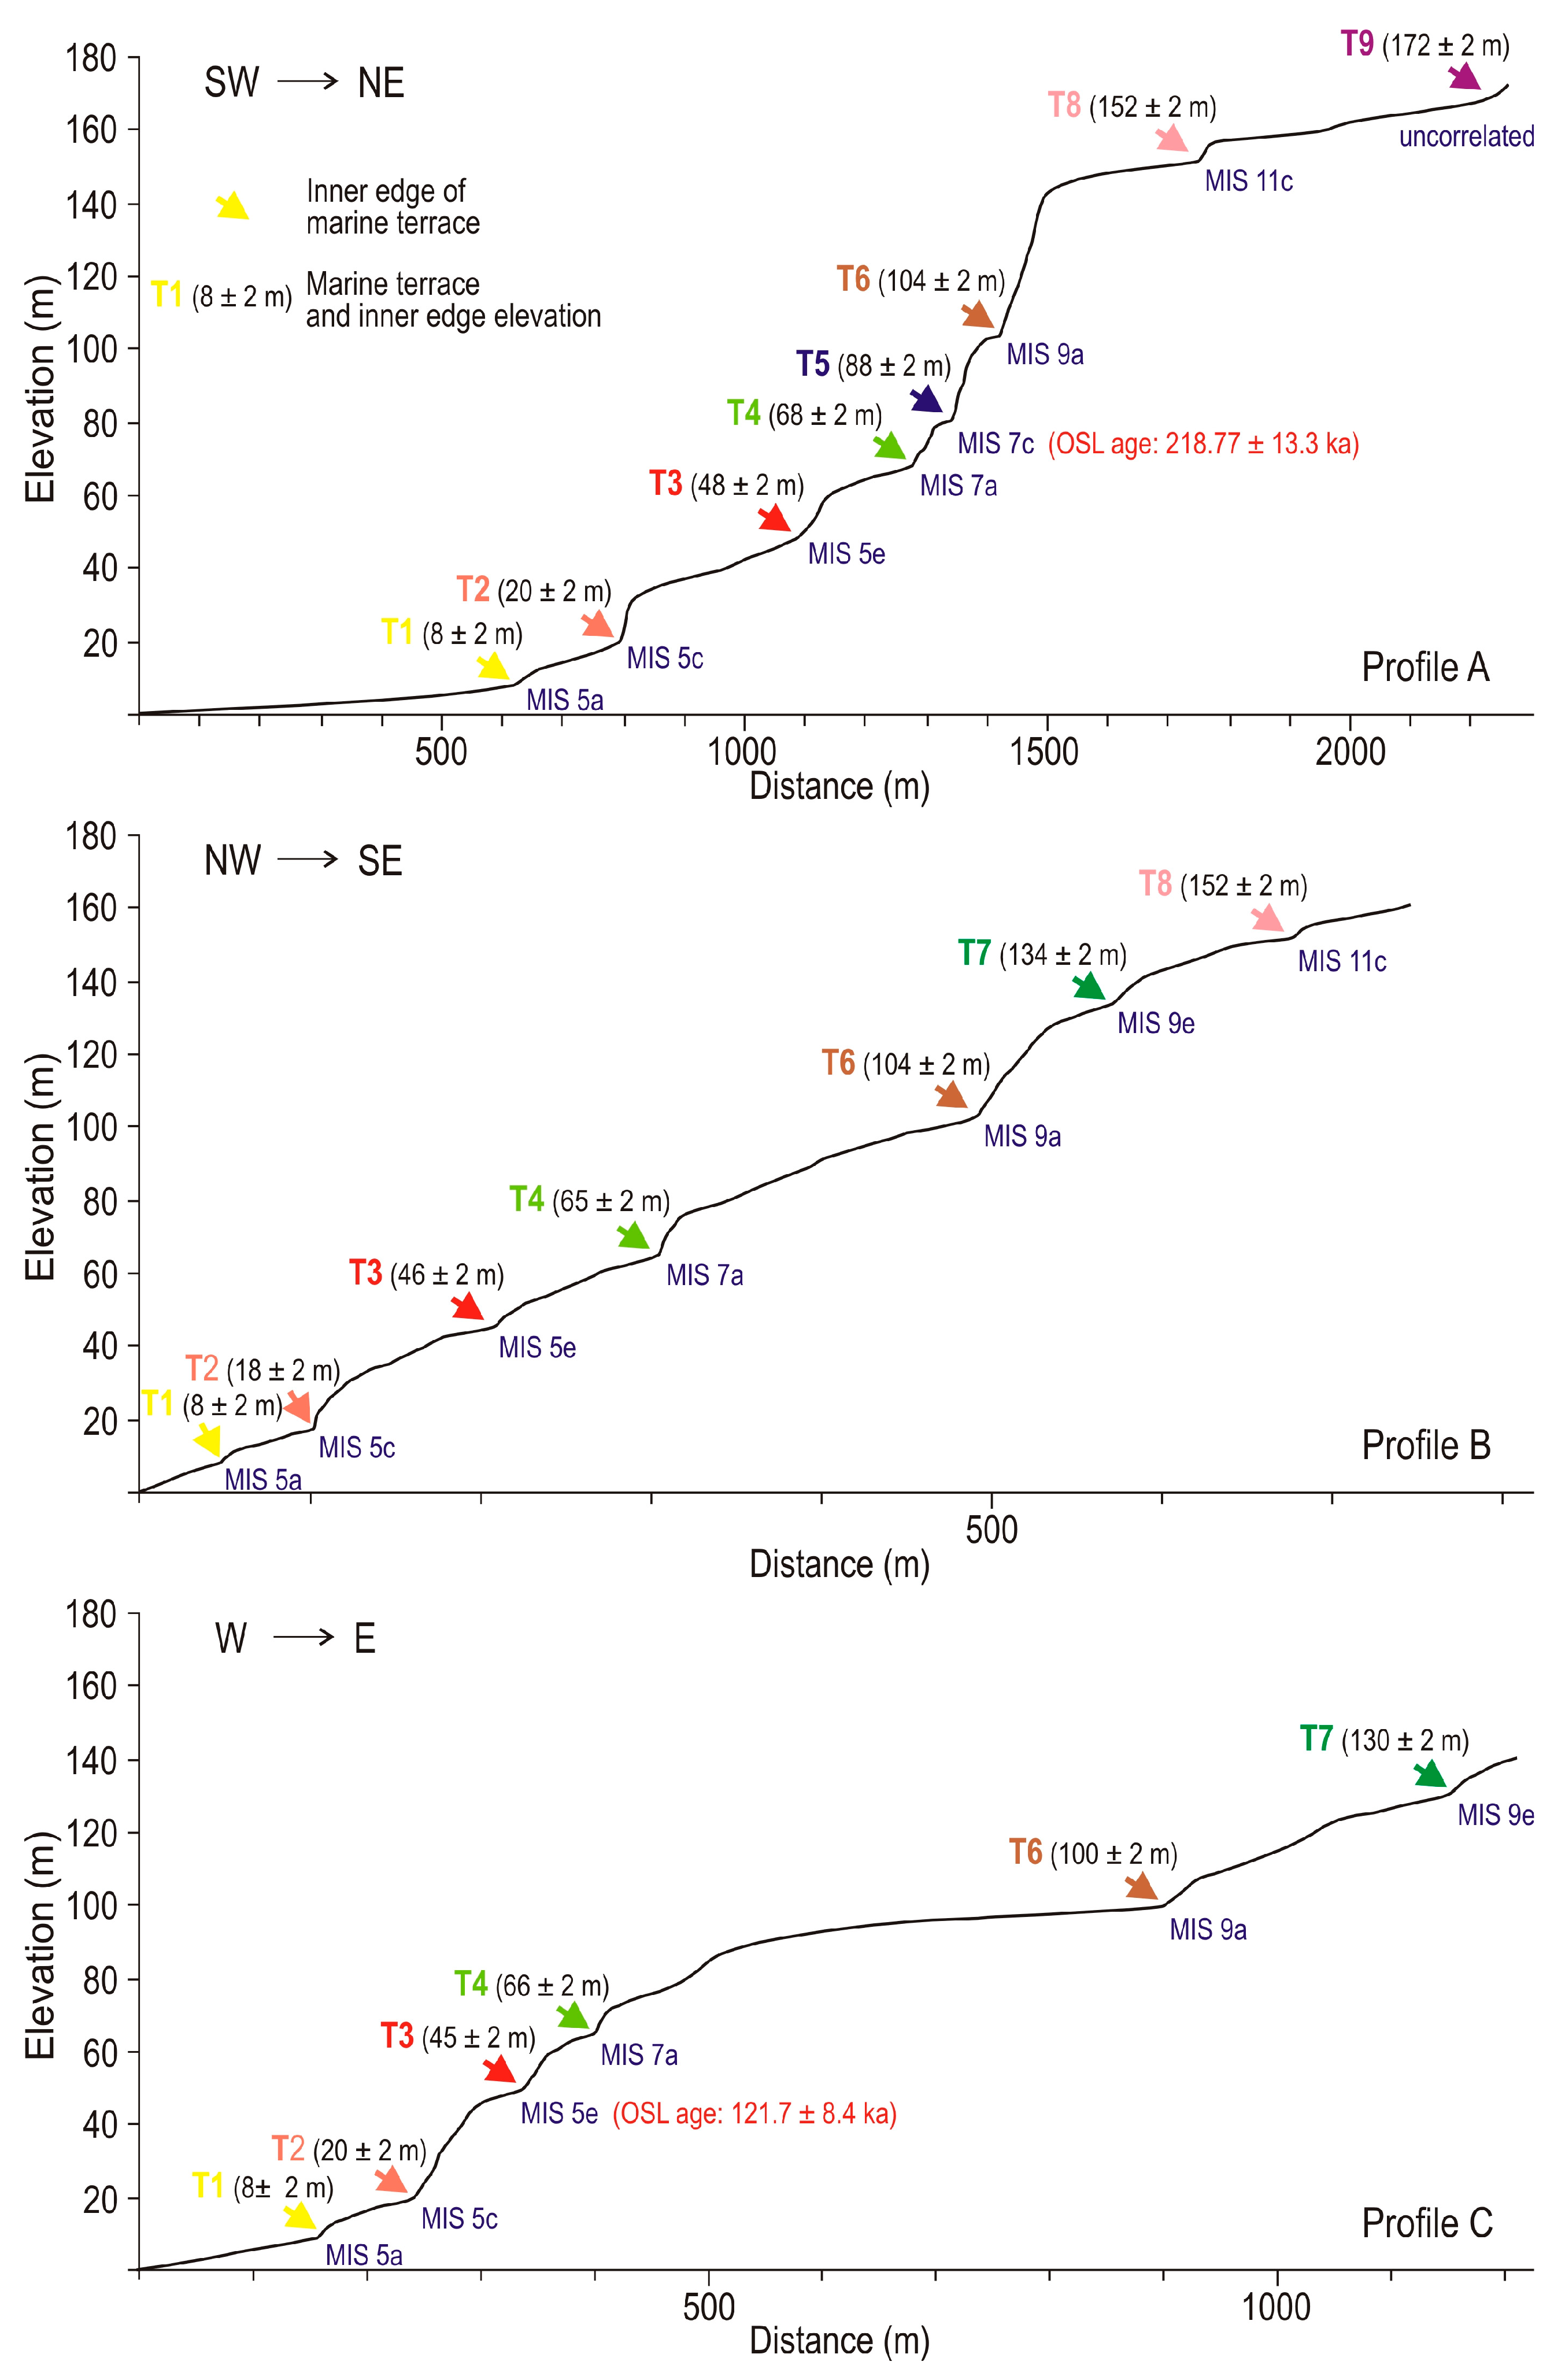
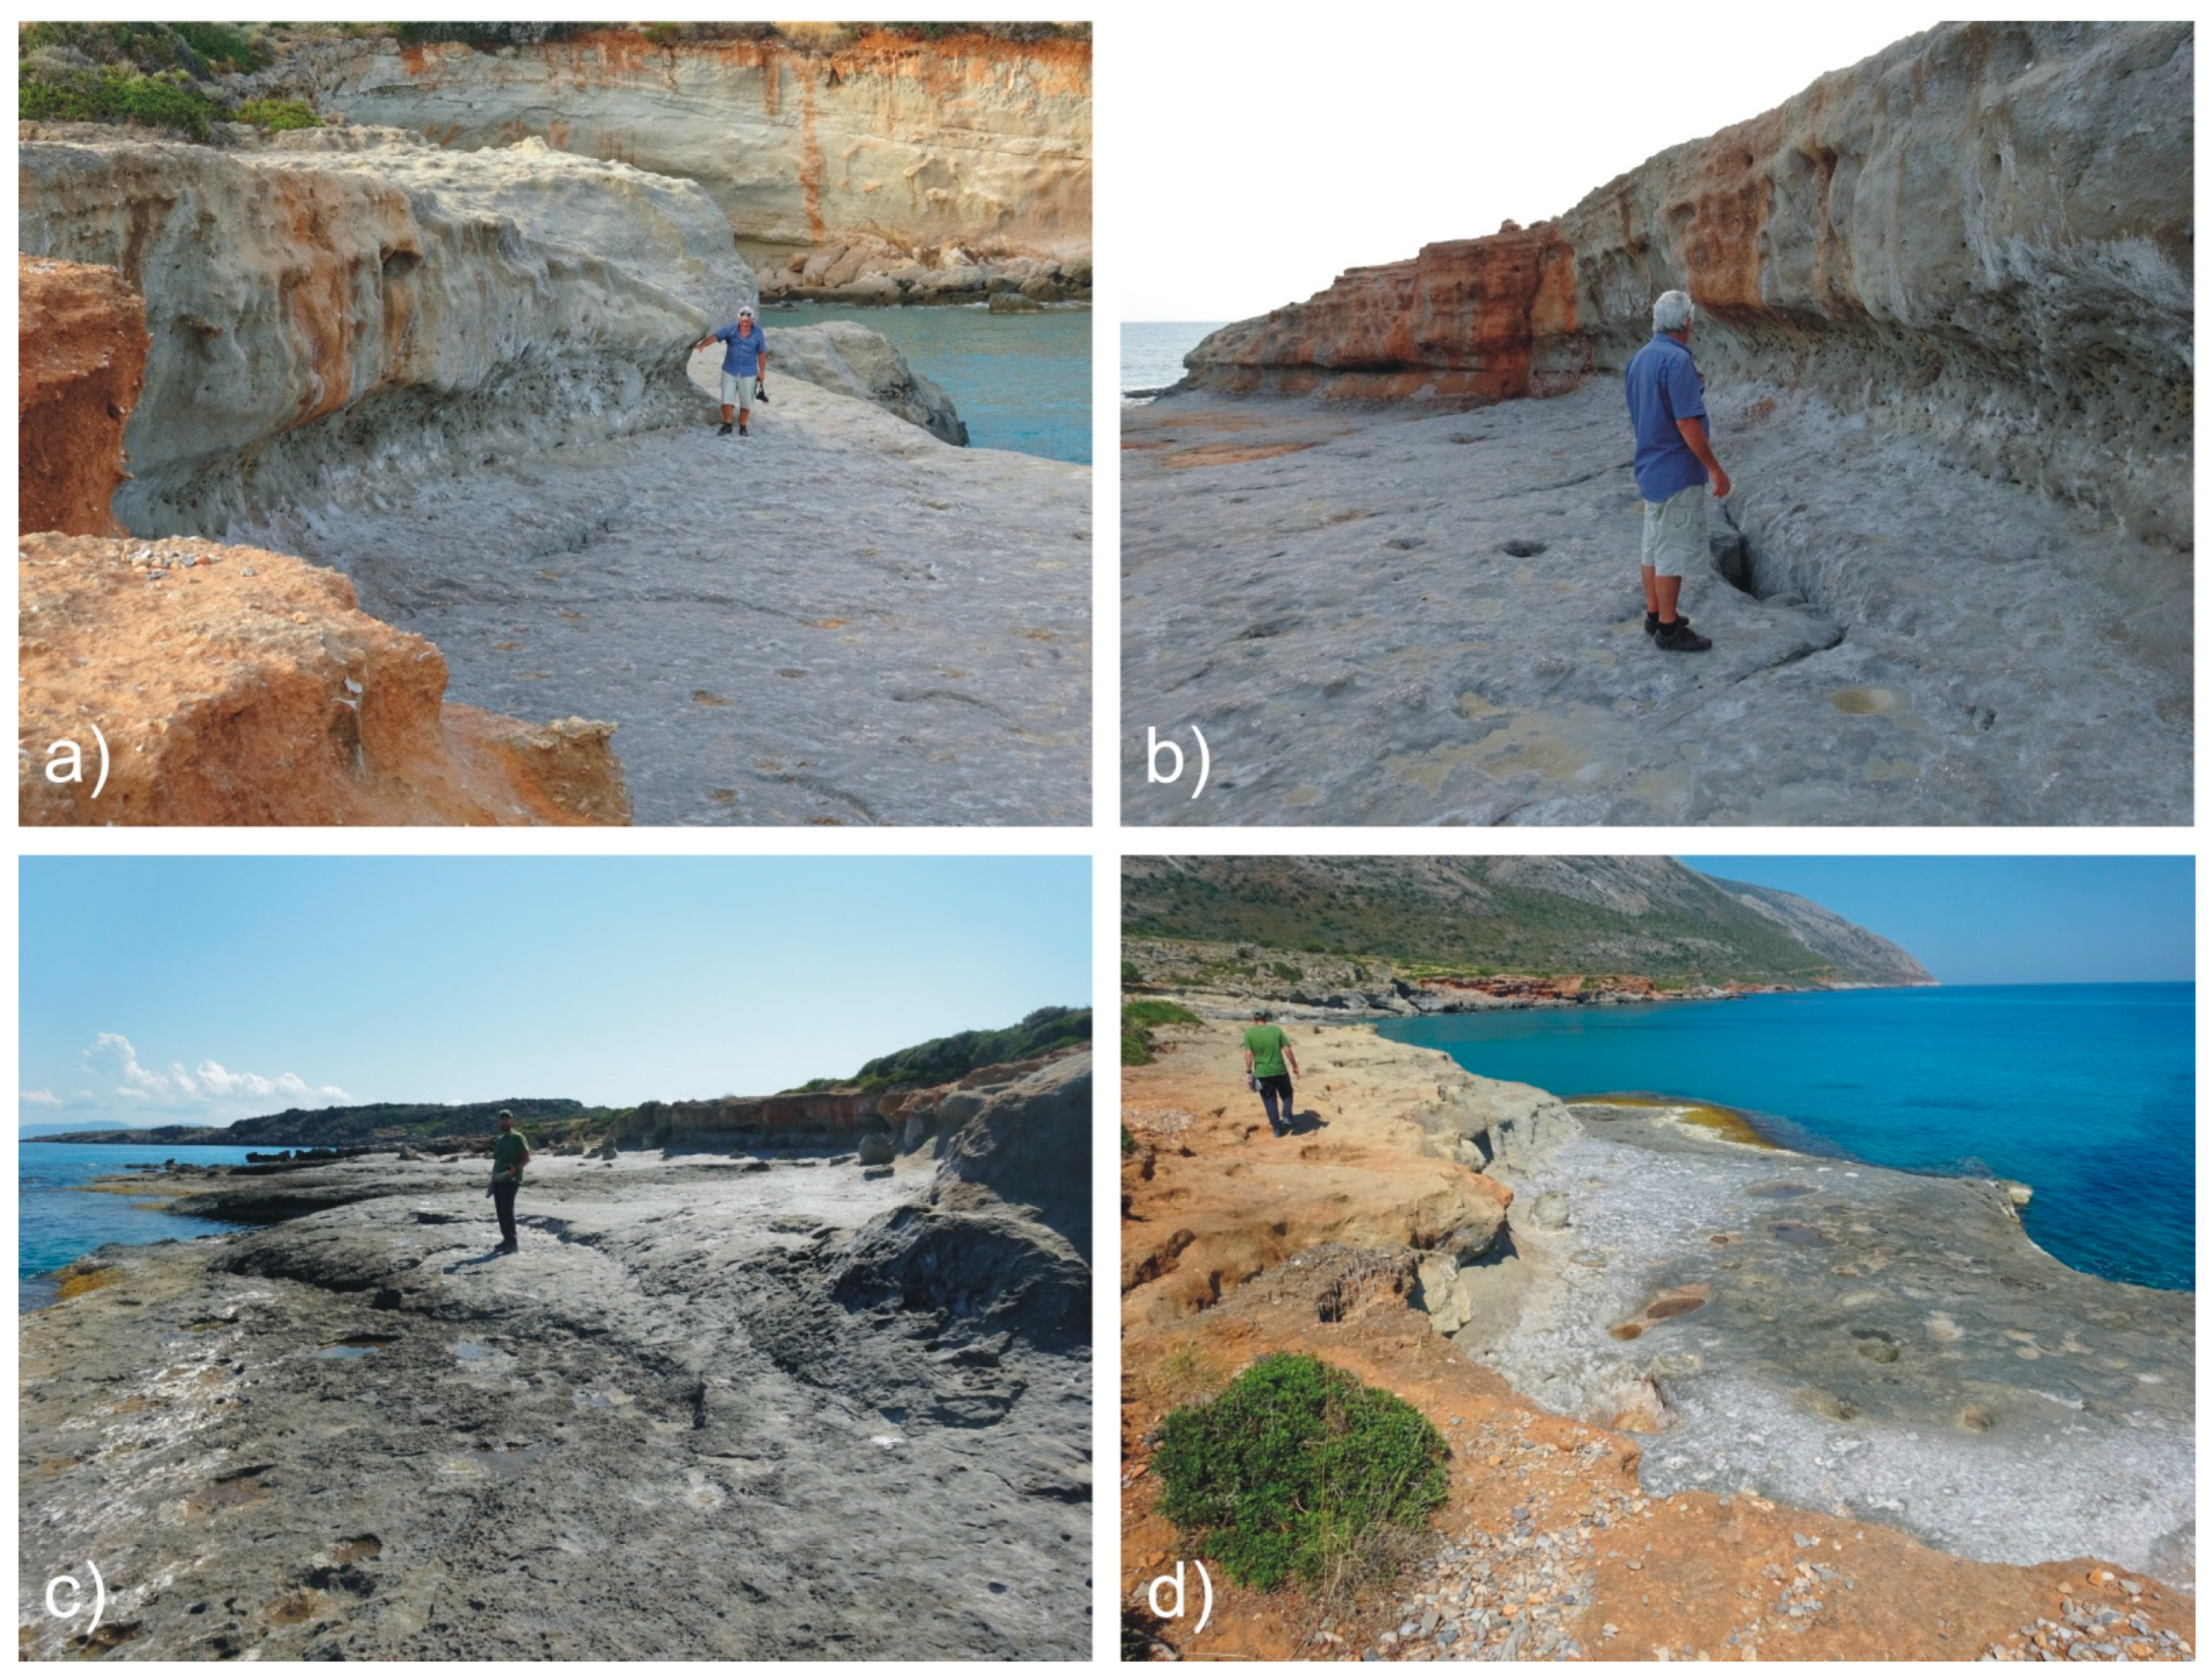
4.1. Mapping
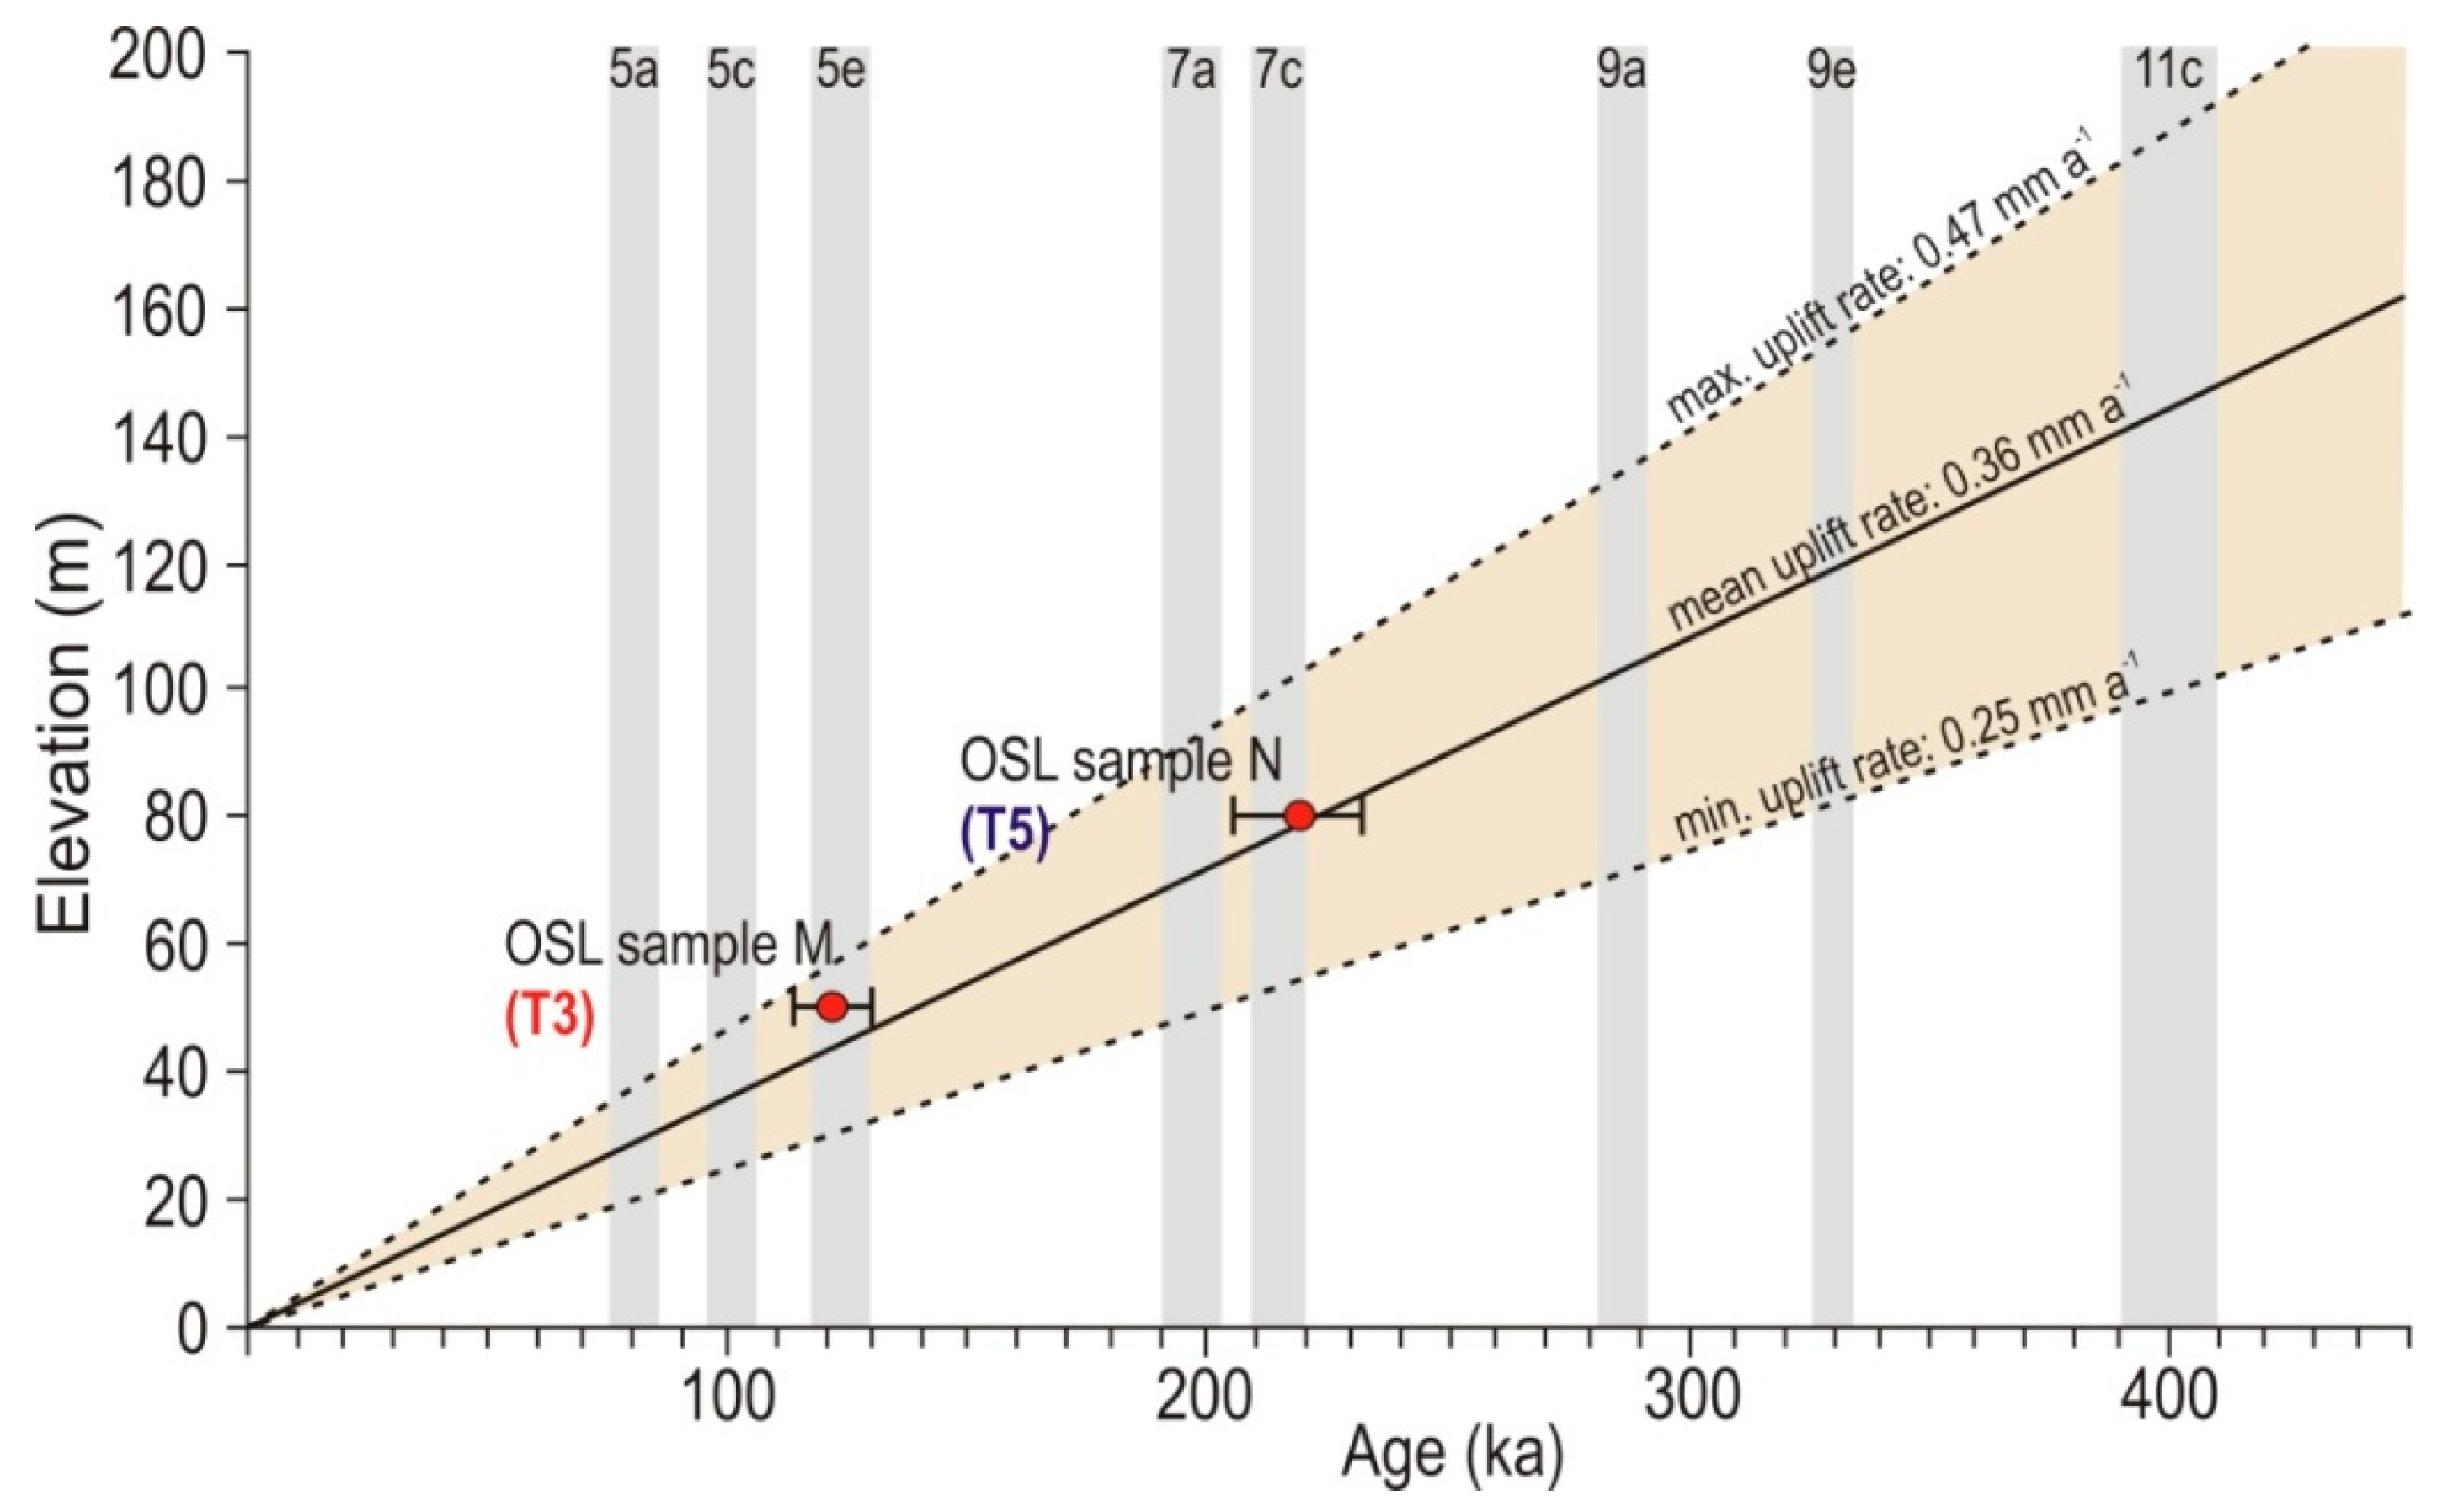
4.2. Optically Stimulated Luminescence (OSL) Ages and Tectonic Uplift
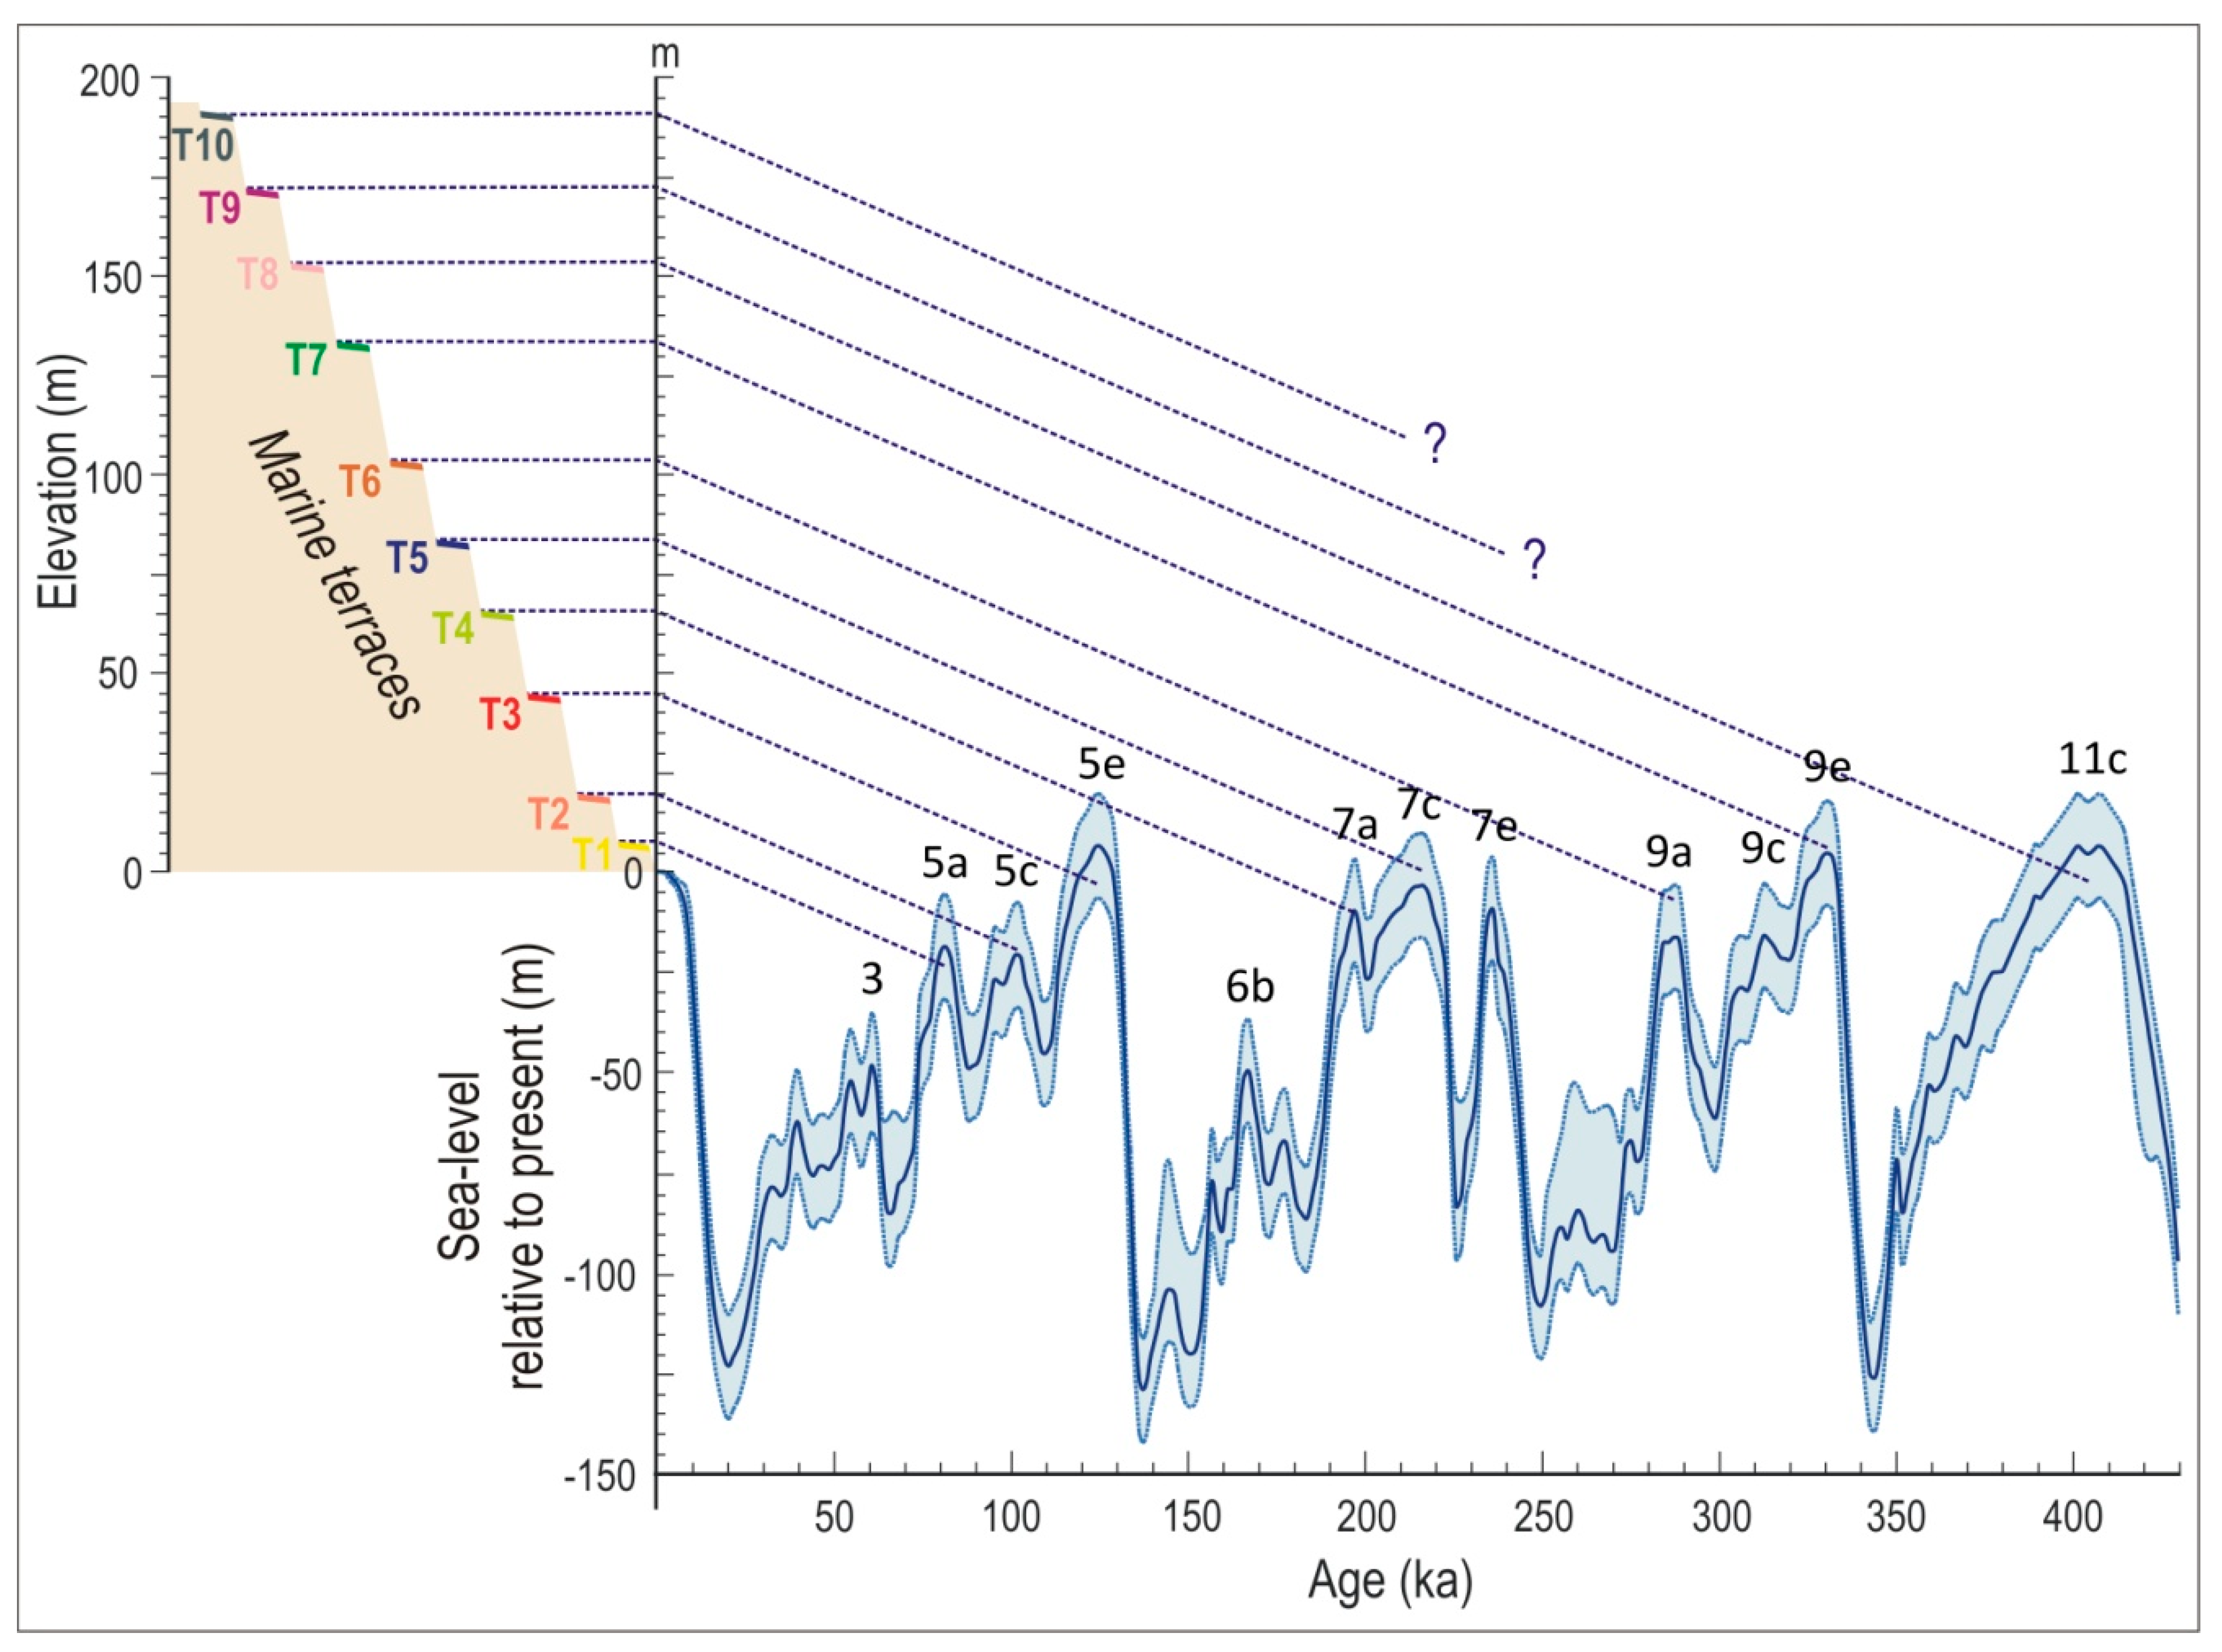
4.3. Correlation of the Undated Marine Terraces with Past Sea-Level Highstands
5. Conclusions
Author Contributions
Funding
Data Availability Statement
Acknowledgments
Conflicts of Interest
References
- Lajoie, K.R. Coastal tectonics. In Active Tectonics—Geophysics Series; Wallace, R., Ed.; National Academy Press: Washington, DC, USA, 1986; pp. 95–124. [Google Scholar]
- Marquardt, C.; Lavenu, A.; Ortlieb, L.; Godoy, E.; Comte, D. Coastal neotectonics in Southern Central Andes: Uplift and deformation of marine terraces in Northern Chile (27°S). Tectonophysics 2004, 394, 193–219. [Google Scholar] [CrossRef]
- Pedoja, K.; Husson, L.; Regard, V.; Cobbold, P.R.; Ostanciaux, E.; Johnson, M.E.; Kershaw, S.; Saillard, M.; Martinod, J.; Furgerot, L.; et al. Relative sea-level fall since the last interglacial stage: Are coasts uplifting worldwide? Earth Sci. Rev. 2011, 108, 1–15. [Google Scholar] [CrossRef]
- Strobl, M.; Hetzel, R.; Fassoulas, C.; Kubik, P.W. A long-term uplift rate for eastern Crete and geodynamic implications for the Hellenic subduction zone. J. Geodyn. 2014, 78, 21–31. [Google Scholar] [CrossRef]
- Merritts, D.; Bull, W.B. Interpreting Quaternary uplift rates at the Mendocino triple junction, northern California, from uplifted marine terraces. Geology 1989, 17, 1020–1024. [Google Scholar] [CrossRef]
- Armijo, R.; Meyer, B.; King, G.; Rigo, A.; Papanastassiou, D. Quaternary evolution of the Corinth Rift and its implications for the Late Cenozoic evolution of the Aegean. Geophys. J. Int. 1996, 126, 11–53. [Google Scholar] [CrossRef] [Green Version]
- Tortorici, G.; Bianca, M.; de Guidi, G.; Monaco, C.; Tortorici, L. Fault activity and marine terracing in the Capo Vaticano area (southern Calabria) during the Middle-Late Quaternary. Quat. Int. 2003, 101–102, 269–278. [Google Scholar] [CrossRef]
- Gallen, S.F.; Wegmann, K.W.; Bohnenstiehl, D.R.; Pazzaglia, F.J.; Brandon, M.T. Active simultaneous uplift and margin-normal extension in a forearc high, Crete, Greece. Earth Planet. Sci. Lett. 2014, 398, 11–24. [Google Scholar] [CrossRef]
- Mouslopoulou, V.; Begg, J.; Nicol, A.; Oncken, O.; Prior, C. Formation of Late Quaternary paleoshorelines in Crete, Eastern Mediterranean. Earth Planet. Sci. Lett. 2015, 431, 294–307. [Google Scholar] [CrossRef]
- Ott, R.F.; Gallen, S.F.; Wegmann, K.W.; Biswas, R.H.; Hrman, F.; Willet, S.D. Pleistocene terrace formation, Quaternary rock uplift rates and geodynamics of the Hellenic Sunduction Zone revealed from dating of palaeoshorelines on Crete, Greece. Earth Planet. Sci. Lett. 2019, 525, 115757. [Google Scholar] [CrossRef]
- Robertson, J.; Roberts, G.P.; Iezzi, F.; Meschis, M.; Gheorghiu, D.M.; Sahy, D.; Bristow, C.; Sgambato, C. Distributed normal faulting in the tip zone of the South Alkyonides Fault System, Gulf of Corinth, constrained using 36Cl exposure dating of late-Quaternary wave cut platforms. J. Struct. Geogr. 2020, 136, 104063. [Google Scholar] [CrossRef] [Green Version]
- Cerrone, C.; Ascione, A.; Robustelli, G.; Tuccimei, P.; Soligo, M.; Balassone, G.; Mormone, A. Late Quaternary uplift and sea-level fluctuations along the Tyrrhenian margin of Basilicata—Northern Calabria (southern Italy): New constrains from raised paleoshorelines. Geomorphology 2021, 395, 107978. [Google Scholar] [CrossRef]
- Burbank, D.W.; Anderson, R.S. Tectonic Geomorphology, 2nd ed.; Wiley-Blackwell: Chelsea, UK, 2011; p. 460. [Google Scholar]
- Anderson, R.S.; Densmore, A.; Ellist, M. The generation and degradation of marine terraces. Basin Res. 1999, 11, 7–19. [Google Scholar] [CrossRef]
- Scott, A.; Pinter, N. Extraction of Coastal Terraces and Shoreline-Angle Elevations from Digital Terrain Models, Santa Cruz and Anacapa Islands, California. Phys. Geogr. 2003, 24, 271–294. [Google Scholar] [CrossRef]
- Jara-Muñoz, J.; Melnick, D.; Strecker, M.R. TerraceM: A MATLAB® tool to analyze marine and lacustrine terraces using high-resolution topography. Geosphere 2016, 12, 176–195. [Google Scholar] [CrossRef]
- Carobene, L.; Dai Pra, G. Middle and Upper Pleistocene sea-level high-stands along the Tyrrhenian coast of Basilicata (southern Italy). Il Quaternario 1991, 4, 173–202. [Google Scholar]
- Westaway, R. Quaternary uplift of southern Italy. J. Geophys. Res. 1993, 98, 21741–21772. [Google Scholar] [CrossRef]
- Cinque, A.; De Pippo, T.; Romano, P. Coastal slope terracing and relative sea-level changes: Deductions based on computer simulations. Earth Surf. Process. Landf. 1995, 20, 87–103. [Google Scholar] [CrossRef]
- Gaki-Papanastassiou, K.; Karymbalis, E.; Papanastassiou, D.; Maroukian, H. Quaternary marine terraces as indicators of neotectonic activity of the Ierapetra normal fault SE Crete (Greece). Geomorphology 2009, 104, 38–46. [Google Scholar] [CrossRef]
- Bianca, M.; Catalano, S.; De Guidi, G.; Gueli, A.M.; Monaco, C.; Ristuccia, G.M.; Stella, G.; Tortorici, G.; Tortorici, L.; Troja, S.O. Luminescence chronology of Pleistocene marine terraces of Capo Vaticano peninsula (Calabria, Southern Italy). Quat. Int. 2011, 232, 114–121. [Google Scholar] [CrossRef]
- Shackleton, N.J.; Opdyke, N.D. Oxygen isotope and palaeomagnetic stratigraphy of Equatorial Pacific core V28-238: Oxygen isotope temperature and ice volumes on a 105 year and 106 year time scale. Quat. Res. 1973, 3, 39–55. [Google Scholar] [CrossRef]
- Martinson, D.G.; Pisias, N.G.; Hays, J.D.; Imbrie, J.; Moore, T.C., Jr.; Shakleton, N.J. Age dating and the orbital theory of ice ages: Development of a high-resolution 0 to 300,000 years chronostratigraphy. Quat. Res. 1987, 27, 1–29. [Google Scholar] [CrossRef] [Green Version]
- Chappell, J.; Omura, A.; Esat, T.; McCulloch, M.; Pandolfi, J.; Ota, Y.; Pillans, B. Reconciliation of late Quaternary sea levels derived from coral terraces at Huon Peninsula with deep-sea oxygen isotope records. Earth Planet. Sci. Lett. 1996, 141, 227–236. [Google Scholar] [CrossRef]
- Waelbroeck, C.; Labeyrie, L.; Michel, E.; Duplessy, J.C.; McManus, J.F.; Lambeck, K.; Baldon, E.; Labracherie, M. Sea-level and deep water temperature changes derived from benthic foraminifera isotopic records. Quat. Sci Rev. 2002, 21, 295–305. [Google Scholar] [CrossRef]
- Caputo, R. Sea-level curves: Perplexities of an end-user in morphotectonic applications. Glob. Planet. Chang. 2007, 57, 417–423. [Google Scholar] [CrossRef]
- Zazo, C.; Goy, J.L.; Hilaire-Marcle, C.; Gillot, P.Y.; Soler, V.; Gonzalez, J.A.; Dabrio, C.; Ghaleb, B. Raised marine sequences of Lanzarote and Fuerteventura revisited—A reappraisal of relative sea-level changes and vertical movements in the eastern Canary Islands during the Quaternary. Quat. Sci. Rev. 2002, 21, 2019–2046. [Google Scholar] [CrossRef] [Green Version]
- Normand, R.; Simpson, G.; Herman, F.; Biswas, R.H.; Bahroudi, A.; Schneider, B. Dating and morpho-stratigraphy of uplifted marine terraces in the Markan subduction zone (Iran). Earth Surf. Dyn. 2019, 7, 321–344. [Google Scholar] [CrossRef] [Green Version]
- De Gelder, G.; Fernández-Blanco, D.; Melnick, D.; Duclaux, G.; Bell, R.E.; Jara-Muñoz, J.; Armijo, R.; Lacassin, R. Lithospheric flexure and rheology determined by climate cycle markers in the Corinth Rift. Sci. Rep. 2019, 9, 4260. [Google Scholar] [CrossRef] [PubMed] [Green Version]
- Racano, S.; Jara Muñoz, J.; Cosentino, D.; Melnick, D. Variable quaternary uplift along the southern margin of the central Anatolian plateau inferred from modeling marine terrace sequences. Tectonics 2020, 39, e2019TC005921. [Google Scholar] [CrossRef]
- Choi, J.H.; Murray, A.S.; Jain, M.; Cheong, C.S.; Chang, H.W. Luminescence dating of well-sorted marine terrace sediments on the southeastern coast of Korea. Quat. Sci. Rev. 2003, 22, 407–421. [Google Scholar] [CrossRef]
- Choi, J.H.; Kim, J.W.; Murray, A.S.; Hong, D.G.; Chang, H.W.; Cheong, C.S. OSL dating of marine terrace sediments on the southeastern coast of Korea with implications for Quaternary tectonics. Quat. Int. 2009, 199, 3–14. [Google Scholar] [CrossRef]
- Lal, D. Cosmic ray labeling of erosion surfaces: In situ nuclide production rates and erosion models. Earth Planet. Sci. Lett. 1991, 104, 424–439. [Google Scholar] [CrossRef]
- Niedermann, S. Cosmic-ray-produced noble gases in terrestrial rocks: Dating tools for surface processes. Rev. Miner. Geochem. 2002, 47, 731–784. [Google Scholar] [CrossRef]
- Perg, L.A.; Anderson, R.S.; Finkel, R.C. Use of 10Be and 26Al inventory to date marine terraces, Santa Cruz, California, USA. Geology 2001, 19, 879–882. [Google Scholar] [CrossRef]
- Nishiizumi, K.; Winterer, E.L.; Kohl, C.P.; Klein, J.; Middleton, R.; Lal, D.; Arnold, J.R. Cosmic ray production rates of 10Be and 26Al in quartz from glacially polished rocks. J. Geophys. Res. 1989, 94, 17907–17915. [Google Scholar] [CrossRef]
- Muhs, D.R.; Kennedy, G.L.; Rockwell, T.K. Uranium series ages of marine terrace corals from the Pacific coast of North America and implications for last-interglacial sea-level history. Quat. Res. 1994, 42, 72–87. [Google Scholar] [CrossRef]
- Maroukian, H.; Gaki-Papanastassiou, K.; Karymbalis, E.; Vouvalidis, K.; Pavlopoulos, K.; Papanastassiou, D.; Albanakis, K. Morphotectonic control on drainage network evolution in the Perachora peninsula, Greece. Geomorphology 2008, 102, 81–92. [Google Scholar] [CrossRef]
- Gaki-Papanastassiou, K.; Maroukian, H.; Kourbanian, V. The morphotectonic evolution of the southern half of Kythera island, Ionian sea, Greece, during the Quaternary. Prace Geogr. 2011, 127, 49–60. [Google Scholar]
- Karymbalis, Ε.; Papanastassiou, D.; Gaki-Papanastassiou, Κ.; Tsanakas, K.; Maroukian, H. Geomorphological study of Cephalonia Island, Ionian Sea, Western Greece. J. Maps 2013, 9, 121–134. [Google Scholar] [CrossRef]
- Karymbalis, E.; Papanastassiou, D.; Gaki-Papanastassiou, K.; Ferentinou, M.; Chalkias, C. Late Quaternary rates of stream incision in Northeast Peloponnese, Greece. Front. Earth Sci. 2016, 10, 455–478. [Google Scholar] [CrossRef]
- Fernández-Blanco, D.; De Gelder, G.; Lacassin, R.; Armijo, R. A new crustal formed the modern Corinth Rift. Earth Sci. Rev. 2019, 199, 102919. [Google Scholar] [CrossRef] [Green Version]
- Sebrier, M. Tectonique Recente d’une Transversale a l’Arc Egeen: Le Golfe de Corinthe et ses Regions Peripheriques; These 3me cycle; Université Paris-Sud: Paris, France, 1977. [Google Scholar]
- Dufaure, J.J.; Zamanis, A. Styles neotectoniques et etagements de nivaux marins sur un segment d’arc insulaire, le Peloponnese. In Proceedings of the Conference Niveaux Marins et Tectonique Quaternaire dans l’Aire Mediterraneenne, Paris, France, 29 November 1980; C.N.R.S. Université de Paris II: Paris, France, 1980; pp. 77–107. [Google Scholar]
- Keraudren, B.; Sorel, D. The terraces of Corinth (Greece): A detailed record of eustatic sea-level variations during the last 500,000 years. Mar. Geol. 1987, 77, 99–107. [Google Scholar] [CrossRef]
- De Martini, M.P.; Pantosti, D.; Palyvos, N.; Lemeille, F.; Mc Neill, L.; Collier, R. Slip rates of the Aigion and Eliki faults from uplifted marine terraces, Corinth Gulf, Greece. Comptes Rendus Geosci. 2004, 336, 325–334. [Google Scholar] [CrossRef]
- McNeill, L.C.; Collier, R.E.L. Uplift and slip rates of the eastern Eliki fault segment, Gulf of Corinth, Greece, inferred from Holocene and Pleistocene terraces. J. Geol. Soc. Lond. 2004, 161, 81–92. [Google Scholar] [CrossRef]
- Dermitzakis, M. Geological investigation on the Neogene of the Ierapetra area, Crete Island. Ann. Geol. Pays Hell. 1969, 21, 342–484. (In Greek) [Google Scholar]
- Angelier, J.; Gigout, M. Sur les plates-formes marines et la neotectonique Quaternaires de la region d’Ierapetra (Crete, Grece). CR Acad. Sci. Paris 1974, 278, 2103–2106. [Google Scholar]
- Tiberti, M.M.; Basili, R.; Vannoli, P. Ups and downs in western Crete (Hellenic subduction zone). Sci. Rep. 2014, 4, 5677. [Google Scholar] [CrossRef] [PubMed] [Green Version]
- Theodoropoulos, D. Geological and Morphological observations in the area of Neapolis Vion. Ann. Geol. Pays Hellen. 1974, 25, 445–466. [Google Scholar]
- Kelletat, D.; Kowalczyk, G.; Schroder, B.; Winter, K.P. A synoptic view on the neotectonic development of the Peloponnesian coastal region. Z. Dtsch. Geol. Ges. 1976, 127, 447–465. [Google Scholar] [CrossRef]
- Lekkas, S.; Zambetakis, A.; Kapralos, E.; Mazarakis, K. Geological observations in Elafonissos. Bull. Geol. Soc. Greece 1988, XX, 67–82. [Google Scholar]
- Kourampas, N. Plio-Quaternary Sedimentation and Geomorphology within an Active Fore-Arc: Messenia and Eastern Lakonia Peninsulae, Southern Peloponnese, Greece. Ph.D. Thesis, University of Edinburg, Edinburg, UK, 2001. [Google Scholar]
- De Gelder, G.; Jara-Munoz, J.; Melnick, D.; Fernandez-Blanco, D.; Rouby, H.; Pedoja, K.; Husson, L.; Armijo, R.; Lacassin, R. How do sea-level curves influence modeled marine terrace sequences? Quat. Sci. Rev. 2020, 229, 106132. [Google Scholar] [CrossRef] [Green Version]
- Karymbalis, E.; Chalkias, C.; Ferentinou, M.; Chalkias, G.; Magklara, M. Assessment of the Sensitivity of Salamina and Elafonissos islands to Sea-level Rise. J. Coast. Res. 2014, 70, 378–384. [Google Scholar] [CrossRef]
- McClusky, S.; Balassanian, S.; Barka, A.; Demir, C.; Ergintav, S.; Georgiev, I.; Gurkan, O.; Hamburger, M.; Hurst, K.; Kahle, H.; et al. Global positioning system constraints on plate kinematics and dynamics in the eastern Mediterranean and Caucasus. J. Geophys. Res. Solid Earth 2000, 105, 5695–5719. [Google Scholar] [CrossRef]
- Reilinger, R.; McClusky, S.; Vernant, P.; Lawrence, S.; Ergintav, S.; Cakmak, R.; Ozener, H.; Kadirov, F.; Guliev, I.; Stepanyan, R.; et al. GPS constraints on continental deformation in the Africa–Arabia–Eurasia continental collision zone and implications for the dynamics of plate interactions. J. Geophys. Res. Solid Earth 2006, 111, 26. [Google Scholar] [CrossRef]
- Kahle, H.; Cocard, M.; Peter, Y.; Geiger, A.; Reilinger, R.; Barka, A.; Veis, G. GPS-derived strain rate field with the boundary zones of the Eurasian, African and Arabian Plates. J. Geophys. Res. 2000, 105, 23353–23370. [Google Scholar] [CrossRef]
- Hollenstein, C.; Müller, M.D.; Geiger, A.; Kahle, H.G. Crustal motion and deformation in Greece from a decade of GPS measurements, 1993–2003. Tectonophysics 2008, 449, 17–40. [Google Scholar] [CrossRef]
- Wortel, M.J.R.; Spakman, W. Subduction and slab detachment in the Mediterranean–Carpathian region. Science 2000, 290, 1910–1917. [Google Scholar] [CrossRef]
- Papazachos, B.C.; Karakostas, V.G.; Papazachos, C.B.; Scordilis, E.M. The geometry of the Wadati-Benioff zone and lithospheric kinematics in the Hellenic arc. Tectonophysics 2000, 319, 275–300. [Google Scholar] [CrossRef]
- Spakman, W.; Wortel, M.J.R.; Vlaar, N.J. The Hellenic subduction zone: A tomographic image and its geodynamic implications. Geophys. Res. Lett. 1988, 15, 60–63. [Google Scholar] [CrossRef]
- Pe-Piper, G.; Piper, D.J.W. The Igneous Rocks of Greece: The Anatomy of an Orogen; Gebruder Borntraeger: Berlin, Germany, 2002; p. 288. [Google Scholar]
- Faccenna, C.; Jolivet, L.; Piromallo, C.; Morelli, A. Subduction and the depth of convection in the Mediterranean mantle. J. Geophys. Res. 2003, 108, 2099. [Google Scholar] [CrossRef]
- van Hinsbergen, D.J.J.; Hafkenscheid, E.; Spakman, W.; Meulenkamp, J.E.; Wortel, R. Nappe stacking resulting from subduction of oceanic and continental lithosphere below Greece. Geology 2005, 33, 325–328. [Google Scholar] [CrossRef] [Green Version]
- Vött, A. Relative sea-level changes and regional tectonic evolution of seven coastal areas in NW Greece since the mid-Holocene. Quat. Sci. Rev. 2007, 26, 894–919. [Google Scholar] [CrossRef]
- I.G.M.E. Geological Map of Greece (Scale 1:50,000) Sheet Neapolis-Ag. Nikolaos; Institute of Geology and Mineral Exploration of Greece: Athens, Greece, 1999. [Google Scholar]
- Lekkas, S.; Alexopoulos, A.; Danamos, G. Neotectonic Map of Greece: Gythio, Neapolis, Elafonisos Sheets, Scale 1/100,000; Earthquake Planning and Protection Organization (EPPO) and the European Center on Prevention and Forecasting of Earthquakes (ECPFE): Athens, Greece, 1997. [Google Scholar]
- Karymbalis, E.; Gaki-Papanastassiou, K.; Tsanakas, K.; Ferentinou, M. Geomorphology of the Pinios River delta, Greece. J. Maps 2016, 12, 12–21. [Google Scholar] [CrossRef] [Green Version]
- Tsanakas, K.; Karymbalis, E.; Gaki-Papanastassiou, K.; Maroukian, H. Geomorphology of the Pieria Mtns, Northern Greece. J. Maps 2019, 15, 499–508. [Google Scholar] [CrossRef] [Green Version]
- Lamothe, M. Luminescence dating of interglacial coastal depositional systems: Recent developments and future avenues of research. Quat. Sci. Rev. 2016, 146, 1–27. [Google Scholar] [CrossRef]
- Murray, A.S.; Olley, J.M. Precision and accuracy in the optically stimulated luminescence dating of sedimentary quartz: A status review. Geochronometria 2002, 21, 1–16. [Google Scholar]
- Tsodoulos, I.M.; Stamoulis, K.; Caputo, R.; Koukouvelas, I.; Chatzipetros, A.; Pavlides, S.; Gallousi, C.; Papachristodoulou, C.; Ioannides, K. Middle-Late Holocene earthquake history of the Gyrtoni Fault, Central Greece: Insight from optically stimulated luminescence (OSL) dating and paleoseismology. Tectonophysics 2016, 687, 14–27. [Google Scholar] [CrossRef]
- Duller, G.A.T. Distinguishing quartz and feldspar in single grain luminescence measurements. Radiat. Meas. 2003, 37, 161–165. [Google Scholar] [CrossRef]
- Duller, G.A.T. Single-grain optical dating of Quaternary sediments: Why aliquot size matters in luminescence dating. Boreas 2008, 37, 589–612. [Google Scholar] [CrossRef]
- Bøtter-Jensen, L.; Thomsen, K.J.; Jain, M. Review of optically stimulated luminescence (OSL) instrumental developments for retrospective dosimetry. Radiat. Meas. 2010, 45, 253–257. [Google Scholar] [CrossRef]
- Murray, A.S.; Wintle, A.G. Luminescence dating of quartz using an improved single-aliquot regenerative-dose protocol. Radiat. Meas. 2000, 32, 57–73. [Google Scholar] [CrossRef]
- Liritzis, I.; Stamoulis, K.; Papachristodoulou, C.; Ioannides, K. A re-evaluation of radiation dose-rate conversion factors. Mediterr. Archaeol. Archaeom. 2013, 13, 1–15. [Google Scholar]
- Durcan, J.A.; King, G.E.; Duller, G.A.T. DRAC: Dose rate and age calculator for trapped charge dating. Quat. Geochronol. 2015, 28, 54–61. [Google Scholar] [CrossRef] [Green Version]
- Chappell, J. Geology of coral terraces, Huon Peninsula, New Guinea: A study of Quaternary tectonic movements and sea-level changes. Geol. Soc. Am. Bull. 1974, 85, 553–570. [Google Scholar] [CrossRef]
- Valensise, G.; Ward, S. Long-term uplift of the Santa Cruz coastline in response to repeated earthquakes along the San Andreas fault. Bull. Seism. Soc. Am. 1991, 81, 1694–1704. [Google Scholar]
- Giunta, G.; Gueli, A.M.; Monaco, C.; Orioli, S.; Ristuccia, G.M.; Stella, G.; Troja, S.O. Middle-Late Pleistocene marine terraces and fault activity in the Sant’Agata di Militello coastal area (north-eastern Sicily). J. Geodyn. 2012, 55, 32–40. [Google Scholar] [CrossRef]
- Papanastassiou, D.; Cundy, A.B.; Gaki-Papanastassiou, K.; Frogley, M.R.; Tsanakas, K.; Maroukian, H. The uplifted terraces of the Arkitsa region, NW Evoikos Gulf, Greece: A result of combined tectonic and volcanic processes? J Geol. 2014, 122, 397–410. [Google Scholar] [CrossRef] [Green Version]
- Rabineau, M.; Berné, S.; Olivet, J.L.; Aslanian, D.; Guillocheau, F.; Joseph, P. Paleo sea levels reconsidered from direct observation of paleo-shoreline position during Glacial Maxima (for the last 500,000 yr). Earth Planet. Sci. Lett. 2006, 252, 119–137. [Google Scholar] [CrossRef] [Green Version]
- Pedoja, K.; Husson, L.; Bezos, A.; Pastier, A.; Imran, A.M.; Arias-Ruiz, C.; Sarr, A.; Elliot, M.; Pons-Branchu, E.; Nexer, M.; et al. On the long-lasting sequences of coral reef terraces from SE Sulawesi (Indonesia): Distribution, formation, and global significance. Quat. Sci. Rev. 2018, 188, 37–57. [Google Scholar] [CrossRef] [Green Version]
- Yildirim, C.; Melnick, D.; Ballato, P.; Schildgen, T.F.; Echtler, H.; Erginal, A.E.; Kıyak, N.G.; Strecker, M.R. Differential uplift along the northern margin of the Central Anatolian Plateau: Inferences from marine terraces. Quat. Sci. Rev. 2013, 81, 12–28. [Google Scholar] [CrossRef]
- Lisiecki, L.E.; Raymo, M.E. A Pliocene–Pleistocene stack of 57 globally distributed benthic δ18O records. Paleoceanography 2005, 20, PA1003. [Google Scholar] [CrossRef] [Green Version]
- Caputo, R.; Bianca, M.; D’Onofrio, R. Ionian marine terraces of Southern Italy: Insights into the Quaternary tectonic evolution of the area. Tectonics 2010, 29, TC4005. [Google Scholar] [CrossRef]
- Aitken, M.J. Thermoluminescence Dating; Academic Press: Orlando, FL, USA; London, UK, 1985; p. 351. [Google Scholar]
- Prescott, J.R.; Hutton, J.T. Cosmic ray contribution to dose rates for luminescence and ESR dating: Large depths and long-term time variations. Radiat. Meas. 1994, 23, 497–500. [Google Scholar] [CrossRef]
- Galbraith, R.F.; Roberts, R.G.; Laslett, G.M.; Yoshida, H.; Olley, J.M. Optical dating of single and multiple grains of quartz from Jinmium rock shelter, northern Australia: Part I, experimental design and statistical models. Archaeometry 1999, 41, 339–364. [Google Scholar] [CrossRef]
- Gallup, C.D.; Edwards, R.L.; Johnson, R.G. The timing of high sea levels in the past 200,000 years. Science 1994, 263, 796–800. [Google Scholar] [CrossRef] [PubMed]
- Kim, K.J.; Sutherland, R. Uplift rate and landscape development in southwest Fiordland, New Zealand, determined using 10Be and 26Al exposure dating of marine terraces. Geochim. Cosmochim. Acta 2004, 68, 2313–2319. [Google Scholar] [CrossRef]
- Morewood, N.C.; Roberts, G.P. Lateral propagation of the surface trace of the South Alkyonides normal fault segment, central Greece: Its impact on models of fault growth and displacement–length relationships. J. Struc. Geol. 1999, 24, 3081–3084. [Google Scholar] [CrossRef]
- Houghton, S.; Roberts, G.; Papanikolaou, I.; McArthur, J. New 234U–230Th coral dates from the western Gulf of Corinth: Implications for extensional tectonics. Geophys. Res. Lett. 2003, 30. [Google Scholar] [CrossRef] [Green Version]
- Kowalczyk, G.; Winter, K.P.; Steinich, G.; Reisch, L. Jungpleistozane Strandterrassen in Siidost-Lakonien (Peloponnes, Griechenland). Schr. Geowiss. 1992, 1, 72. [Google Scholar]
- Imbrie, J.; Hayes, J.D.; Martinson, D.G.; Maclntyre, A.; Mix, A.; Morley, J.J.; Pisias, N.G.; Prell, W.; Shackleton, N.J. The orbital theory of the Pleistocene climate: Support from a revised chronology of the marine δ18O record. In Milankovitch and Climate; Berger, A., Imbrie, J., Hayes, J.D., Kukla, G., Saltzman, B., Eds.; D. Reidel Publishing Company: Hingham, MA, USA, 1984; pp. 269–305. [Google Scholar]


| Sample ID | Marine Terrace | Water Content (%) a | 238U (Bq/kg) b | 232Th (Bq/kg) b | 40K (Bq/kg) b | Total Dose Rate (Gy/ka) c | n d | Equivalent Dose De (Gy) e | Age (ka) f |
|---|---|---|---|---|---|---|---|---|---|
| M | T3 | 5.0 ± 10 | 12.5 ± 0.3 | 11.4 ± 0.4 | 127.5 ± 2.2 | 1.02 ± 0.04 | 16 (24) | 124.5 ± 7.9 | 121.7 ± 8.4 |
| N | T5 | 5.0 ± 10 | 17.3 ± 0.4 | 6.1 ± 0.3 | 69.6 ± 2.2 | 0.82 ± 0.03 | 23 (24) | 179.4 ± 9.3 | 218.8 ± 13.3 |
| Sample ID | OSL Age (ka) | Marine Terrace | Inner Edge Elevation (m) | Assigned MIS | Assigned MIS Age (ka) | Eustatic Estimations (m) | Uplift Rate (mm a−1) | |||
|---|---|---|---|---|---|---|---|---|---|---|
| E ± ΔE | A ± ΔA | Max. Elevation of the Sea-Level at the Time of the Assigned MIS | Min. Elevation of the Sea-Level at the Time of the Assigned MIS | Umax | Umin | U | ||||
| M | 121.71 ± 8.42 | T3 | 50 ± 2 | 5e | 124 ± 6 | +19 | −7 | 0.50 | 0.23 | 0.37 ± 0.13 |
| N | 218.77 ± 13.3 | T5 | 80 ± 2 | 7c | 215 ± 5.5 | −17 | +9 | 0.47 | 0.31 | 0.39 ± 0.08 |
| Terrace | Palaeoshoreline (Inner Edge) Elevation in Different Locations (m) | MIS | MIS Age (ka) | Sea-Level Correction (m) | Predicted Inner Edge Elevation (m) | ||||
|---|---|---|---|---|---|---|---|---|---|
| Elafonissos Island | Punta | Nepolis, Profitis Ilias, Agia Marina | min. | mean | max. | ||||
| T1 | 8 ± 2 | 8 ± 2 | 8 ± 2 | 5a | 81 ± 5 | (−32) | (−19) | (−6) | 12 ± 4 |
| T2 | 16–24 ± 2 | 20–24 ± 2 | 20–24 ± 2 | 5c | 101 ± 5 | (−34) | (−21) | (−8) | 15 ± 4 |
| T3 | 40–48 ± 2 | 40–48 ± 2 | 40–50 ± 2 | 5e | 124 ± 6 | (−7) | (+6) | (+19) | 50 ± 2 |
| T4 | 64–68 ± 2 | 64–68 ± 2 | 64–68 ± 2 | 7a | 197 ± 6 | (−23) | (−10) | (+3) | 61 ± 6 |
| T5 | 80–88 ± 2 | 88 ± 2 | 84–88 ± 2 | 7c | 215 ± 5.5 | (−17) | (−4) | (+9) | 73 ± 8 |
| T6 | 104 ± 2 | 104–108 ± 2 | 100–104 ± 2 | 9a | 287 ± 5 | (−29) | (−16) | (−3) | 87 ± 17 |
| T7 | 128–136 ± 2 | 128–136 ± 2 | 128–140 ± 2 | 9e | 330 ± 4 | (+18) | (+5) | (−8) | 124 ± 21 |
| T8 | 152 ± 2 | 152 ± 2 | 152–156 ± 2 | 11c | 401 ± 10 | (−7) | (+6) | (+19) | 150 ± 27 |
| T9 | 172 ± 2 | 172 ± 2 | - | Uncorrelated | - | - | - | ||
| T10 | 192 ± 2 | - | - | Uncorrelated | - | - | - | ||
Publisher’s Note: MDPI stays neutral with regard to jurisdictional claims in published maps and institutional affiliations. |
© 2022 by the authors. Licensee MDPI, Basel, Switzerland. This article is an open access article distributed under the terms and conditions of the Creative Commons Attribution (CC BY) license (https://creativecommons.org/licenses/by/4.0/).
Share and Cite
Karymbalis, E.; Tsanakas, K.; Tsodoulos, I.; Gaki-Papanastassiou, K.; Papanastassiou, D.; Batzakis, D.-V.; Stamoulis, K. Late Quaternary Marine Terraces and Tectonic Uplift Rates of the Broader Neapolis Area (SE Peloponnese, Greece). J. Mar. Sci. Eng. 2022, 10, 99. https://0-doi-org.brum.beds.ac.uk/10.3390/jmse10010099
Karymbalis E, Tsanakas K, Tsodoulos I, Gaki-Papanastassiou K, Papanastassiou D, Batzakis D-V, Stamoulis K. Late Quaternary Marine Terraces and Tectonic Uplift Rates of the Broader Neapolis Area (SE Peloponnese, Greece). Journal of Marine Science and Engineering. 2022; 10(1):99. https://0-doi-org.brum.beds.ac.uk/10.3390/jmse10010099
Chicago/Turabian StyleKarymbalis, Efthimios, Konstantinos Tsanakas, Ioannis Tsodoulos, Kalliopi Gaki-Papanastassiou, Dimitrios Papanastassiou, Dimitrios-Vasileios Batzakis, and Konstantinos Stamoulis. 2022. "Late Quaternary Marine Terraces and Tectonic Uplift Rates of the Broader Neapolis Area (SE Peloponnese, Greece)" Journal of Marine Science and Engineering 10, no. 1: 99. https://0-doi-org.brum.beds.ac.uk/10.3390/jmse10010099