
Organic Carbon Oxidation in the Sediment of the Ulleung Basin in the East Sea

 ,
,
Abstract
:1. Introduction
2. Materials and Methods
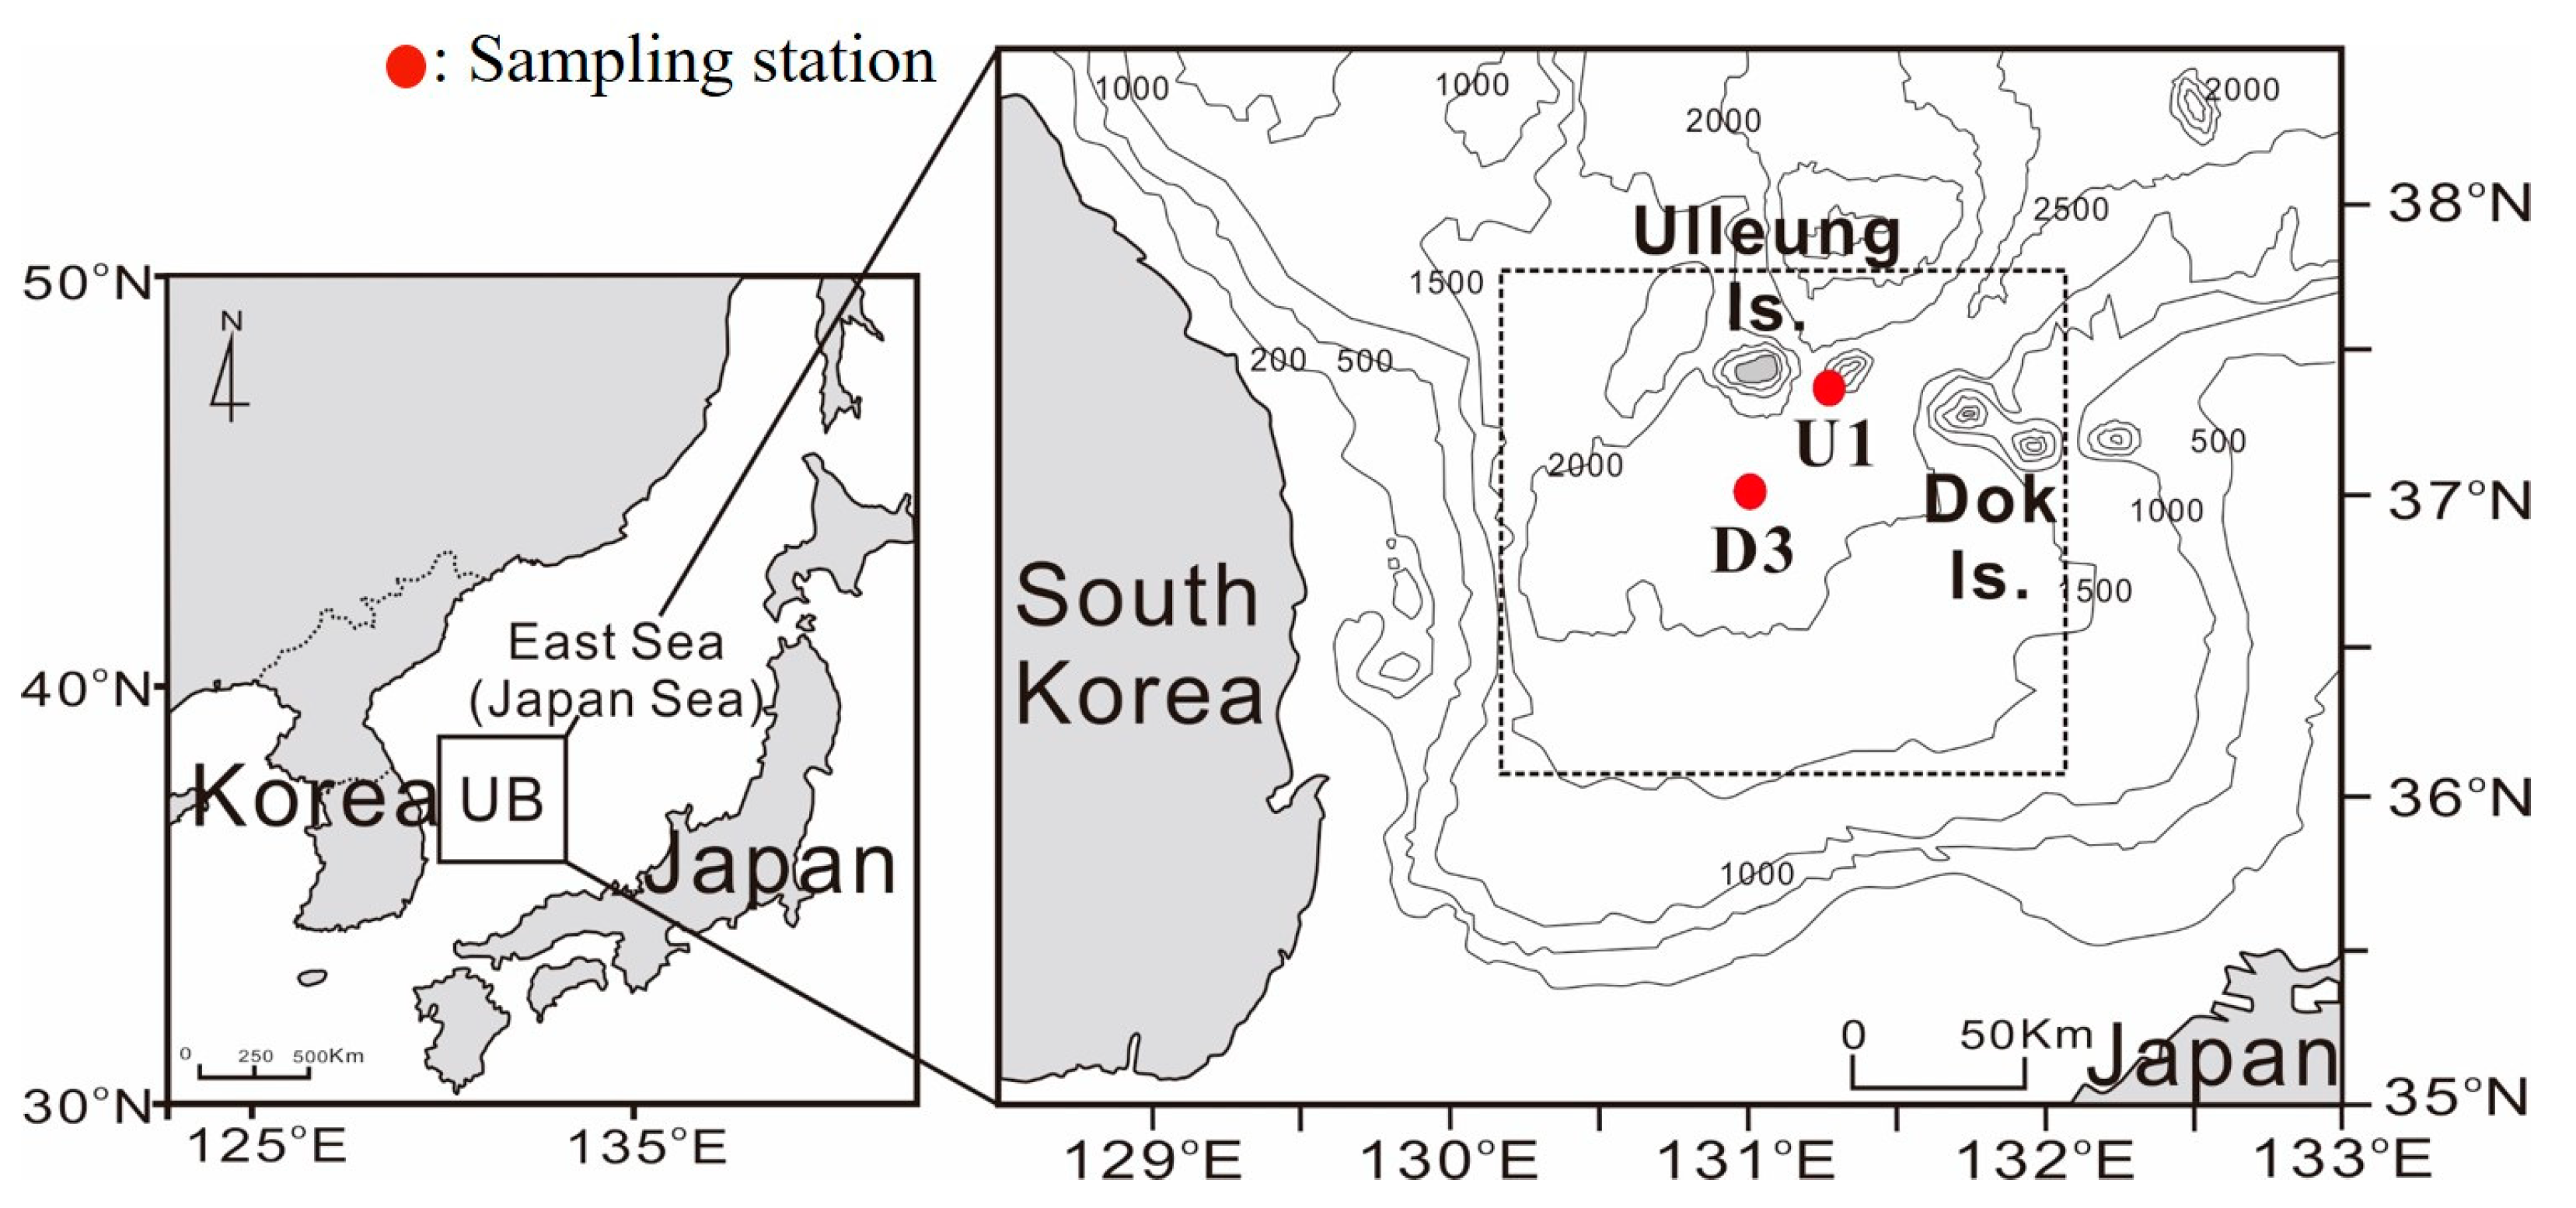
2.1. Study Area
2.2. In Situ Measurement
2.3. Sediment Collection
2.4. Laboratory Experiment
2.5. Flux Calculation
2.6. Corg Budget Calculation
3. Results
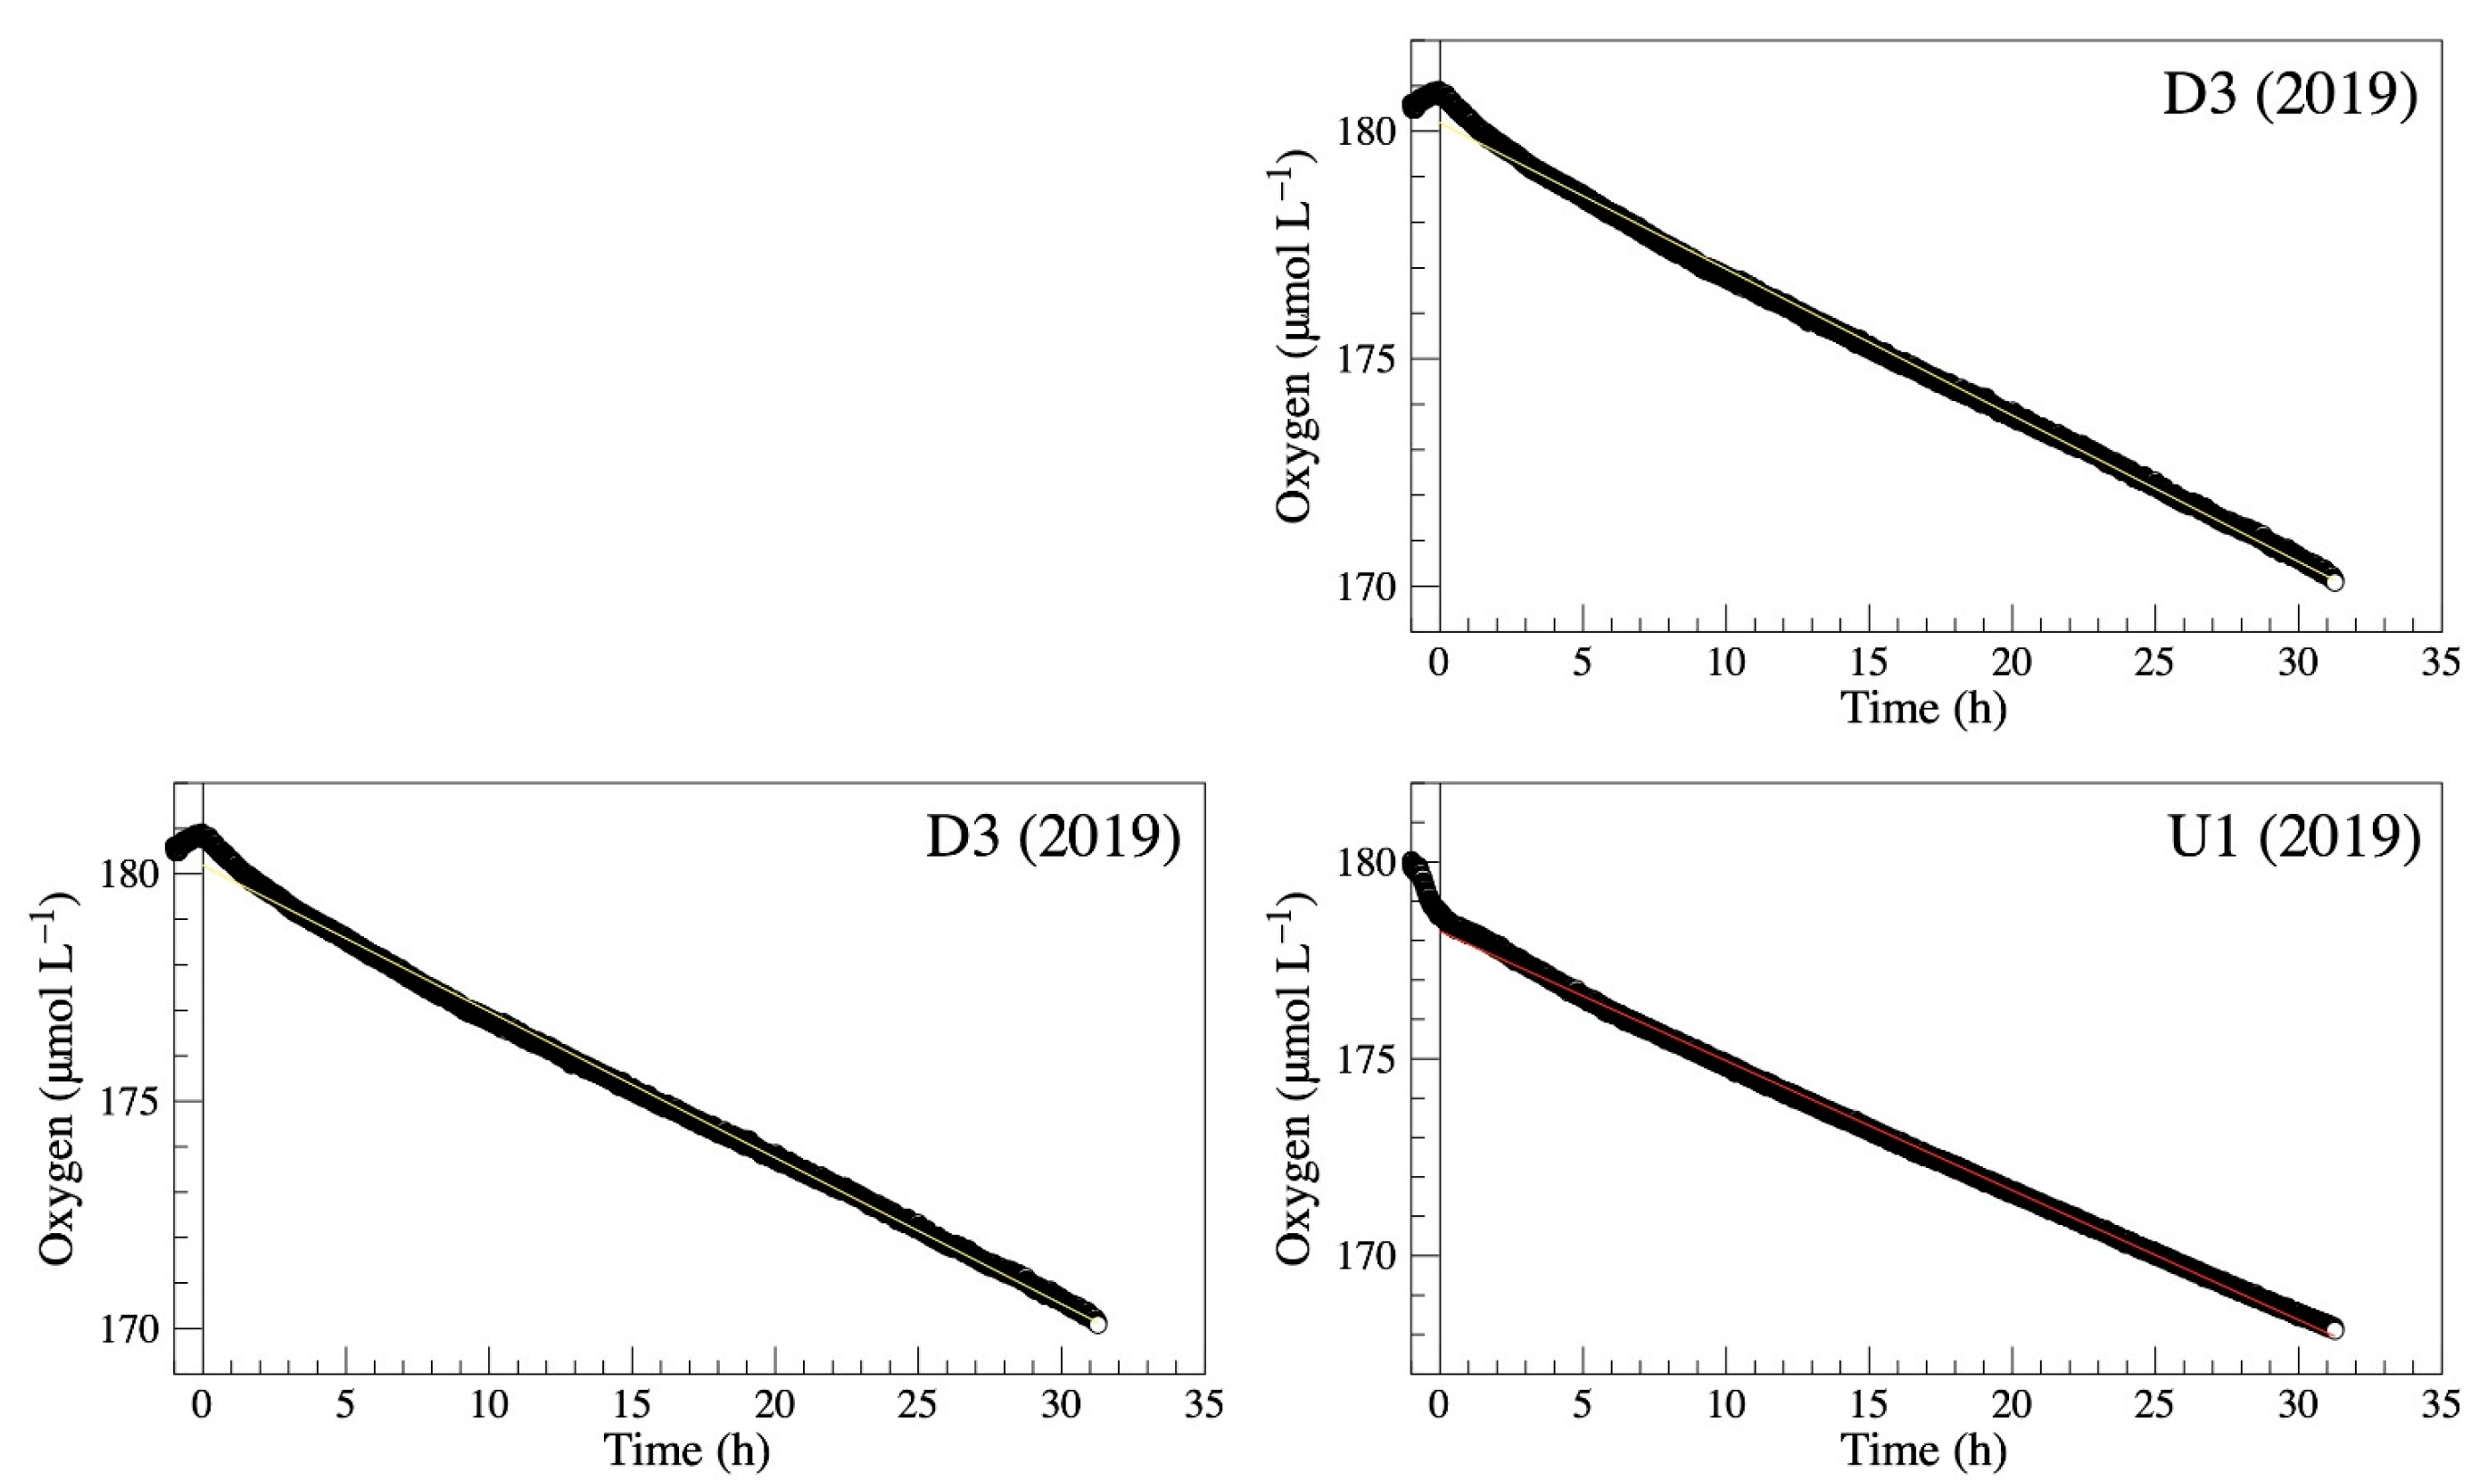
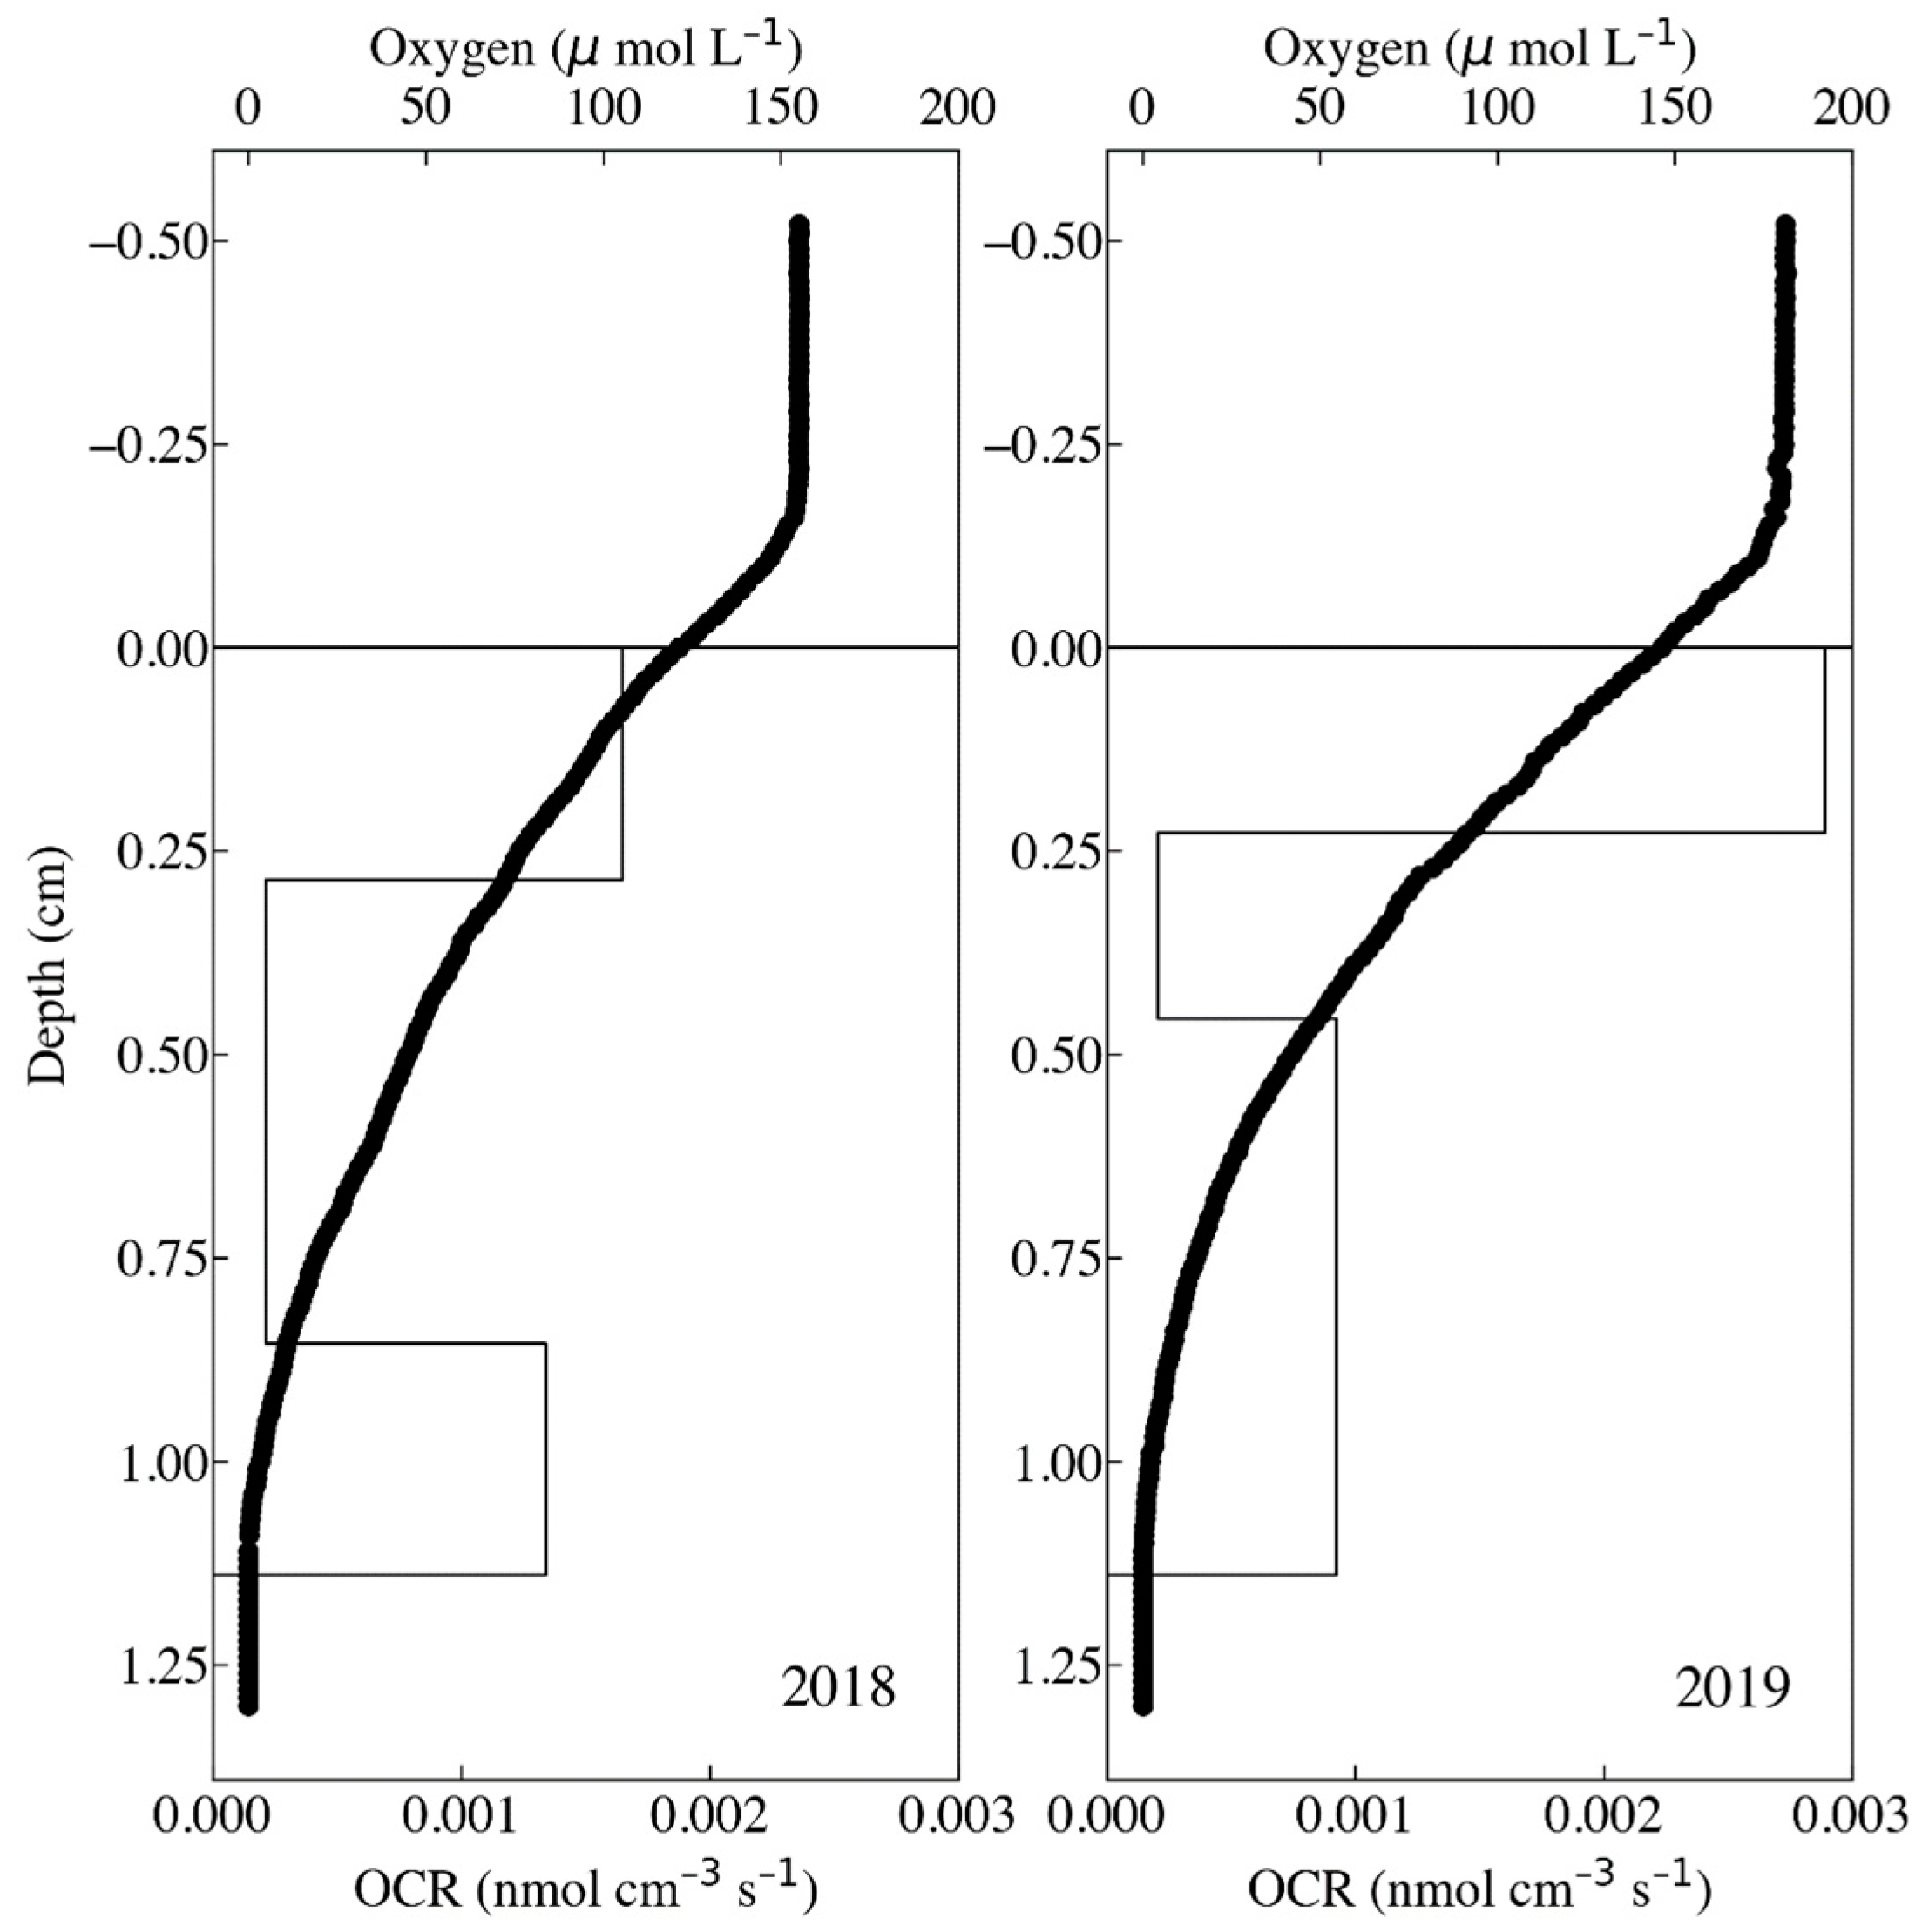
3.1. TOU and DOU
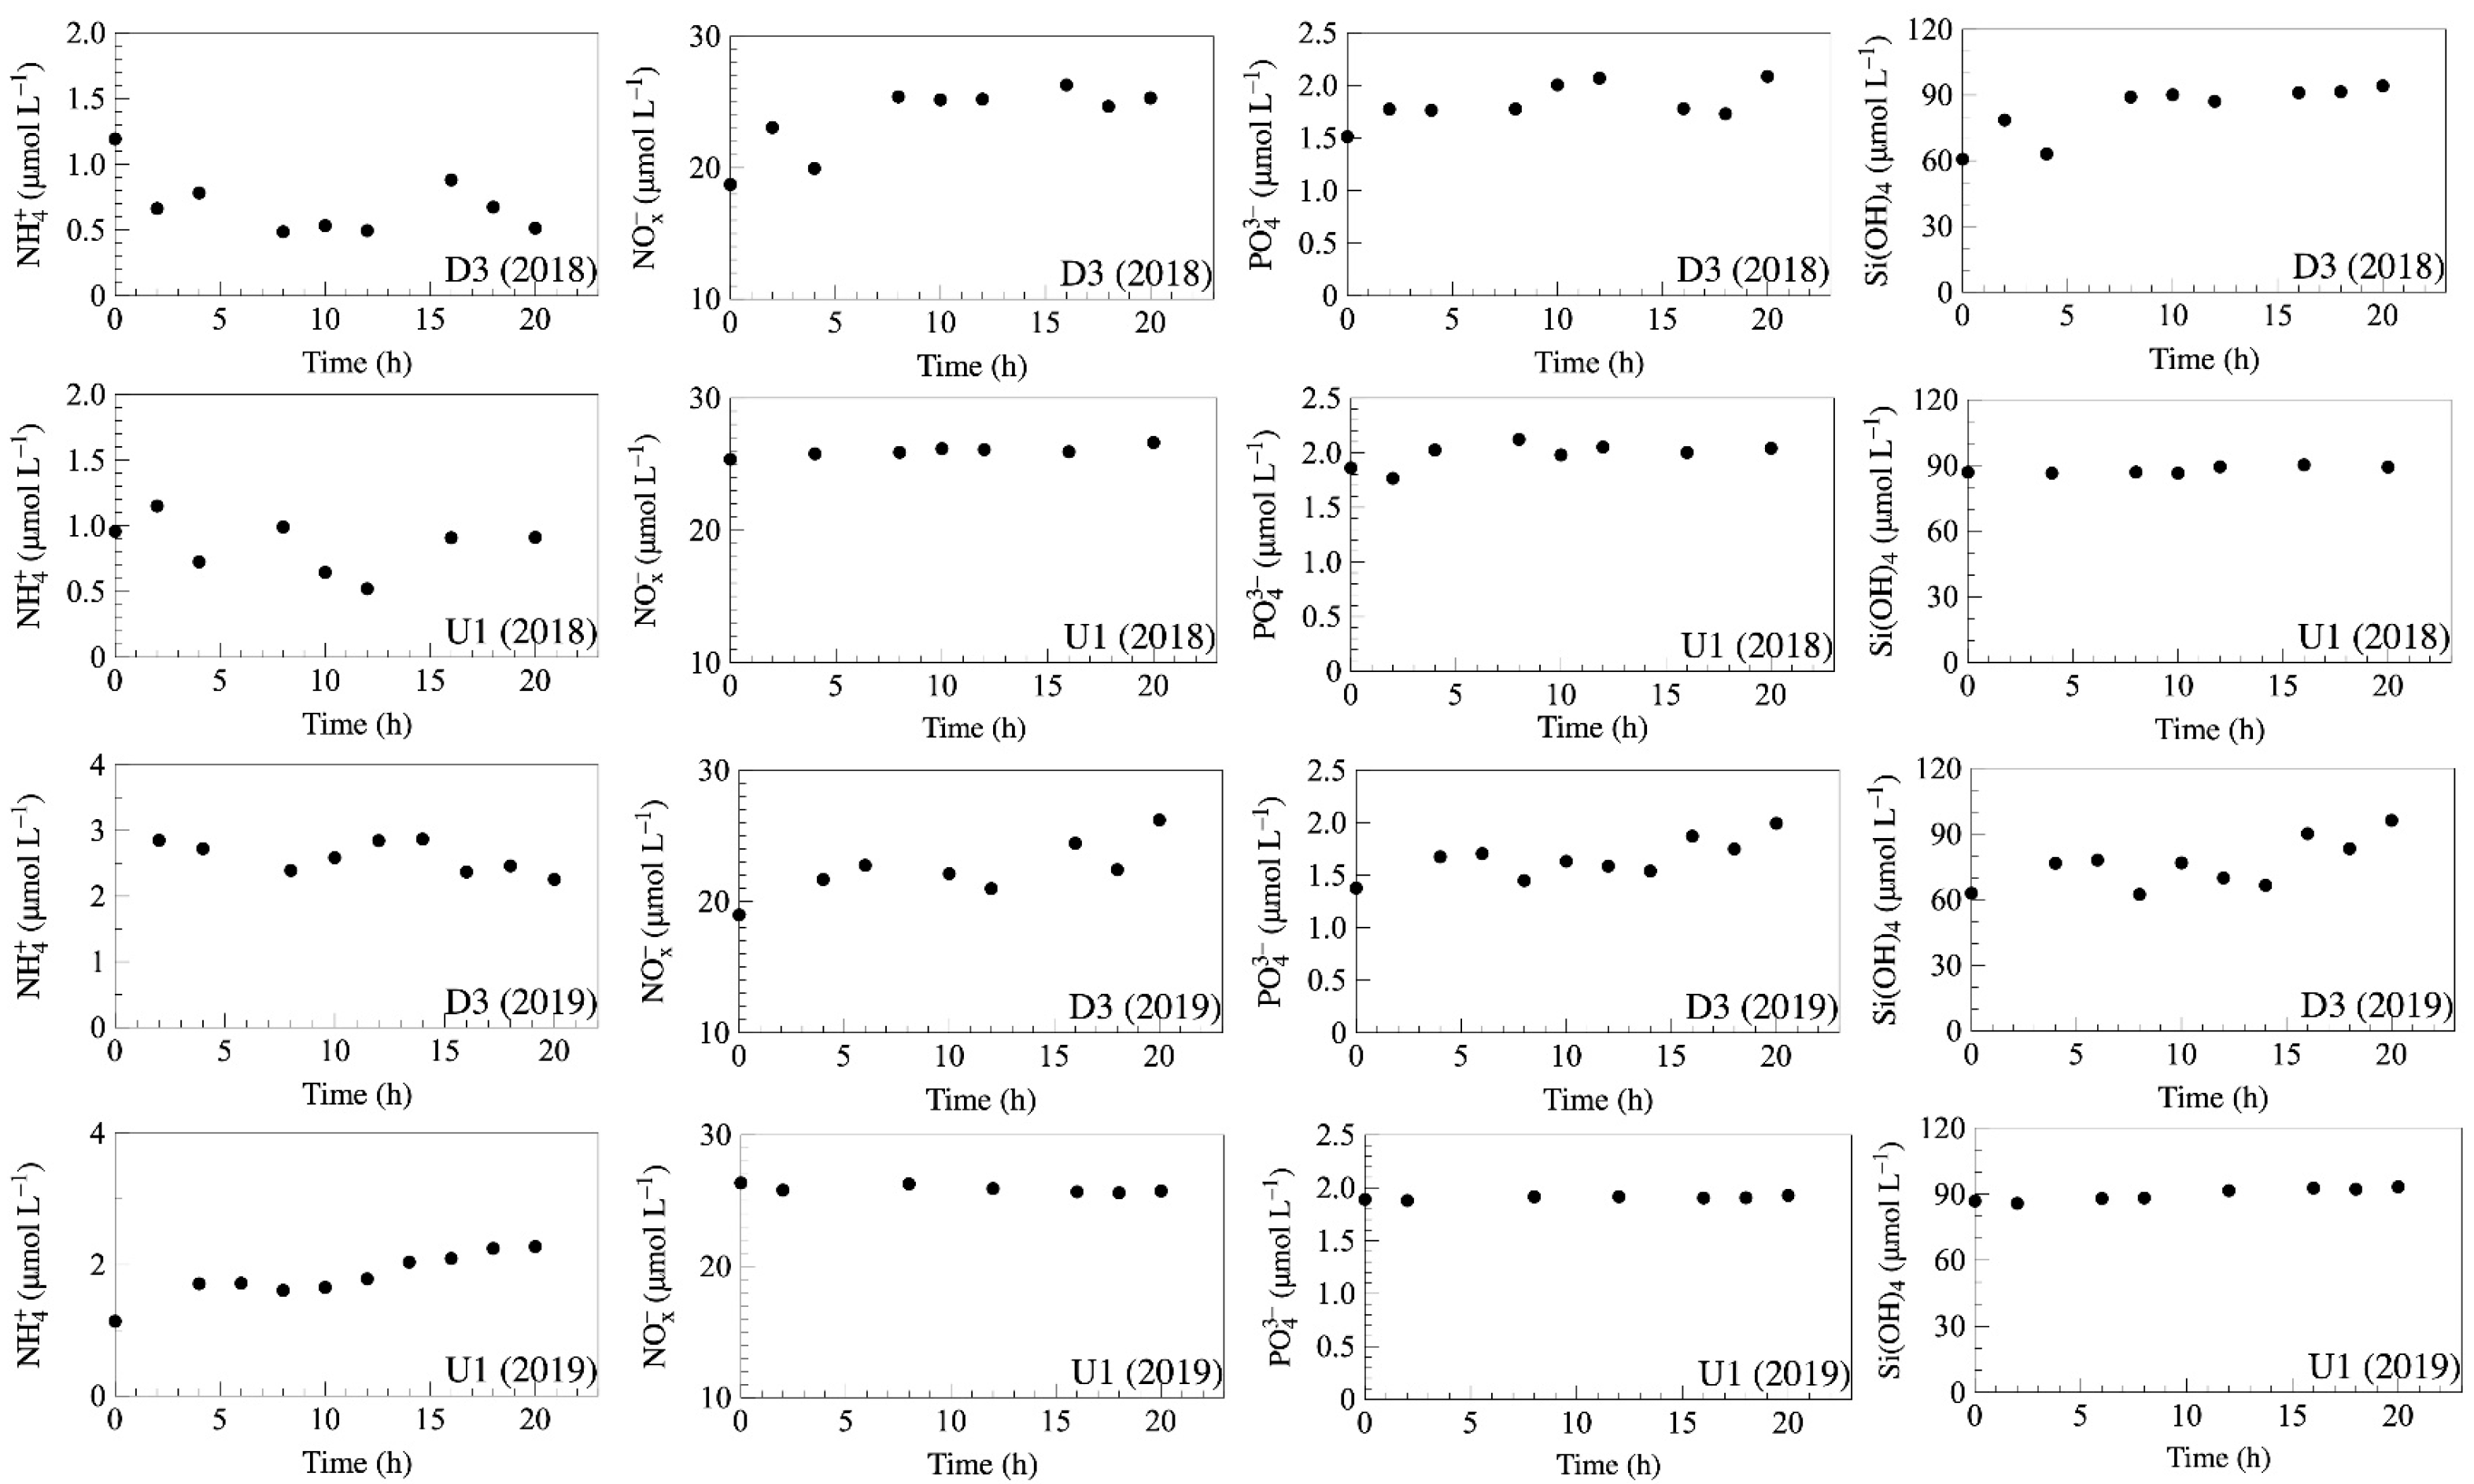
3.2. Benthic Nutrient Flux
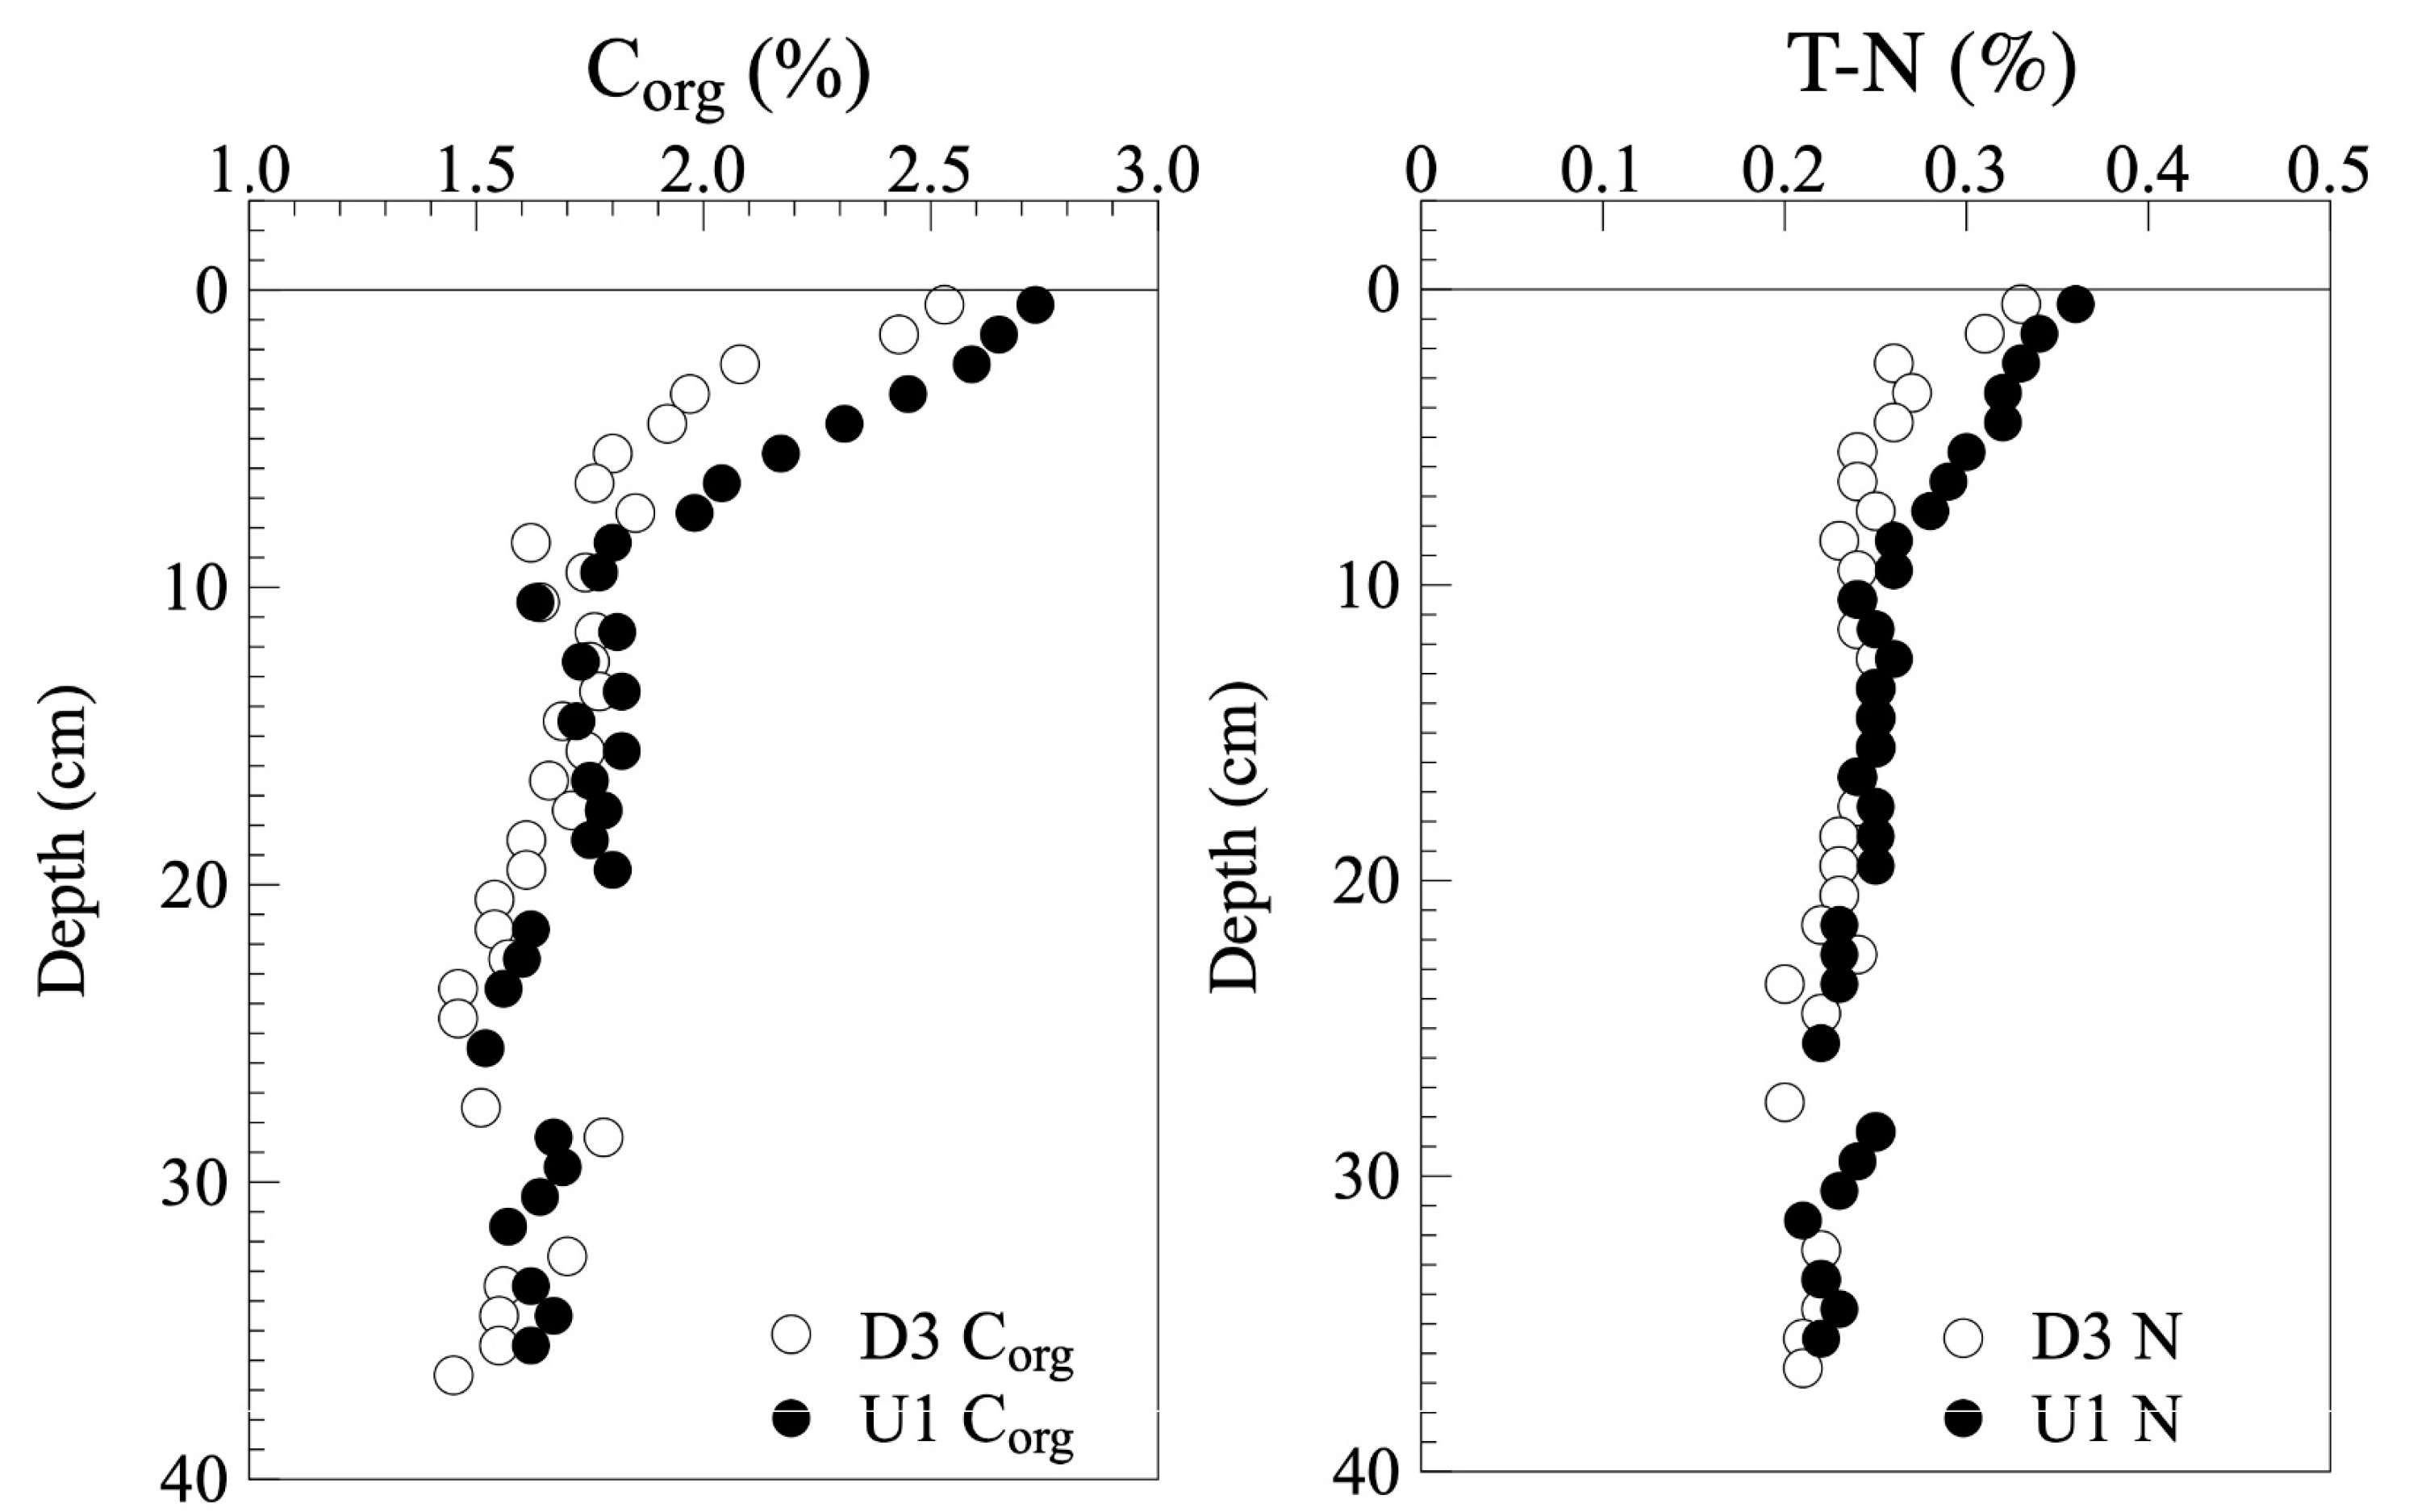
3.3. Vertical Distribution of Corg and Total Nitrogen Content
4. Discussion
4.1. Benthic Corg Oxidation in UB
4.2. Benthic Corg Oxidation in UB
4.3. Oxygen Exposure Time (OET) in the UB
5. Conclusions
Author Contributions
Funding
Institutional Review Board Statement
Informed Consent Statement
Data Availability Statement
Acknowledgments
Conflicts of Interest
References
- Lee, D.-K.; Seung, Y.H.; Kim, Y.-B.; Kim, Y.H.; Shin, H.-R.; Shin, C.-W.; Chang, K.-I. Circulation. In Oceanography of the East Sea (Japan Sea); Chang, K.-I., Zhang, C.-I., Park, C., Kang, D.-J., Ju, S.-J., Lee, S.-H., Eds.; Springer International Publishing: Cham, Switzerland, 2015; pp. 87–126. [Google Scholar]
- Hyun, J.-H.; Kim, D.; Shin, C.-W.; Noh, J.-H.; Yang, E.-J.; Mok, J.-S.; Kim, S.H.; Kim, H.C.; Yoo, S. Enhanced phytoplankton and bacterioplankton pro-duction coupled to coastal upwelling and an anticyclonic eddy in the Ulleung basin, East Sea. Aquat. Microb. Ecol. 2009, 54, 45–54. [Google Scholar] [CrossRef]
- Kim, D.; Yang, E.J.; Kim, K.H.; Shin, C.-W.; Park, J.; Yoo, S.; Hyun, J.-H. Impact of an anticyclonic eddy on the summer nutrient and chlorophyll a distribution in the Ulleung Basin, East Sea (Japan Sea). ICES J. Mar. Sci. 2012, 69, 23–29. [Google Scholar] [CrossRef] [Green Version]
- Kwak, J.H.; Hwang, J.; Choy, E.J.; Park, H.J.; Kang, D.-J.; Lee, T.; Chang, K.-I.; Kim, K.-R.; Kang, C.-K. High primary production and f-ratio in summer in the Ulleung basin of the East/Japan Sea. Deep Sea Res. Part I Oceanogr. Res. Pap. 2013, 79, 74–85. [Google Scholar] [CrossRef]
- Kwak, J.H.; Lee, S.H.; Park, H.J.; Choy, E.J.; Jeong, H.D.; Kim, K.R.; Kang, C.K. Monthly measured primary and new productivities in the Ulleung Basin as a biological “hot spot” in the East/Japan Sea. Biogeosciences 2013, 10, 4405–4417. [Google Scholar] [CrossRef] [Green Version]
- Park, K.-A.; Ullman, D.S.; Kim, K.; Chung, Y.J.; Kim, K.-R. Spatial and temporal variability of satellite-observed subpolar front in the East/Japan Sea. Deep Sea Res. Part I Oceanogr. Res. Pap. 2007, 54, 453–470. [Google Scholar] [CrossRef]
- Park, K.-A.; Woo, H.-J.; Ryu, J.-H. Spatial scales of mesoscale eddies from GOCI chlorophyll-a concentration images in the East/Japan Sea. Ocean Sci. J. 2012, 47, 347–358. [Google Scholar] [CrossRef]
- Yoo, S.; Park, J. Why is the southwest the most productive region of the East Sea/Sea of Japan? J. Mar. Syst. 2009, 78, 301–315. [Google Scholar] [CrossRef]
- Kim, D.; Choi, M.-S.; Oh, H.-Y.; Song, Y.-H.; Noh, J.-H.; Kim, K.H. Seasonal export fluxes of particulate organic carbon from234Th/238U disequilibrium measurements in the Ulleung Basin (Tsushima Basin) of the East Sea (Sea of Japan). J. Oceanogr. 2011, 67, 577–588. [Google Scholar] [CrossRef]
- Canfield, D.E.; Kristensen, E.; Thamdrup, B. The Oxygen Cycle. In Aquatic Geomicrobiology; Canfield, D.E., Kristensen, E., Thamdrup, B., Eds.; Elsevier: New York, NY, USA, 2005; pp. 167–204. [Google Scholar] [CrossRef]
- Glud, R.N. Oxygen dynamics of marine sediment. Mar. Biol. Res. 2008, 4, 243–289. [Google Scholar] [CrossRef]
- Jørgensen, B.B.; Revsbech, N.P. Diffusive boundary layers and the oxygen uptake of sediments and detritus. Limnol. Oceanogr. 1985, 30, 111–122. [Google Scholar] [CrossRef]
- Nøhr Glud, R.; Gundersen, J.K.; Revsbech, N.P.; Jørgensen, B.B. Effects on the benthic diffusive boundary layer imposed by microelectrodes. Limnol. Oceanogr. 1994, 39, 462–467. [Google Scholar] [CrossRef]
- Lee, G.H.; Kim, H.J. Crustal structure and tectonic evolution of the East Sea. In Oceanography of the East Sea (Japan Sea); Chang, K.-I., Zhang, C.-I., Park, C., Kang, D.-J., Ju, S.-J., Lee, S.-H., Eds.; Springer International Publishing: Cham, Switzerland, 2015; pp. 415–430. [Google Scholar]
- Koo, B.-Y.; Kim, S.-P.; Lee, G.-S.; Chung, G.S. Seafloor morphology and surface sediment distribution of the Southwestern part of Ulleung Basin, East Sea. JKESS 2014, 35, 131–146. [Google Scholar] [CrossRef] [Green Version]
- Lee, H.J.; Choug, S.K.; Yoon, S.H. Slope-stability change from late pleistocene to holocene in the Ulleung Basin, East Sea (Japan Sea). Sediment. Geol. 1996, 104, 39–51. [Google Scholar] [CrossRef]
- Lee, J.S.; An, S.-U.; Park, Y.-G.; Kim, E.; Kim, D.; Kwon, J.N.; Kang, D.-J.; Noh, J.-H. Rates of total oxygen uptake of sediments and benthic nutrients fluxes measured using an in situ autonomous benthic chamber in the sediment of the slope off the southwestern part of Ulleung Basin, East Sea. Ocean Sci. J. 2015, 50, 581–588. [Google Scholar] [CrossRef]
- Lee, J.S.; Han, J.H.; An, S.-U.; Kim, S.-H.; Lim, D.; Kim, D.; Kang, D.-J.; Park, Y.-G. Sedimentary organic carbon budget across the slope to the basin in the southwestern Ulleung (Tsushima) Basin of the East (Japan) Sea. J. Geophys. Res. Biogeosci. 2019, 124, 2804–2822. [Google Scholar] [CrossRef]
- Lee, J.S.; Kim, E.-S.; Yoon, S.-H.; Cho, J.-H.; Bahk, K.-S.; Kang, D.-J. Development and application of a novel miniature in situ microprofiler (NAFRI BelpI). Ocean Sci. J. 2012, 47, 489–495. [Google Scholar] [CrossRef]
- Hansen, P.H.; Koroleff, F. Determination of Nutrients. In Methods of Seawater Analysis; Grasshoff, K., Kremling, K., Ehrhardt, M., Eds.; Wiley–VCH: Weinheim, Germany, 1999; pp. 159–228. [Google Scholar] [CrossRef]
- Berg, P.; Risgaard-Petersen, N.; Rysgaard, N. Interpretation of measured concentration profiles in sediment pore water. Limnol. Oceanogr. 1998, 43, 1500–1510. [Google Scholar] [CrossRef] [Green Version]
- Broecker, W.S.; Peng, T.-H. Gas exchange rates between air and sea. Tellus 1974, 26, 21–35. [Google Scholar] [CrossRef] [Green Version]
- Li, Y.-H.; Gregory, G. Diffusion of ions in sea water and in deep sea sediment. Geochim. Cosmochim. Acta 1974, 38, 703–714. [Google Scholar] [CrossRef]
- Martens, C.S.; Klump, J.V. Biogeochemical cycling in an organic-rich coastal marine basin 4. An organic carbon budget for sediments dominated by sulfate reduction and methanogenesis. Geochim. Cosmochim. Acta 1984, 48, 1987–2004. [Google Scholar] [CrossRef]
- Cha, H.J.; Lee, C.B.; Kim, B.S.; Cho, M.S.; Ruttenberg, K.C. Early diagenetic redistribution and burial of phosphorus in the sediments of the southwestern East Sea (Japan Sea). Mar. Geol. 2005, 216, 127–143. [Google Scholar] [CrossRef]
- Hyun, J.-H.; Kim, S.-H.; Mok, J.-S.; Cho, H.; Lee, T.; Vandieken, V.; Thamdrup, B. Manganese and iron reduction dominate organic carbon oxidation in deep continental margin sediments of the Ulleung Basin, East Sea. Biogeosciences 2017, 14, 941–958. [Google Scholar] [CrossRef] [Green Version]
- Kim, M.; Hwang, J.; Rho, T.; Lee, T.; Kang, D.-J.; Chang, K.-I.; Noh, S.; Joo, H.; Kwak, J.H.; Kang, C.-K.; et al. Biogeochemical properties of sinking particles in the south-western part of the East Sea (Japan Sea). J. Mar. Syst. 2017, 167, 33–42. [Google Scholar] [CrossRef]
- Canfield, D.E. Organic matter oxidation in marine sediments. In Interactions of C, N, P and S Biogeochemical Cycles and Global Change; Wollast, R., Chou, L., Mackenzie, F., Eds.; Springer: New York, NY, USA, 1993; pp. 333–356. [Google Scholar] [CrossRef]
- Henrichs, S.M.; Farrington, J.W. Peru upwelling region sediment near 15°S. 1. Remineralization and accumulation of organic matter. Limnol. Oceanogr. 1984, 29, 1–19. [Google Scholar] [CrossRef]
- Betts, J.N.; Holland, H.D. The oxygen content of ocean bottom waters, the burial efficiency of organic carbon, and the regulation of atmospheric oxygen. Palaeogeogr. Palaeoclimatol. Palaeoecol. 1991, 97, 5–18. [Google Scholar] [CrossRef]
- Müller, P.J.; Suess, E. Productivity, sedimentation rate, and sedimentary organic matter in the oceans—I. Organic carbon preservation. Deep-Sea Res. I Oceanogr. Res. 1979, 26, 1347–1362. [Google Scholar] [CrossRef]
- Rabouille, C.; Caprais, J.C.; Lansard, B.; Crassous, P.; Dedieu, K.; Reyss, J.L.; Khripounoff, A. Organic matter budget in the southeast Atlantic continental margin close to the Congo Canyon: In situ measurements of sediment oxygen consumption. Deep-Sea Res. II Top. Stud. Oceanogr. 2009, 56, 2223–2238. [Google Scholar] [CrossRef] [Green Version]
- Epping, E.; van der Zee, C.; Soetaert, K.; Helder, W. On the oxidation and burial of organic carbon in sediments of the Iberian margin and Nazaré Canyon (NE Atlantic). Prog. Oceanogr. 2002, 52, 399–431. [Google Scholar] [CrossRef]
- van Weering, T.C.E.; de Stigter, H.C.; Boer, W.; de Hass, H. Recent sediment transport and accumulation on the NW Iberian margin. Prog. Oceanogr. 2002, 52, 349–371. [Google Scholar] [CrossRef]
- Hartnett, H.E.; Keil, R.G.; Hedge, J.I.; Devol, A.H. Influence of oxygen exposure time on organic carbon preservation in continental margin sediments. Nature 1998, 391, 572–574. [Google Scholar] [CrossRef]
- Keil, R.G.; Dickens, A.F.; Arnarson, T.; Nunn, B.L.; Devol, A.H. What is the oxygen exposure time of laterally transported organic matter along the Washington margin? Mar. Chem. 2004, 92, 157–165. [Google Scholar] [CrossRef]
- Kang, D.-J.; Kim, J.-Y.; Lee, T.; Kim, K.-R. Will the East/Japan Sea become an anoxic sea in the next century? Mar. Chem. 2004, 91, 77–84. [Google Scholar] [CrossRef]


| D3 | U1 | |
|---|---|---|
| Latitude | 37°00 N | 37°24 N |
| Longitude | 131°00 E | 131°12 E |
| Water depth (m) | 2154 | 2206 |
| Bottom water salinity | 34.07 | 34.06 |
| Bottom water temperature (°C) | 0.22 | 0.12 |
| Bottom water DO (μmol L−1) | 186 | 189 |
| TOU | DOU | NH4+ | NOx− | PO43− | Si(OH)4 | ||
|---|---|---|---|---|---|---|---|
| (mmol m−2 d−1) | |||||||
| 2018 | D3 | - | - | −0.09 ± 0.06 | 1.68 ± 0.54 | 0.09 ± 0.05 | 8.67± 2.18 |
| (R2 = 0.21) | (R2 = 0.58) | (R2 = 0.32) | (R2 = 0.69) | ||||
| U1 | 1.52 ± 0.00 | 0.77 ± 0.13 | −0.05 ± 0.07 | 0.29 ± 0.07 | 0.06 ± 0.03 | 1.08 ± 0.39 | |
| (R2 = 0.07) | (R2 = 0.78) | (R2 = 0.34) | (R2 = 0.6) | ||||
| 2019 | D3 | 1.89 ± 0.00 | - | −0.13 ± 0.07 | 1.41 ± 0.46 | 0.12 ± 0.04 | 6.98 ± 2.71 |
| (R2 = 0.33) | (R2 = 0.61) | (R2 = 0.51) | (R2 = 0.45) | ||||
| U1 | 1.93 ± 0.00 | 1.00 ± 0.15 | 0.3 ± 0.04 | −0.16 ± 0.07 | 0.01 ± 0.0 | 2.23 ± 0.25 | |
| (R2 = 0.88) | (R2 = 0.51) | (R2 = 0.57) | (R2 = 0.93) | ||||
| Cox | Cburial | Cin | BE | |
|---|---|---|---|---|
| (g C m−2 year−1) | (%) | |||
| D3 | 6.51 | 3.48 ± 0.60 | 9.99 ± 0.60 | 34 ± 6 |
| U1 | 6.36 | 3.14 ± 0.12 | 9.51 ± 0.12 | 33 ± 1 |
Publisher’s Note: MDPI stays neutral with regard to jurisdictional claims in published maps and institutional affiliations. |
© 2022 by the authors. Licensee MDPI, Basel, Switzerland. This article is an open access article distributed under the terms and conditions of the Creative Commons Attribution (CC BY) license (https://creativecommons.org/licenses/by/4.0/).
Share and Cite
Lee, J.S.; Kim, S.-H.; Baek, J.-W.; Kim, K.-T.; Kim, D.; Kim, Y.-i.; Lee, W.-C.; An, S.-U.; Kim, C.H.; Park, C.H.; et al. Organic Carbon Oxidation in the Sediment of the Ulleung Basin in the East Sea. J. Mar. Sci. Eng. 2022, 10, 694. https://0-doi-org.brum.beds.ac.uk/10.3390/jmse10050694
Lee JS, Kim S-H, Baek J-W, Kim K-T, Kim D, Kim Y-i, Lee W-C, An S-U, Kim CH, Park CH, et al. Organic Carbon Oxidation in the Sediment of the Ulleung Basin in the East Sea. Journal of Marine Science and Engineering. 2022; 10(5):694. https://0-doi-org.brum.beds.ac.uk/10.3390/jmse10050694
Chicago/Turabian StyleLee, Jae Seong, Sung-Han Kim, Ju-Wook Baek, Kyung-Tae Kim, Dongseon Kim, Young-il Kim, Won-Chan Lee, Sung-Uk An, Chang Hwan Kim, Chan Hong Park, and et al. 2022. "Organic Carbon Oxidation in the Sediment of the Ulleung Basin in the East Sea" Journal of Marine Science and Engineering 10, no. 5: 694. https://0-doi-org.brum.beds.ac.uk/10.3390/jmse10050694