
Risk Assessment of Navigation Safety for Ferries


1
Department of Shipping and Transportation Management, National Kaohsiung University of Science and Technology, Kaohsiung 81157, Taiwan
2
Faculty of Economics and Management, Dong Nai Technology University, Bien Hoa 76000, Dong Nai, Vietnam
3
Headquarter, The 8th Field Army, Kaohsiung 84248, Taiwan
*
Author to whom correspondence should be addressed.
J. Mar. Sci. Eng. 2022, 10(5), 700; https://0-doi-org.brum.beds.ac.uk/10.3390/jmse10050700
Submission received: 31 March 2022
/
Revised: 13 May 2022
/
Accepted: 15 May 2022
/
Published: 20 May 2022
(This article belongs to the Special Issue Marine Policy)
Abstract
:This study aims to discuss a risk assessment of navigation safety for ferries. In this research, the risk factors (RFs) for the navigation safety of ferries are first investigated from relevant literature and ferry operational features. A fuzzy AHP (Analytic Hierarchical Process) approach is then proposed to weight those RFs, after which a continuous risk-matrix model is then developed to determine the RFs’ risk levels. Finally, to validate the practical application of the proposed model, ferries traveling across the Taiwan Strait were empirically investigated. The results may provide practical information for ferry operators to improve their safety performances. Further, the proposed risk assessment approach may provide references for related research in the safety management of short-distance passenger ships.
1. Introduction
Throughout the history of human development, sea transport has been widely exploited for the movement of passengers and cargo in many nations, especially in archipelagic countries. Although sea passenger transport has gradually diminished over the past two decades [1], in part because of rapid developments in aviation and road transport, passengers continue to use cruises or ferries as the main means of transport for different purposes [2].
Generally, cruise ships operate long-distance international routes, and their main functions are to provide passengers with leisure travel and sightseeing needs. Therefore, in design, the size of a cruise ship is usually larger and the requirements for entertainment facilities and comfort are generally more important than speed, whereas a ferry, also known as a traffic ship, is a regular multifunction ship for passengers and cargo. Its main function is to carry passengers, goods, and vehicles (including land vehicles and trains) between islands across short distances. Furthermore, the ferry is also known as a mass transportation system for islands and cities located by the water. For transportation between two points, the cost of a ferry is significantly lower than that of building bridges or tunnels. Nonetheless, one of the disadvantages of ferry transport is that it could be easily suspended due to weather conditions.
In practice, the primary requirement of passenger transport by ferry is travel speed [3]. Thus, in ship design, a ferry’s tonnage is relatively small compared to that of a cruise vessel. In addition, the requirement for speed is much more crucial than comfort and entertainment facilities. Furthermore, in terms of safety facilities for maritime navigation, the requirements of cruise ships are much greater than those of ferries. Generally, cruise ships not only have diversified professionals and a variety of life-saving equipment but also have a certain number of specifications for the prevention of maritime accidents and for personnel training [4]. By contrast, for ferries, except for basic rescue and escape equipment, the safety management activities are relatively inadequate compared with cruise ships. Furthermore, due to the features of short-distance traffic, in practice, operators may easily neglect the SOPs (standard operational procedures) for safety navigation. As a result, although governments have enforced stricter regulations, many fatal ferry accidents still occur relatively frequently.
Globally, calamitous accidents with many casualties and injuries pertaining to ferry transport have been reported. For instance, at least 60 people drowned after an overloaded ferry capsized in the river in the DR Congo in February 2021 [5]. Another deplorable incident happened in Bangladesh in April 2021 when an overcrowded ferry collided head-on with a cargo ship, leading to a total of 34 deaths [6]. In addition, the number of reported ferry accidents raises concerns about navigation safety management for ferry transportation. For example, South Korea documented at least 110 ferry accidents between 2015 and 2019, although its government has implemented coastal ferry safety innovative strategies since September 2014 to avoid maritime disasters, such as the sinking of the MV Sewol, resulting in a death toll of 304 passengers and crew members in April 2014 [7]. For Taiwanese maritime navigation, a total of 583 ship accidents occurred between 2014 and 2019 for some key reasons: collision (33.22%), striking (15.18%), machinery failure (10.16%), grounding (8.56%), and fire/explosion (1.37%) [8].
Additionally, the proportion of navigation accidents is currently on the rise in several countries. More specifically, about 37.5% of accidents involving passenger vessels, including ferries, were recorded in Bangladesh between 2008 and 2019 [9]. Furthermore, the potential risks concerning the safety of ferries are expected to increase thanks to the expansion of sea traffic, the expansion of the offshore fishing industry, and wind farms. It is argued that a single accident by ferry transportation can cause mass mortalities and property loss since the ferry typically carries a lot of people and freight on board [7]. In the relevant research, most studies only focused on the identification of the safety factors of ship navigation, e.g., [10,11]. A few articles further evaluated the risk levels of those factors. In practice, the different risk levels of safety factors should have different corresponding strategies so as to improve the efficiency of safety management for ship navigation [12].
To fill the literature gap, this paper aims to assess the risks to navigation safety for ferries. In this study, the risk factors (RFs) affecting ferry navigation safety are first investigated. Since the RFs’ assessments are highly professional problems, a fuzzy Analytic Hierarchical Process (AHP) approach is then used to weight those RFs, by which a continuous risk matrix is constructed to rank the RFs’ risks. Finally, ferry operators traveling across the Taiwan Strait were empirically examined to validate the application of the proposed risk-matrix model. The rest of the paper is organized as follows: Section 2 and Section 3 explain the risk factors in ferry navigation and the research methods used in this study, respectively. Section 4 discusses the research results. Finally, we provide some conclusions, limitations, and suggestions for further research.
2. Literature Review
2.1. An Overview of Ferry Transportation in Taiwan
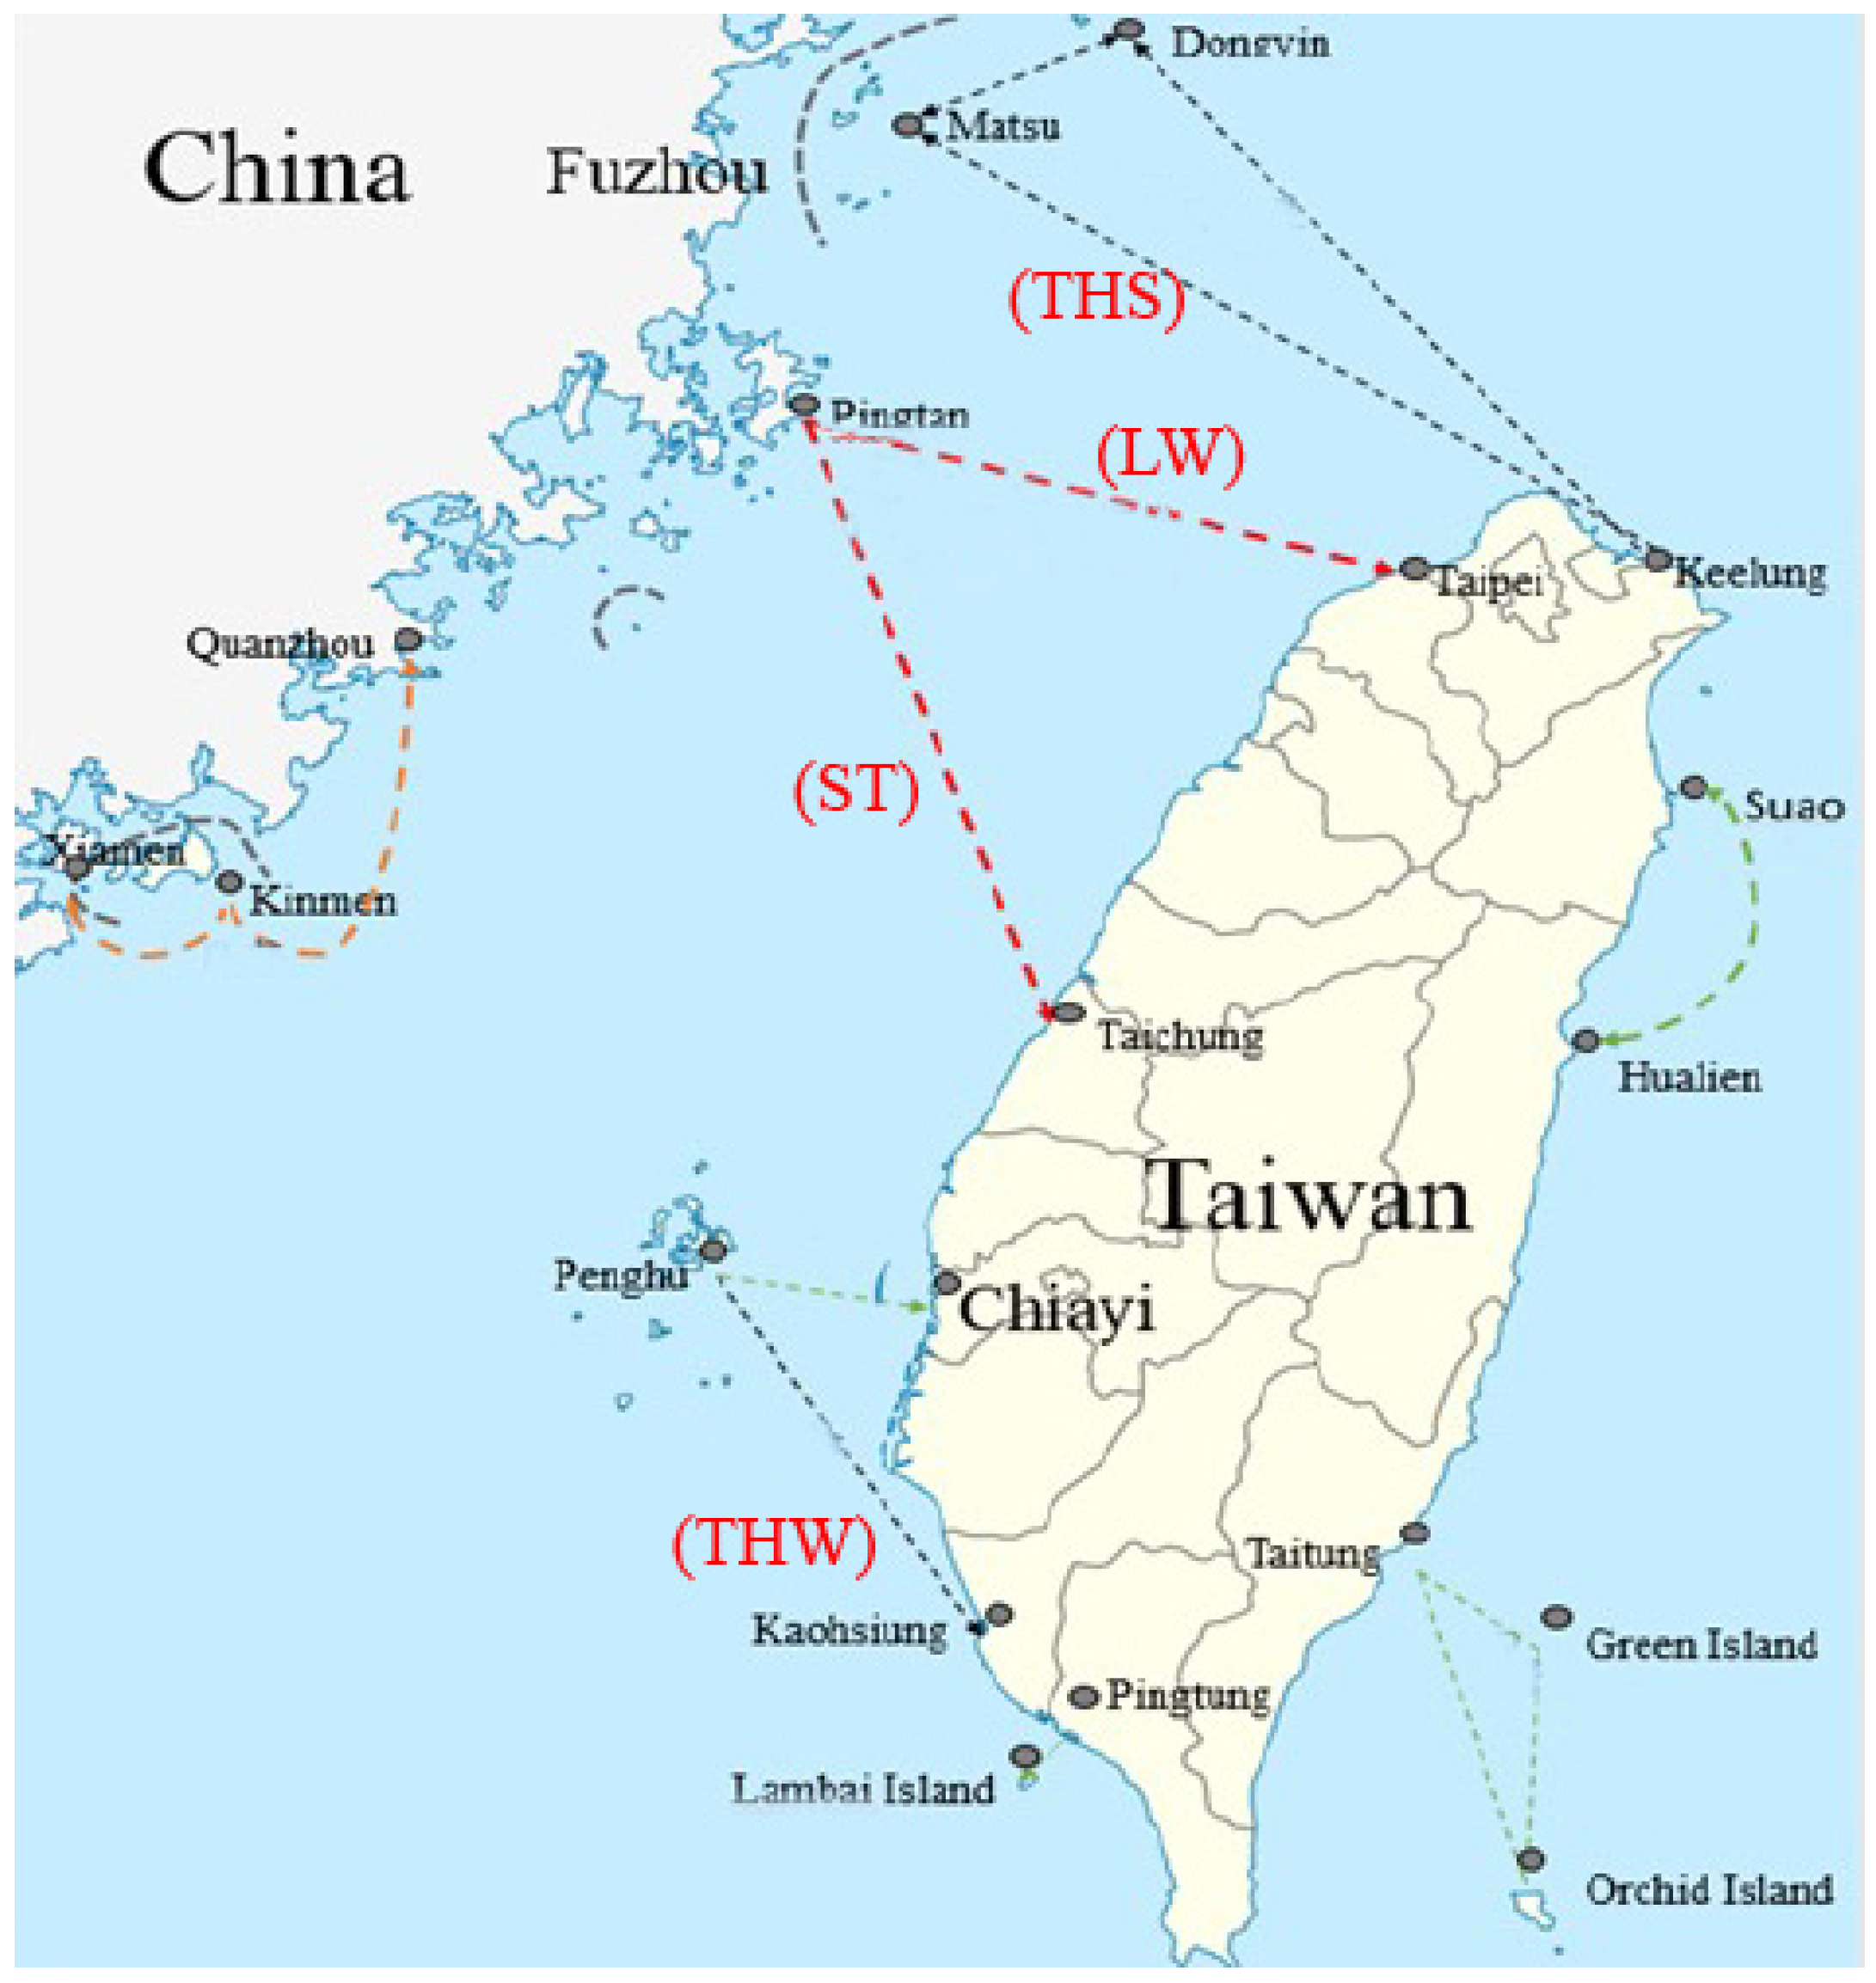
Recent years have seen an increase in cross-Taiwan Strait communications. Travel between Mainland China and Taiwan has increased at an 8 percent average annual growth rate between 2010 and 2018 [13]. As shown in Figure 1, currently there are four major ferry routes: (1) Tapie-Pingtan managed by the Lina Wheel (LW), (2) Keelung-Matsus/Dongyin served by Taiwan Horse Star (THS), (3) Kaohsiung-Penghu operated by Tai-hua Wheel (THW), and (4) Taichung-Pingtan operated by the Strait (ST). The specifications of each ferry are also exhibited in Table 1. In addition, there are a few minor ferry routes between Hualien and Suao, including Taitung port, Orchid Island, and Green Island.
2.2. The Risk Factors of Navigation Safety
According to the European Union’s 2008 Safety Research Plan: Safer EURORO Report [14], the RFs for ferry safety were classified into four dimensions, including humanware, hardware, software, and environment [14]. Based on this framework, numerous navigation-related studies have been conducted. Organizational factors, environmental conditions, human mistakes in safety management, and other possible RFs for marine transportation have been identified in recent research [15,16,17]. People are often injured or killed, and the environment is often polluted as a result of these RFs. As a result, maritime operators and academics have paid particular attention to how to deal with these RFs in order to ensure maritime navigation safety [18].
Accordingly, we depend on previous research and IMO criteria for maritime navigation safety in this work. Based on Safer EURORO’s framework [14], this research focuses on the following four key safety evaluation factors for ferry transport: crew factor, ship hardware, ship management, and company management.
2.2.1. Crew Factor (CF)
Relevant studies have indicated that human error is the primary cause of marine accidents, including personal knowledge, skills, talents, attitude, working drive, and awareness [19]. For example, human error was shown to be the root cause of more than 80% of shipping-related incidents [20]. Human error was to blame for 79% of European maritime disasters between 1981 and 1992 [21]. As a result, human error is responsible for over 79 percent of towing vessel groundings [22], almost 26 percent of fire and explosion incidents [23], and approximately 30 percent of onboard fires/explosions. There are internal and external components to the errors in terms of the crew members that could be differentiated. Internal human error can be attributable to work stress, knowledge, self-discipline, or crews’ perceived fatalism [24,25]. Conversely, external human error could be caused by the working environment (i.e., unclean workplace, noise, or pilotage-related deficiencies [18] or a harsh natural environment [16], which makes crew members lack foresight and concentration in their duties. Likewise, other onboard mistakes by crew members that could affect maritime operational safety include misjudgment and misunderstanding [21], inadequate technical knowledge [16], a lack of knowledge about the ship system [3], fatigue, poor rescue communication [16,21], or a lack of awareness of survival procedures [10]. It is argued that a crew member’s ability to respond professionally to shipping accidents is able to restrict a mass loss of property and life [11]. To sum up, passenger ferry safety assessments must take into account the importance of the crew factor.
2.2.2. Ship Hardware (SH)
One of the most important variables in marine navigation safety is the condition of a ship’s mechanical equipment. Related studies indicated that ship accidents caused by mechanical failure range from 10% to 51% of total accidents [8]. In addition, ship structure is shown to be a critical factor in marine transportation’s overall safety. The general engineering and technical system, strength and stability, power and propulsion, and maneuverability are the four pillars of shipbuilding excellence [11]. Furthermore, studies have shown the importance of onboard equipment, such as excellent radio communication, nautical lights and searchlights, and the radar system [16], in ensuring ship navigational safety. Vessel operators should pay more attention to some ship equipment failures to reduce the potential risks, such as broken mooring lines, rusted bolts, damaged gas detectors, and crippled exhaust fans [19]. Additionally, other onboard rescue equipment, such as lifeboats, lifejackets, fire extinguishers, and seat belts [8,10,15,18], and communications systems, such as the Automatic Identification System (AIS), Very High Frequency (VHF) radios, and even the Ship Security Alert System (SSAS) for security, have also been demonstrated to be an indispensable part of marine navigational safety practices.
2.2.3. Ship Management (SM)
Ship management is an essential part of maintaining and operating boats in a safe and efficient manner, as well as for minimizing the risk of accidents and mishaps. Since 1998, the maritime sector has used the International Safety Management (ISM) code to standardize ship management. This code mandates that ship operators follow standard operating procedures (SOPs) in order to optimize operational efficiency and minimize risk. In addition to crews’ abilities and expertise, the process of managing crew members onboard is widely considered to be an important aspect of increasing ship safety operations, such as crew working hours, workloads, and job allocations [26].
Furthermore, organizing regular exercise and periodic training programs are manifested to be a crucial part of marine risk-prevention strategies for major shipping lines such as COSCO and Yang Ming. On top of that, working on vessels requires a “team effort”; in other words, a “one-man-show” cannot operate the whole vessel effectively and efficiently. It is evident that good interpersonal relationships among seafarers, which enable them to coordinate and cooperate in the workplace, are important for performing operations smoothly and safely on board. Comprehensive maritime accident analyses also found that the lack of team training and poor communication between crews and third parties are prone to major accidents [18].
2.2.4. Company Management (CM)
The process of company management is an important aspect that is crucial to optimizing ferry navigation and improving ferry operators’ business performances. For the role of company management in ferry navigation safety, the responsibilities delegated to an executive cover two categories: technical management and crew management. Arguably, technical management services, such as arranging and supervising dry dockings, repairs, alterations, and maintenance, ensure that the vessel’s machinery maintains a particular standard of operation and safety. In recent years, crew management has received more attention as an imperative facet of estimating the risks of maritime transportation. In practice, crew management for shipping companies mainly includes the development of safety procedures [3], crew manpower planning [26], and safety training systems [11]. On top of this, regulatory actions [19]; certification counterfeiting; poor inspection [18], incentive and punishment mechanisms [26]; and crew recruitment processes [3] are also a few of the numerous factors that affect ship navigation safety.
2.3. Risk Matrix
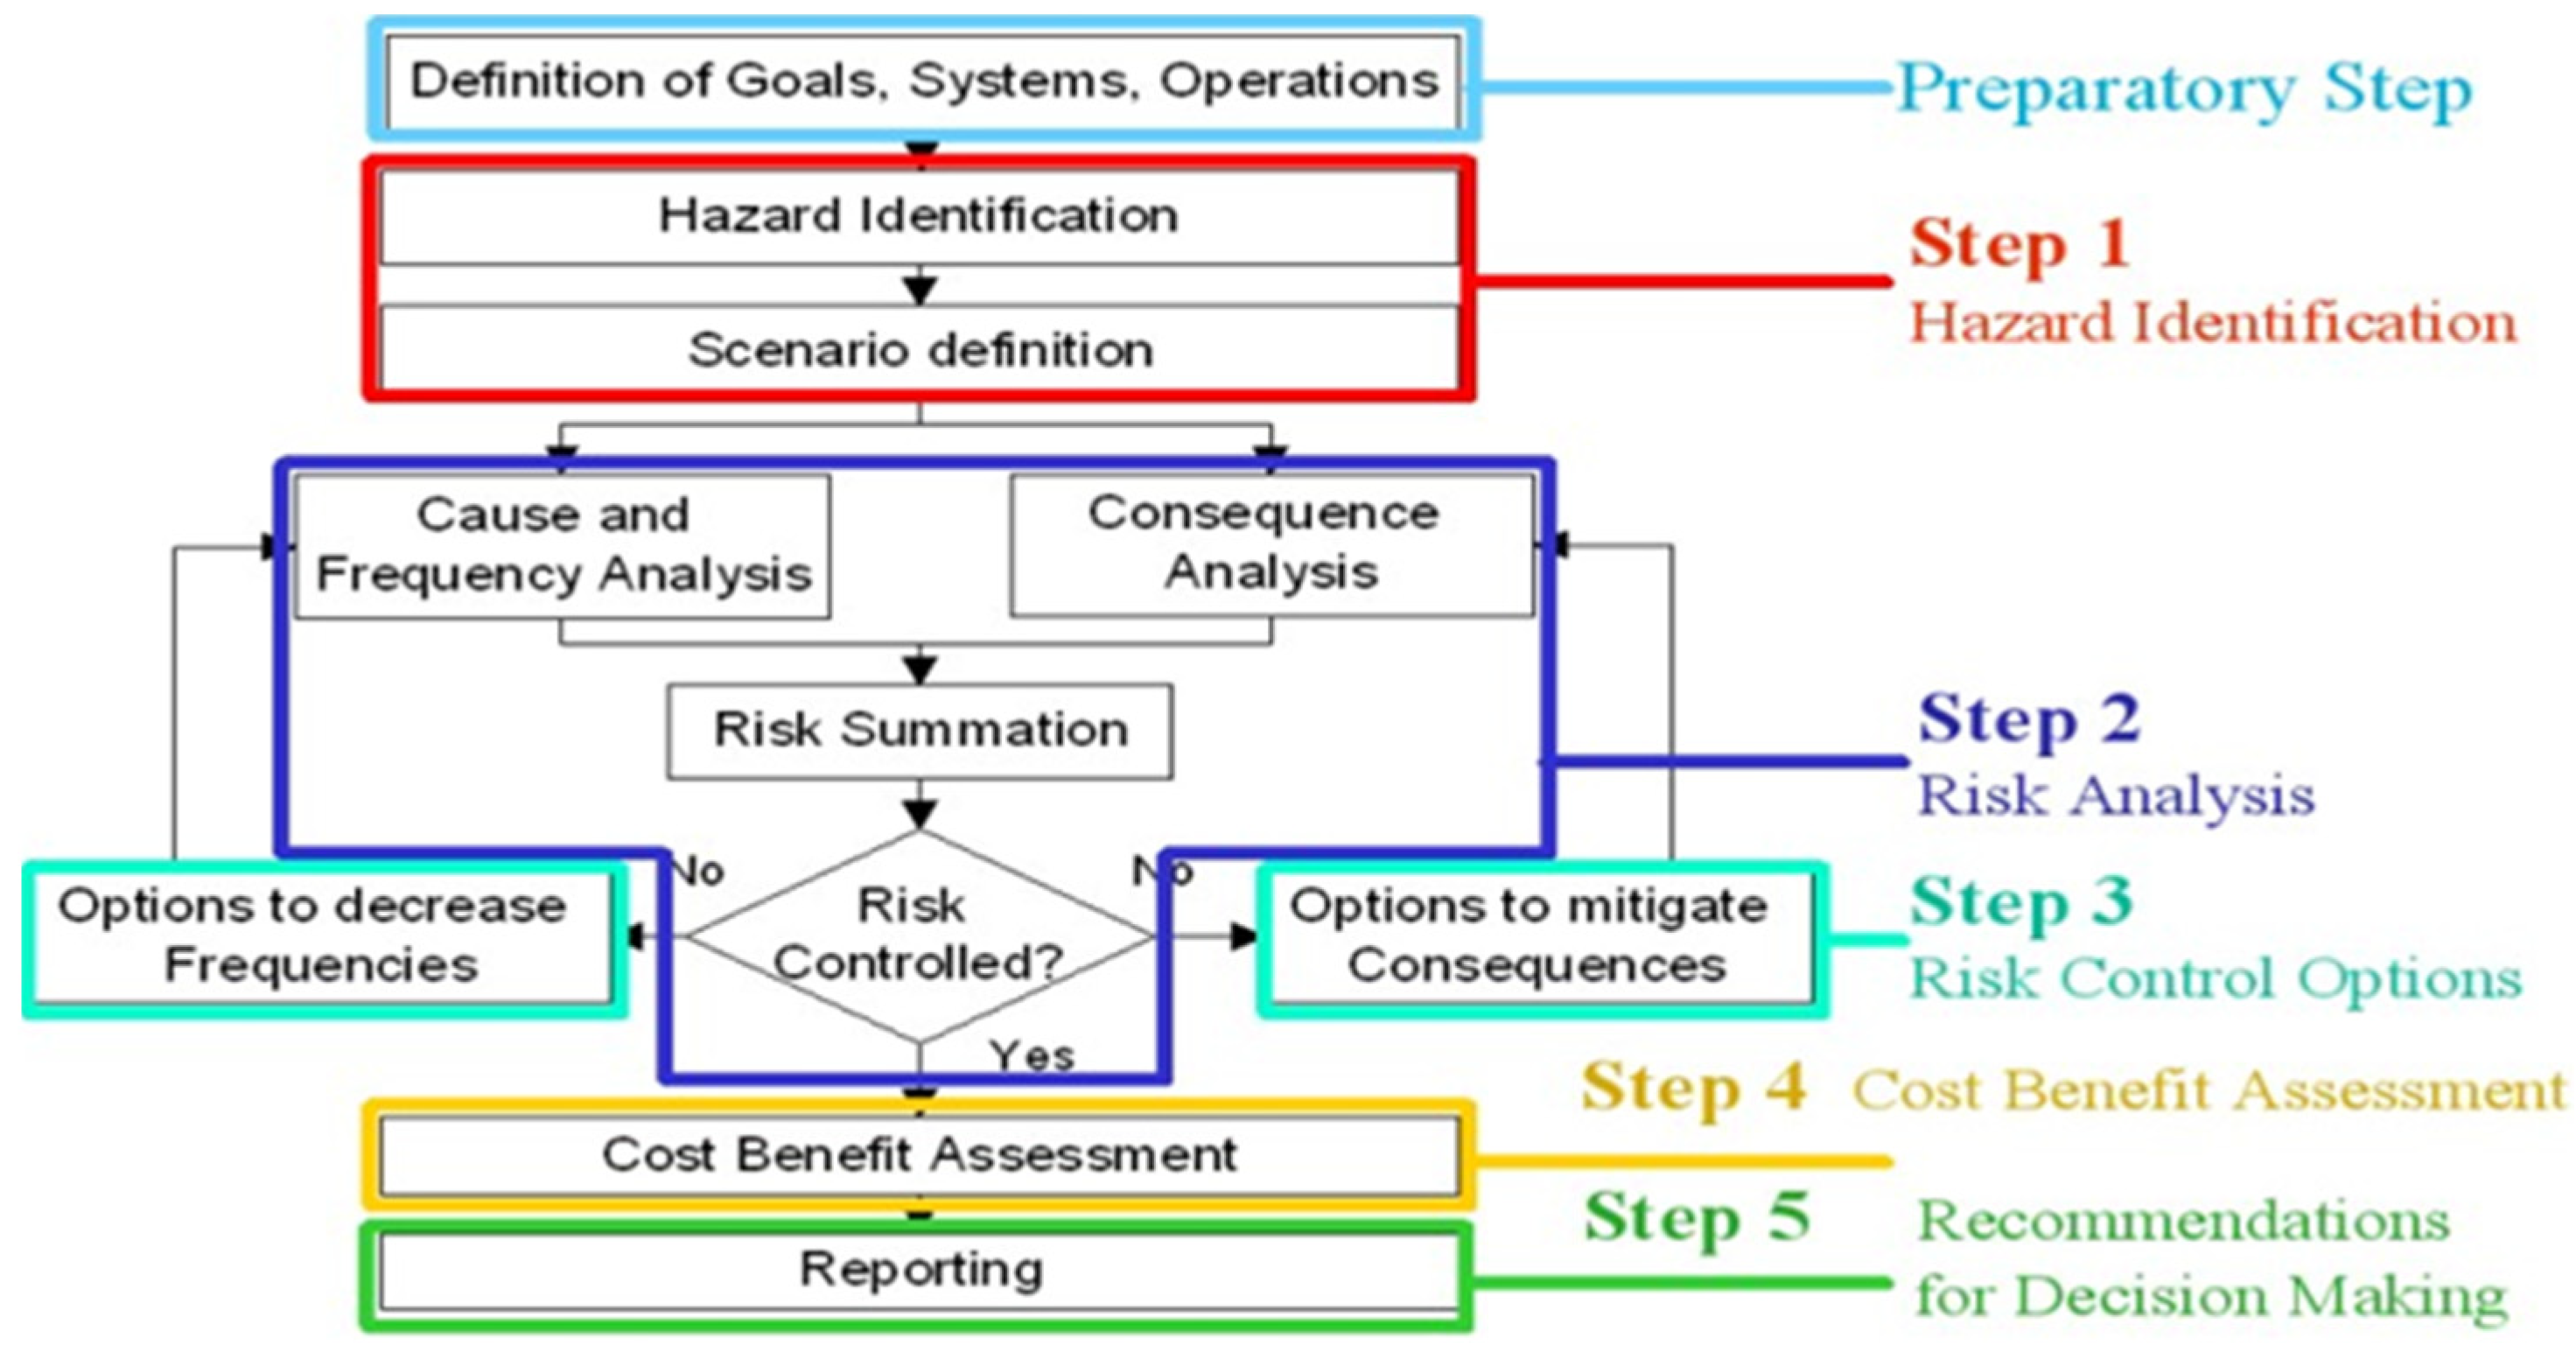
To improve maritime safety, the International Maritime Organization (IMO) proposed the Formal Safety Assessment (FSA) procedures to assess safety risks [27]. The process, shown in Figure 2, includes five steps: (1) hazard identification, (2) risk analysis, (3) risk control options, (4) cost-benefit assessment, and (5) recommendations on decisions [28]. In this article, the hazard is defined as any accident that endangers the navigation safety of a ferry. Since the FSA procedure includes complete and concrete implementation steps, it was widely applied in many workplaces of safety management, including maritime transportations [25,26,29], container terminals [28], airfreight transportations [12], etc.
In the FSA procedures, the hazard identification in Step 1 is to define the risk factors (RFs), and a risk matrix is usually employed to analyze the RFs in Step 2 (i.e., Risk Analysis). Traditionally, the risk matrix is constructed based on the consequence and likelihood of the RF (Duijm, 2015). The consequence refers to the extent of loss to an organization when a particular RF is incurred and can be generally divided into 1~4 (or 1~5) levels, such as very serious, major, moderate, minor, etc. The likelihood refers to the number of occurrences of a specific RF within a certain period. Again, it is divided into 1~4 (or 1~5) levels, such as: often occurs, common, less frequently occurs, and rarely occurs.
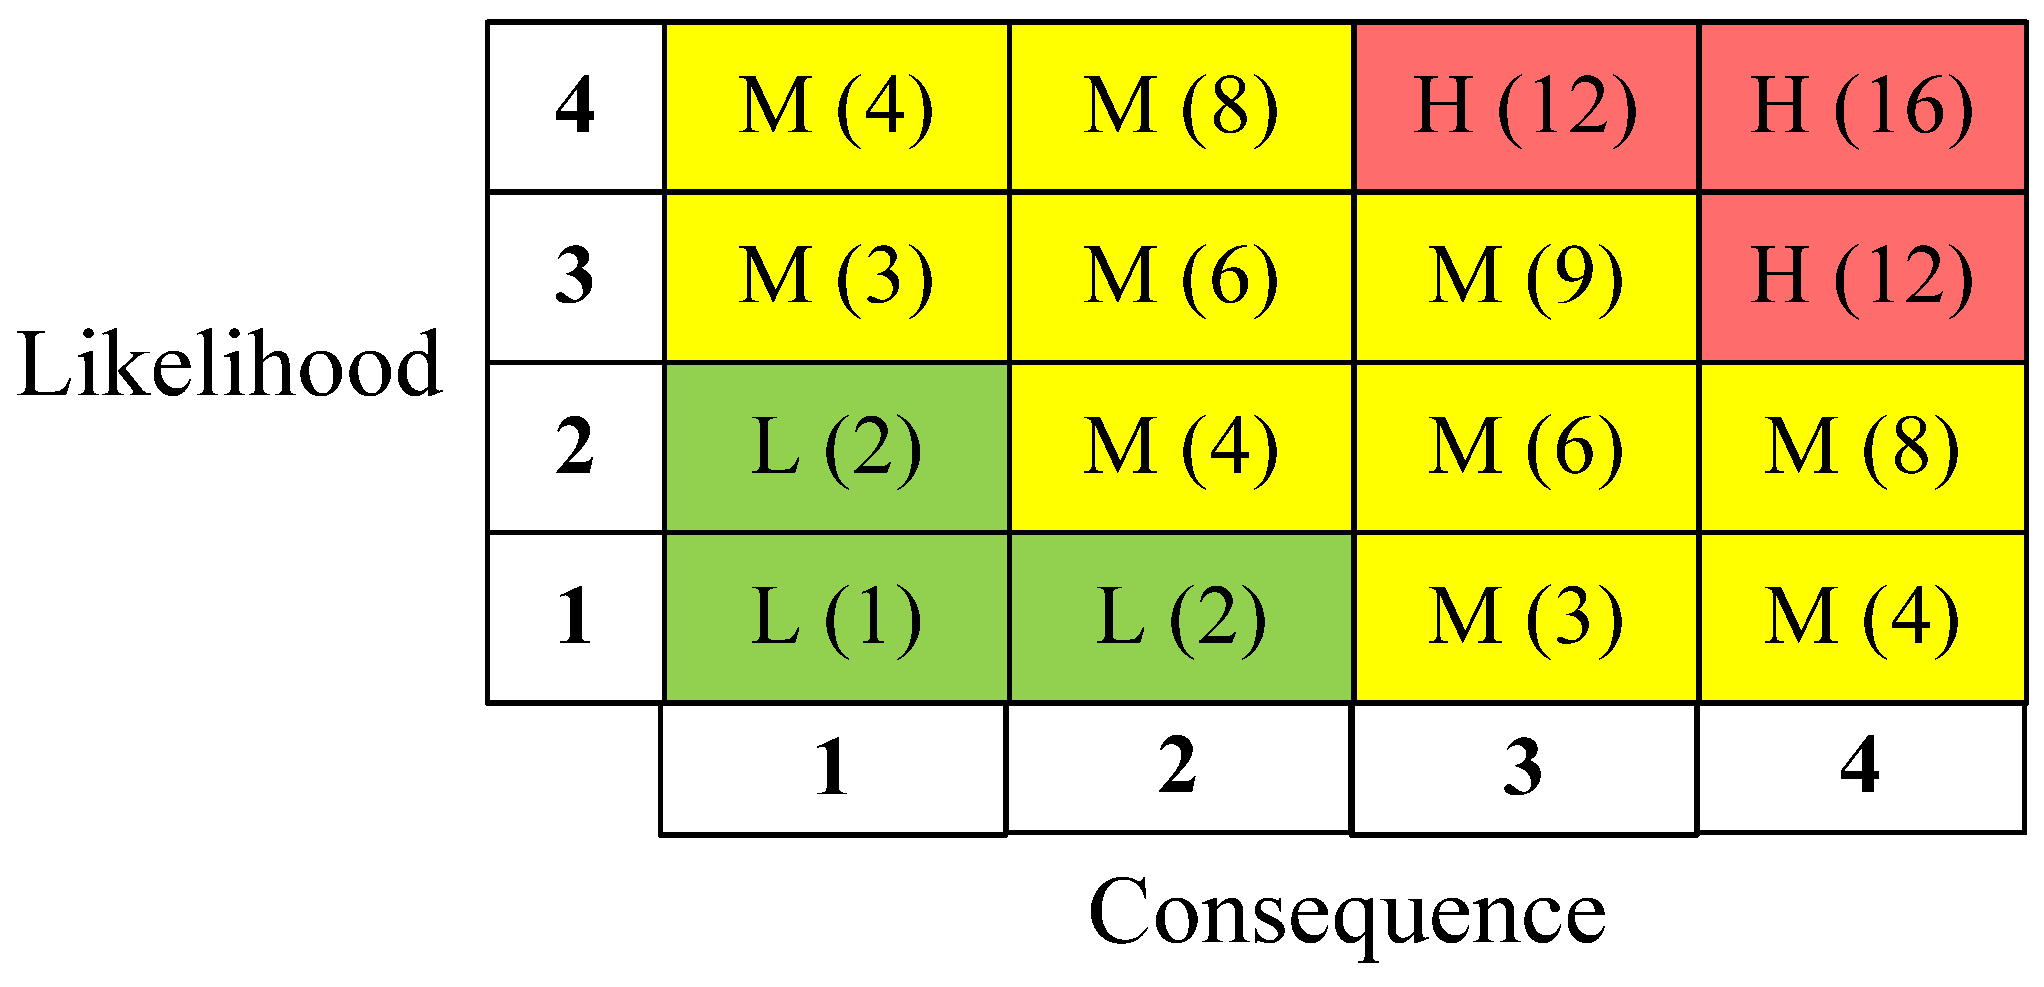
In the traditional risk matrix, based on the levels of both consequence and likelihood, a two-dimensional panel with a risk value is used to rank the RFs’ levels. The panel is divided into several colored areas to characterize the levels. Moreover, a risk value is yielded by the product of the two levels. For example, Figure 3 shows a 4 × 4 risk matrix that ranks the RFs into three levels. The RFs located in the green area with risk values between 1 and 2 are classified as L (low-risk) levels. In contrast, the RFs situated in the yellow and red regions are classified as M (medium-risk) and H (high-risk) levels, respectively. Since the levels of both consequence and likelihood are discontinuous, the risk value is discrete and, as a result, the panel becomes a discrete risk matrix.
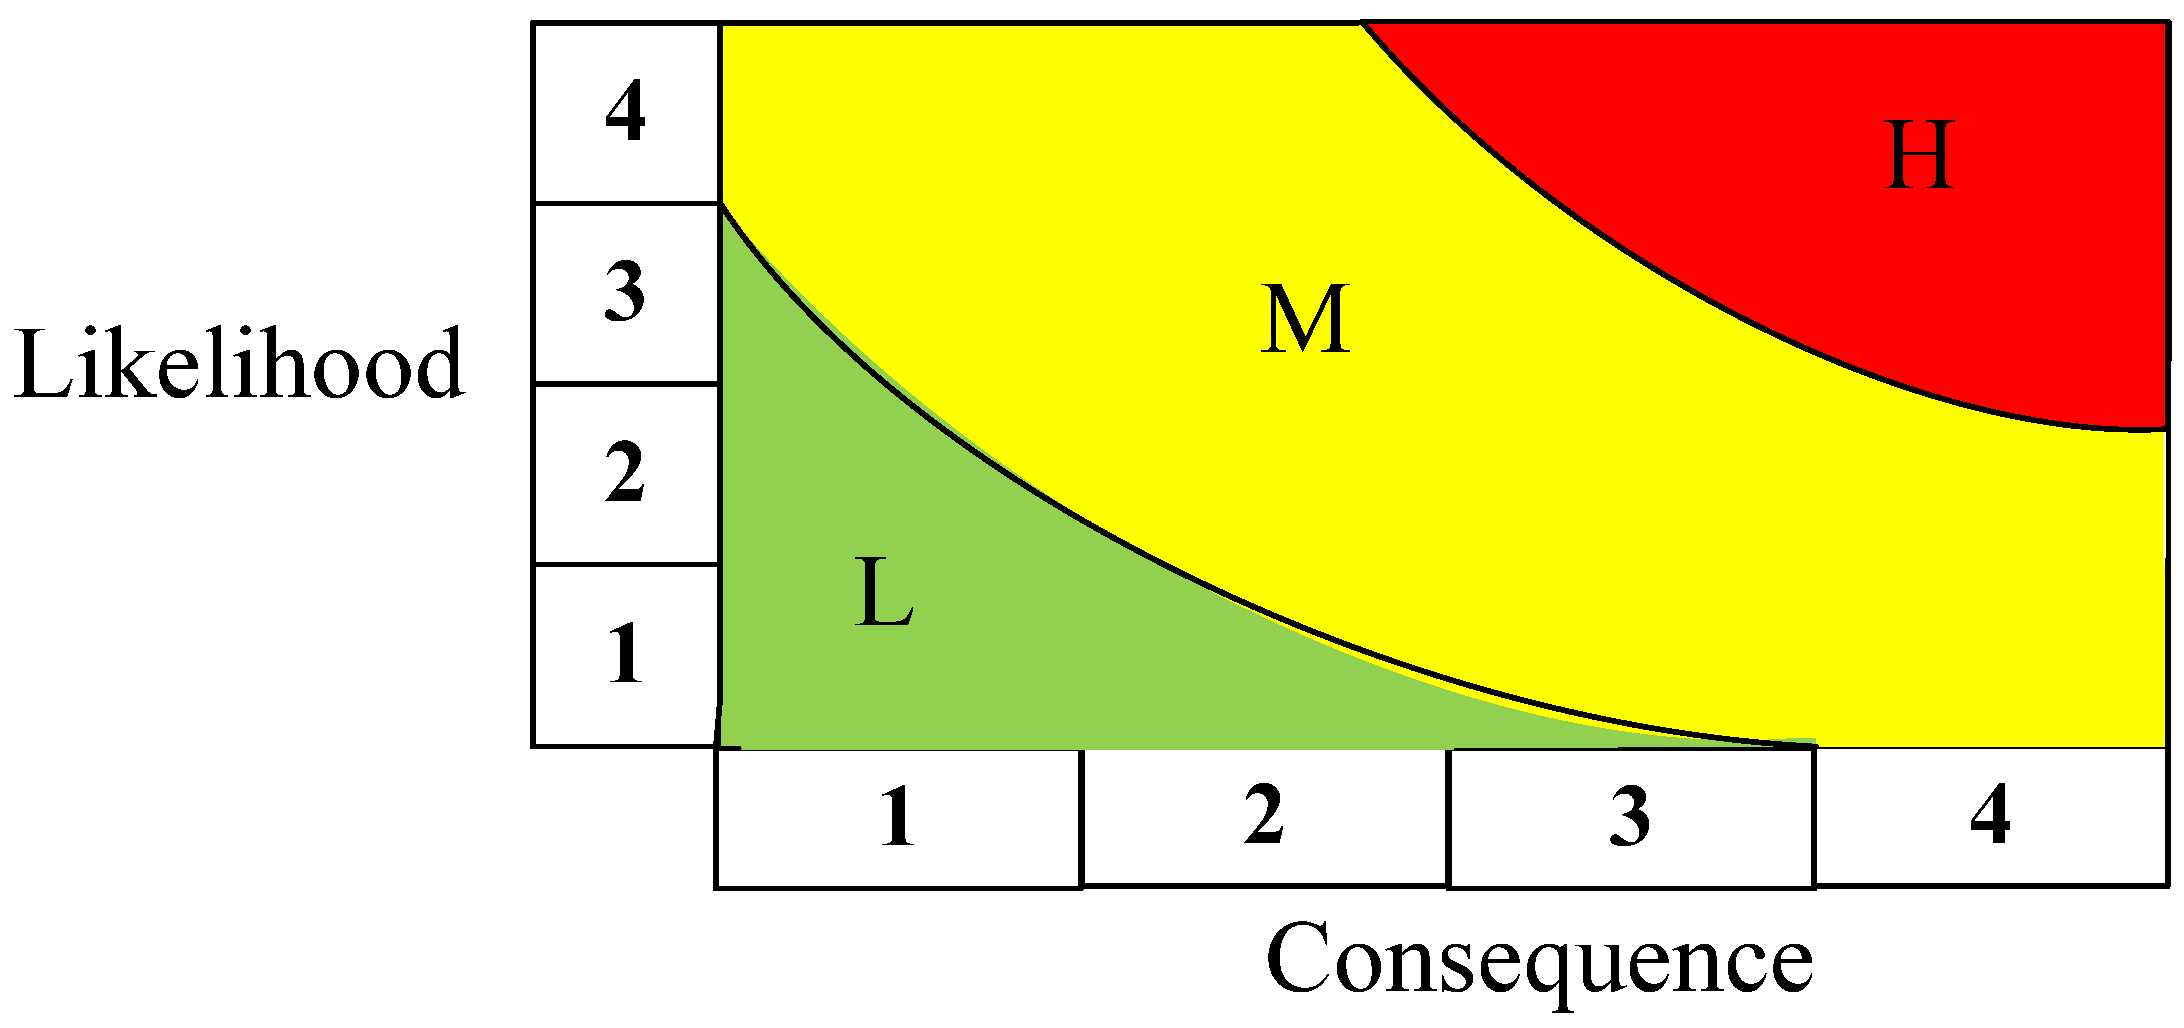
In practice, the discontinuity of a risk matrix may limit its applicability with respect to accuracies due to the consistency of the measurement data, risk-matrix grading [28], etc. To improve the shortcomings of discontinuity, the concept of a continuous risk matrix was thus proposed as shown in the curve in Figure 4 [12].
3. Research Method
In this paper, the risk factors (RFs) for accidents endangering the navigation safety of a ferry are initially identified. A fuzzy AHP (Analytic Hierarchy Process) is then used to assess those RFs’ weights, including both consequence and likelihood. Based on those weights, a continuous risk matrix is developed to assess the RFs’ risk levels. Furthermore, the ferries traveling across the Taiwan Strait were empirically investigated, following which, practical management policies for ferry navigation safety are suggested.
3.1. The Risk Factors (RFs)
A total of sixteen RFs are generated based on the ferry’s navigational characteristics and literature review in Section 2.2. Each RF is based on one of four factors: crew factor, ship hardware, ship management, and company management.
(1) Crew factor (CF)
In this paper, the CF is defined as the crew’s personal perspectives and attitudes regarding ferry safety practices, including safety knowledge, ability to manage shipping, personal self-discipline for work, fatalism cognition, etc. [10,11,16,18,19,21,24,25,26,27].
(2) Ship hardware (SH)
In this paper, the SH is defined as the equipment and facilities onboard a ship, including the usability of fundamental navigation equipment for ferry navigation, as well as the availability of emergency rescue systems, safety monitoring systems, and emergency alert navigational aids [3,8,10,11,15,16,18,19,27].
(3) Ship management (SM)
In this paper, the SM is defined as the management of crew operations in navigation, including compliance with standard operating procedures (SOPs), safety drillings, and crew coordination and collaboration. Furthermore, it also includes the development and implementation of different safety management processes onboard [14,16,18,27].
(4) Company Management (CM)
In this paper, the CM is defined as the safety management systems of a shipping company, including the process of crew recruiting, the crew assessment system, technical management, the mechanisms for rewarding and punishing employees, etc. [3,10,11,18,19,26].
Based on the above definitions, a two-layer structure of RFs was created hierarchically. To improve the practical validity of the RFs, three experienced crews working onboard ferries in Taiwan were invited to revise them. Furthermore, they were also asked to check the interdependencies among the RFs. After two rounds of revisions, the final hierarchical structure of the RFs, as shown in Table 2, contained 4 constructs of RFs for the first layer and 16 for the second layer.
3.2. The Continuous Risk Matrix
Based on Figure 4, both weights of consequence and likelihood are employed to construct the traditional risk matrix following which, the RF’s risk level is ranked.
3.2.1. The Expert Questionnaire and Research Sample
Since this study proposes a fuzzy AHP approach to weight the RFs, a pair-wise comparison questionnaire with a nine-point rating scale was designed to measure the respondents’ perceived scores for each RF, including consequence and likelihood. According to the hierarchical structure of the RFs in Table 2, an expert questionnaire with 4 criteria and 16 sub-criteria was created.
In this study, the top four ferry operators in Taiwan (Taiwan ferries case), as shown in the last row of Table 1, were empirically examined to validate the research. Each ferry operator was asked to provide 4-8 senior crews as respondents. Since the survey items are highly professional, all surveyed subjects must have sufficient work experience in navigation safety. Furthermore, to enhance the validity and reliability of the survey, an assistant was assigned to assist each respondent with completing the questionnaire. Finally, we successfully surveyed 22 respondents. Furthermore, since each crew was asked to answer both the perceived consequence and likelihood of the RFs, the total samples number 44. For verifying the consistency of the 44 measures, both consistency index (CI) and consistency ratio (CR) are used to test the consistency of each sample’s pairwise comparison matrix:
and
where is the maximum eigenvalue for each matrix, n is the number of criteria in the matrix, and RI represents a randomized index as shown in Table 3 (e.g., Hus, et al., 2016). Theoretically, Saaty suggested that the CR ≤ 0.1 is an acceptable range [12,30].
In this paper, the software package Expert Choice 11.5 is first used to find the CI for each sample, then, its CR can be obtained by Equation (2). Results showed six samples’ CI or CR > 0.1, which meant that they were inconsistent. Therefore, the questionnaire respondents were asked to modify their answers until their scales fitted the consistency tests.
The respondents’ profiles are shown in Table 4. Evidently, all respondents have at least 5 years of work experience and possess workplace safety licenses. The experiential qualifications of the respondents can support the reliability of the survey results.
3.2.2. The Weights of the RFs
From the sample data in the Taiwan ferries case, we have 44 positive reciprocal matrixes for each pair-wise comparison of the RFs in each layer, including 22 matrixes for consequence measures and 22 matrixes for likelihood measures. To consider the linguistic fuzziness of respondents when answering the survey, the fuzzy AHP approach was proposed to weight both the consequence and likelihood of the RFs [12,28]. For ease of explanation, we take the RFs in the CF construct with consequence measures as an example to detail the process of the fuzzy AHP approach. As shown in Table 2, the RFs in the CF construct include CF1, CF2, CF3, and CF4.
(1) The integration of multi-respondents’ opinions.
In this paper, the geometric mean of the measuring scores from multi-respondents is first found. A triangular fuzzy number parameterized by the geometric mean and two extreme values: the minimum and maximum of the measuring scores is then constructed to integrate the multi-respondent’s positive reciprocal matrixes into a fuzzy matrix [30].
(2) The integrated fuzzy positive reciprocal matrix
Suppose is the integrated fuzzy positive reciprocal matrix with n RFs as:
where the element is a triangular fuzzy number with parameters:
If we have m positive reciprocal matrix from m respondents, then based on step (1), those m matrixes can be aggregated into a fuzzy matrix with elements as:
For the data of the CF construct example, we had 22 matrixes. Based on Equation (4), those matrixes are integrated into a fuzzy positive reciprocal matrix, termed , as:
(3) The integrated crisp positive reciprocal matrix
In this paper, a weighted geometric mean method is used to defuzzify the into a crisp positive reciprocal matrix , in which, the fuzzy element in is defuzzified [12,30]:
Based on Equation (5), the example matrix was defuzzified as:
Note, that it is easy to test that the matrix still retains the features of a positive reciprocal matrix [30]. Thus, the simplified method: NGMR (Normalization of the Geometric Mean of the Rows) can be used to find the priority weights of the matrix (Satty, 2003).
(4) The RFs’ weights
Theoretically, the weights of the RFs can be determined from the eigenvectors of the matrix . Let represents the vector of the RFs’ weights. Then the W can be found by the eigenvector and eigenvalue of A as Saaty [31]:
If A is a positive reciprocal matrix, Saaty (2003) proposed the simplified method NGMR to find the approximated eigenvectors of A. Let be the eigenvector of A, then it can be found by the normalized geometric means of as:
Since the matrix is a positive reciprocal matrix, based on Equation (7), we have:
Further, substituting Equation (7) into Equation (6), we have
where . Finally, the approximated maximum eigenvalue of matrix A can be found by averaging the as:
For the example matrix , based on Equations (8) and (9), we had:
(5) The consistency test
Based on the (= 4.002) in Equation (9), both the indexes of CI and CR can be obtained from Equations (1) and (2) in Section 3.2.1 to test the consistency of the matrix . The results show: CI = 0.001 and CR = 0.001. Likewise, we tested the consistencies of the RFs in the other constructs in the Taiwan ferries case. The results shown in Table 5 indicate that all the CI and CR values are less than 0.1, implying that all the positive reciprocal matrixes in the Taiwan ferries case are consistent.
(6) The global weights of the RFs
Based on Equation (7), the local weights of the RFs can be found. Then, the global weights of the RFs can be obtained by multiplying the RFs’ local weights by their corresponding constructs’ global weights. As a result, in the Taiwan ferries case, the results of the RFs’ global weights for consequence and likelihood are shown in the last column of Table 6 and Table 7, respectively.
Table 6 indicates that for the RFs’ consequence weights, CF (32.53%) has the highest weight in the first layer of RFs, followed by SW (28.65%), SH (19.60%), and CM (19.22%). In the second layer, the RFs with higher weights are CF2 (9.95%), CF3 (8.80%), and SM3 (8.80%). Meanwhile, Table 7 shows that in the first layer of RFs, the RF with the highest likelihood weight is CF (29.48%), followed by SH (25.62%), SM (22.55%), and CM (22.35%). In the second layer, the RFs with higher weights are CF2 (8.81%) and CF3 (8.43%).
3.2.3. The Continuous Risk Matrix
In the theory of risk matrix, an RF with a higher consequence weight and higher likelihood weight should be ranked as a higher risk. Based on this conception, a risk value (RV) is thus constructed by the product of the two weights [12,25]. Let and be the consequence and likelihood weights of the ith RF, respectively. Then, the RV of the ith RF is found as:
Finally, the RV can be normalized as:
Based on Equation (11), and the RFs’ weights of consequence and likelihood in Table 6 and Table 7, the RVs for each RF can then be found in the fourth field of Table 8, named “RVs”. The results show that the RF with the highest risk is CF2 (13.57%), followed by CF3 (11.48%), SM3 (9.42%), and CF1 (8.38%).
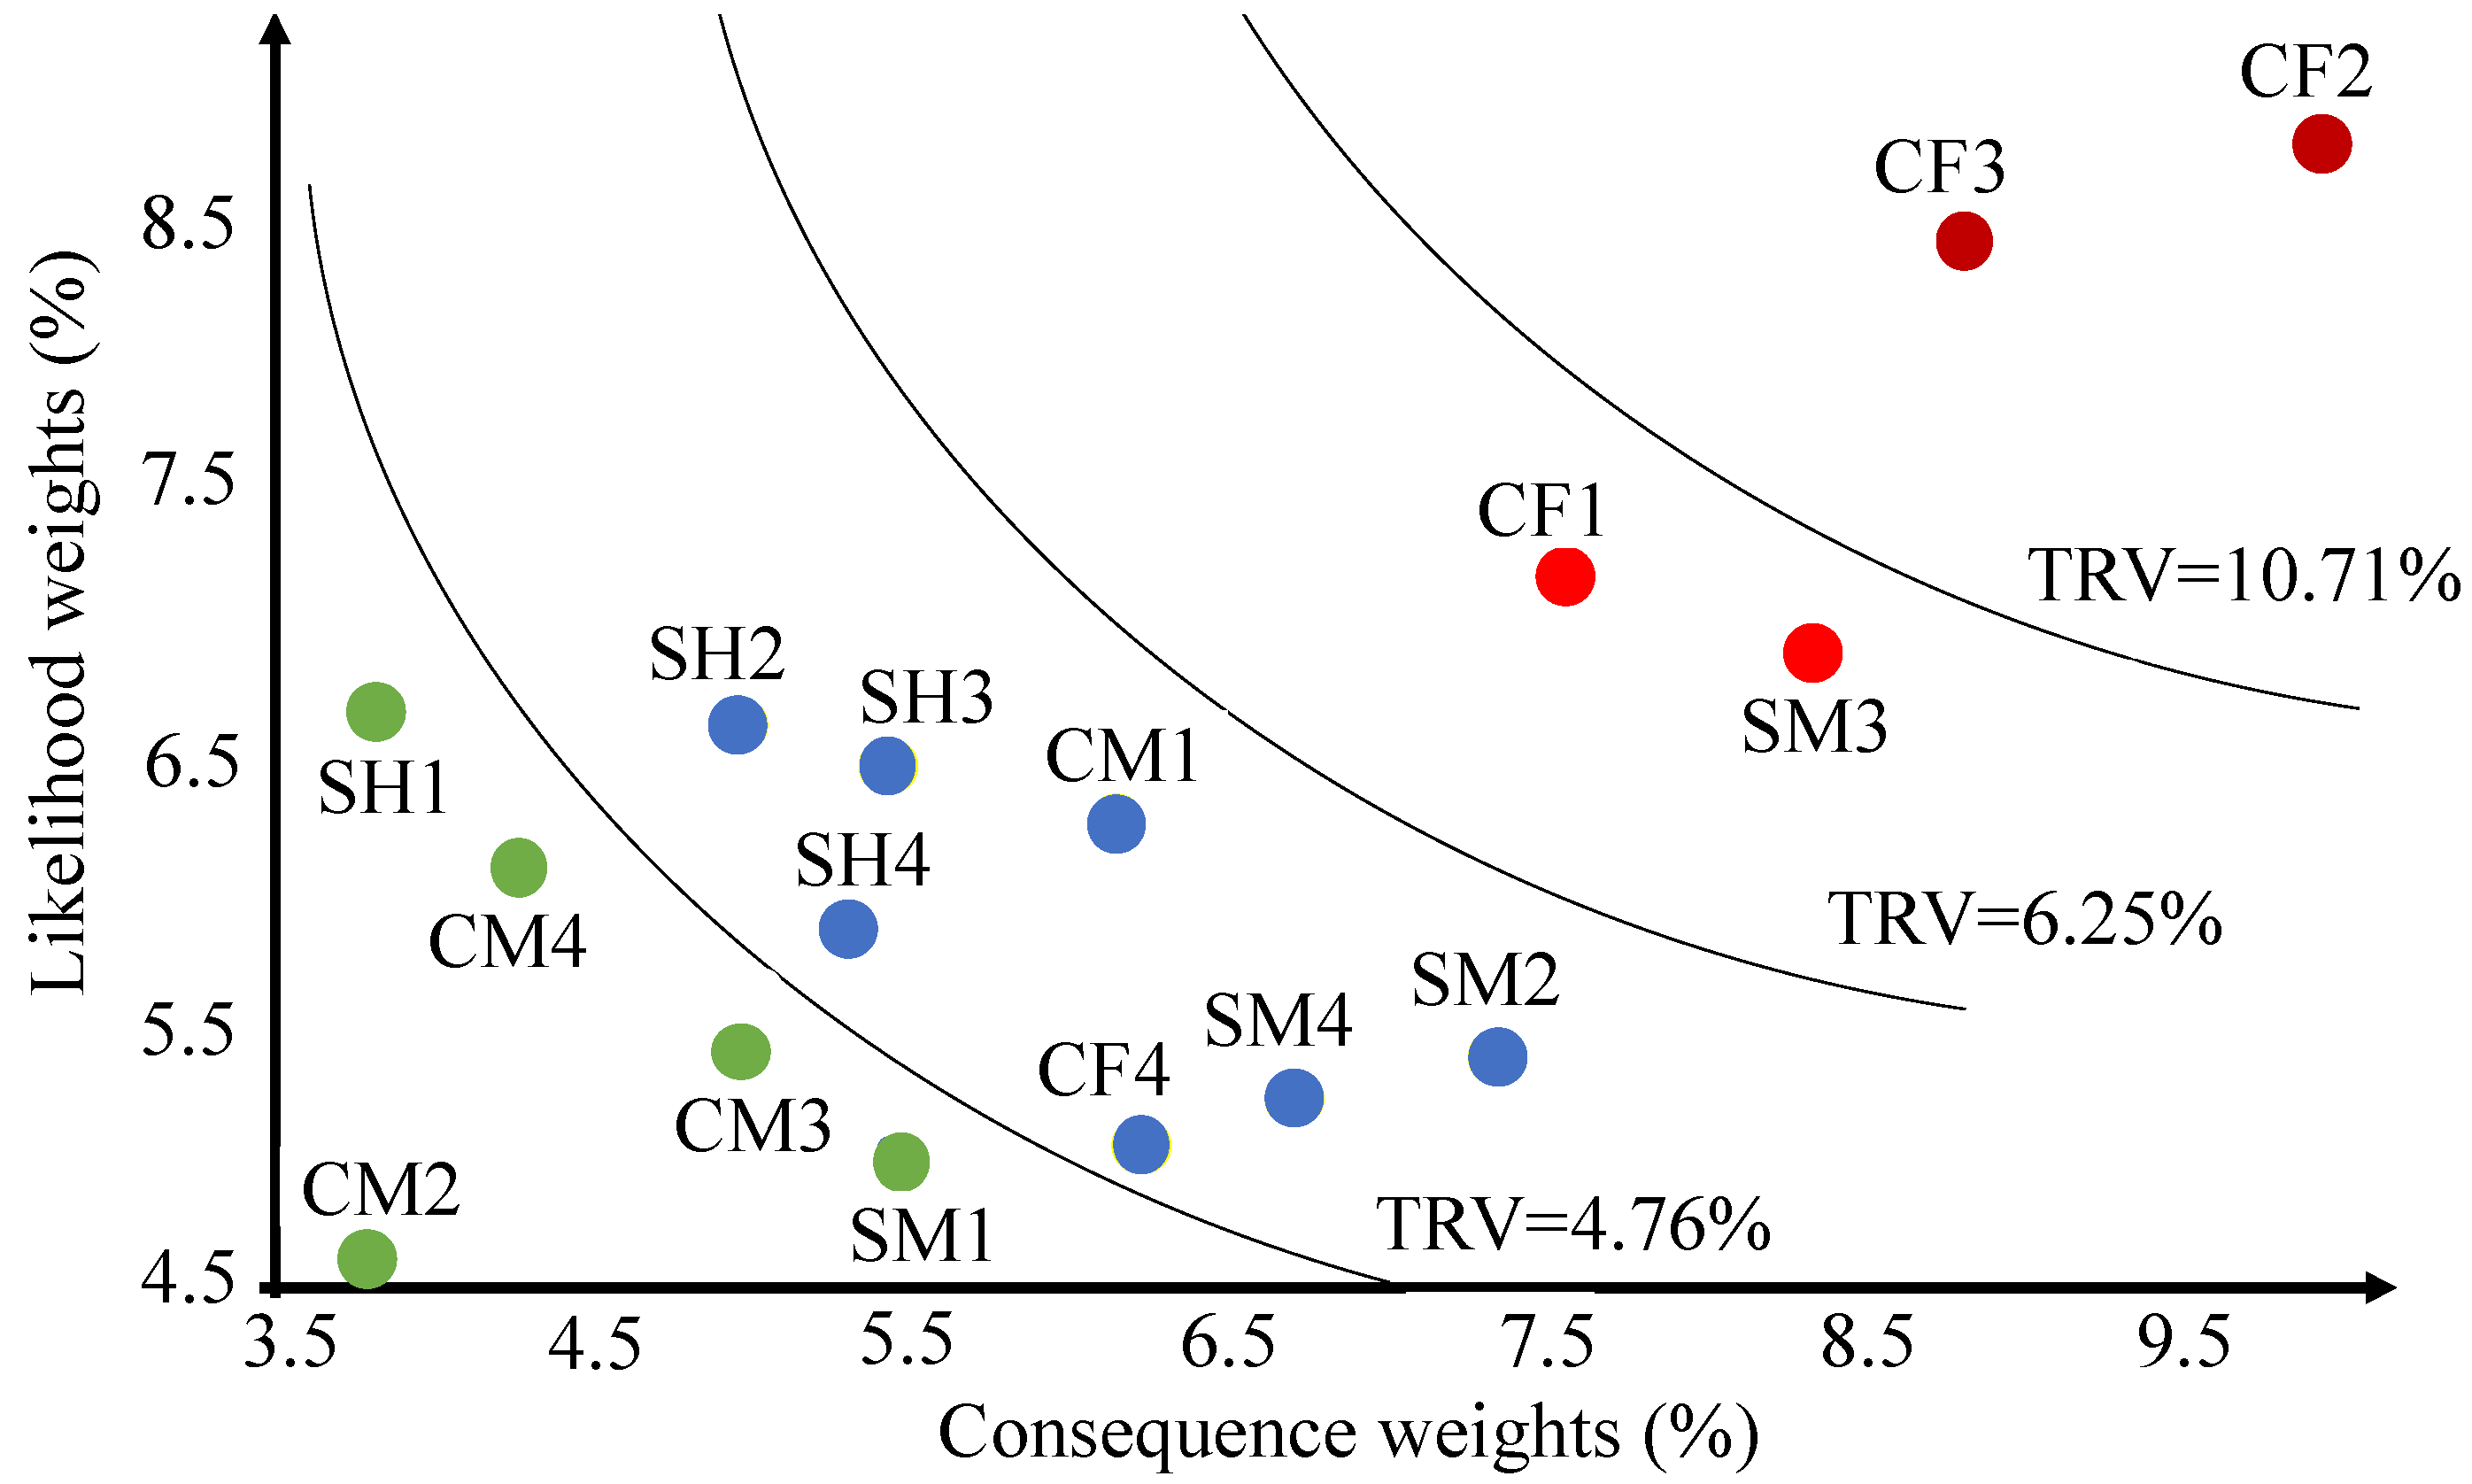
In this paper, a continuous risk matrix with four risk zones is constructed to rank the RFs’ risk levels. As shown in Figure 5, the risk matrix consists of an x-axis representing consequence weights and a y-axis depicting likelihood weights. Based on Equation (11), the matrix can be divided into four risk zones by three decreasing curves with different RV means. Firstly, the middle curve with RV = 6.25% is obtained by averaging the RVs of all the RFs in Table 8. The curve is then used to divide all the RFs into two groups by their RVs. Group one contains 4 RFs (CF2, CF3, SM3, and CF1) and group 2 includes the remaining 12 RFs. Averaging the four RVs of the RFs in group one, we have the second curve with the mean RV =10.71%. Similarly, the third curve with TRV = 4.76% can be obtained by averaging the 12 RVs of the RFs in group two.
4. Discussion
The result of the risk matrix assessment for the Taiwan ferries case shows that four RFs are classified as E level (CF2 and CF3) and H level (SM3 and CF1). Based on these results, we conducted a post-interview with some practical experts among the surveyed respondents and proposed the following management suggestions for ferry operators:
- CF2 (crews’ skills in shipping handling)
Generally, crew members must be qualified ahead of being recruited to work onboard, so their proficiency in ferry passenger handling could be assured. However, in the past decade, navigation technology has progressed rapidly and new navigation safety rules have been updated accordingly. Under these circumstances, crew members need to continuously acquire new knowledge of shipping handling. This paper suggests that ferry companies should connect and cooperate with academic institutions to regularly train crew members in specialized fields of new knowledge, such as the search and rescue of victims in distress at sea, new government regulations on maritime navigational safety, and risk identification and assessment. This suggestion is expected to reduce accidents in the workplace and prompt human safety [28]. Furthermore, the results of training programs should also be used to appraise crew members’ annual performances so that maritime personnel are motivated to join training programs in earnest.
- 2.
- CF3 (Crews’ self-discipline for work)
Maritime transportation has witnessed many accidents in the workplace due to crew members’ health [28]. So, personal self-discipline for work should be paid more attention to, as evidenced by our article. Any level of alcohol or illegal drug consumption by crew members threatens the safety of ferry operations, other crew members, as well as passengers. Overworking and burnout, which is an alarming trend among employees in the shipping industry globally, also have adverse effects on ferry navigation safety. To tackle these circumstances, this paper suggests that ferry companies should frequently utilize recorded data to check crew operations on board after each voyage. Any abnormal actions occurring need to be reported immediately to minimize the likelihood of incidents. It is also advised that safety alert devices be installed to prevent captains from becoming overly fatigued as a result of overworking or sleeplessness or to detect the use of illicit drugs and alcohol.
- 3.
- SM3 (Compliance with SOPs)
As mentioned earlier, many maritime accidents are attributable to crew or human error. To prevent such accidents, shipping companies should establish standard operational procedures (SOPs) for crew members to follow. Currently, compliance with SOPs is occasionally ignored. In Taiwan, overcrowding and overloading are also major problems causing navigational risks for ferry transport, which could result in crew members neglecting the company’s SOPs. This paper suggests that overcrowding and overloading should be inspected carefully before commencing a voyage; that ferry owners should be heavily fined for overloading; and that carrying commercial cargo in passenger ferries should be strictly prohibited [9]. Furthermore, in practice, because safety regulations often change over time, this paper also suggests that ferry managers should update existing SOPs regularly and ask crew members to implement SOPs accurately in navigation operations to reduce accidents.
- 4.
- CF1 (Emergency responses)
In practice, a crew’s emergency response capabilities can be strengthened by sufficient safety knowledge and training. Based on the post-interviews, this study recommends the following for this RF:
- (1)
- Carry out regular drills to enhance the crew’s emergency response capabilities, such as the use of rescue equipment, conducting emergency evacuations, and general response procedures.
- (2)
- Ask crews to take functional recurrent training, through practical operations or online learning systems (E-Learning), to regularly renew their qualification licenses.
- (3)
- Encourage and subsidize crews to participate in seminars at academic institutions to enhance their safety knowledge, such as accident features, identifications, preventions, rescues, etc.
5. Conclusions
In practice, ferries are the preferred form of transport for cargo and passengers between islands with relatively short distances. However, some operational safety standards in ferry transportation are easily ignored, thus they are prone to dangerous accidents. Therefore, ensuring ferry navigational safety has attracted much attention from academics, policymakers, and practitioners. The purpose of this paper was aimed at assessing the risks to navigation safety for ferries. In the article, sixteen risk factors (RFs) were first investigated for ferry navigation. A continuous risk matrix based on a fuzzy AHP approach was then developed to evaluate the RFs’ risks. The risk assessment approach may provide references for related research in the safety management of short-distance passenger ships, including ferries and cruise ships.
To validate the practical application of the research, the main ferry operators in Taiwan were empirically investigated. The results identified four top-layer RFs including crews’ skills in shipping handling, personal self-discipline for work, compliance with SOPs, and emergency responses. With regard to the results, some management policy improvements are suggested. These results provide helpful information for TNC to improve its navigational safety. Furthermore, the empirical results are representative and may also provide practical management references for foreign ferry companies.
Although this paper succeeds in assessing navigation safety for ferries, several potential limitations can be noted for further studies. First, this article uses fuzzy AHP to evaluate the weights of the RFs. One of the basic assumptions of AHP is that the criteria (i.e., RFs) must be independent of each other. However, the independence among the RFs in this study was just verified by practical experts. In the questionnaire design stage, they were interviewed to revise the RFs and the hierarchical structure based on their subjective judgments. Therefore, in theory, it may not be rigorous enough. Future research could consider adopting ANP (Analytic Network Process) or the AHP revision model to assess the RFs [30]. Secondly, this study investigated the ferry navigational safety in the Taiwan Strait as an empirical study. However, different ferry routes may differ in their environmental features. Thus, this paper’s results may not be completely applicable to ferries in other areas. Lastly, in this study, 22 experts from Taiwanese ferries were empirically surveyed. This article also adopted an interview survey instead of a mailed survey to improve the validation of the survey. Therefore, the validity and reliability of the research results could be verified. However, to better confirm the empirical results, more representative samples may be needed in future research.
Author Contributions
Conceptualization, W.-K.K.H.; methodology, J.-W.C. and W.-K.K.H.; writing and revising, N.T.H. and W.-K.K.H.; investigation, Y.-Y.L.; All authors have read and agreed to the published version of the manuscript.
Funding
This research was funded by Ministry of Science and Technology, R.O.C. grant number [MOST 110-2622-H-992-004].
Institutional Review Board Statement
Not applicable.
Informed Consent Statement
Not applicable.
Data Availability Statement
The study did not report any data.
Conflicts of Interest
The authors declare no conflict of interest.
References
- European Commission. Statistical Pocketbook. Available online: https://ec.europa.eu/transport/factsfundings/statistics/pocketbook-2020_en (accessed on 5 March 2022).
- Ozbas, B. Safety risk analysis of maritime transportation: Review of the literature. Transp. Res. Rec. 2013, 2326, 32–38. [Google Scholar] [CrossRef]
- Della, R.H.; Lirn, T.C.; Shang, K.C. The study of safety behavior in ferry transport. Saf. Sci. 2020, 131, 104912. [Google Scholar] [CrossRef]
- Todd, D. The World Shipbuilding Industry, 1st ed.; Routledge: London, UK, 1985. [Google Scholar]
- BCC NEWS.Congo River: At Least 60 Drowned after Boat Capsizes. Available online: https://www.bbc.com/news/world-africa-56082260 (accessed on 5 March 2022).
- NORTHEST NOW. Bangladesh Ferry Capsize Toll Rises to 34. Available online: https://nenow.in/neighbour/bangladesh-ferry-capsize-toll-rises-to-34.html (accessed on 30 March 2022).
- Wikipedia. Sinking of MV Sewol 2022. Available online: https://en.wikipedia.org/wiki/Sinking_of_MV_Sewol (accessed on 30 March 2022).
- Ung, S. Navigation Risk estimation using a modified Bayesian Network modeling-a case study in Taiwan. Reliab. Eng. Syst. Saf. 2021, 213, 107777. [Google Scholar] [CrossRef]
- Mia, M.J.; Uddin, M.I.; Awal, Z.I.; Abdullah, A. An era of inland water transport accidents and casualties: The case of a low-income country. J. Int. Marit. 2021, 5, 32–39. [Google Scholar] [CrossRef]
- Lau, Y.Y.; Lu, C.S.; Weng, H.K. The effects of safety delivery and safety awareness on passenger behaviour in the ferry context. Marit. Policy Manag. 2021, 48, 46–60. [Google Scholar] [CrossRef]
- Lu, C.S.; Tseng, P.-H. Identifying crucial safety assessment criteria for passenger ferry services. Saf. Sci. 2012, 50, 1462–1471. [Google Scholar] [CrossRef]
- Hsu, W.K.; Huang, S.H.S.; Tseng, W.J. Evaluating the risk of operational safety for dangerous goods in airfreights–A revised risk matrix based on fuzzy AHP. Transp. Res. D. Transp. Environ. 2016, 48, 235–247. [Google Scholar] [CrossRef]
- National Development Council. Taiwan Statistical Data Book; damit Erscheinen Eingestellt: Taipei, Taiwan, 2019. [Google Scholar]
- Safer EURORO Report, Design for Safety: An Integrated approach to Safe European RoRo Ferry Design 2008. Available online: http://research.dnv.com/skj/safereuroro/safer_euroro_1_final.pdf (accessed on 30 March 2022).
- Hsu, W.K. Ports’ service attributes for ship navigation safety. Saf. Sci. 2012, 50, 244–252. [Google Scholar]
- Khan, B.; Khan, F.; Veitch, B.; Yang, M. An operational risk analysis tool to analyze marine transportation in Arctic waters. Reliab. Eng. Syst. Saf. 2018, 169, 485–502. [Google Scholar] [CrossRef]
- Zhang, M.; Zhang, D.; Yao, H.; Zhang, K. A probabilistic model of human error assessment for autonomous cargo ships focusing on human–autonomy collaboration. Saf. Sci. 2020, 130, 104838. [Google Scholar] [CrossRef]
- Kececi, T.; Arslan, O. SHARE technique: A novel approach to root cause analysis of ship accidents. Saf. Sci. 2017, 96, 1–21. [Google Scholar] [CrossRef]
- Mutmainnah, W.; Bowo, L.; Sulistiyono, A.; Furusho, M. Causative chaindifference for each type of accidents in Japanese Maritime Traffic Systems (MTS). Mar. Navig.—Proc. Int. Conf. Mar. Navig. Saf. Sea Transp. 2017, 11, 489–494. [Google Scholar]
- Bowo, L.P.; Furusho, M. Human error assessment and reduction technique for marine accident analysis: The case of ship grounding. Trans. Navig. 2018, 3, 1–7. [Google Scholar]
- de Osés, F.X.M.; Ventikos, N.P. A Critical Assessment of Human Element Regarding Maritime Safety: Issue, Planning, and Practice. 2003. Available online: https://www.researchgate.net/publication/33421049_A_Critical_Assessment_of_Human_Element_Regarding_Maritime_Safety (accessed on 30 March 2022).
- Dhillon, B.S. Transportation Systems Reliability and Safety, 1st ed.; CRC Press: Boca Raton, FL, USA, 2019. [Google Scholar]
- Mutmainnah, W.; Furusho, M. 4M Overturned Pyramid (MOP) Model Utilization: Case Studies on Collision in Indonesian and Japanese Maritime Traffic Systems (MTS). Mar. Navig.—Proc. Int. Conf. Mar. Navig. Saf. Sea Transp. 2016, 10, 257–264. [Google Scholar] [CrossRef] [Green Version]
- Havold, J.I. Safety culture and safety management aboard tankers. Reliab. Eng. Syst. Saf. 2010, 95, 511–519. [Google Scholar] [CrossRef]
- Hsu, W.K.; Lian, S.J.; Huang, S.H. Risk assessment of operational safety for oil tankers-a revised risk matrix. J. Navig. 2017, 70, 775–788. [Google Scholar] [CrossRef]
- Hsu, W.K.; Huang, S.H.; Yeh, R.F. An assessment model of safety factors for product tankers in coastal shipping. Saf. Sci. 2015, 76, 74–81. [Google Scholar] [CrossRef]
- Kontovas, C.A.; Psaraftis, H.N. Formal safety assessment: A critical review. Mar. Technol. SNAME News 2009, 46, 45–59. [Google Scholar] [CrossRef]
- Hsu, W.K.; Huang, S.H.; Wu, S.W. A 3D continuous risk matrix for risk assessment of operational safety in inland container terminals. Proc. Inst. Mech. Eng. M J. Eng. Marit. Environ. 2022, 236, 315–325. [Google Scholar] [CrossRef]
- Hsu, W.K.; Kao, J.C. The safety of ship berthing operations at port dock—A gap assessment model based on fuzzy AHP. Int. J. Marit. Eng. 2017, 159, A377–A392. [Google Scholar] [CrossRef]
- Huang, S.H.; Hsu, W.K.; Chen, J.W. A safety evaluation system based on a revised fuzzy AHP for dangerous goods in airfreights. J. Transp. Saf. Secur. 2020, 12, 611–627. [Google Scholar] [CrossRef]
- Saaty, T.L. Decision-making with the AHP: Why is the principal eigenvector necessary. Eur. J. Oper. Res. 2003, 145, 85–91. [Google Scholar] [CrossRef]
Figure 1.
Ferry routes between Taiwan and archipelagic islands.

Figure 2.
The Formal Safety Assessment (FSA) procedures.

Figure 3.
The traditional risk matrix.

Figure 4.
The continuous risk matrix.

Figure 5.
The risk matrix for the Taiwan ferries case.


Table 1.
The ship profiles of main ferries in Taiwan.
| Ferry |  |  |  |  | |
|---|---|---|---|---|---|
| Ship Profile | |||||
| Ship’s name | Tai-Hua Wheel (THW) | Taiwan Horse Star (THS) | Lina Wheel (LW) | Strait (ST) | |
| Build year | 1989 | 2015 | 2007 | 2006 | |
| Weight (tons) | 8134 | 4958 | 10,712 | 6556 | |
| Length (m) | 120.00 | 104.60 | 112.60 | 97.22 | |
| Width (m) | 19.30 | 16.00 | 30.50 | 26.60 | |
| Speed (knots) | 22 | 21 | 40 | 38 | |
| Passengers | 1150 | 580 | 800 | 750 | |
| Crew | 21 | 19 | 22 | 22 | |
| Operating route | Kaohsiung-Penghu | Keelung-Matsu | Taipei-Pingtan | Taichung-Pingtan | |
| Operated by | Taiwan Navigation Company | Taima Star company | Lina Travel agency | Strait Express | |
Table 2.
The risk factors (RFs) for ferry navigation safety.
| Layer1: Construct | Layer 2: Risk Factors (RFs) | |
|---|---|---|
| Crew Factor (CF) | CF1 | Emergency responses: crews’ responsive abilities to an unexpected or dangerous occurrence, such as fire, injury, etc. |
| CF2 | Handling skills: crews’ skills in shipping handling, such as gear operations, cargo handling, etc. | |
| CF3 | Personal self-discipline: crews’ self-discipline for work, such as work ethics, good health, etc. | |
| CF4 | Fatalistic cognition: crews believe that accidents are destined by God, thereby ignoring safety regulations. | |
| Ship Hardware (SH) | SH1 | Navigation equipment: the usability of core navigation equipment for ferry navigation, such as geographic information services, radars, etc. |
| SH2 | Rescue equipment: the usability of emergency rescue equipment, such as fire extinguishers, lifeboats, medical equipment, etc. | |
| SH3 | Monitoring system: the usability of the safety monitoring system, such as emergency alarms, fire detection, etc. | |
| SH4 | Communications systems: the usability of communications equipment to call for help from shore, such as AIS, VHF, SSAS, etc. | |
| Ship Management (SM) | SM1 | Management system: the process of managing crews onboard, such as working hours, task distribution, etc. |
| SM2 | Safety drillings: the regular exercise of safety drillings onboard. | |
| SM3 | Implementing SOPs: crews’ compliance with the standard operational procedures for work. | |
| SM4 | Working climate: the coordination and cooperation among seafarers on board. | |
| Company Management (CM) | CM1 | Recruitment system: the process to recruit highly qualified crews. |
| CM2 | Appraisal system: the appraisal system for crews’ working performances. | |
| CM3 | Ship inspection: regularly arranging and supervising dry dockings, repairs, alterations, and maintenance. | |
| CM4 | Performance reward: the mechanisms of reward and punishment for crews’ working performance. | |
Table 3.
The values of the RI corresponding to a variety of n.
| n | 3 | 4 | 5 | 6 | 7 | 8 | 9 | 10 | 11 | 12 |
|---|---|---|---|---|---|---|---|---|---|---|
| RI | 0.525 | 0.882 | 1.115 | 1.252 | 1.341 | 1.404 | 1.452 | 1.484 | 1.513 | 1.535 |
Table 4.
Profiles of the respondents.
| Features | Range | Frequency | Percentage (%) |
|---|---|---|---|
| Workplace safety License | Yes | 22 | 100.00 |
| No | 0 | 0.00 | |
| Educational level | Master and above | 4 | 18.18 |
| University | 14 | 63.64 | |
| College | 4 | 18.18 | |
| Age (years) | 31~40 | 8 | 36.36 |
| 41~50 | 10 | 45.45 | |
| Over 50 | 4 | 18.18 | |
| Work experience (years) | 5~10 | 4 | 18.18 |
| 10~20 | 14 | 63.64 | |
| Over 20 | 4 | 18.18 | |
| Job title | Captain | 3 | 13.64 |
| Officers | 7 | 31.82 | |
| Chief Engineer | 2 | 9.09 | |
| Engineers | 5 | 22.73 | |
| Senior crew | 5 | 22.73 |
Table 5.
The consistency tests for the samples in the Taiwan ferries case.
| Measurements | Constructs | CI | RI | CR |
|---|---|---|---|---|
| Consequence | Layer 1 | 0.002 | 0.882 | 0.002 |
| Layer 2: CF | 0.001 | 0.882 | 0.001 | |
| Layer 2: SH | 0.006 | 0.882 | 0.007 | |
| Layer 2: SM | 0.010 | 0.882 | 0.011 | |
| Layer 2: CM | 0.010 | 0.882 | 0.011 | |
| Likelihood | Layer 1 | 0.003 | 0.882 | 0.003 |
| Layer 2: CF | 0.001 | 0.882 | 0.001 | |
| Layer 2: SH | 0.001 | 0.882 | 0.001 | |
| Layer 2: SM | 0.002 | 0.882 | 0.002 | |
| Layer 2: CM | 0.009 | 0.882 | 0.010 |
Note: Boldfaced values represent the CI and CR for the example of the CF construct.
Table 6.
The consequence weights of risk factors (RFs).
| Layer 1 RFs | Global Weights of Layer 1 (%) | Layer 2 RFs | Local Weights of Layer 2 (%) | Global Weights of Layer 2 (%) |
|---|---|---|---|---|
| CF | 32.53 | CF1 | 23.19 | 7.55 |
| CF2 | 30.60 | 9.95 | ||
| CF3 | 27.06 | 8.80 | ||
| CF4 | 19.15 | 6.23 | ||
| SH | 19.60 | SH1 | 19.55 | 3.83 |
| SH2 | 25.40 | 4.98 | ||
| SH3 | 27.92 | 5.47 | ||
| SH4 | 27.13 | 5.32 | ||
| SM | 28.65 | SM1 | 20.17 | 5.78 |
| SM2 | 25.67 | 7.35 | ||
| SM3 | 30.73 | 8.80 | ||
| SM4 | 23.44 | 6.72 | ||
| CM | 19.22 | CM1 | 32.18 | 6.18 |
| CM2 | 19.61 | 3.77 | ||
| CM3 | 25.80 | 4.96 | ||
| CM4 | 22.40 | 4.31 |
Note: The boldfaced values represent the RFs with higher weights.
Table 7.
The likelihood weights of risk factors (RFs).
| Layer 1 RFs | Global Weights of Layer 1 (%) | Layer 2 RFs | Local Weights of Layer 2 (%) | Global Weights of Layer 2 (%) |
|---|---|---|---|---|
| CF | 29.48 | CF1 | 24.35 | 7.18 |
| CF2 | 29.90 | 8.81 | ||
| CF3 | 28.59 | 8.43 | ||
| CF4 | 17.15 | 5.06 | ||
| SH | 25.62 | SH1 | 26.17 | 6.70 |
| SH2 | 25.79 | 6.61 | ||
| SH3 | 25.13 | 6.44 | ||
| SH4 | 22.90 | 5.87 | ||
| SM | 22.55 | SM1 | 22.30 | 5.03 |
| SM2 | 23.87 | 5.38 | ||
| SM3 | 30.66 | 6.91 | ||
| SM4 | 23.17 | 5.22 | ||
| CM | 22.35 | CM1 | 28.00 | 6.26 |
| CM2 | 20.53 | 4.59 | ||
| CM3 | 24.30 | 5.43 | ||
| CM4 | 27.19 | 6.08 |
Note: The boldfaced numbers represent the RFs with higher weights.
Table 8.
The results of traditional risk matrix.
| Risk Factors | Consequence Weights (%) | Likelihood Weights (%) | RVs (%) | Risk Level |
|---|---|---|---|---|
| CF2 | 8.81 | 9.95 | 13.57 | E |
| CF3 | 8.43 | 8.80 | 11.48 | |
| SM3 | 6.91 | 8.80 | 9.42 | H |
| CF1 | 7.18 | 7.55 | 8.38 | |
| SM2 | 5.38 | 7.35 | 6.13 | M |
| CM1 | 6.26 | 6.18 | 5.99 | |
| SH3 | 6.44 | 5.47 | 5.45 | |
| SM4 | 5.22 | 6.72 | 5.43 | |
| SH2 | 6.61 | 4.98 | 5.09 | |
| CF4 | 5.06 | 6.23 | 4.87 | |
| SH4 | 5.87 | 5.32 | 4.83 | |
| SM1 | 5.03 | 5.78 | 4.50 | L |
| CM3 | 5.43 | 4.96 | 4.17 | |
| SH1 | 6.70 | 3.83 | 3.98 | |
| CM2 | 4.59 | 3.77 | 2.68 | |
| CM4 | 6.08 | 4.31 | 4.05 |
Publisher’s Note: MDPI stays neutral with regard to jurisdictional claims in published maps and institutional affiliations. |
© 2022 by the authors. Licensee MDPI, Basel, Switzerland. This article is an open access article distributed under the terms and conditions of the Creative Commons Attribution (CC BY) license (https://creativecommons.org/licenses/by/4.0/).
Share and Cite
MDPI and ACS Style
Hsu, W.-K.K.; Chen, J.-W.; Huynh, N.T.; Lin, Y.-Y. Risk Assessment of Navigation Safety for Ferries. J. Mar. Sci. Eng. 2022, 10, 700. https://0-doi-org.brum.beds.ac.uk/10.3390/jmse10050700
AMA Style
Hsu W-KK, Chen J-W, Huynh NT, Lin Y-Y. Risk Assessment of Navigation Safety for Ferries. Journal of Marine Science and Engineering. 2022; 10(5):700. https://0-doi-org.brum.beds.ac.uk/10.3390/jmse10050700
Chicago/Turabian StyleHsu, Wen-Kai K., Jun-Wen Chen, Nguyen Tan Huynh, and Yan-You Lin. 2022. "Risk Assessment of Navigation Safety for Ferries" Journal of Marine Science and Engineering 10, no. 5: 700. https://0-doi-org.brum.beds.ac.uk/10.3390/jmse10050700
Note that from the first issue of 2016, this journal uses article numbers instead of page numbers. See further details here.