
Investigation of Barrier Island Highway and Marsh Vulnerability to Bay-Side Flooding and Erosion

 ,
,  , ,
, ,
Abstract
:1. Introduction
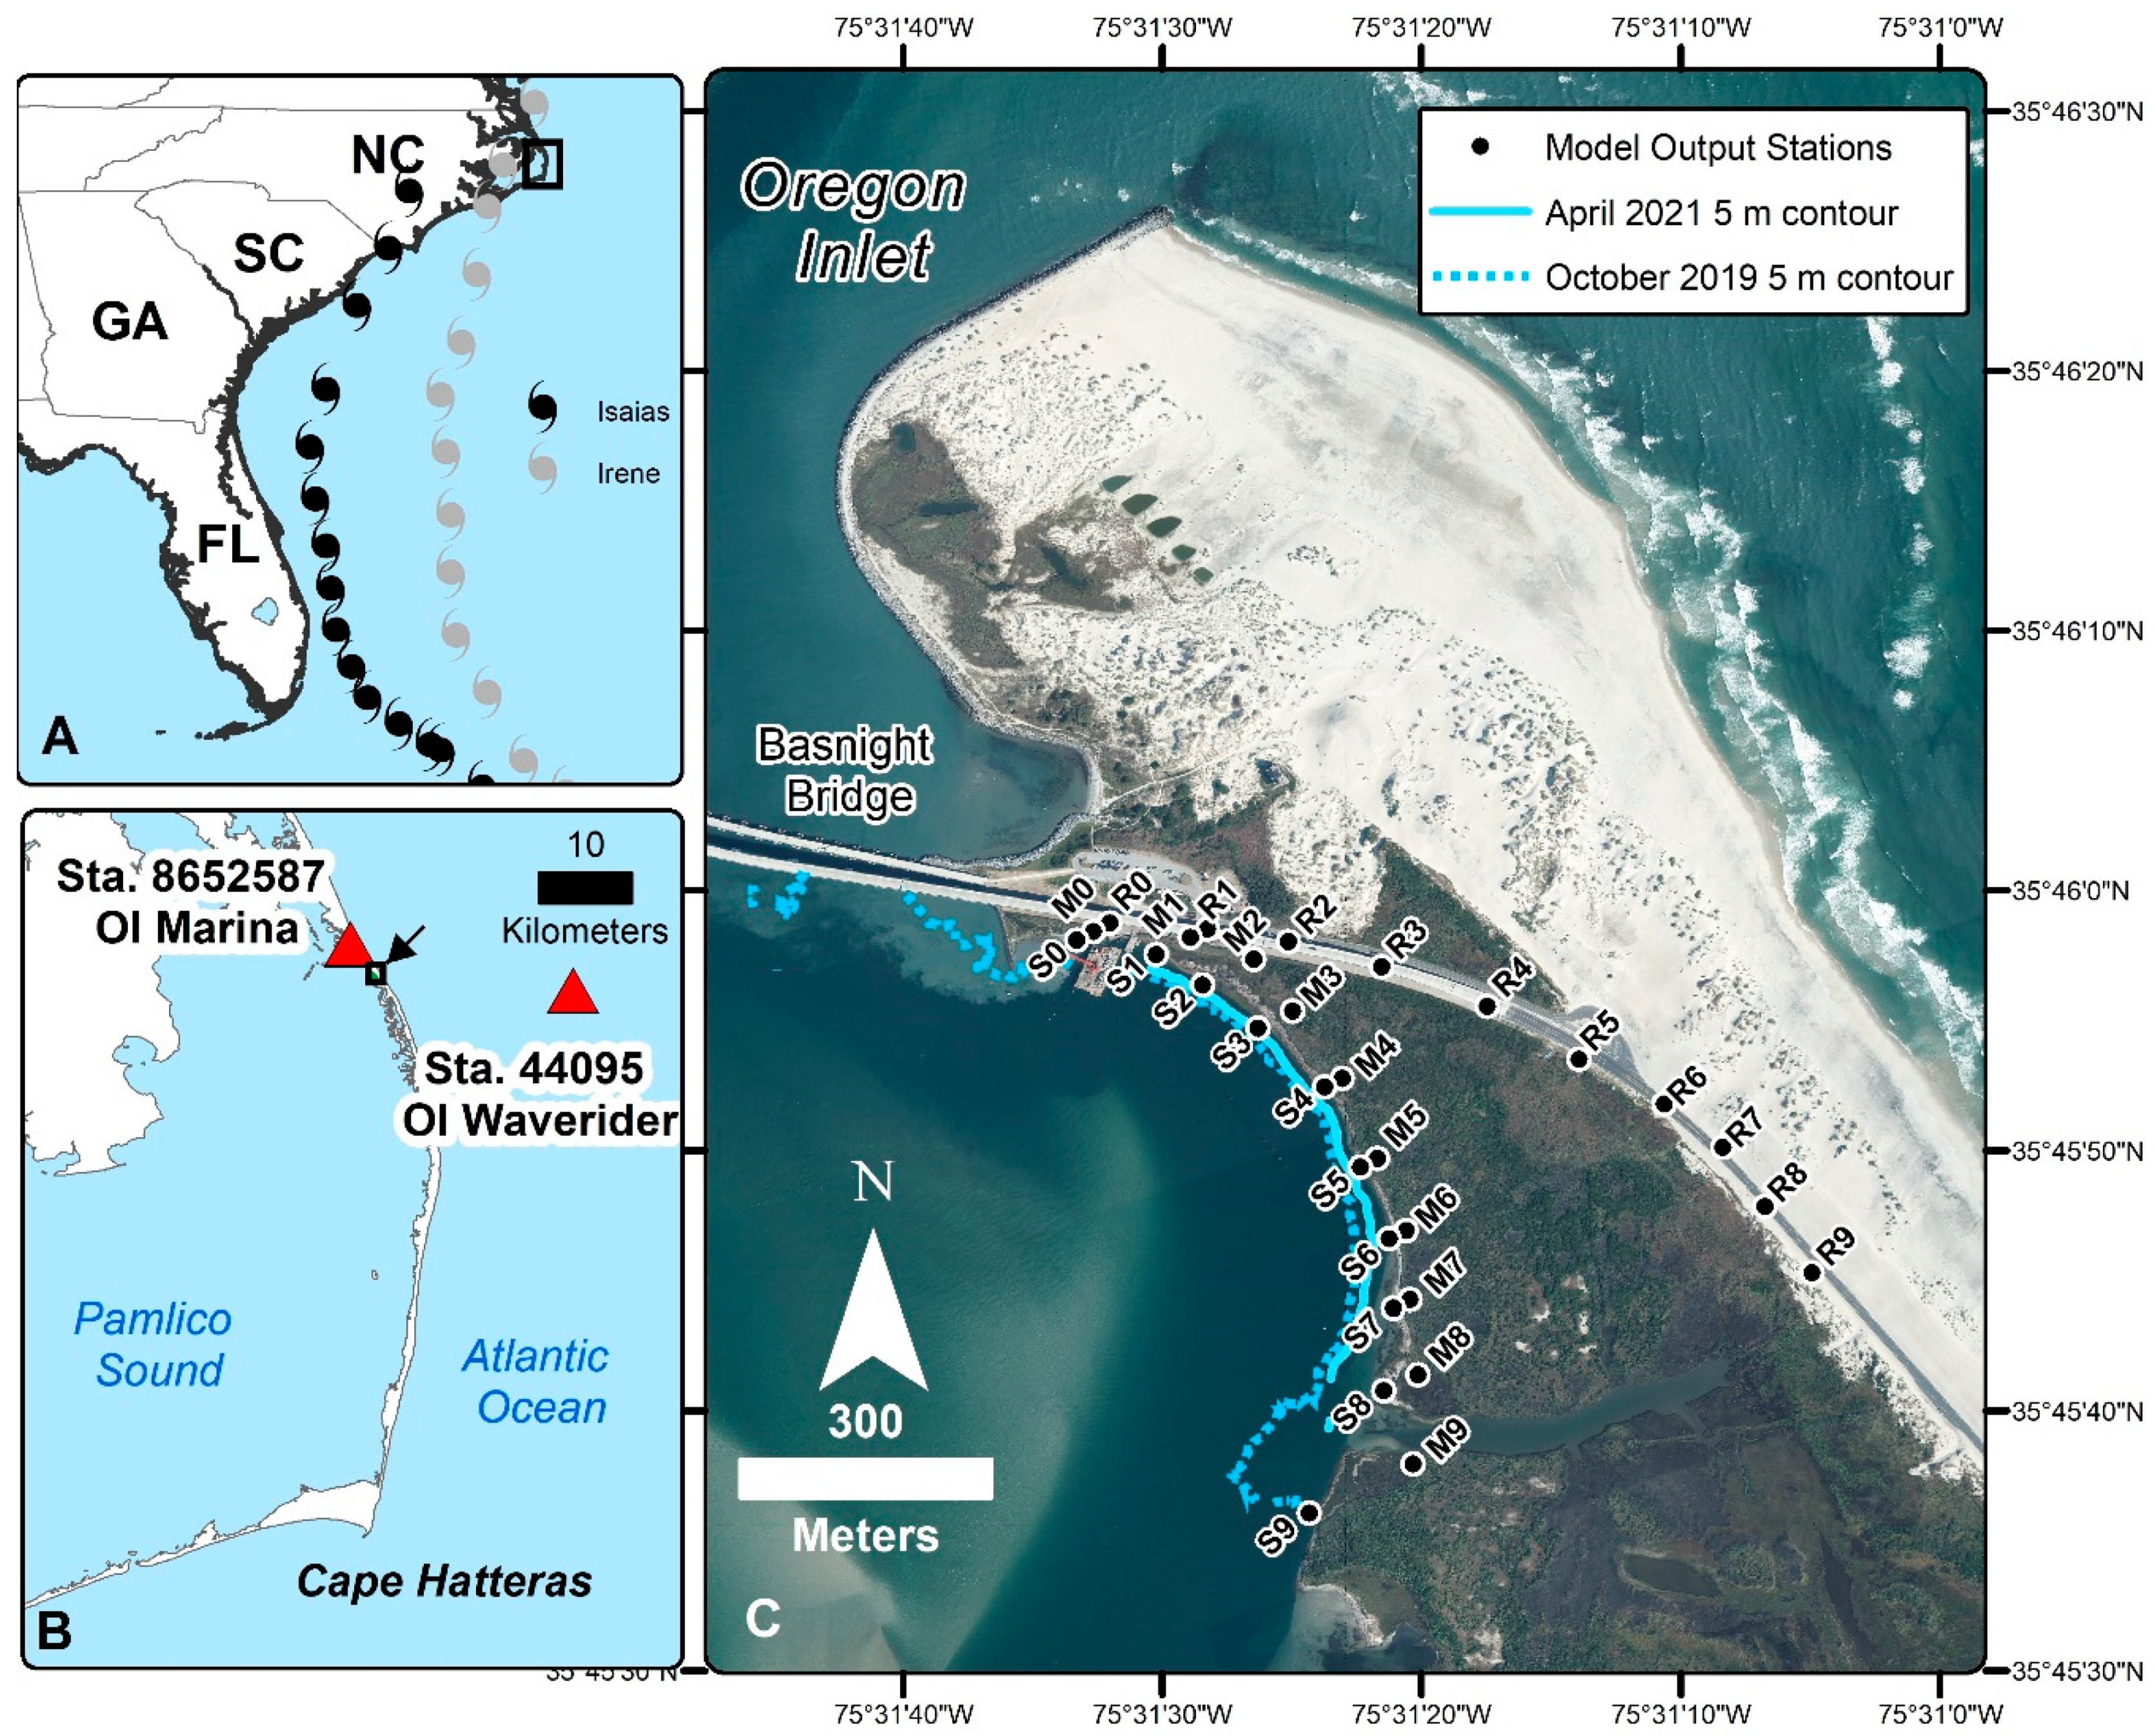
2. Study Site
3. Methods
3.1. NCDOT Traveler Information Management System Roadway Closure Analysis
3.2. Numerical Model and Description of Storm Scenarios
3.3. Shoreline Change Analysis
3.4. Channel Bathymetry Comparison
3.5. Empirical Fragility Derivation
4. Results
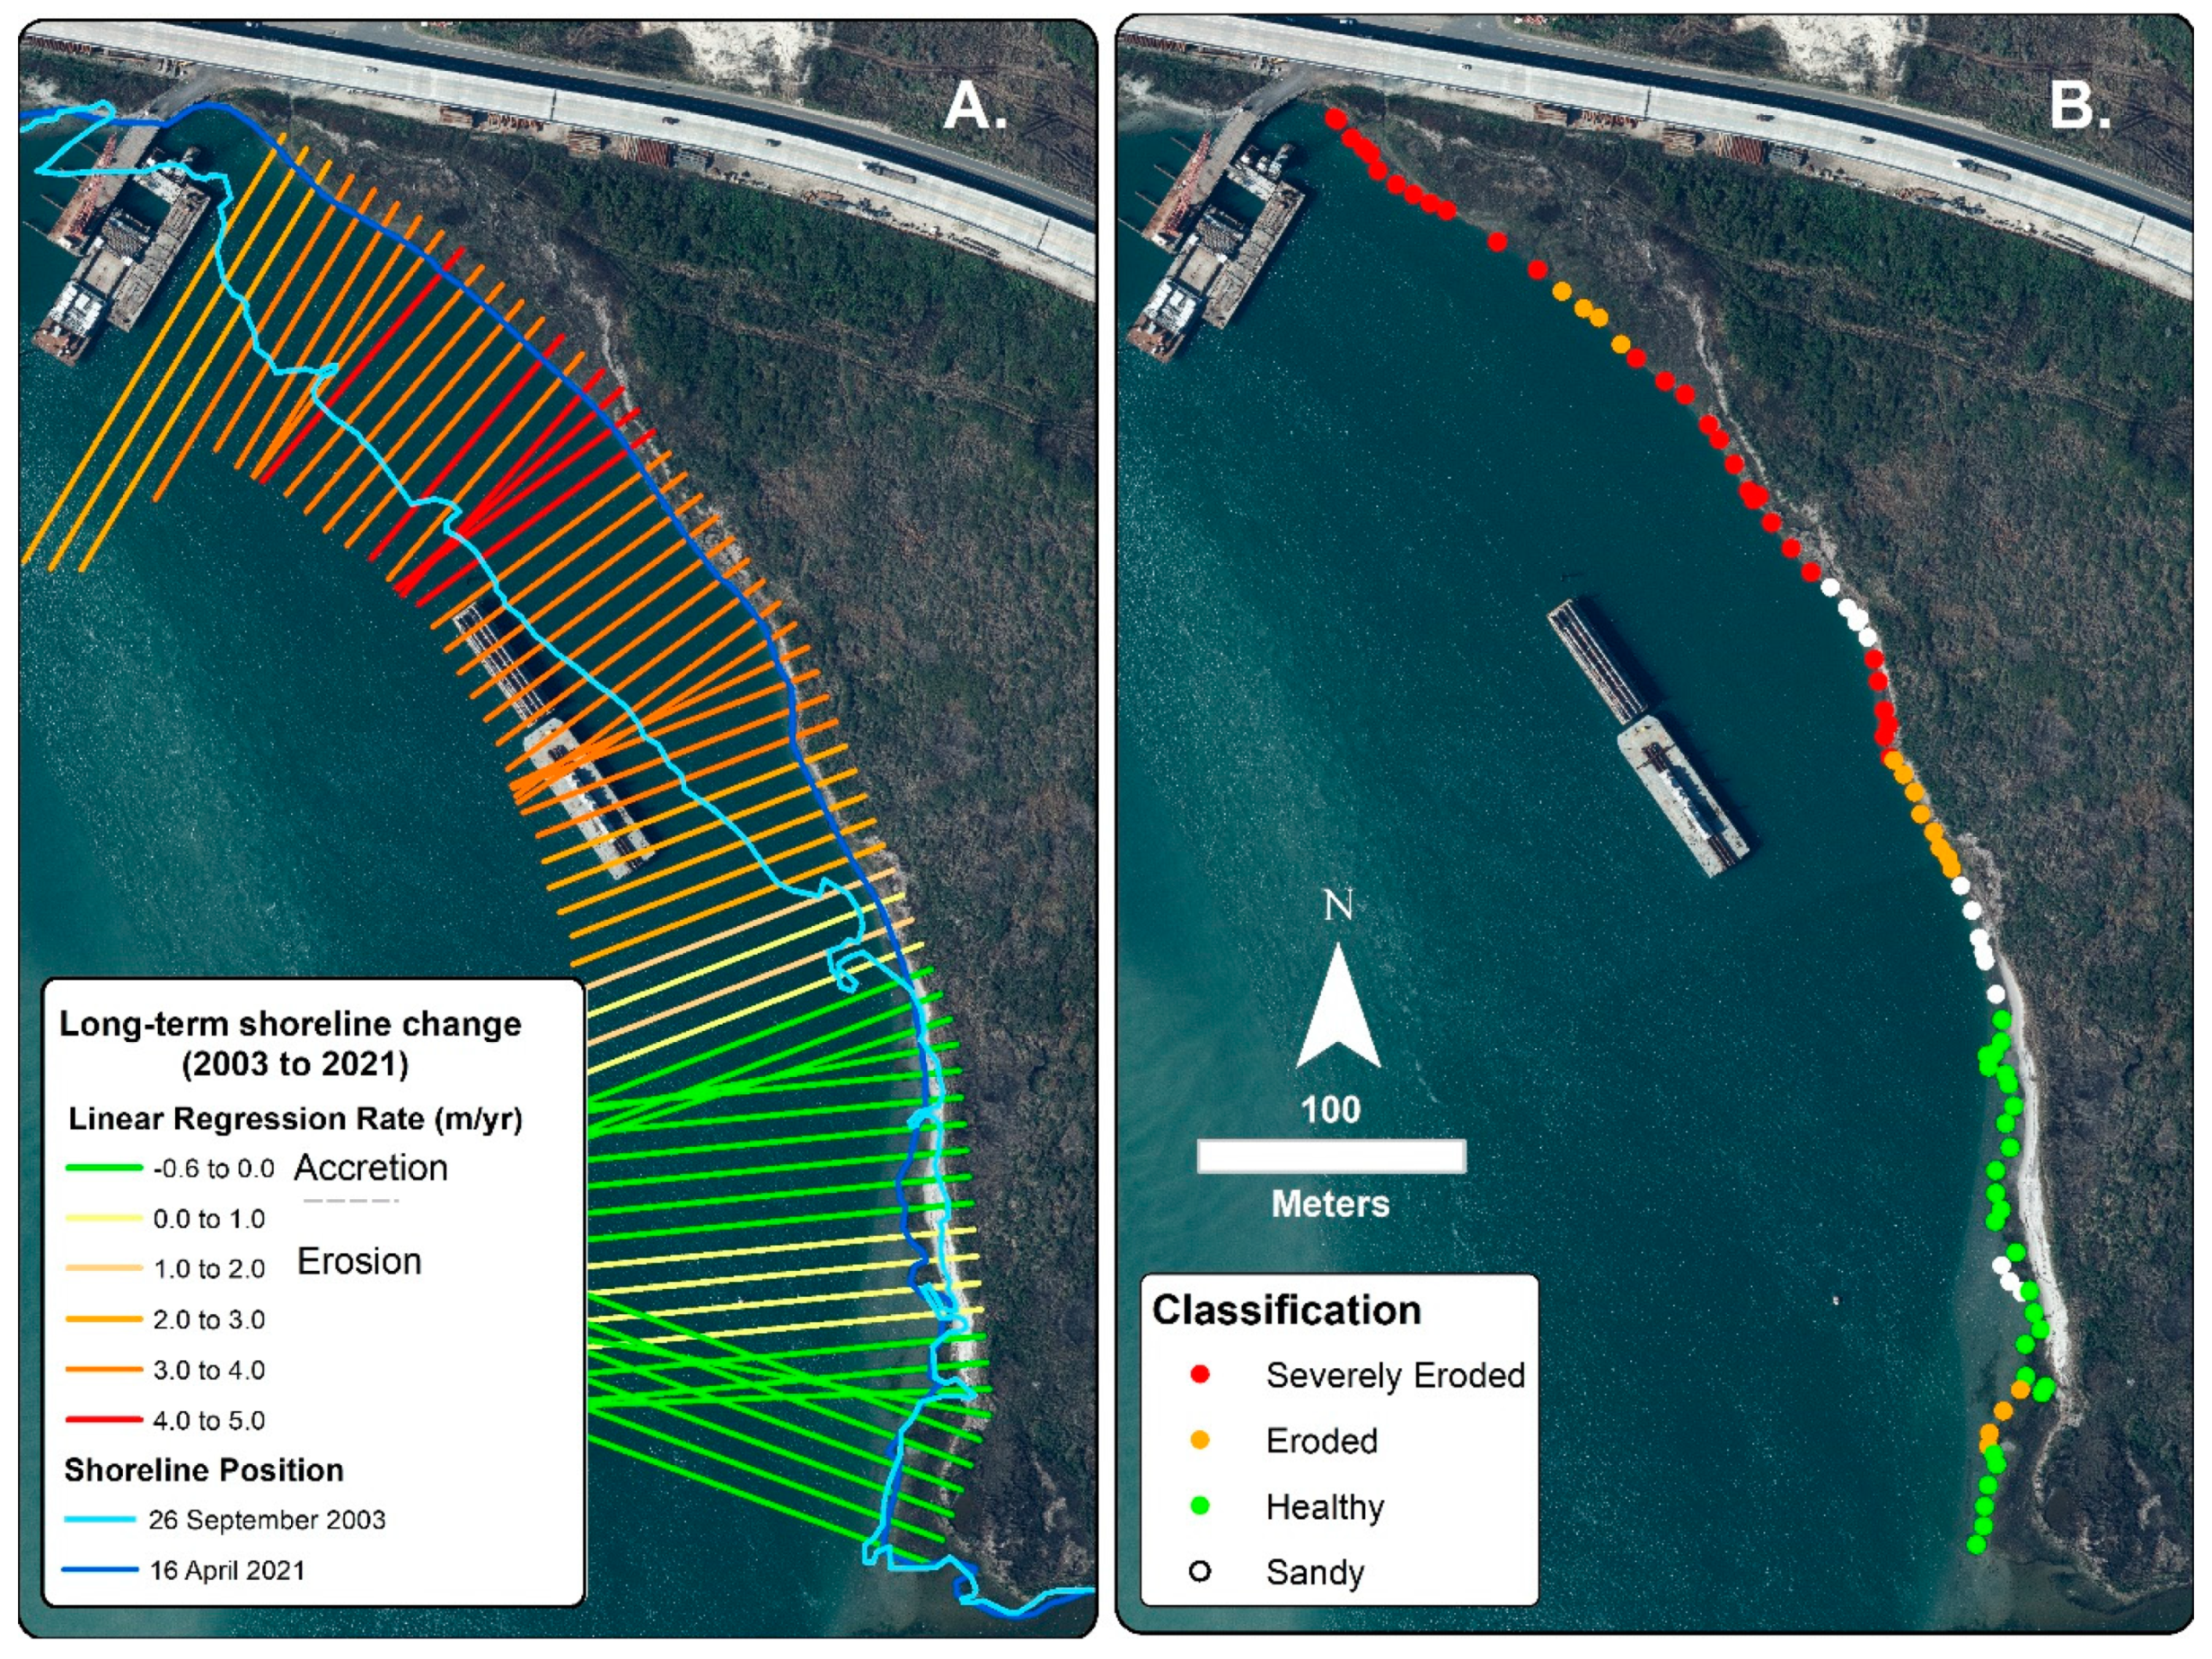
4.1. Long-and Short-Term Shoreline Changes
4.2. Marsh and Roadway Flooding due to Storm Scenarios
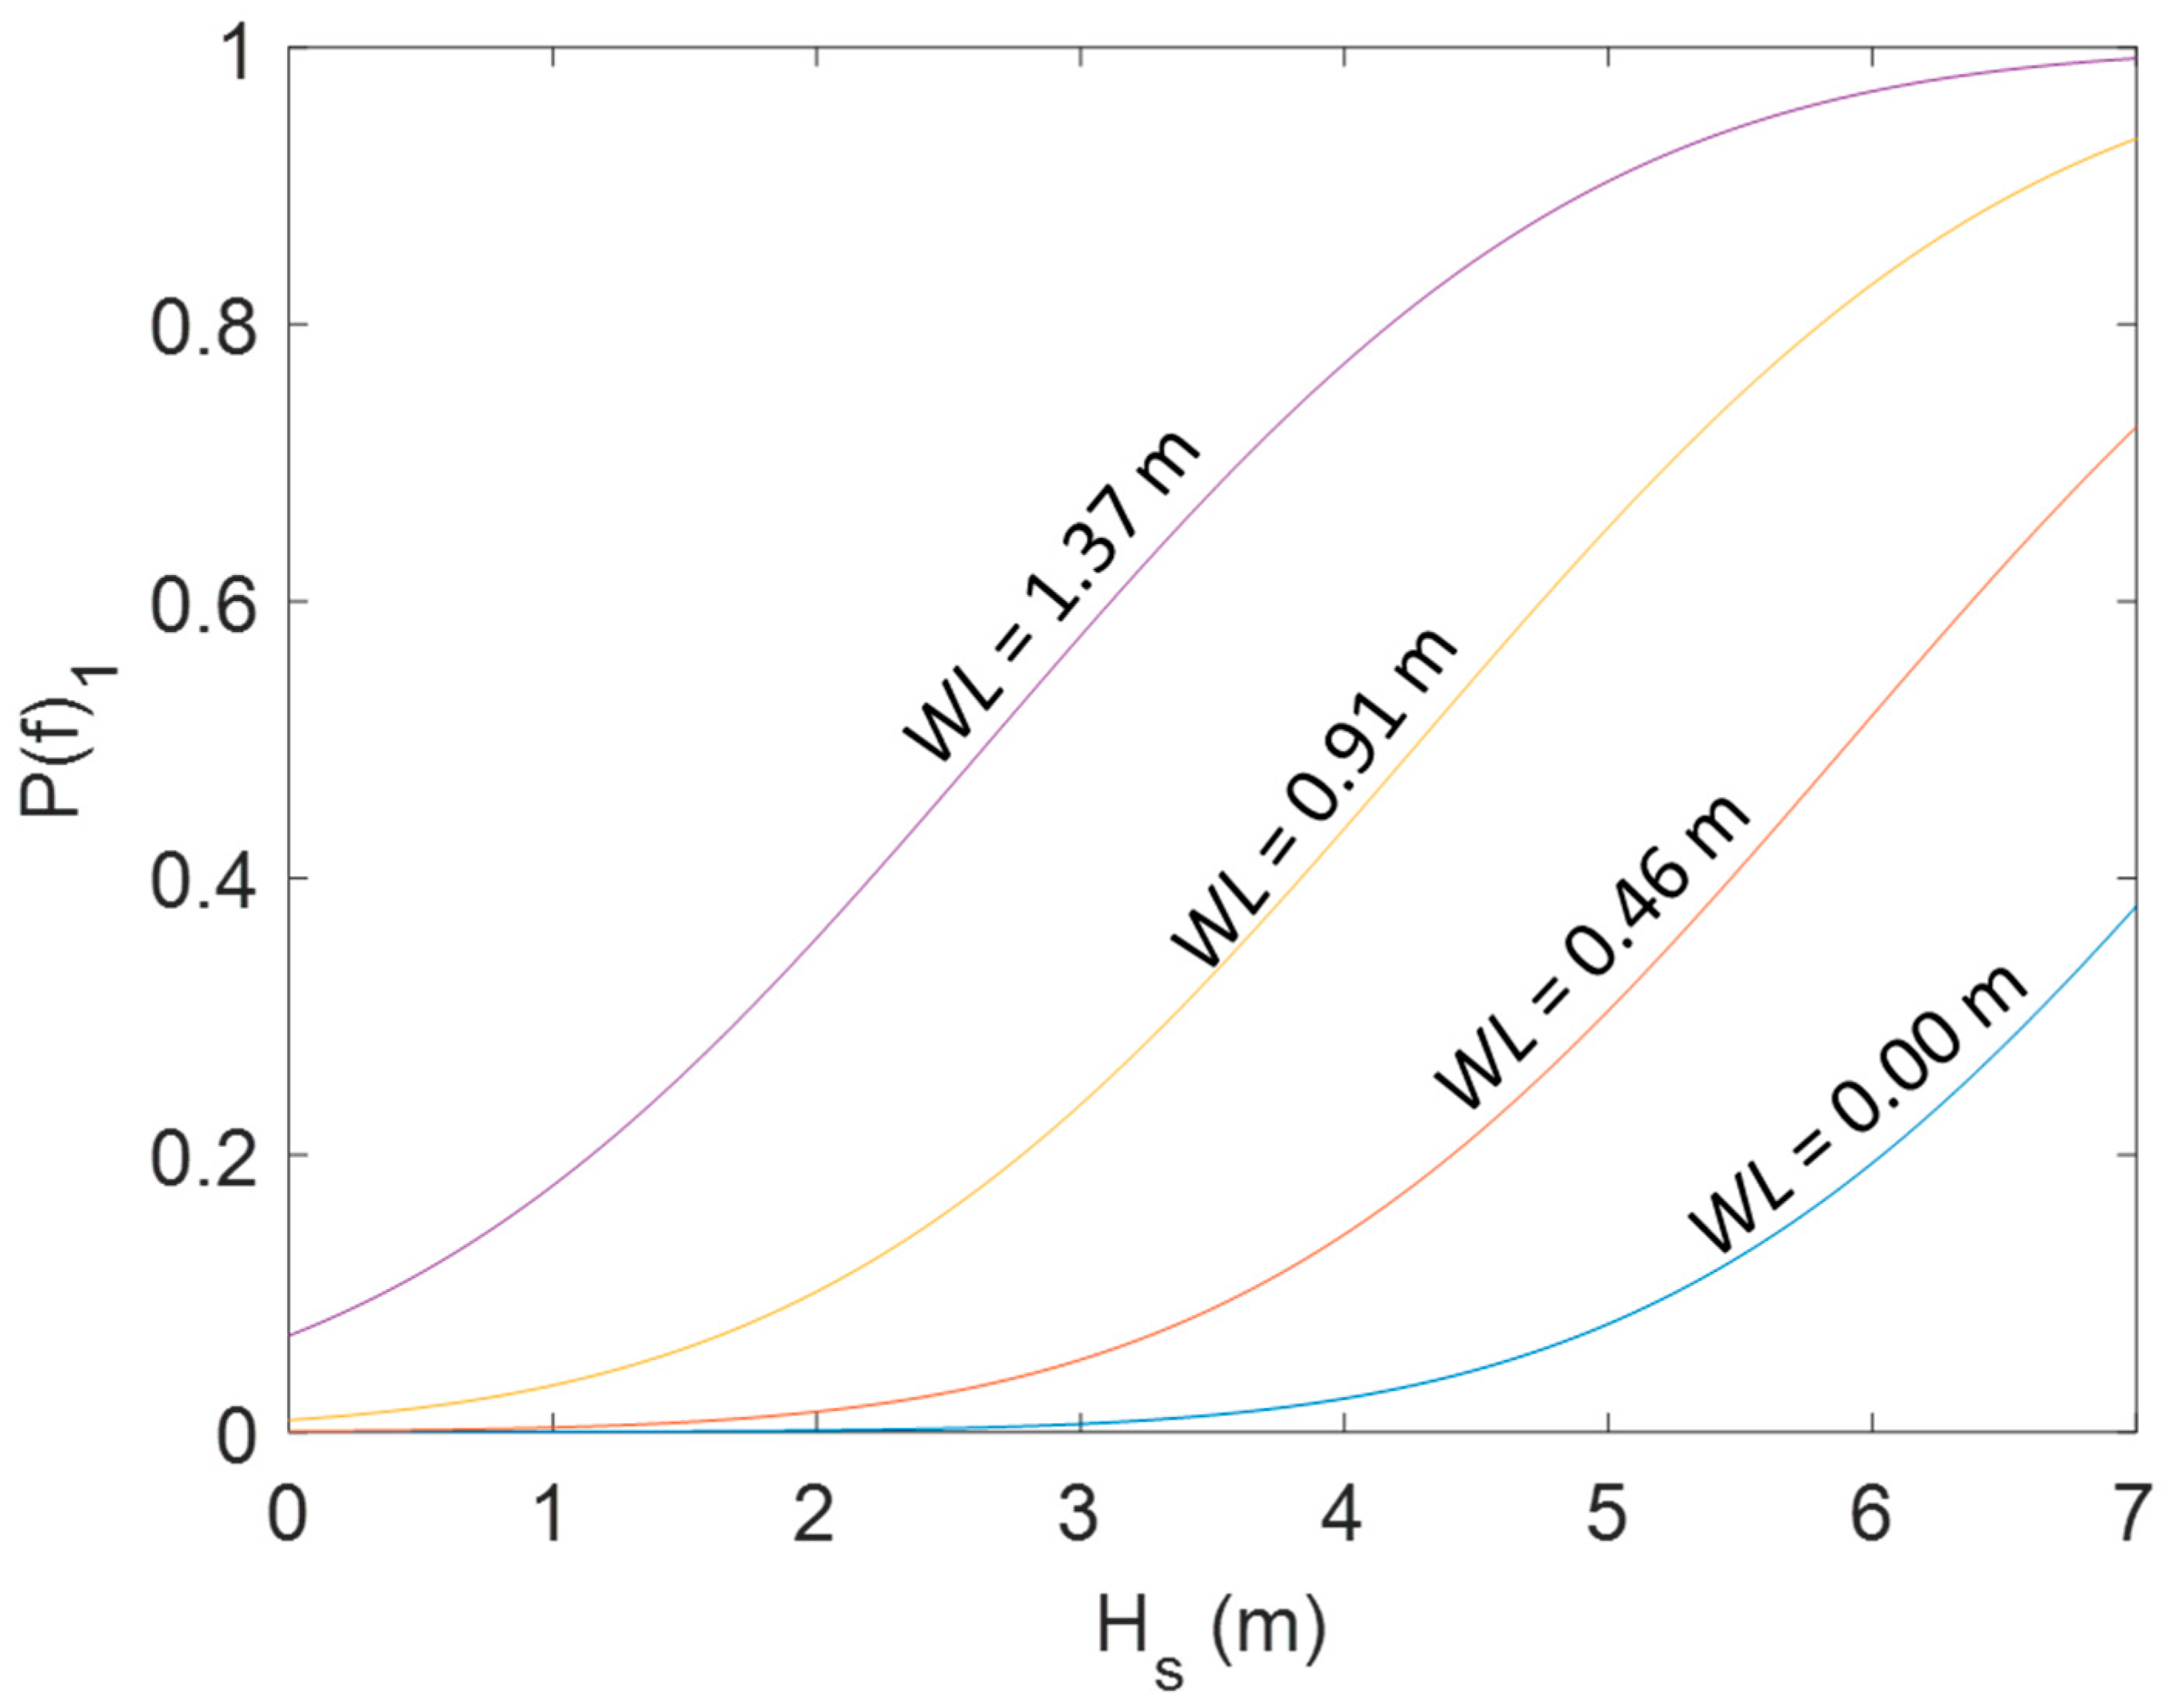
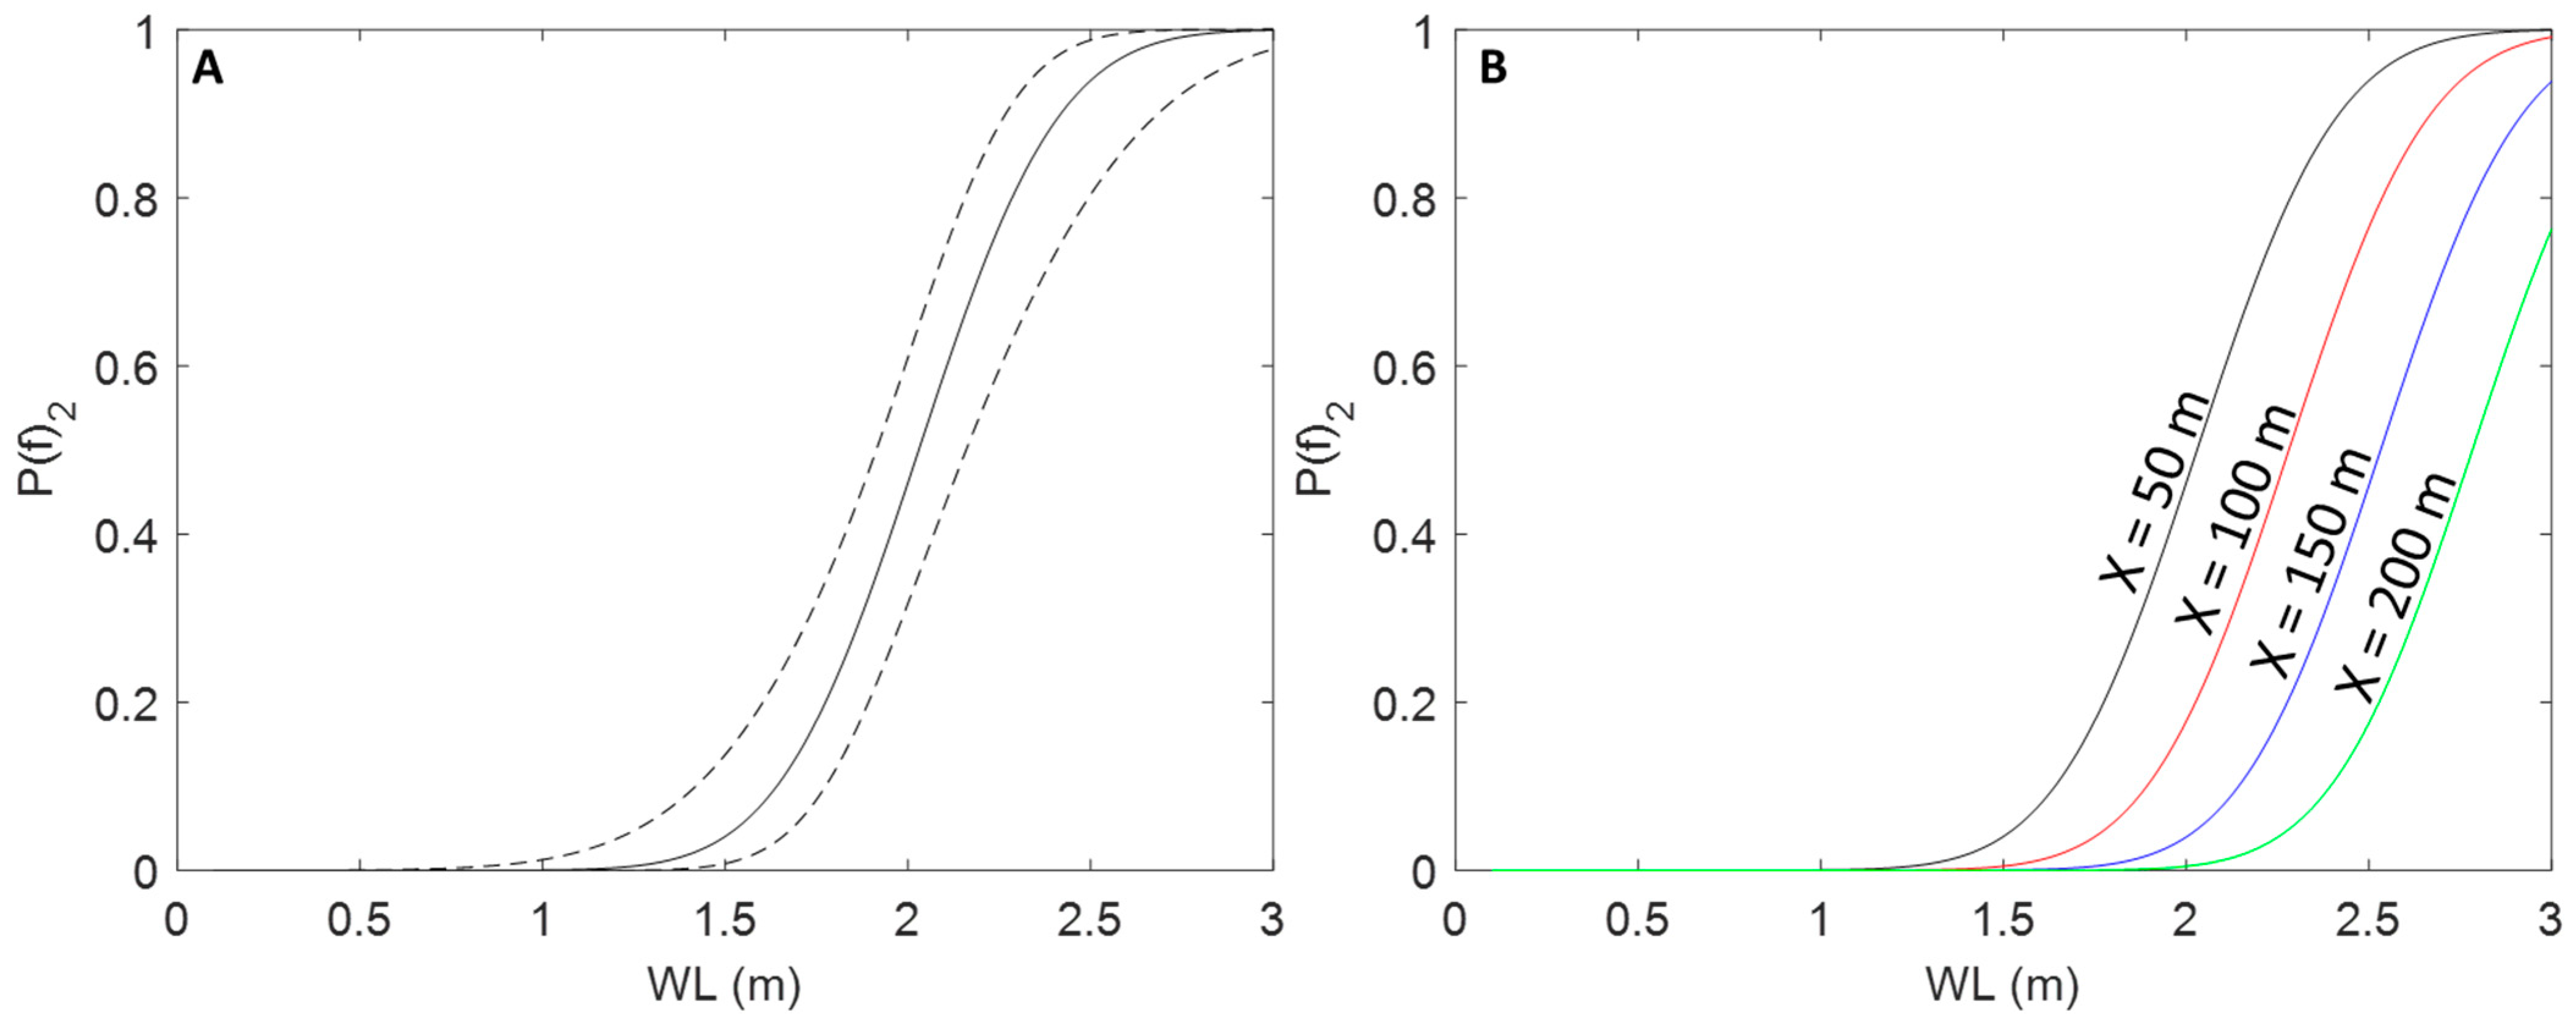
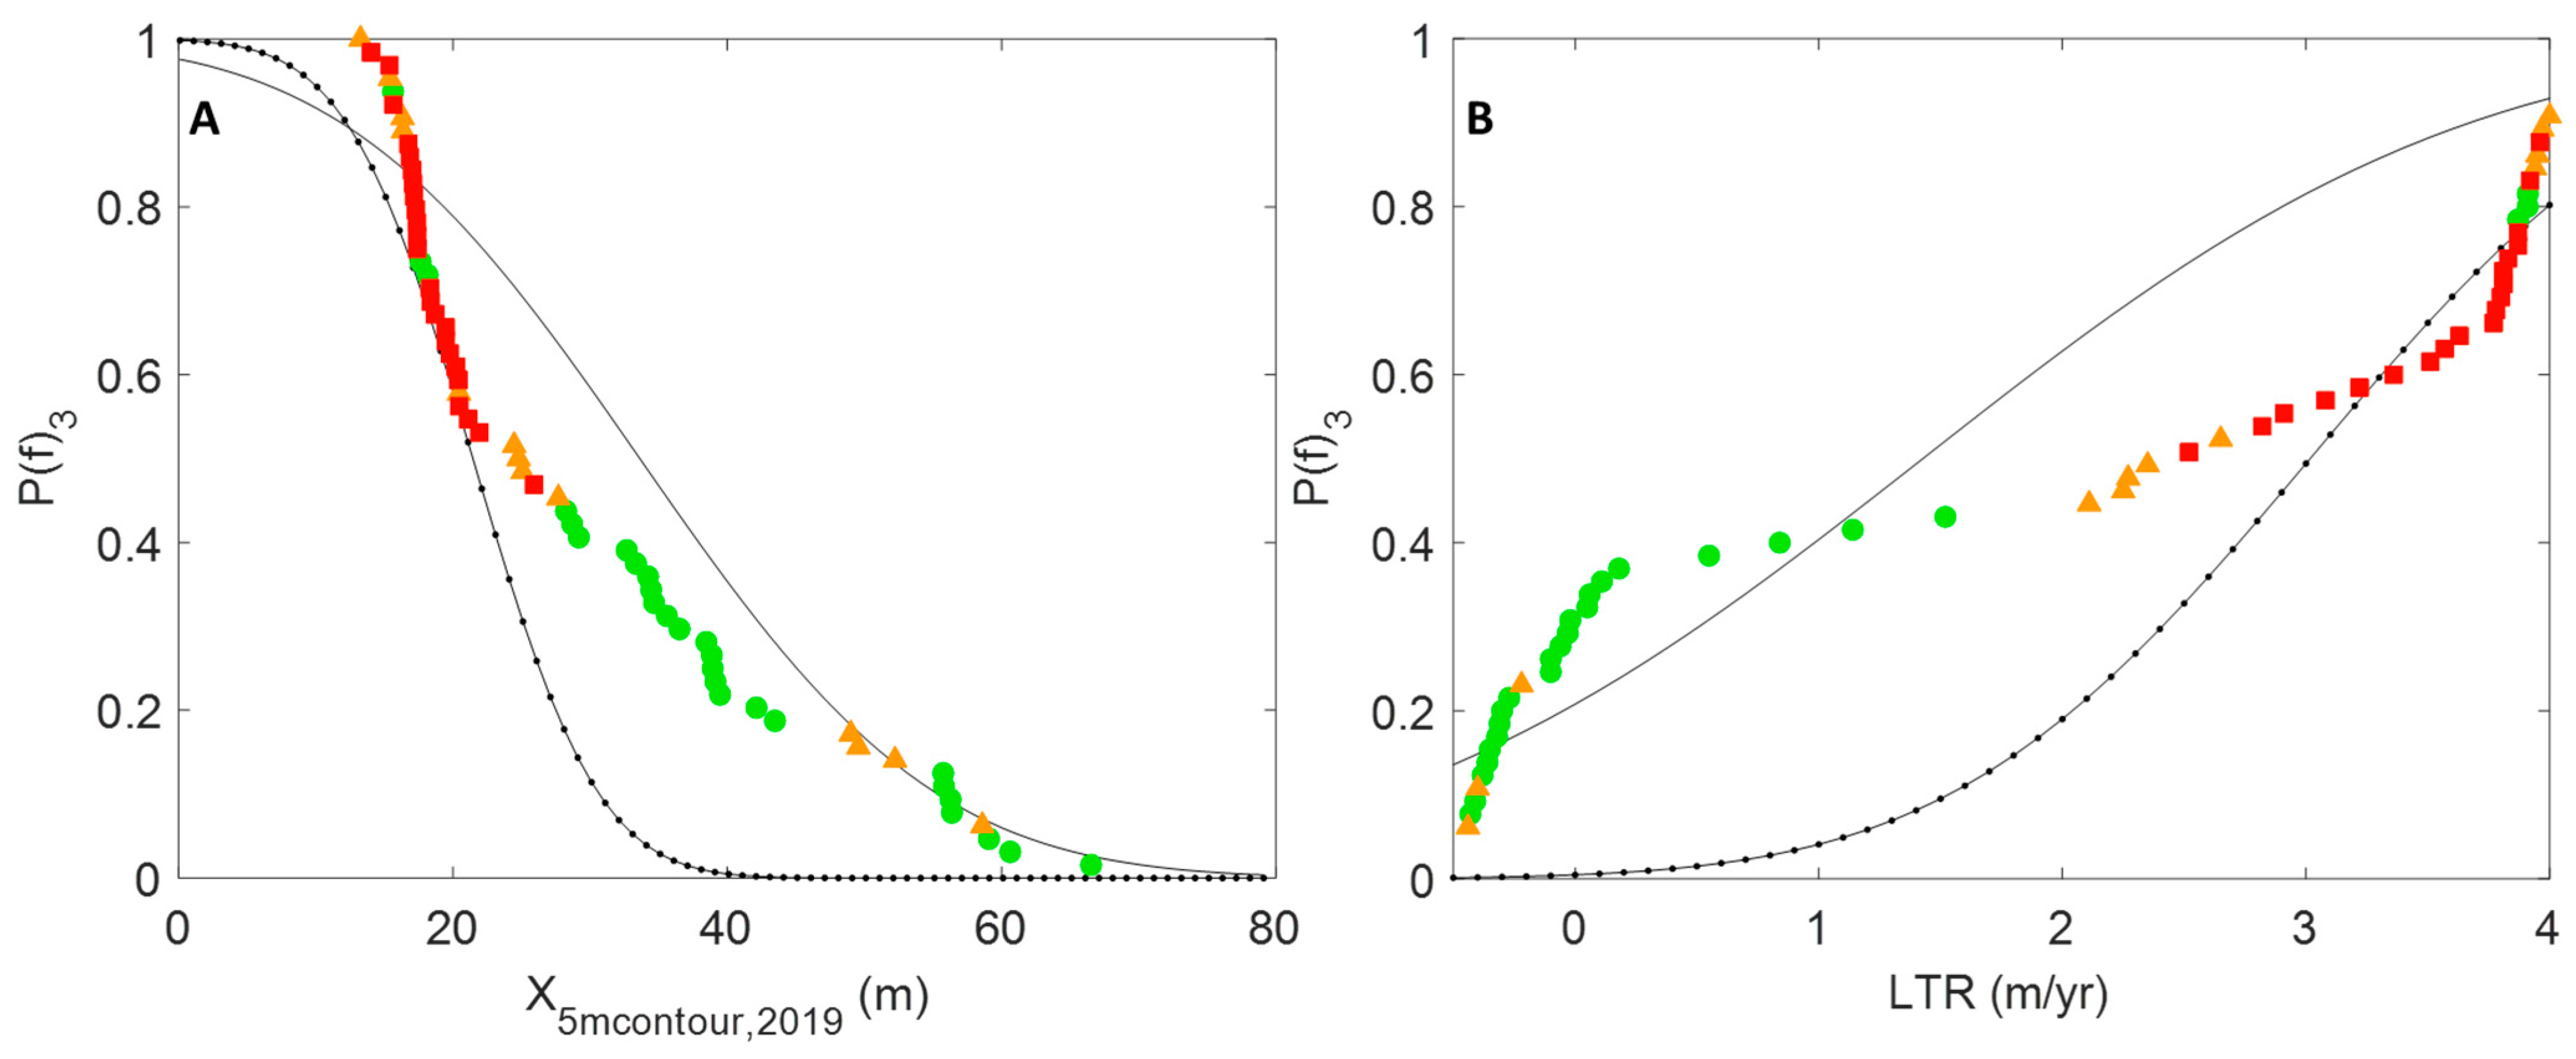
4.3. Fragility Curves
5. Discussion and Conclusions
5.1. Implications for Planning
5.2. Study Considerations
5.3. Study Contributions
Author Contributions
Funding
Institutional Review Board Statement
Informed Consent Statement
Data Availability Statement
Acknowledgments
Conflicts of Interest
References
- Schwartz, H.G.; Meyer, M.; Burbank, C.J.; Kuby, M.; Oster, C.; Posey, J.; Russo, E.J.; Rypinski, A. Ch. 5: Transportation. Climate Change Impacts in the United States: The Third National Climate Assessment; Melillo, J.M., Richmond, T.C., Yohe, G.W., Eds.; U.S. Global Change Research Program: Washington, DC, USA, 2014; pp. 130–149. [CrossRef]
- Padgett, J.E.; Spiller, A.; Arnold, C. Statistical analysis of coastal bridge vulnerability based on empirical evidence from Hurricane Katrina. Struct. Infrastruct. Eng. 2012, 8, 595–605. [Google Scholar] [CrossRef]
- Kameshwar, S.; Padgett, J.E. Multi-hazard risk assessment of highway bridges subjected to earthquake and hurricane hazards. Eng. Struct. 2014, 78, 154–166. [Google Scholar] [CrossRef]
- Anarde, K.A.; Kameshwar, S.; Irza, J.N.; Nittrouer, J.A.; Lorenzo-Trueba, J.; Padgett, J.E.; Sebastian, A.; Bedient, P.B. Impacts of Hurricane Storm Surge on Infrastructure Vulnerability for an Evolving Coastal Landscape. Nat. Hazards Rev. 2018, 19, 04017020. [Google Scholar] [CrossRef] [Green Version]
- Argyroudis, S.A.; Mitoulis, S.A. Vulnerability of bridges to individual and multiple hazards-floods and earthquakes. Reliab. Eng. Syst. Saf. 2021, 210, 107564. [Google Scholar] [CrossRef]
- Ataei, N.; Padgett, J.E. Probabilistic modeling of bridge deck unseating during hurricane events. J. Bridge Eng. 2013, 18, 275–286. [Google Scholar] [CrossRef]
- Gidaris, I.; Padgett, J.E.; Barbosa, A.R.; Chen, S.; Cox, D.; Webb, B.; Cerato, A. Multiple-hazard fragility and restoration models of highway bridges for regional risk and resilience assessment in the United States: State-of-the-art review. J. Struct. Eng. 2017, 143, 04016188. [Google Scholar] [CrossRef]
- Khandel, O.; Soliman, M. Integrated framework for assessment of time-variant flood fragility of bridges using deep learning neural networks. J. Infrastruct. Syst. 2021, 27, 04020045. [Google Scholar] [CrossRef]
- Li, Y.; Dong, Y.; Frangopol, D.M.; Gautam, D. Long-term resilience and loss assessment of highway bridges under multiple natural hazards. Struct. Infrastruct. Eng. 2020, 16, 626–641. [Google Scholar] [CrossRef]
- Wang, W.; Yang, S.; Stanley, H.E.; Gao, J. Local floods induce large-scale abrupt failures of road networks. Nat. Commun. 2019, 10, 2114. [Google Scholar] [CrossRef]
- Nasrallah, R.L. Forecasting Storm Impacts on a Coastal Highway Using Remote Sensing and Numerical Modeling. Master’s Thesis, North Carolina State University, Raleigh, NC, USA, 2020. Available online: https://www.lib.ncsu.edu/resolver/1840.20/38121 (accessed on 1 April 2022).
- Fereshtehnejad, E.; Gidaris, I.; Rosenheim, N.; Tomiczek, T.; Padgett, J.E.; Cox, D.T.; van Zandt, S.; Peacock, W.G. Probabilistic risk assessment of coupled natural-physical-social systems: Cascading impact of hurricane-induced damages to civil infrastructure in Galveston, Texas. Nat. Hazards Rev. 2021, 22, 04021013. [Google Scholar] [CrossRef]
- Velásquez-Montoya, L.; Sciaudone, E.J.; Smyre, E.; Overton, M.F. Vulnerability indicators for coastal roadways based on barrier island morphology and shoreline change predictions. Nat. Hazards Rev. 2021, 22, 04021003. [Google Scholar] [CrossRef]
- Velásquez-Montoya, L.; Wargula, A.; Torres, J.; Sciaudone, E.J.; Tomiczek, T.; Smyre, E. Modeling the Hydrodynamics of a Tidal inlet during Storms. Coastal Dynamics Proceedings 2021. Available online: https://coastaldynamics2017.dk/onewebmedia/055_VelasquezMontoya_Liliana.pdf (accessed on 14 April 2022).
- Chen, Q.; Wang, L.; Zhao, H.; Douglass, S.L. Prediction of storm surges and wind waves on coastal highways in hurricane-prone areas. J. Coast. Res. 2007, 23, 1304–1317. [Google Scholar] [CrossRef]
- Tsubaki, R.; Bricker, J.D.; Ichii, K.; Kawahara, Y. Development of fragility curves for railway embankment and ballast scour due to overtopping flood flow. Nat. Hazards Earth Syst. Sci. 2016, 16, 2455–2472. [Google Scholar] [CrossRef] [Green Version]
- Shen, S.; Feng, X.; Peng, Z.R. A framework to analyze vulnerability of critical infrastructure to climate change: The case of a coastal community in Florida. Nat. Hazards 2016, 84, 589–609. [Google Scholar] [CrossRef]
- Behr, A.; Berglund, E.; Sciaudone, E. Effectiveness of indicators for assessing the vulnerability of barrier island highways. Transp. Res. Part D 2022, 105, 103234. [Google Scholar] [CrossRef]
- Gedan, K.B.; Silliman, B.R.; Bertness, M.D. Centuries of human-driven change in salt marsh ecosystems. Annu. Rev. Mar. Sci. 2009, 1, 117–141. [Google Scholar] [CrossRef] [Green Version]
- Kirwan, M.L.; Megonigal, J.P. Tidal wetland stability in the face of human impacts and sea-level rise. Nature 2013, 504, 53–60. [Google Scholar] [CrossRef]
- Mariotti, G.; Fagherazzi, S. Critical width of tidal flats triggers marsh collapse in the absence of sea-level rise. Proc. Natl. Acad. Sci. USA 2013, 110, 5353–5356. [Google Scholar] [CrossRef] [Green Version]
- Passeri, D.L.; Hagen, S.C.; Medeiros, S.C.; Bilskie, M.V.; Alizad, K.; Wang, D. The dynamic effects of sea level rise on low-gradient coastal landscapes: A review. Earths Future 2015, 3, 159–181. [Google Scholar] [CrossRef]
- Schepers, L.; Kirwan, M.L.; Guntenspergen, G.R.; Temmerman, S. Evaluating indicators of marsh vulnerability to sea level rise along a historical marsh loss gradient. Earth Surf. Process. Landforms 2020, 45, 2107–2117. [Google Scholar] [CrossRef]
- Horton, B.P.; Shennan, I.; Bradley, S.L.; Cahill, N.; Kirwan, M.; Kopp, R.E.; Shaw, T.A. Predicting marsh vulnerability to sea-level rise using Holocene relative sea-level data. Nat. Commun. 2018, 9, 2687. [Google Scholar] [CrossRef] [PubMed]
- Leonardi, N.; Carnacina, I.; Donatelli, C.; Ganju, N.K.; Plater, A.J.; Schuerch, M.; Temmerman, S. Dynamic interactions between coastal storms and salt marshes: A review. Geomorphology 2018, 301, 92–107. [Google Scholar] [CrossRef] [Green Version]
- Leonardi, N.; Fagherazzi, S. Effect of local variability in erosional resistance on large-scale morphodynamic response of salt marshes to wind waves and extreme events. Geophys. Res. Lett. 2015, 42, 5872–5879. [Google Scholar] [CrossRef] [Green Version]
- Ganju, N.K.; Defne, Z.; Kirwin, M.L.; Fagherazzi, S.; D’Alpaos, A.; Carniello, L. Spatially integrative metrics reveal hidden vulnerabiltiy of microtidal salt marshes. Nat. Commun. 2017, 8, 14156. [Google Scholar] [CrossRef] [Green Version]
- Farris, A.S.; Defne, Z.; Ganju, N.K. Identifying Salt Marsh Shorelines from Remotely Sensed Elevation Data and Imagery. Remote Sens. 2019, 11, 1795. [Google Scholar] [CrossRef] [Green Version]
- Bendoni, M.; Mel, R.; Solari, L.; Lanzoni, S.; Francalanci, S.; Oumeraci, H. Insights into lateral marsh retreat mechanism through localized field measurements. Water Resour. Res. 2016, 52, 1446–1464. [Google Scholar] [CrossRef] [Green Version]
- Gittman, R.K.; Popowich, A.M.; Bruno, J.F.; Peterson, C.H. Marshes with and without sills protect estuarine shorelines from erosion better than bulkheads during a Category 1 hurricane. Ocean. Coast. Manag. 2014, 102, 94–102. [Google Scholar] [CrossRef]
- Kalra, T.S.; Ganju, N.K.; Aretxabaleta, A.L.; Carr, J.A.; Defne, Z.; Moriarty, J.M. Modeling Marsh Dynamics Using a 3-D Coupled Wave-Flow-Sediment Model. Front. Mar. Sci. 2021, 8, 740921. [Google Scholar] [CrossRef]
- FHWA (Federal Highway Administration); NCDOT (North Carolina Department of Transportation). Final Environmental Impact Statement and Section 4(f) Evaluation; NC 12 Replacement of Herbert C. Bonner Bridge (Bridge No. 11) over Oregon Inlet; FHWA: Dare County, NC, USA, 2008; Volume 1.
- Overton, M.F.; Fisher, J.S.; Dennis, W.A.; Miller, H.C. Shoreline change at Oregon Inlet terminal groin. In Proceedings International Conference on Coastal Engineering; ASCE: Reston, VA, USA, 1992; pp. 2332–2343. [Google Scholar]
- Sciaudone, E.J.; Overton, M. Coastal Monitoring Program, NC 12 Transportation Management Plan, TIP Project B-2500 2020 Update Report; North Carolina Department of Transportation: Raleigh, NC, USA, 2021; p. 291.
- U.S. Census Bureau. QuickFacts: Dare County, North Carolina. 2021. Available online: https://www.census.gov/quickfacts/fact/table/darecountynorthcarolina/PST045221 (accessed on 14 April 2022).
- County of Dare, North Carolina. ND. About Dare County, North Carolina. Available online: https://www.darenc.com/about (accessed on 14 April 2022).
- Overton, M.F.; Fisher, J.S. Hurricane Isabel and NC12 hotspots. Shore Beach 2004, 72, 30–35. [Google Scholar]
- Dunn, M.; Sciaudone, E.; Velásquez-Montoya, L. Estuarine shoreline erosion driven by flood channel proximity at Pea Island, NC. In Proceedings of the ASBPA National Coastal Conference, Myrtle Beach, SC, USA, 22–25 October 2019. [Google Scholar]
- Velásquez-Montoya, L. Morphological evolution of a stabilized tidal inlet and implications for coastal infrastructure vulnerability. In Proceedings of the Virtual Conference on Coastal Engineering, Virtual, 6–9 October 2020. [Google Scholar]
- Mulligan, R.P.; Walsh, J.P.; Wadman, H.M. Storm surge and surface waves in a shallow lagoonal estuary during the crossing of a hurricane. ASCE J. Waterw. Port Coast. Ocean. Eng. 2015, 141, A5014001. [Google Scholar] [CrossRef]
- National Oceanographic and Atmospheric Administration (NOAA). 2022. Available online: https://tidesandcurrents.noaa.gov/sltrends/sltrends_station.shtml?id=8652587 (accessed on 4 January 2022).
- Sweet, W.V.; Hamlington, B.D.; Kopp, R.E.; Weaver, C.P.; Barnard, P.L.; Bekaert, D.; Brooks, W.; Craghan, M.; Dusek, G.; Frederikse, T.; et al. Global and Regional Sea Level Rise Scenarios for the United States: Updated Mean Projections and Extreme Water Level Probabilities Along U.S. Coastlines; NOAA Technical Report NOS 01; National Oceanic and Atmospheric Administration: Washington, DC, USA; National Ocean Service: Silver Spring, MD, USA, 2022. Available online: https://oceanservice.noaa.gov/hazards/sealevelrise/noaa-nos-techrpt01-global-regional-SLR-scenarios-US.pdf (accessed on 14 April 2022).
- Khattak, A.J.; Pan, X.; Williams, B.; Rouphail, N.; Fan, Y. Traveler information delivery systems: Impact on consumer behavior. Transp. Res. Rec. 2008, 2069, 77–84. [Google Scholar] [CrossRef]
- Wargula, A.; Sciaudone, E.; Velásquez-Montoya, L.; Fawcett, K.; Amodeo, M.; Smyre, E.; Tomiczek, T. Marsh erosion processes near a coastal highway on the Outer Banks, NC. In Geo-Extreme 2021: Case Histories and Best Practices; ASCE: Savannah, Georgia, 2021. [Google Scholar]
- Lesser, G.R.; Roelvink, J.A.; van Kester, J.A.T.M.; Stelling, G.S. Development and validation of a three-dimensional morphological model. Coast. Eng. 2004, 51, 883–915. [Google Scholar] [CrossRef]
- Booij, N.; Ris, R.C.; Holthuijsen, L.H. A third-generation wave model for coastal regions. J. Geophys. Res. 1999, 104, 7649–7666. [Google Scholar] [CrossRef] [Green Version]
- Willmott, C.J. On the validation of models. Phys. Geogr. 1981, 2, 184–194. [Google Scholar] [CrossRef]
- Velásquez-Montoya, L.; Wargula, A.; Tomiczek, T.; Sciaudone, E.J.; Smyre, E. Modeling the hydrodynamics of a tidal inlet during bay-side storms. Estuar. Coast. Shelf Sci. 2022; submitted. [Google Scholar]
- Clinch, A.S.; Russ, E.R.; Oliver, R.C.; Mitasova, H.; Overton, M. Hurricane Irene and the Pea Island Breach: Pre-storm site characterization and storm surge estimation using geospatial technologies. Shore Beach 2012, 80, 10. [Google Scholar]
- Thieler, E.R.; Himmerlstoss, E.A.; Zichichi, J.L.; Ergul, A. The Digital Shoreline Analysis System (DSAS) Version 4.0—An ArcGIS Extension for Calculating Shoreline Change; U.S. Geological Survey: Reston, VA, USA, 2009.
- Cialone, M.; Elko, N.; Lillycrop, J.; Stockton, H.; Raubenheimer, B.; Rosati, J. During Nearshore Event Experiment (DUNEX): A collaborative community field data collection effort. In Proceedings of the 9th International Conference Coastal Sediments, Tampa/St. Petersburg, FL, USA, 27–31 May 2019. [Google Scholar] [CrossRef]
- Berman, J.W.; Wartman, J.; Olsen, M.; Irish, J.L.; Miles, S.B.; Tanner, T.; Gurley, K.; Lowes, L.; Bostrom, A.; Dafni, J.; et al. Natural hazards reconnaissance with the NHERI RAPID facility. Front. Built Environ. 2020, 11, 573067. [Google Scholar] [CrossRef]
- Over, J.R.; Sherwood, C.R.; Traykovski, P.A.; Olson, A.; Randall, N.; Bales, R.; Brosnahan, S. Bathymetric data in Pea Island National Wildlife Refuge, North Carolina in November 2020 and April, September, and October 2021 in DUNEX topographic, bathymetric, and supporting GPS data collected in Pea Island National Wildlife Refuge, North Carolina 2020–2021. U.S. Geol. Surv. Coast. Mar. Hazards Program, 2022; in press. [Google Scholar] [CrossRef]
- Traykovski, P.; Francis, H. Development of a highly portable unmanned surface vehicle for surf zone bathymetric surveying. J. Coast. Res. 2021, 37, 933–945. [Google Scholar] [CrossRef]
- Tomiczek, T.; Kennedy, A.; Rogers, S. Collapse limit state fragilities of wood-framed residences from storm surge and waves during Hurricane Ike. J. Waterw. Port Coast. Ocean. Eng. 2014, 140, 43–55. [Google Scholar] [CrossRef] [Green Version]
- Ellingwood, B.; Rosowsky, D.; Li, Y.; Kim, J. Fragility assessment of light-frame wood construction subjected to wind and earthquake hazards. J. Struct. Eng. 2004, 130, 1921–1930. [Google Scholar] [CrossRef]
- van de Lindt, J.W.; Peacock, W.G.; Mitrani-Reiser, J.; Rosenheim, N.; Deniz, D.; Dillard, M.; Tomiczek, T.; Koliou, M.; Graettinger, A.; Crawford, P.S.; et al. Community resilience-focused technical investigation of the 2016 Lumberton, North Carolina, flood: An interdisciplinary approach. Nat. Hazards Rev. 2020, 21, 04020029. [Google Scholar] [CrossRef]
- Webb, B.; Dix, B.; Douglass, S.; Asam, S.; Cherry, C.; Buhring, B. Nature-Based Solutions for Coastal Highway Resilience: An Implementation Guide; Federal Highway Administration: Washington, DC, USA, 2019.
- Tomiczek, T.; O’Donnell, K.; Furman, K.; Webbmartin, B.; Scyphers, S. Rapid Damage Assessments of Shorelines and Structures in the Florida Keys after Hurricane Irma. Nat. Hazards Rev. 2020, 21, 05019006. [Google Scholar] [CrossRef]
- Van Rijn, L.C. Unified View of Sediment Transport by Currents and Waves. I: Initiation of Motion, Bed Roughness, and Bed-Load Transport. J. Hydraul. Eng. 2007, 133, 649–667. [Google Scholar] [CrossRef] [Green Version]
- Mitchener, H.; Torfs, H. Erosion of mud/sand mixtures. Coast. Eng. 1996, 29, 1–25. [Google Scholar] [CrossRef] [Green Version]
- Gauchi, J.P.; Chagnon, P. Comparison of selection methods of explanatory variables in PLS regression with application to manufacturing process data. Chemom. Intell. Lab. Syst. 2001, 58, 171–193. [Google Scholar] [CrossRef]
- NCDOT NC 12 Twitter Account Communications [@NCDOT_NC12]. (16 November 2019). NCDOT Plans to Close NC 12 on the Outer Banks from the Marc Basnight Bridge to Rodanthe at 5pm Today. A Powerful Coastal Storm Has Made Travel Hazardous on the Road. NCDOT Crews Will Be Back out Tomorrow to Assess the Road and Determine When the Road Can be Reopened [Tweet]. Twitter. Available online: https://twitter.com/NCDOT_NC12/status/1195816753391161344 (accessed on 5 February 2022).
- NCDOT NC 12 Twitter Account Communications [@NCDOT_NC12]. (20 November 2019). N.C. 12 has Reopened Today Following Last Week’s Storms [Tweet]. Twitter. Available online: https://twitter.com/NCDOT_NC12/status/1197214994305310720 (accessed on 5 February 2022).
- Borchert, S.M.; Osland, M.J.; Enwright, N.M.; Griffith, K.T. Coastal wetland adaptation to sea level rise: Quantifying potential for landward migration and coastal squeeze. J. Appl. Ecol. 2018, 55, 2876–2887. [Google Scholar] [CrossRef]
- Torio, D.D.; Chmura, G.L. Assessing Coastal Squeeze of Tidal Wetlands. J. Coast. Res. 2013, 29, 1049–1061. [Google Scholar] [CrossRef]
- U.S. Fish and Wildlife Service. Pea Island National Wildlife Refuge. 2013. Available online: https://www.fws.gov/refuge/pea-island (accessed on 14 April 2022).
- Gulliver, pA.; Carnell, P.E.; Trevathan-Tackett, S.M.; Duarte de Paula Costa, M.; Masqué, P.; Macreadie, P.I. Estimating the Potential Blue Carbon Gains from Tidal Marsh Rehabilitation: A Case Study from South Eastern Australia. Front. Mar. Sci. 2020, 7, 403. [Google Scholar] [CrossRef]
- AASHTO (American Association of State Highway and Transportation Officials). Guide Specifications for Bridges Vulnerable to Coastal Storms; AASHTO: Washington, DC, USA, 2008; p. 65. [Google Scholar]
- Johnston, J.; Cassalho, F.; Miesse, T.; Ferreira, C.M. Projecting the effects of land subsidence and sea level rise on storm surge flooding in Coastal North Carolina. Sci. Rep. 2021, 11, 21679. [Google Scholar] [CrossRef]
- Castagno, K.A.; Tomiczek, T.; Shepard, C.C.; Beck, M.W.; Bowden, A.A.; O’Donnell, K.; Scyphers, S.B. Resistance, resilience, and recovery of salt marshes in the Florida Panhandle following Hurricane Michael. Sci. Rep. 2021, 11, 20381. [Google Scholar] [CrossRef] [PubMed]
- Cuevas Jiménez, A.; Euán Ávila, J.I.; Villatoro Lacouture, M.M.; Silva Casarín, R. Classification of beach erosion vulnerability on the Yucatan coast. Coast. Manag. 2016, 44, 333–349. [Google Scholar] [CrossRef]
- Luijendijk, A.; Hagenaars, G.; Ranasinghe, R.; Baart, F.; Donchyts, G.; Aarninkhof, S. The state of the world’s beaches. Sci. Rep. 2018, 8, 6641. [Google Scholar] [CrossRef] [PubMed]
- Mahapatra, M.; Ratheesh, R.; Rajawat, A.S. Shoreline change analysis along the coast of South Gujarat, India, using digital shoreline analysis system. J. Indian Soc. Remote Sens. 2014, 42, 869–876. [Google Scholar] [CrossRef]
- Olson, E.R.; Ventura, S.J. Geospatial methods to examine shoreline erosion in the Chippewa Flowage: A case study. Lake Reserv. Manag. 2012, 28, 170–175. [Google Scholar] [CrossRef]
- Stanchev, H.; Young, R.; Stancheva, M. Integrating GIS and high resolution orthophoto images for the development of a geomorphic shoreline classification and risk assessment—A case study of cliff/bluff erosion along the Bulgarian coast. J. Coast. Conserv. 2013, 17, 719–728. [Google Scholar] [CrossRef]
- Yin, J.; Yin, Z.; Wang, J.; Xu, S. National assessment of coastal vulnerability to sea-level rise for the Chinese coast. J. Coast. Conserv. 2012, 16, 123–133. [Google Scholar] [CrossRef]
- Davidson, M.A.; Turner, I.L.; Splinter, K.D.; Harley, M.D. Annual prediction of shoreline erosion and subsequent recovery. Coast. Eng. 2017, 130, 14–25. [Google Scholar] [CrossRef] [Green Version]


| Survey Dates | Purpose/Event | Max Water Level at Marina Tide Gauge between Surveys (m NAVD88) | Max Significant Wave Height Waverider Buoy between Surveys (m) |
|---|---|---|---|
| 13 November 2019 (pre-storm) 25 November 2019 (post-storm) | Nor’easter 16–20 November 2019 | 0.6 (24 November 2019) | 7.6 (16 November 2019) |
| 22 June 2020 | 2020 Baseline | --- | --- |
| 12 August 2020 (post-storm) | Hurricane Isaias 4 August 2020 | 0.9 (4 August 2020) | 4.4 (4 August 2020) |
| 8 March 2021 | 2021 Baseline | --- | --- |
| 3 May 2021 | 2021 Final Shoreline | 0.5 (29 April 2021) | 5.2 (19 March 2021) |
| System Rating | Shoreline Condition | Marsh Condition | Example |
|---|---|---|---|
| Healthy | Gentle slope; plant growth on or adjacent to shoreline; minimal to no exposed root mat. | Slope less than 1:30 *; all or majority of marsh above 0.61 m (2 ft) elevation; consistent plant growth throughout marsh, including juvenile plants; intact root mat. |  |
| Eroded | Scarp less than 0.30 m (1 ft); evidence of offshore (in-water) plant growth. May include: evidence of undercutting or cracks, chunks of marsh breaking off along shoreline. | Slope between 1:30 and 1:10 *; 50% of marsh above 0.61 m (2 ft) elevation; evidence of dead or otherwise removed plants; intact or exposed root mat. May include: signs of semi-regular flooding, evidence of channel incursion or paleo inlets. |  |
| Severely Eroded | Scarp greater than 0.30 m (1 ft); evidence of offshore (in-water) plant growth. May include: visible chunks of marsh sloughed off into water. | Slope greater than 1:10 *; less than 50% of marsh above 0.61 m (2 ft) elevation; significant evidence of dead plants or no plant growth; exposed root mat or no evidence of root mat present. May include: signs of regular flooding, evidence of channel incursion or paleo inlets. |  |
| Method | Failure Definition | Data Sources | Variables Considered | Significant Variables (p-Value) | R2 |
|---|---|---|---|---|---|
| 1 | Roadway closure due to flooding | Publicly available from TIMS, marina tide gauge, waverider buoy | Hs,max, WLmax, Tpd Vwind, θ | Hs,max (1.14 × 10⁻¹²) WLmax (1.17 × 10⁻⁴) | 0.26 |
| 2 | Roadway transect flooding | Numerical model outputs | Hs,boundary, WLmax,marina, Hs,shoreline, WLmax,shoreline, Xmarsh, | WLmarina (8.2 × 10⁻⁹) Xmarsh (2.6 × 10⁻⁶) | 0.48 |
| 3 | Marsh condition as severely eroded | Bathymetry data (2019, 2021), aerial shoreline imagery (2003–2021), rapid response shoreline measurements | X5mcontour,2019, X5mcontour,2021, m2mto5m, RR, LTR, TBSS>0.2. | X5mcontour,2019 (2.48 × 10⁻⁴) | 0.46 |
| LTR (1.39 × 10⁻⁴) | 0.52 | ||||
| Marsh condition as eroded or severely eroded | X5mcontour,2019 (3.11 × 10⁻⁴) | 0.35 | |||
| LTR (1.39 × 10⁻⁷) | 0.52 |
Publisher’s Note: MDPI stays neutral with regard to jurisdictional claims in published maps and institutional affiliations. |
© 2022 by the authors. Licensee MDPI, Basel, Switzerland. This article is an open access article distributed under the terms and conditions of the Creative Commons Attribution (CC BY) license (https://creativecommons.org/licenses/by/4.0/).
Share and Cite
Tomiczek, T.; Sciaudone, E.J.; Velásquez-Montoya, L.; Smyre, E.; Wargula, A.; Fawcett, K.; Torres, J. Investigation of Barrier Island Highway and Marsh Vulnerability to Bay-Side Flooding and Erosion. J. Mar. Sci. Eng. 2022, 10, 734. https://0-doi-org.brum.beds.ac.uk/10.3390/jmse10060734
Tomiczek T, Sciaudone EJ, Velásquez-Montoya L, Smyre E, Wargula A, Fawcett K, Torres J. Investigation of Barrier Island Highway and Marsh Vulnerability to Bay-Side Flooding and Erosion. Journal of Marine Science and Engineering. 2022; 10(6):734. https://0-doi-org.brum.beds.ac.uk/10.3390/jmse10060734
Chicago/Turabian StyleTomiczek, Tori, Elizabeth J. Sciaudone, Liliana Velásquez-Montoya, Elizabeth Smyre, Anna Wargula, Kelly Fawcett, and Joshua Torres. 2022. "Investigation of Barrier Island Highway and Marsh Vulnerability to Bay-Side Flooding and Erosion" Journal of Marine Science and Engineering 10, no. 6: 734. https://0-doi-org.brum.beds.ac.uk/10.3390/jmse10060734