1. Introduction
The development of maritime autonomous surface ships (MASS) is one of the important elements ensuring the safety and sustainability of ships from accidents at sea [
1]. The ratio of marine accidents due to human errors amounted to 75–96% according to the Allianz Safety and Shipping Review [
2]. The adoption of state-of-the-art ships with new technologies will make significant progress in improving a ship’s lifetime, energy saving, and environmental protection as well as reducing costs [
3]. Therefore, MASS are actively being researched by several researchers and companies in many nations. Further, the International Maritime Organization (IMO) has added a new agenda on MASS in 2019 [
4]. To develop MASS, multiple issues must be resolved to control them [
5], including the control and evaluation of the ship’s stability [
6].
The ship’s stability is one of the most critical factors ensuring the ship’s safety [
7]. Various types of ship stability criteria have been proposed by the IMO and regulations have been revised [
8]. The Sewol Ferry Disaster in 2014 was mainly caused by the loss of stability due to the cargo overload and improper operation of ballast water [
9]. Thus, the loss of a ship’s stability can cause large-scale accidents and human casualties, and the ship’s stability is a crucial element for the safe operation of ships [
6]. The simplest method to determine the ship’s stability is to calculate the metacentric height (
).
can be estimated from the distance between the ship’s center of gravity (G) and metacenter (M) or using the rolling period of the ship [
10].
Nevertheless, it is difficult to calculate
using the former method [
11]. The center of gravity of an object is the same as the geometric center of its volume if the materials making up the object are the same. However, it is very challenging to calculate the center position through the weight distribution of each part in a ship with complex structures, such as ships made of intricately shaped objects or other materials [
10]. In addition, there is no information about the cargo height although the weight of cargo loaded in a ship is known. For example, even if two containers with different shippers have the same weight of 20 tons, the height of the cargo will be different. This consequently produces an error in calculating the center of gravity.
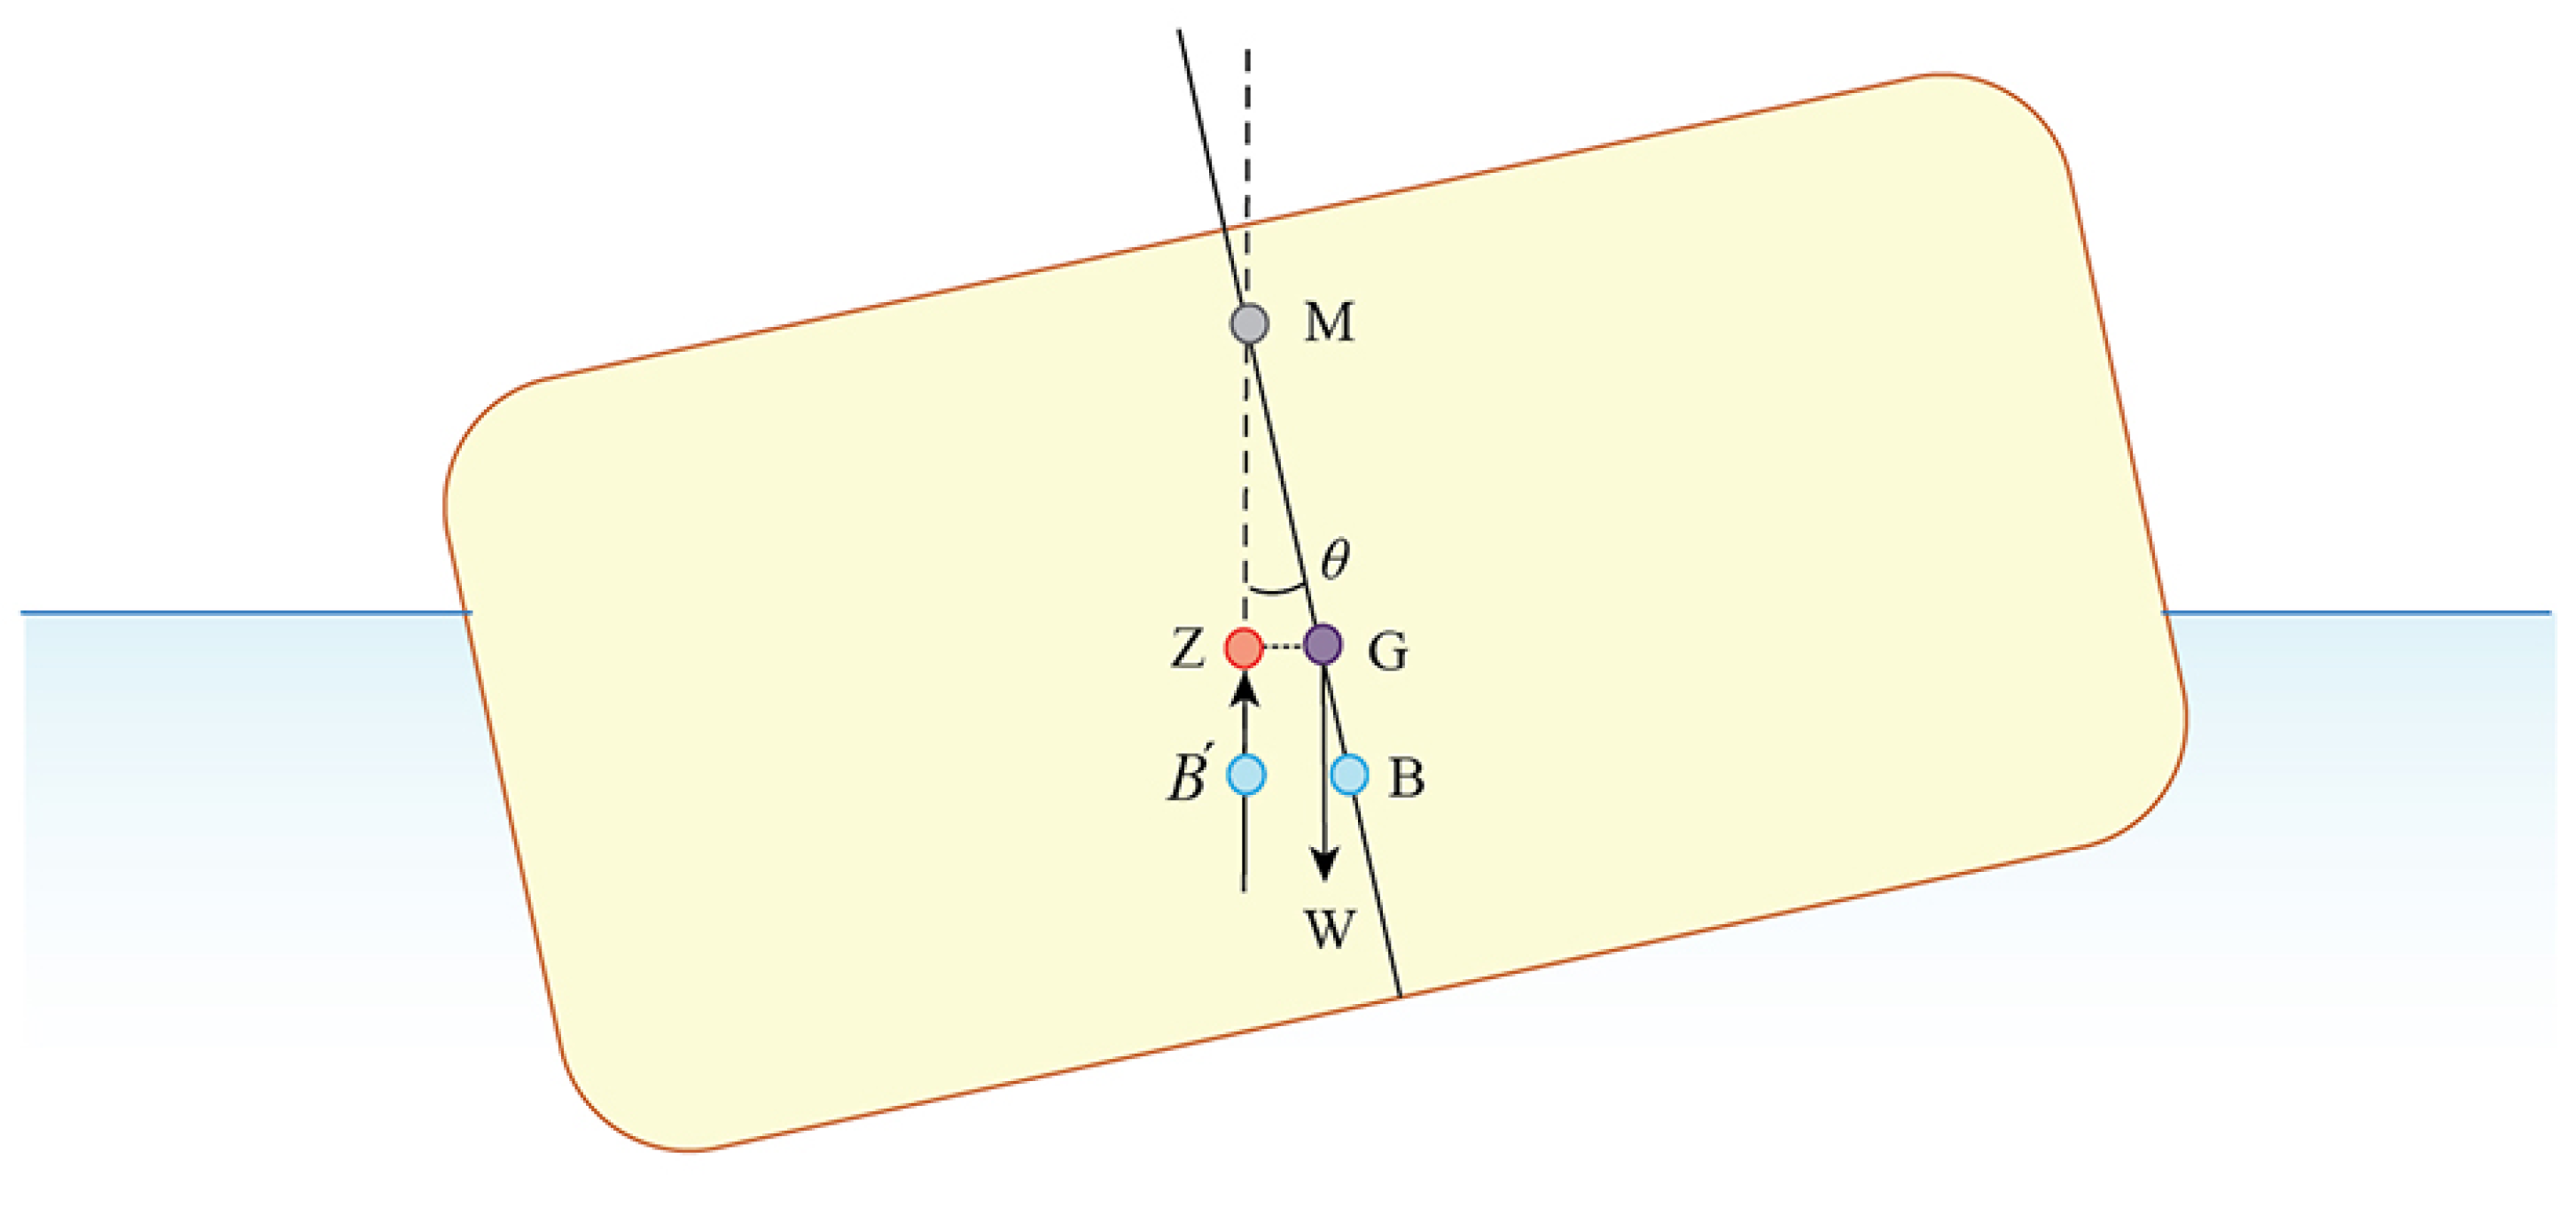
Alternatively, a rolling period can be used to calculate the center of gravity for measuring
. If the ship is forcibly inclined via an external force, it will rotate to the port and starboard sides to achieve stability, and this oscillation will manifest a periodic motion like a pendulum. As the period is determined by the distance between the pendulum and the axis of rotation, it is closely related to
. If a rolling period can be measured, the ship’s
can be simply calculated using the ship’s breadth [
12]. However, ship
so far has been calculated through a ship’s loading computer verified by the ship’s class, by reflecting the weight of each cargo, ballast, etc. tank. For the calculation of
through the measurement of rolling period, a ship’s rolling period data is required, but it is difficult to obtain the data at a port. This is because it is impossible to roll a moored ship in a port. Therefore, sensors that measure the rolling of ships and related research are rare.
To measure a rolling period of MASS in real time, a sensor is needed to detect the ship’s movement. The current sensor technology enables motion control using drone and automated vehicle movements [
13,
14]. This means that the ship’s movement can be measured as well; however, the impact of the sea environment on ships differs from that on land [
15]. Therefore, it is necessary to investigate the errors and characteristics of sensors before applying them to the sea.
Among them, microelectromechanical systems (MEMS) sensors, which were derived from semiconductor processing technology, are electronic sensors widely used in many areas. In particular, the use of MEMS sensors in vehicles or machines is gradually increasing [
14,
15]. The importance of MEMS sensors is emphasized, and research on the thermal error of MEMS sensor is being actively conducted [
16,
17,
18,
19]. For example, research into the calibration suitable for the environment in which the sensor will be used. However, the thermal error of the MEMS sensor is still not resolved. [
20].
The rolling period can be measured not only with MEMS sensors but also with mechanical sensors such as gyrocompasses and accelerometers. However, due to the recent development of sensor technology, various types of sensors have been developed. The sensor market previously domination by mechanical sensors has shifted to electronic sensors with the development of electronic technology [
21,
22]. The mechanical sensors have been replaced with electronic sensors in all industries owing to their advantages of low power consumption, miniaturization, mass production, and economic feasibility.
One of the typical MEMS sensors is a MEMS acceleration and gyroscope sensor that measures inertia. This sensor provides information to users such as position, speed, and motion in real time by detecting translational and rotational movements based on Newton’s law along the X, Y, and Z-axes in the inertial space, using acceleration and angular velocity [
21]. A six-axis MEMS sensor comprising an acceleration and a gyroscope sensor in the three-coordinate X, Y, and Z-axes have been widely used for controlling the motion of the aforementioned drones, self-driving cars and unmanned underwater vehicles [
13,
23].
Despite the emergence of diverse electronic sensors and research on their application to a shipboard [
23,
24], few demonstration experiments have been conducted on various errors of sensors to apply them to marine environments [
22,
23,
24]. To apply the MEMS inertial sensor to ships, it is necessary to investigate errors that occur during measurements by contemplating the measurement principles of the accelerometer and gyroscope sensor. In particular, thermal errors should be investigated because significant temperature changes occur due to various environments in ships that navigate around the world [
25]. Thus, this study aims to analyze the characteristics of thermal errors according to temperature changes in commercial MEMS sensors to apply the six-axis MEMS sensor to MASS.
This study is organized into five steps as follows: In the first step, the ship’s rolling period and characteristics of MEMS sensors are explored. In this step, the measurement principles and structures of the accelerometer and gyroscope sensor used in the experiment are investigated considering the ship’s rolling period, characteristics of MEMS sensor, and process procedure when an external force is applied to a ship, and any errors that may occur in the sensors are verified. In the second step, experimental equipment is built. In the third step, experiments to investigate the thermal characteristics of the six-axis MEMS sensor are performed as per temperature changes. The experiment was conducted five times and temperature was varied in six steps (with an increase of 10 °C) in the range of 25 °C to 75 °C. In the fourth step, the experimental results are analyzed. In the fifth step, the errors and noise of the measured values are analyzed, and the outcomes are discussed.
3. Experiment
The experiments were conducted using six-axis MEMS sensors.
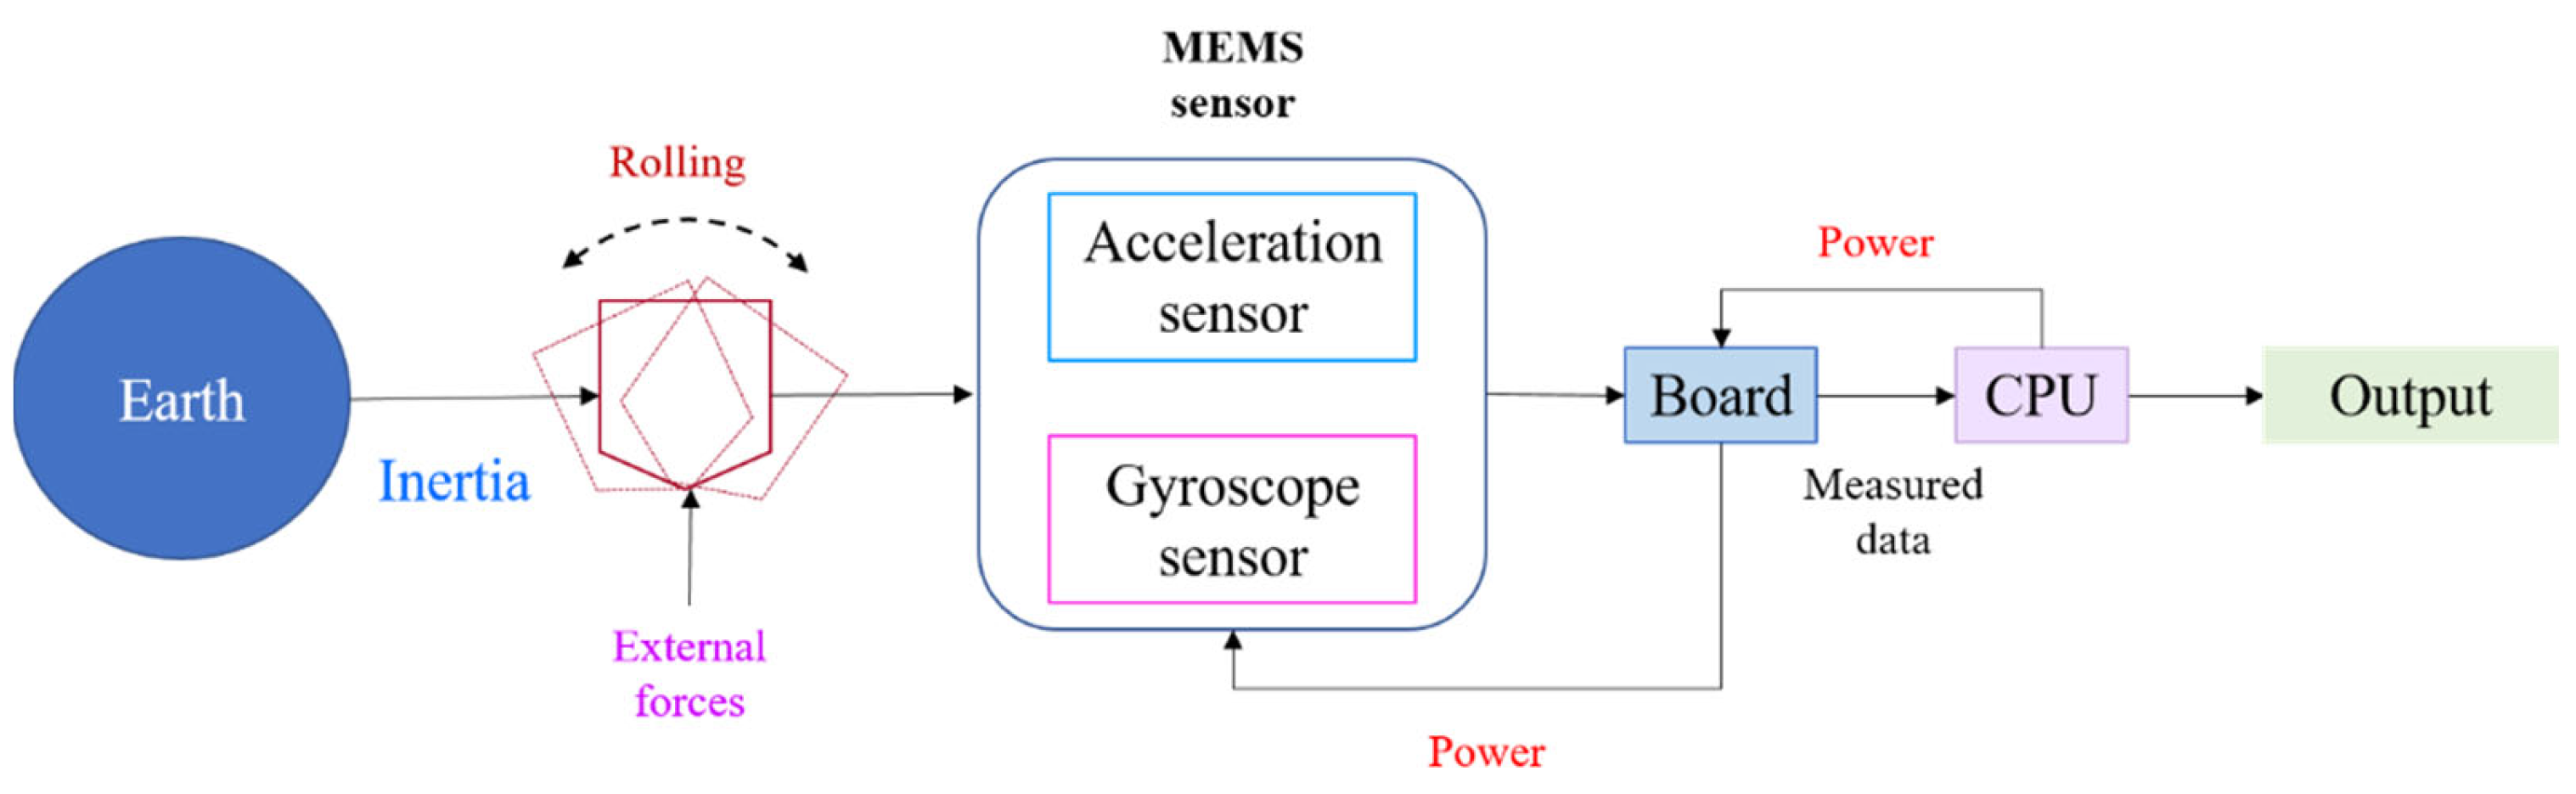
Figure 2 and
Figure 3 show the schematics of the built experiment equipment. The equipment configuration comprises a six-axis MEMS sensor, board, and computer. The six-axis MEMS sensor comprises an accelerometer (ADXL345) and a gyroscope sensor (GY-521). The circuit board connected with the sensor is the ATmega328 model.
The experimental equipment measures values produced from a flat place. The units of the experimental measurement were Earth’s gravitational acceleration, g, for the accelerometer and degrees per second (DPS) for the gyroscope sensor. The measurement values should produce 0 g for the X and Y-axes of the accelerometer because the X and Y-axes are not affected by the Earth’s gravity and a value of 1 g for the Z-axis. Simultaneously, the gyroscope sensor should produce 0 DPS in all axes.
The experiment was conducted by equipping the sensor with a heater that can adjust temperature at six different settings to meet the set experimental temperature values and obtain measured values at one-minute intervals. The same method was repeated five times in each measurement. The detection period of measured values in the sensor was set to 5 ms. The experimental temperature started from 25 °C, which was the recommended use temperature, followed by 35 °C, 45 °C, 55 °C, 65 °C, and 75 °C. The temperature sensor inside the sensor was used to measure temperature. During the experiment, only the temperature was altered, whereas changes in other environments, such as vibration or sensor position, were restricted. The detectable range of the temperature sensor used in the experiment was −45 °C to 85 °C.
4. Analysis of the Results
4.1. Experimental Results of Measurement Values
Table 1 summarizes the experimental results of measurement values. Hereafter, the output error and zero-point error measured in the MEMS sensor are referred to as error. The measurement error refers to the difference between the ideally measured value and the real measured value. The noise refers to the measured value that occurred due to thermal agitation inside the sensor caused by temperature change.
The measurement results of the accelerometer are as follows. First, the error in the measurement value of the accelerometer was significantly minimal. The maximum error of 0.095 g was found in the Z-axis among the accelerometer axes. This error occurred while building the experimental equipment due to the sensor structure problem. In contrast, the thermal error change was the largest in the X-axis of the accelerometer, whereas it showed a slightly increasing trend in the Y-axis. Second, the accelerometer also had a very small deviation, indicating that the noise was small. In addition, it was verified that the deviation values increased as the temperature increased, but the temperature rise and noise level did not increase proportionally. The deviation from linearity increased between 45 °C and 65 °C. In particular, the Y-axis in the accelerometer had the largest change in deviation according to temperature changes, whereas in the Z-axis, the largest deviation value was measured at 55 °C.
The measurement results of the gyroscope sensor are as follows. First, the error in the measurement value of the gyroscope sensor was comparatively larger than that of the accelerometer, and the error size was significantly larger. The X-axis of the gyroscope sensor showed an increasing trend of measured values with temperature rise, whereas the Y-axis showed a decreasing trend. The Z-axis showed a slight rise. The change in thermal errors verified that the Z-axis of the two sensors was stable during temperature change. Second, it was verified that the deviation of the gyroscope sensor was larger than that of the accelerometer. Similar to the accelerometer, the largest deviation was found in the Y-axis of the gyroscope sensor. The Z-axis also showed the same trend as that of the accelerometer, causing the smallest deviation. It was verified that the deviation mostly became large as the temperature increased, but it could not be concluded that the deviation increased absolutely with temperature rise as shown for the accelerometer.
4.2. Analysis of the Effects of Temperature Variation on the Accelerometer
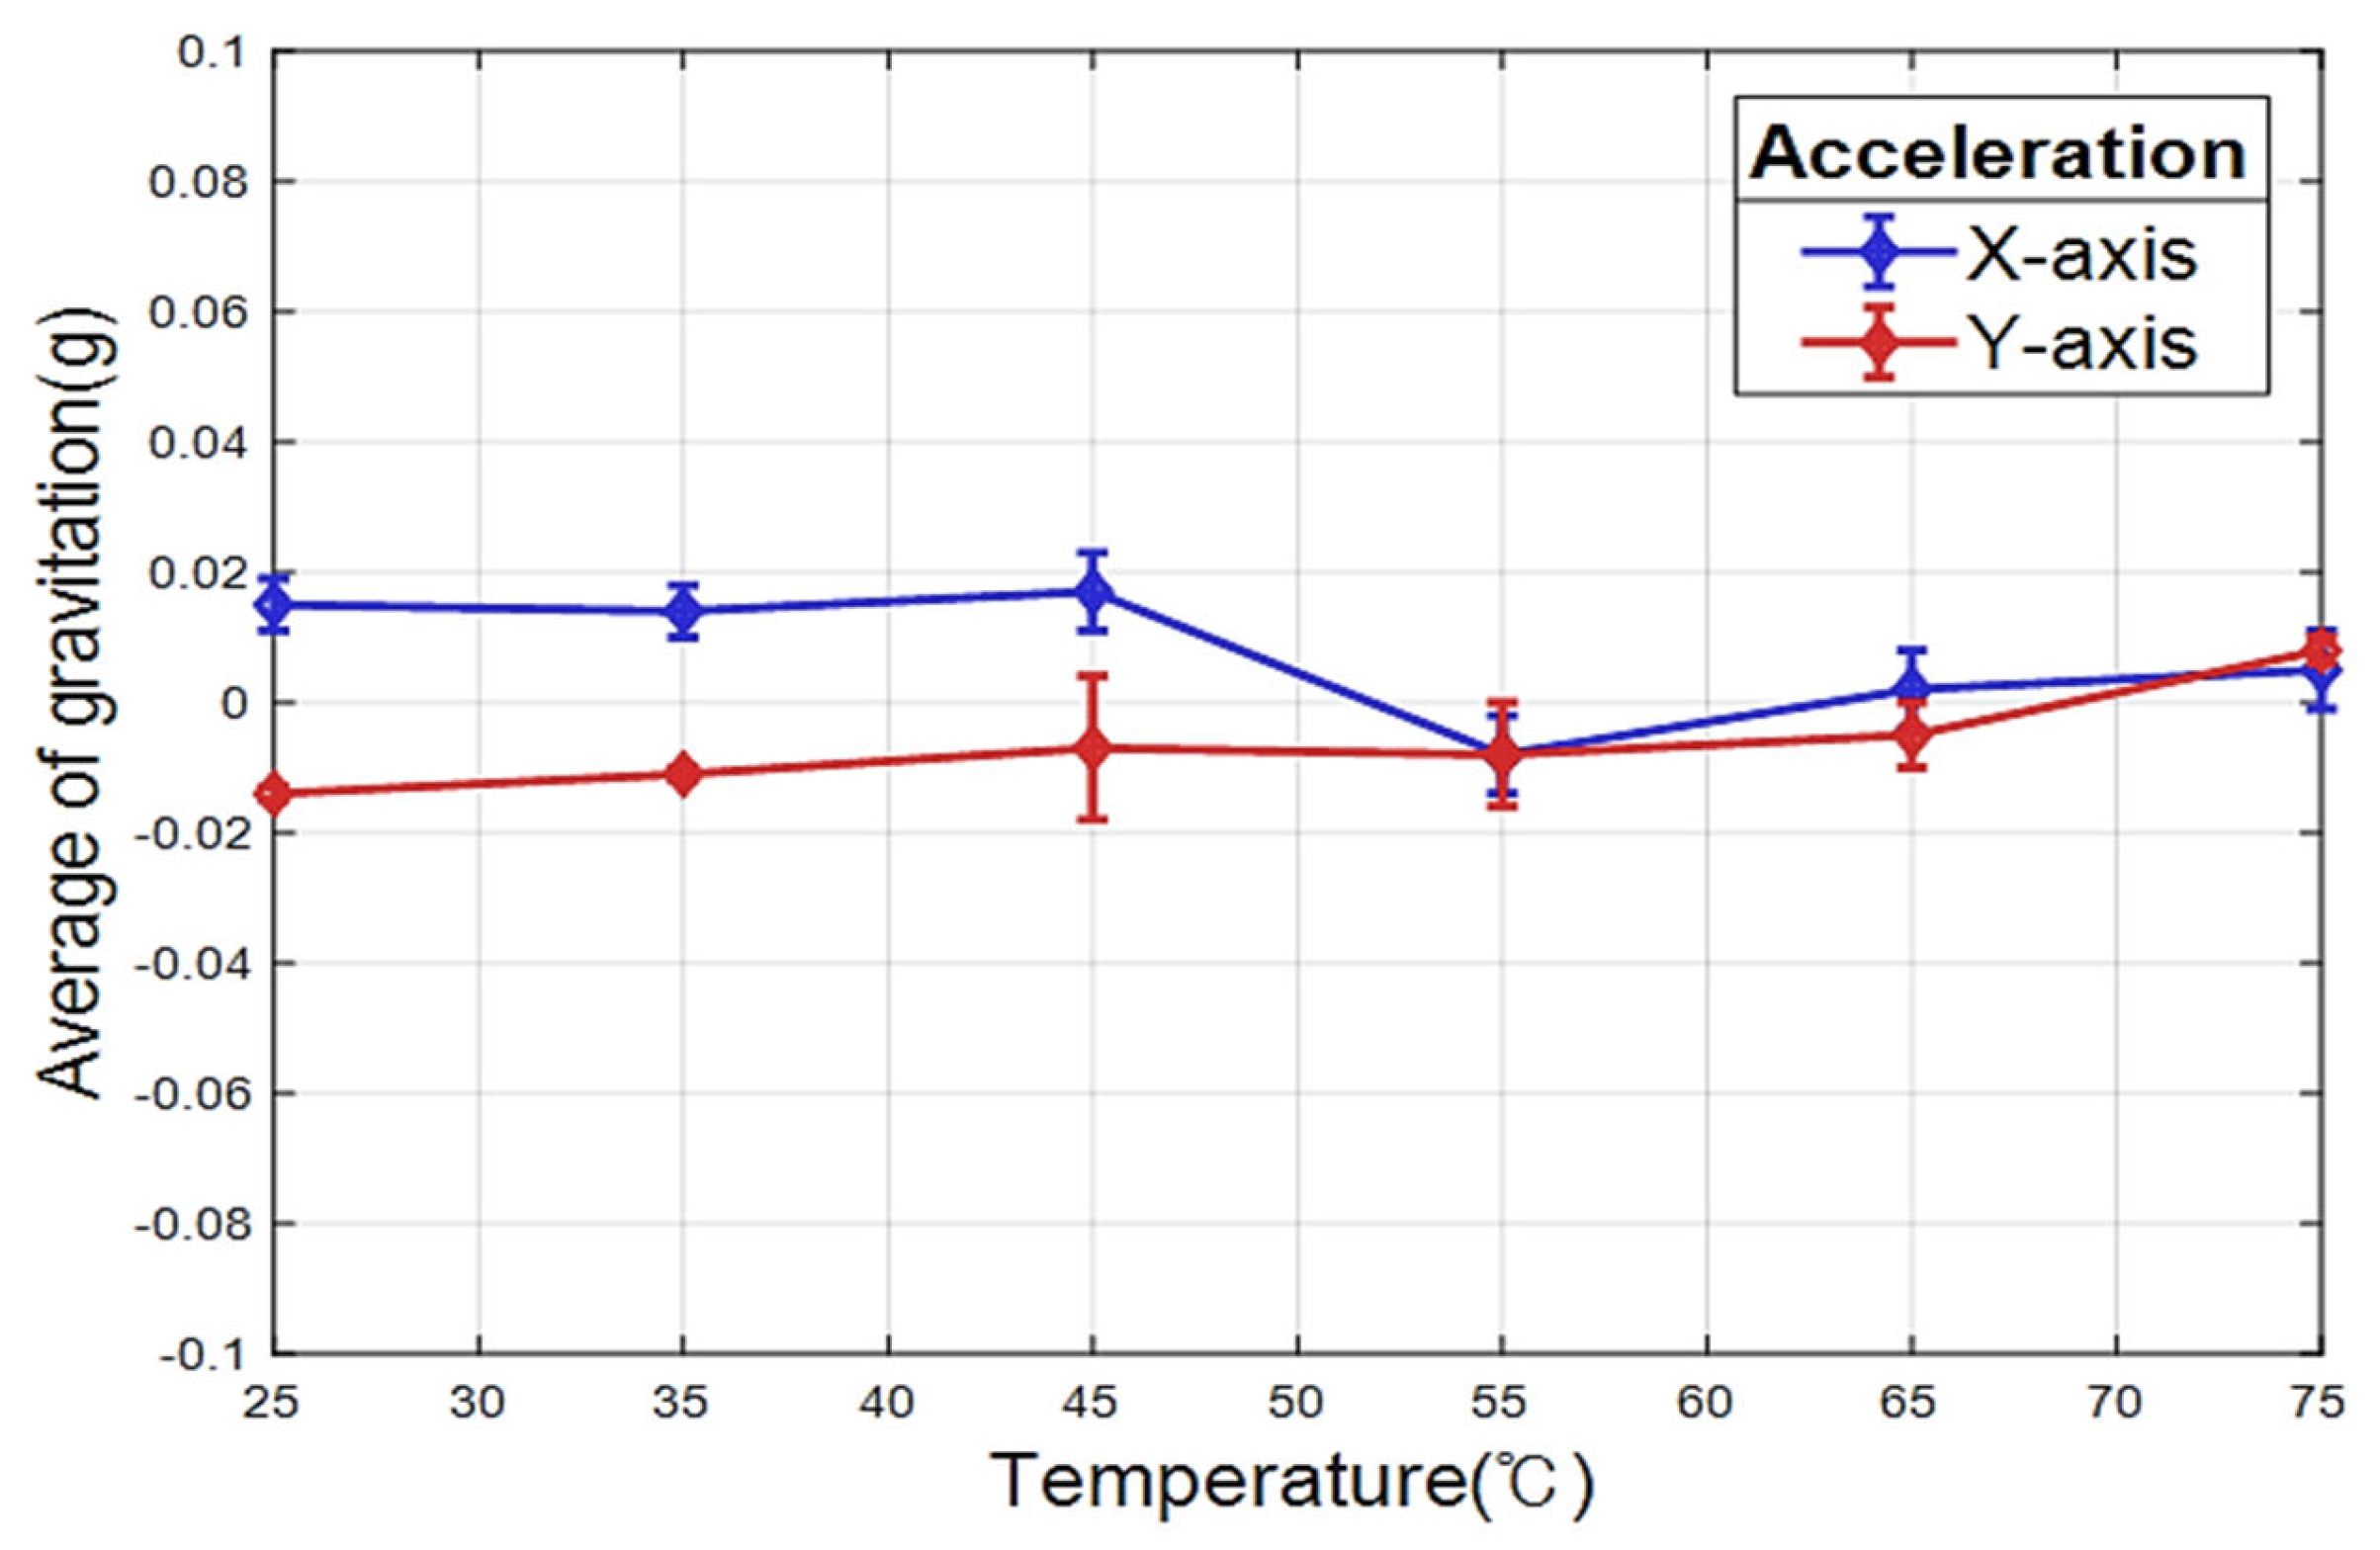
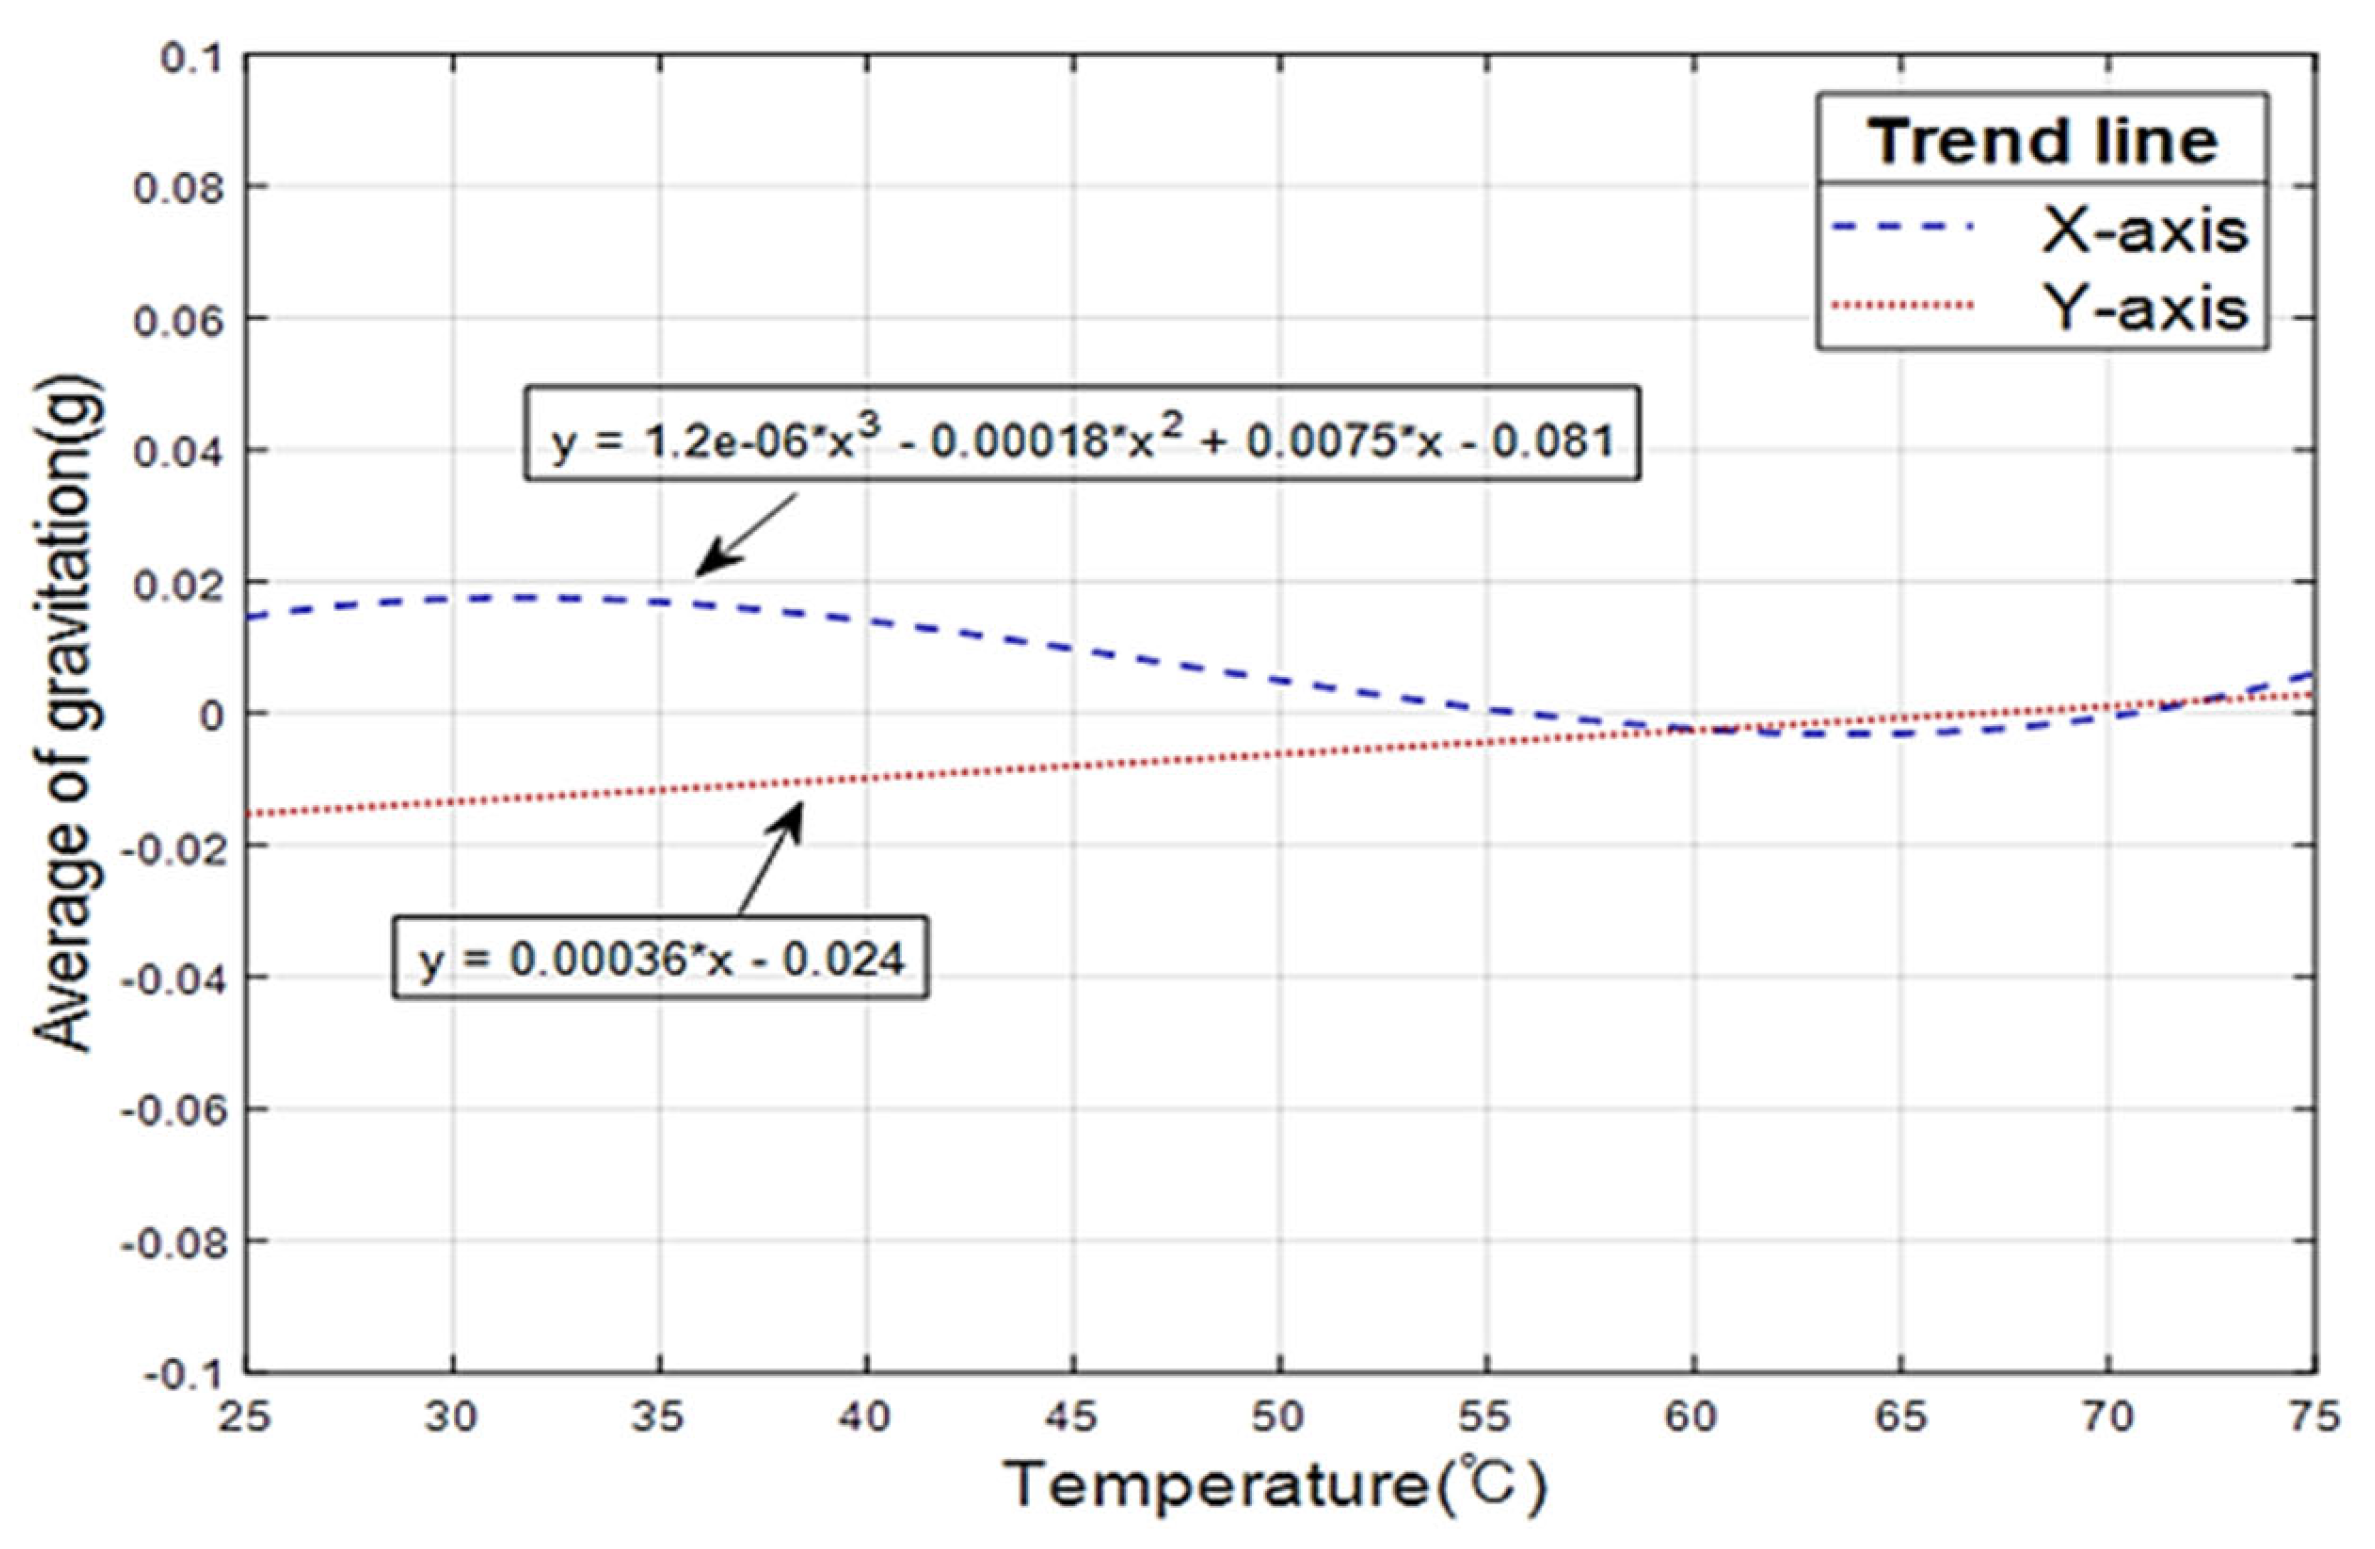
To analyze the measured values and standard deviation by the temperature of the accelerometer,
Figure 4 shows the average and standard deviation of the measured values in the X and Y-axes of the accelerometer and
Figure 5 shows the graph displaying the analysis of the trendline of the measured values. The average values and deviations in
Figure 4 are shown by points and error bar. The change in the average values was analyzed, and the analysis results showed that the change in the values in the X-axis of the accelerometer had a nonlinear characteristic, whereas that in the Y-axis had a linear characteristic. In the X-axis, the measured values showed a nonlinear characteristic up to 55 °C followed by an increasing trend of the measured values. In the Y-axis, the measured values exhibited a gradually increasing tendency. The measured values in the X-axis of the accelerometer followed a cubic function of
, in which the measured values increased and decreased repeatedly. The minimum value found using the trendline analysis was −0.003 g at 64.3 °C and the maximum value was 0.017 g at 31.5 °C. The measured values in the Y-axis of the accelerometer followed the function of
, where slope was 0.00036, the minimum value was −0.012 g at 28 °C, and the maximum value was 0.056 g at 75 °C. The analysis of the standard deviation verified that the change in the standard deviation increased from 45 °C in both axes. It was noted that the measured values in the Y-axis of the accelerometer showed a significantly smaller standard deviation at 25 °C and 35 °C than that of the X-axis, and the largest standard deviation is found at 45 °C in both axes.
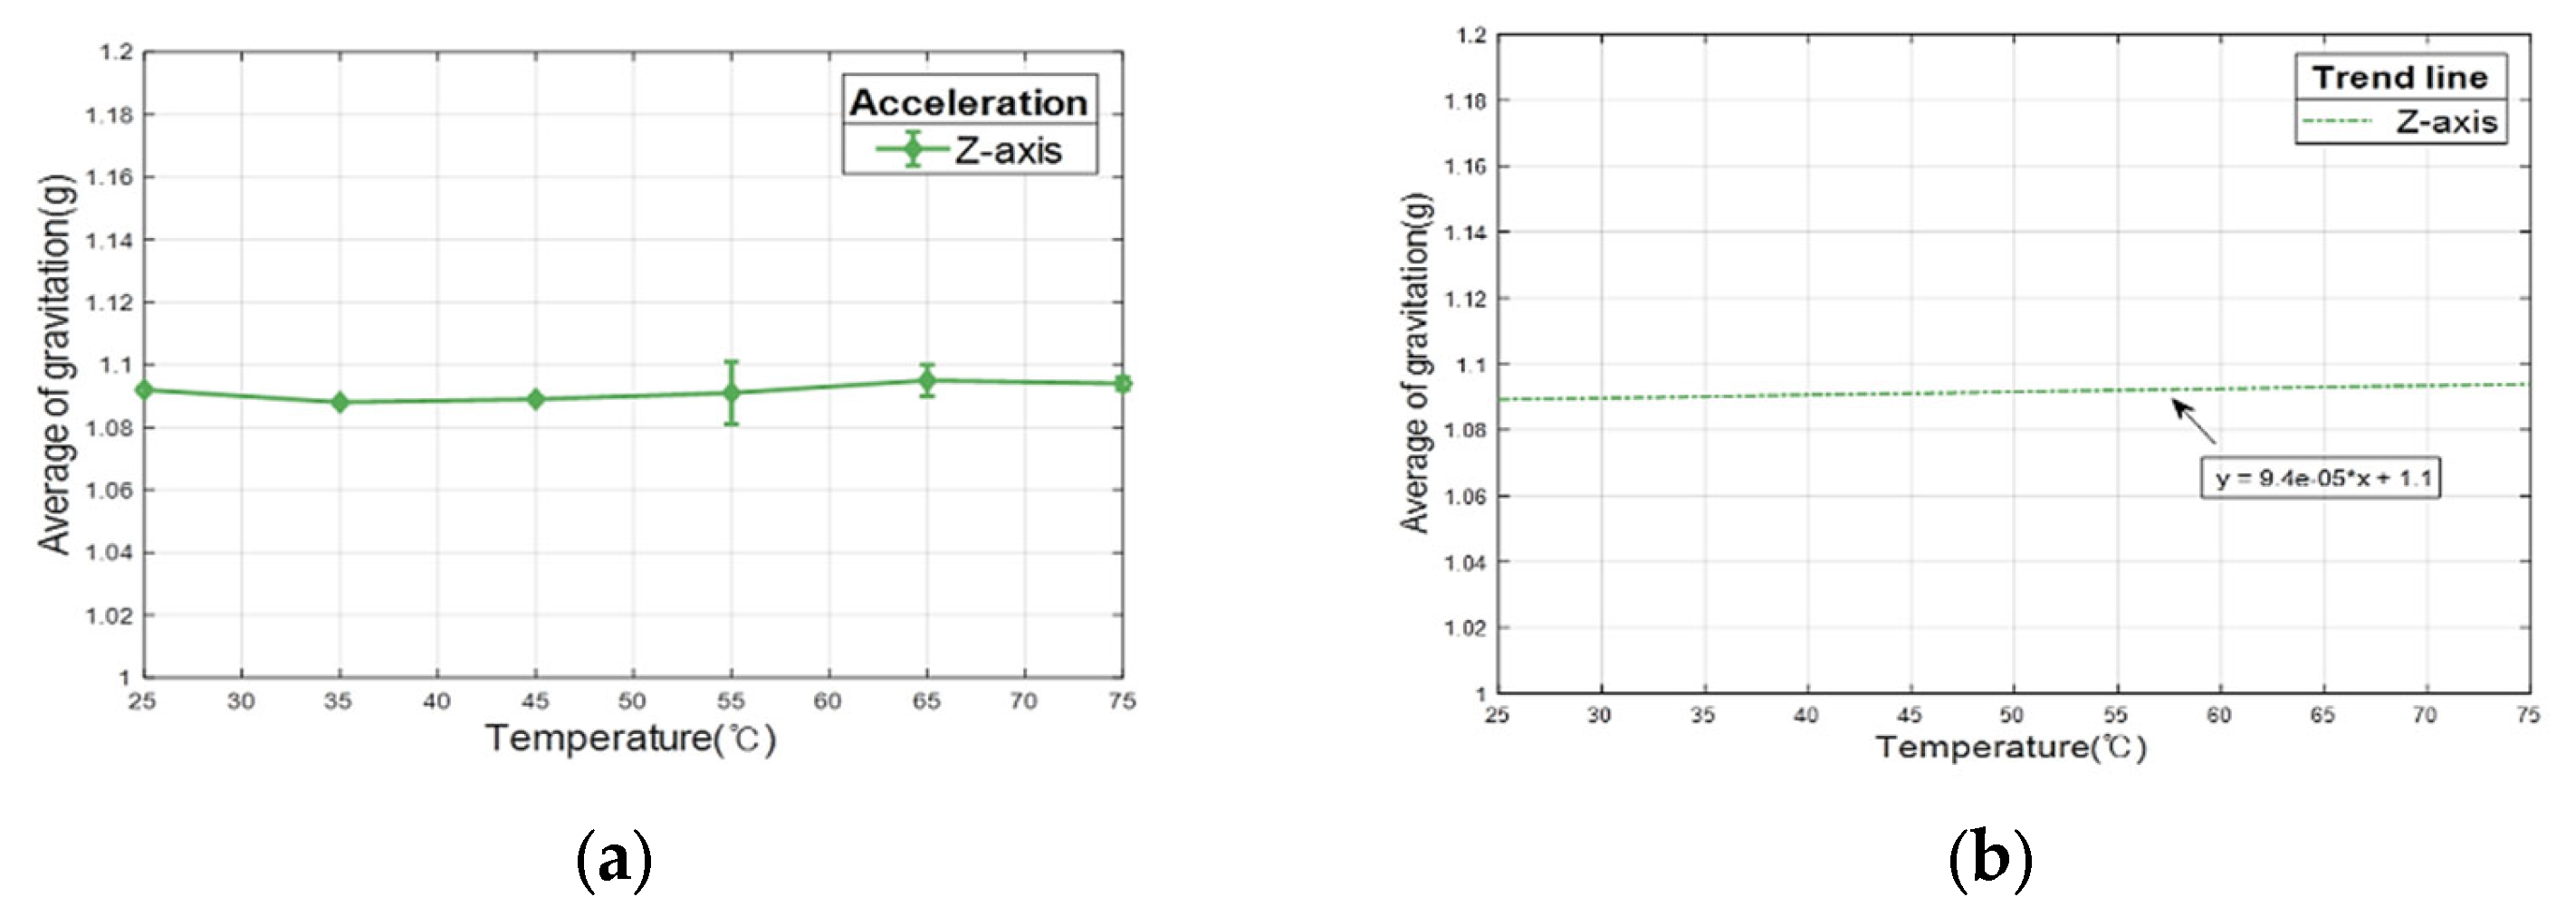
Figure 6a shows a graph displaying the measured values in the Z-axis of the accelerometer, and
Figure 6b shows the trend analysis of the measured values. The analysis results of the change in the average values showed that the Z-axis should have a 1 g measurement value, but approximately 1.090 g was measured in the experiment. The average values did not show any significant change as the temperature increased. Through the analysis of the trendline, a linear function of
with slope of 9.4 × 10
−0.5 was obtained. The minimum value obtained through the trend line was approximately 1.089 g at 25 °C, the maximum value was approximately 1.094 g at 75 °C, and the change was 0.0047 g. The standard deviation was also analyzed, and the results showed the standard deviation whose size was difficult to analyze in all temperature ranges, but it was large at 55 °C. Among the axes in the accelerometer, the Z-axis showed the smallest change in noise size according to the temperature.
4.3. Analysis of Noise in the Accelerometer
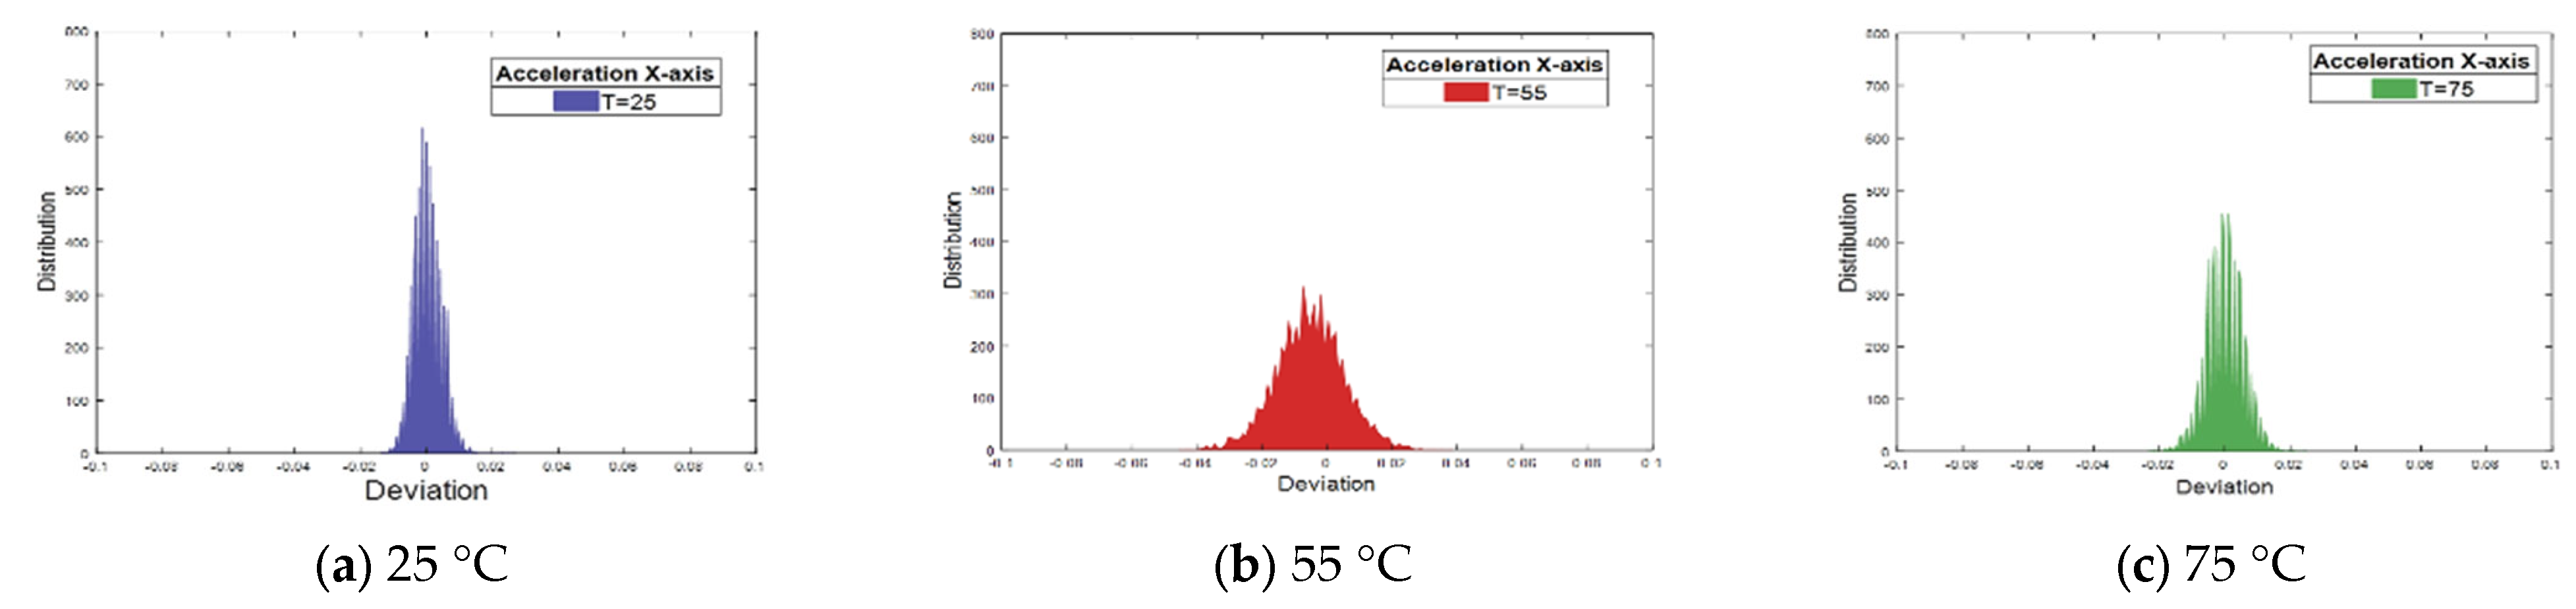
The measured values in the experiment results were divided into the X, Y, and Z-axes of the acceleration coordination system, and the noise was analyzed at each temperature.
Figure 7a–c show the deviation analysis of the measured values at 25 °C, 55 °C, and 75 °C in the temperature of the X-axis in the accelerometer. Large deviation means that the difference between the average of the measured values and the measured value is large. The distribution range rather showed a smaller deviation width than that at 55 °C, and although the deviation was larger than that at 25 °C, it was smaller than that at 75 °C.
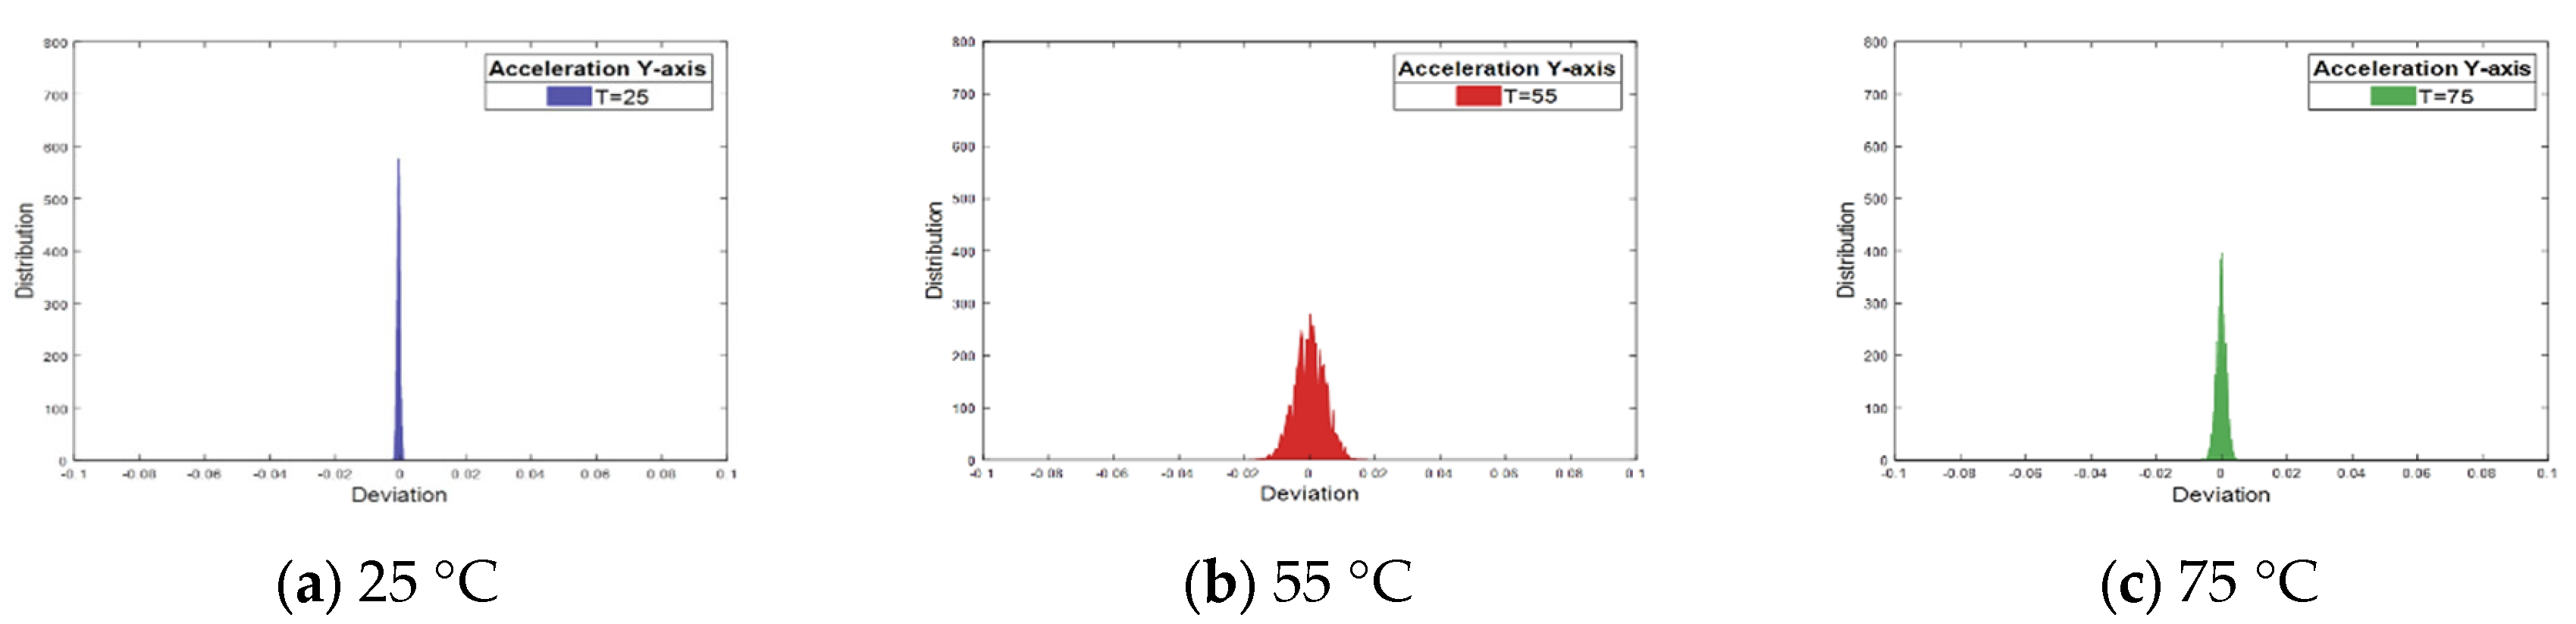
Figure 8a–c show the deviation analysis of the measured values at temperatures 25 °C, 55 °C, and 75 °C in the Y-axis of the accelerometer. The X- and Y-axes in
Figure 8 indicate the deviation and distribution. The deviation in the Y-axis of the accelerometer was also analyzed, and the results verified that the deviation increased as the temperature increased from 25 °C. However, as same as the X-axis, the noise did not increase absolutely according to the temperature.
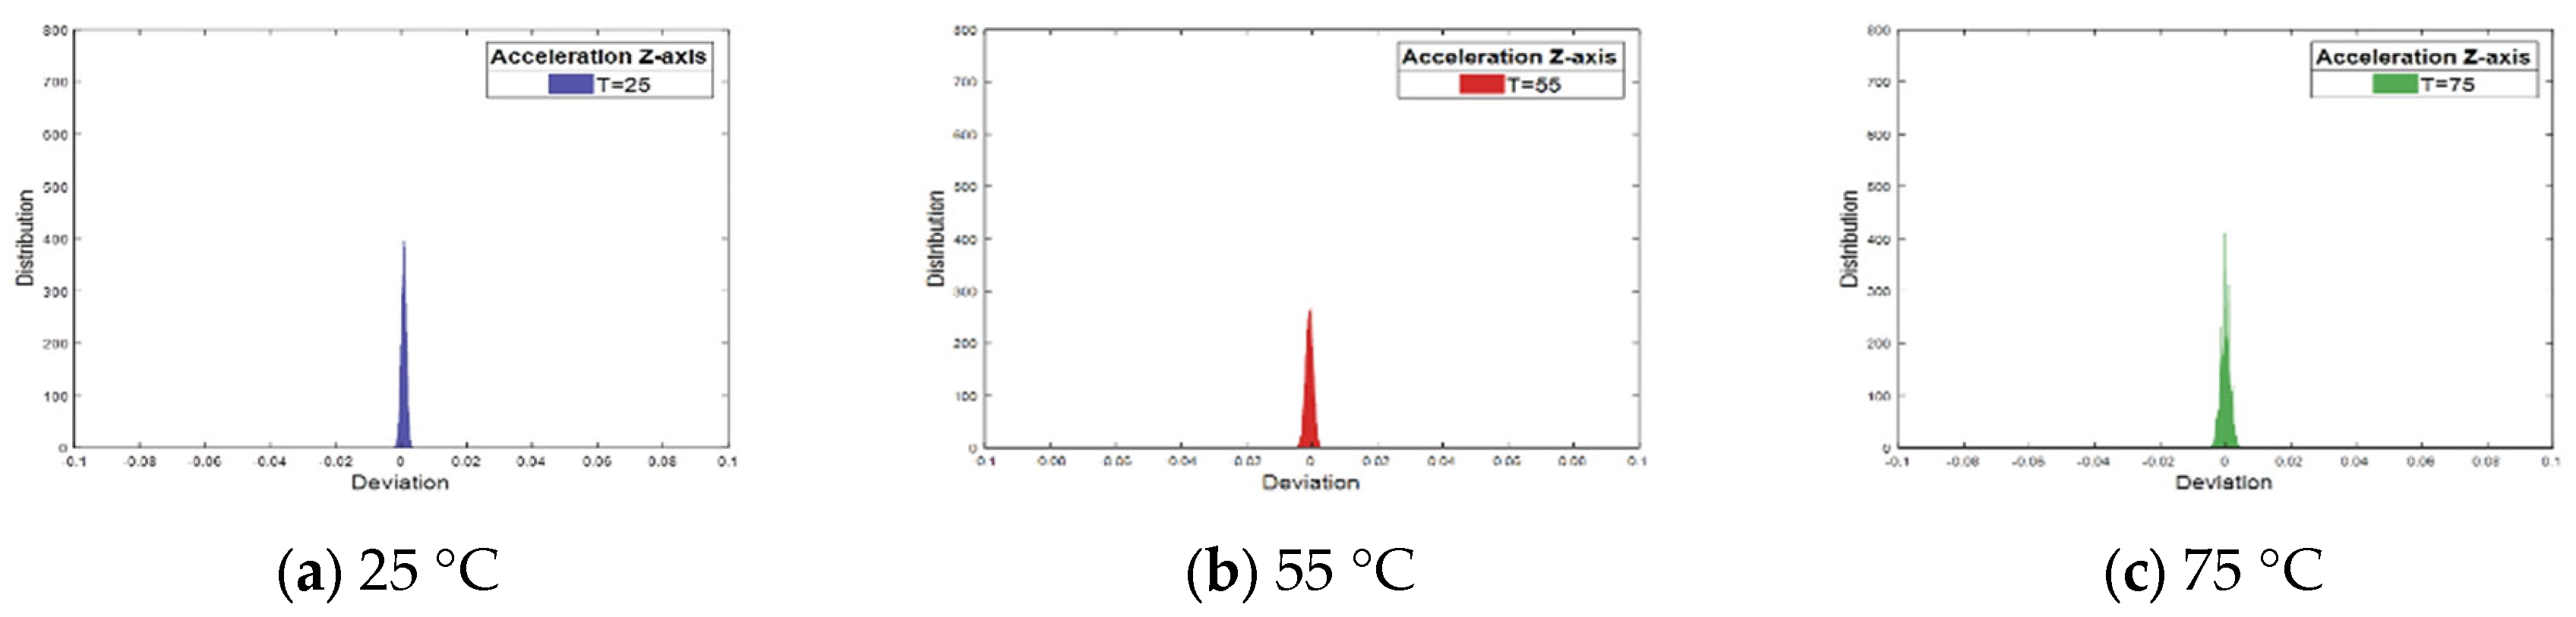
Figure 9a–c shows the deviation analysis of the measured values at temperatures 25 °C, 55 °C, and 75 °C in the Z-axis of the accelerometer. The distribution of average values was larger than that at 55 °C, but the deviation range was larger.
4.4. Analysis by Temperature in the Gyroscope Sensor
To analyze the measured values and standard deviations by the temperature of the gyroscope sensor,
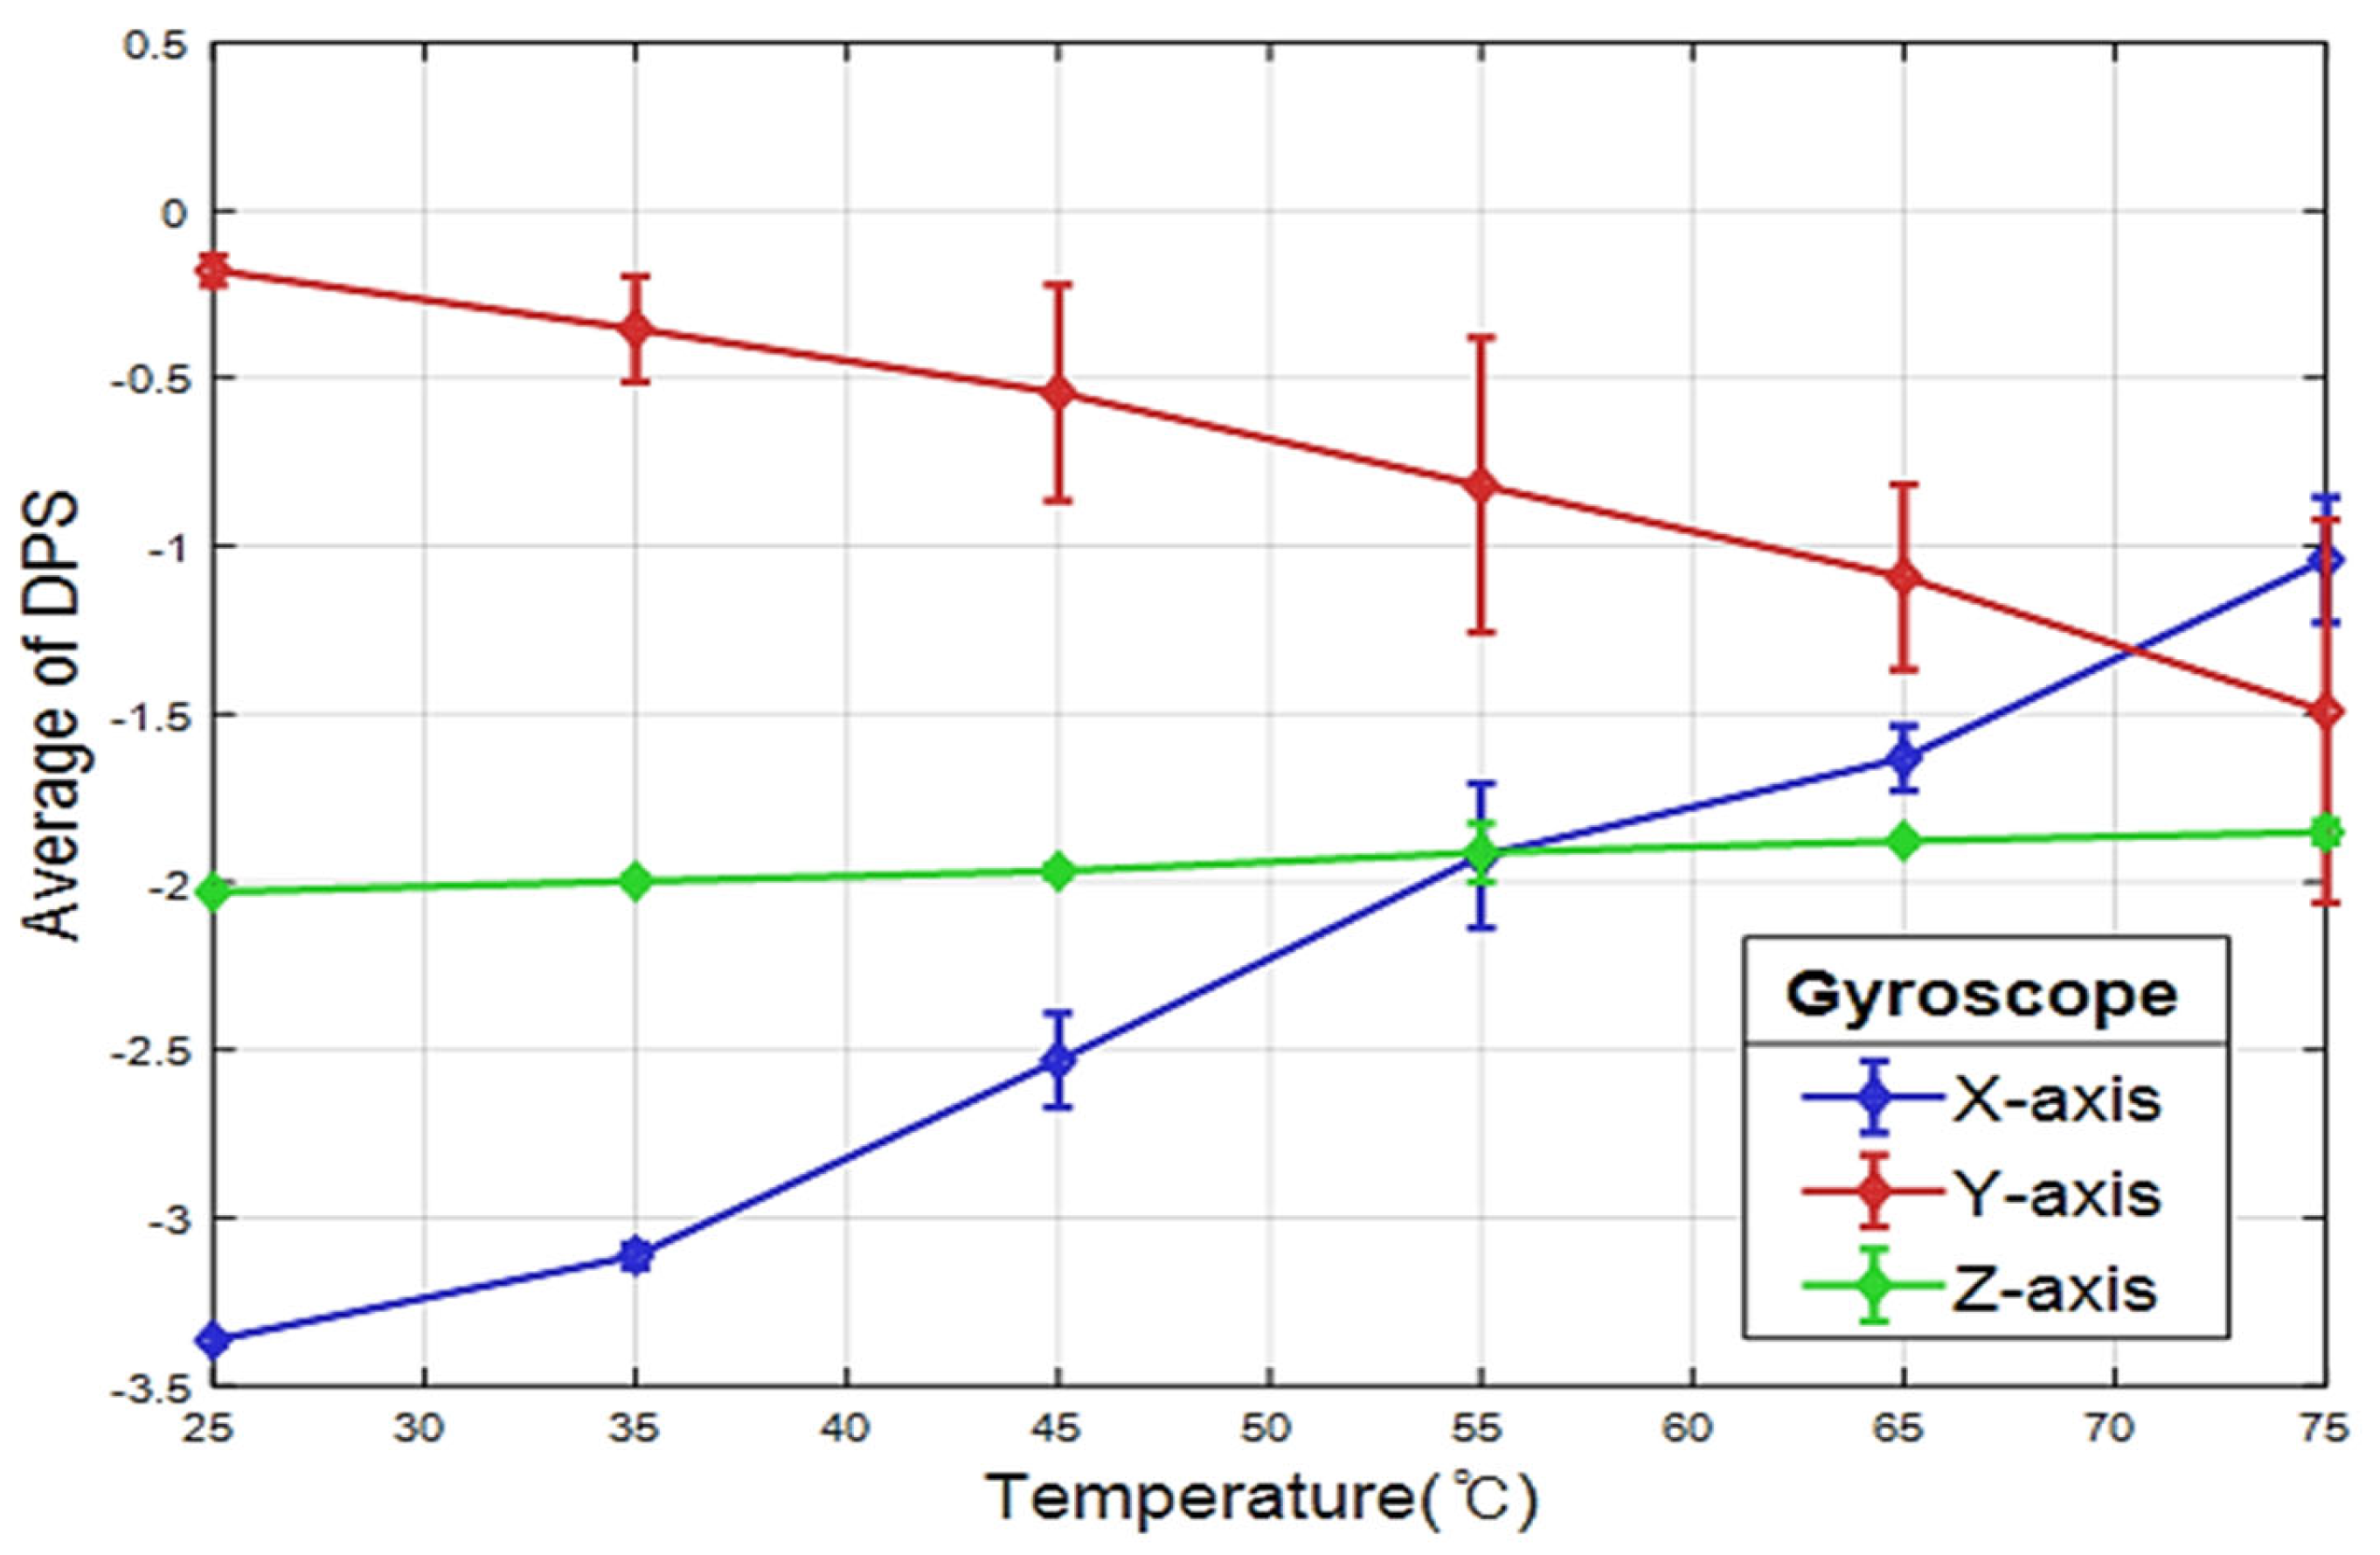
Figure 10 shows the measured values of the X-, Y-, and Z-axes in the gyroscope sensor.
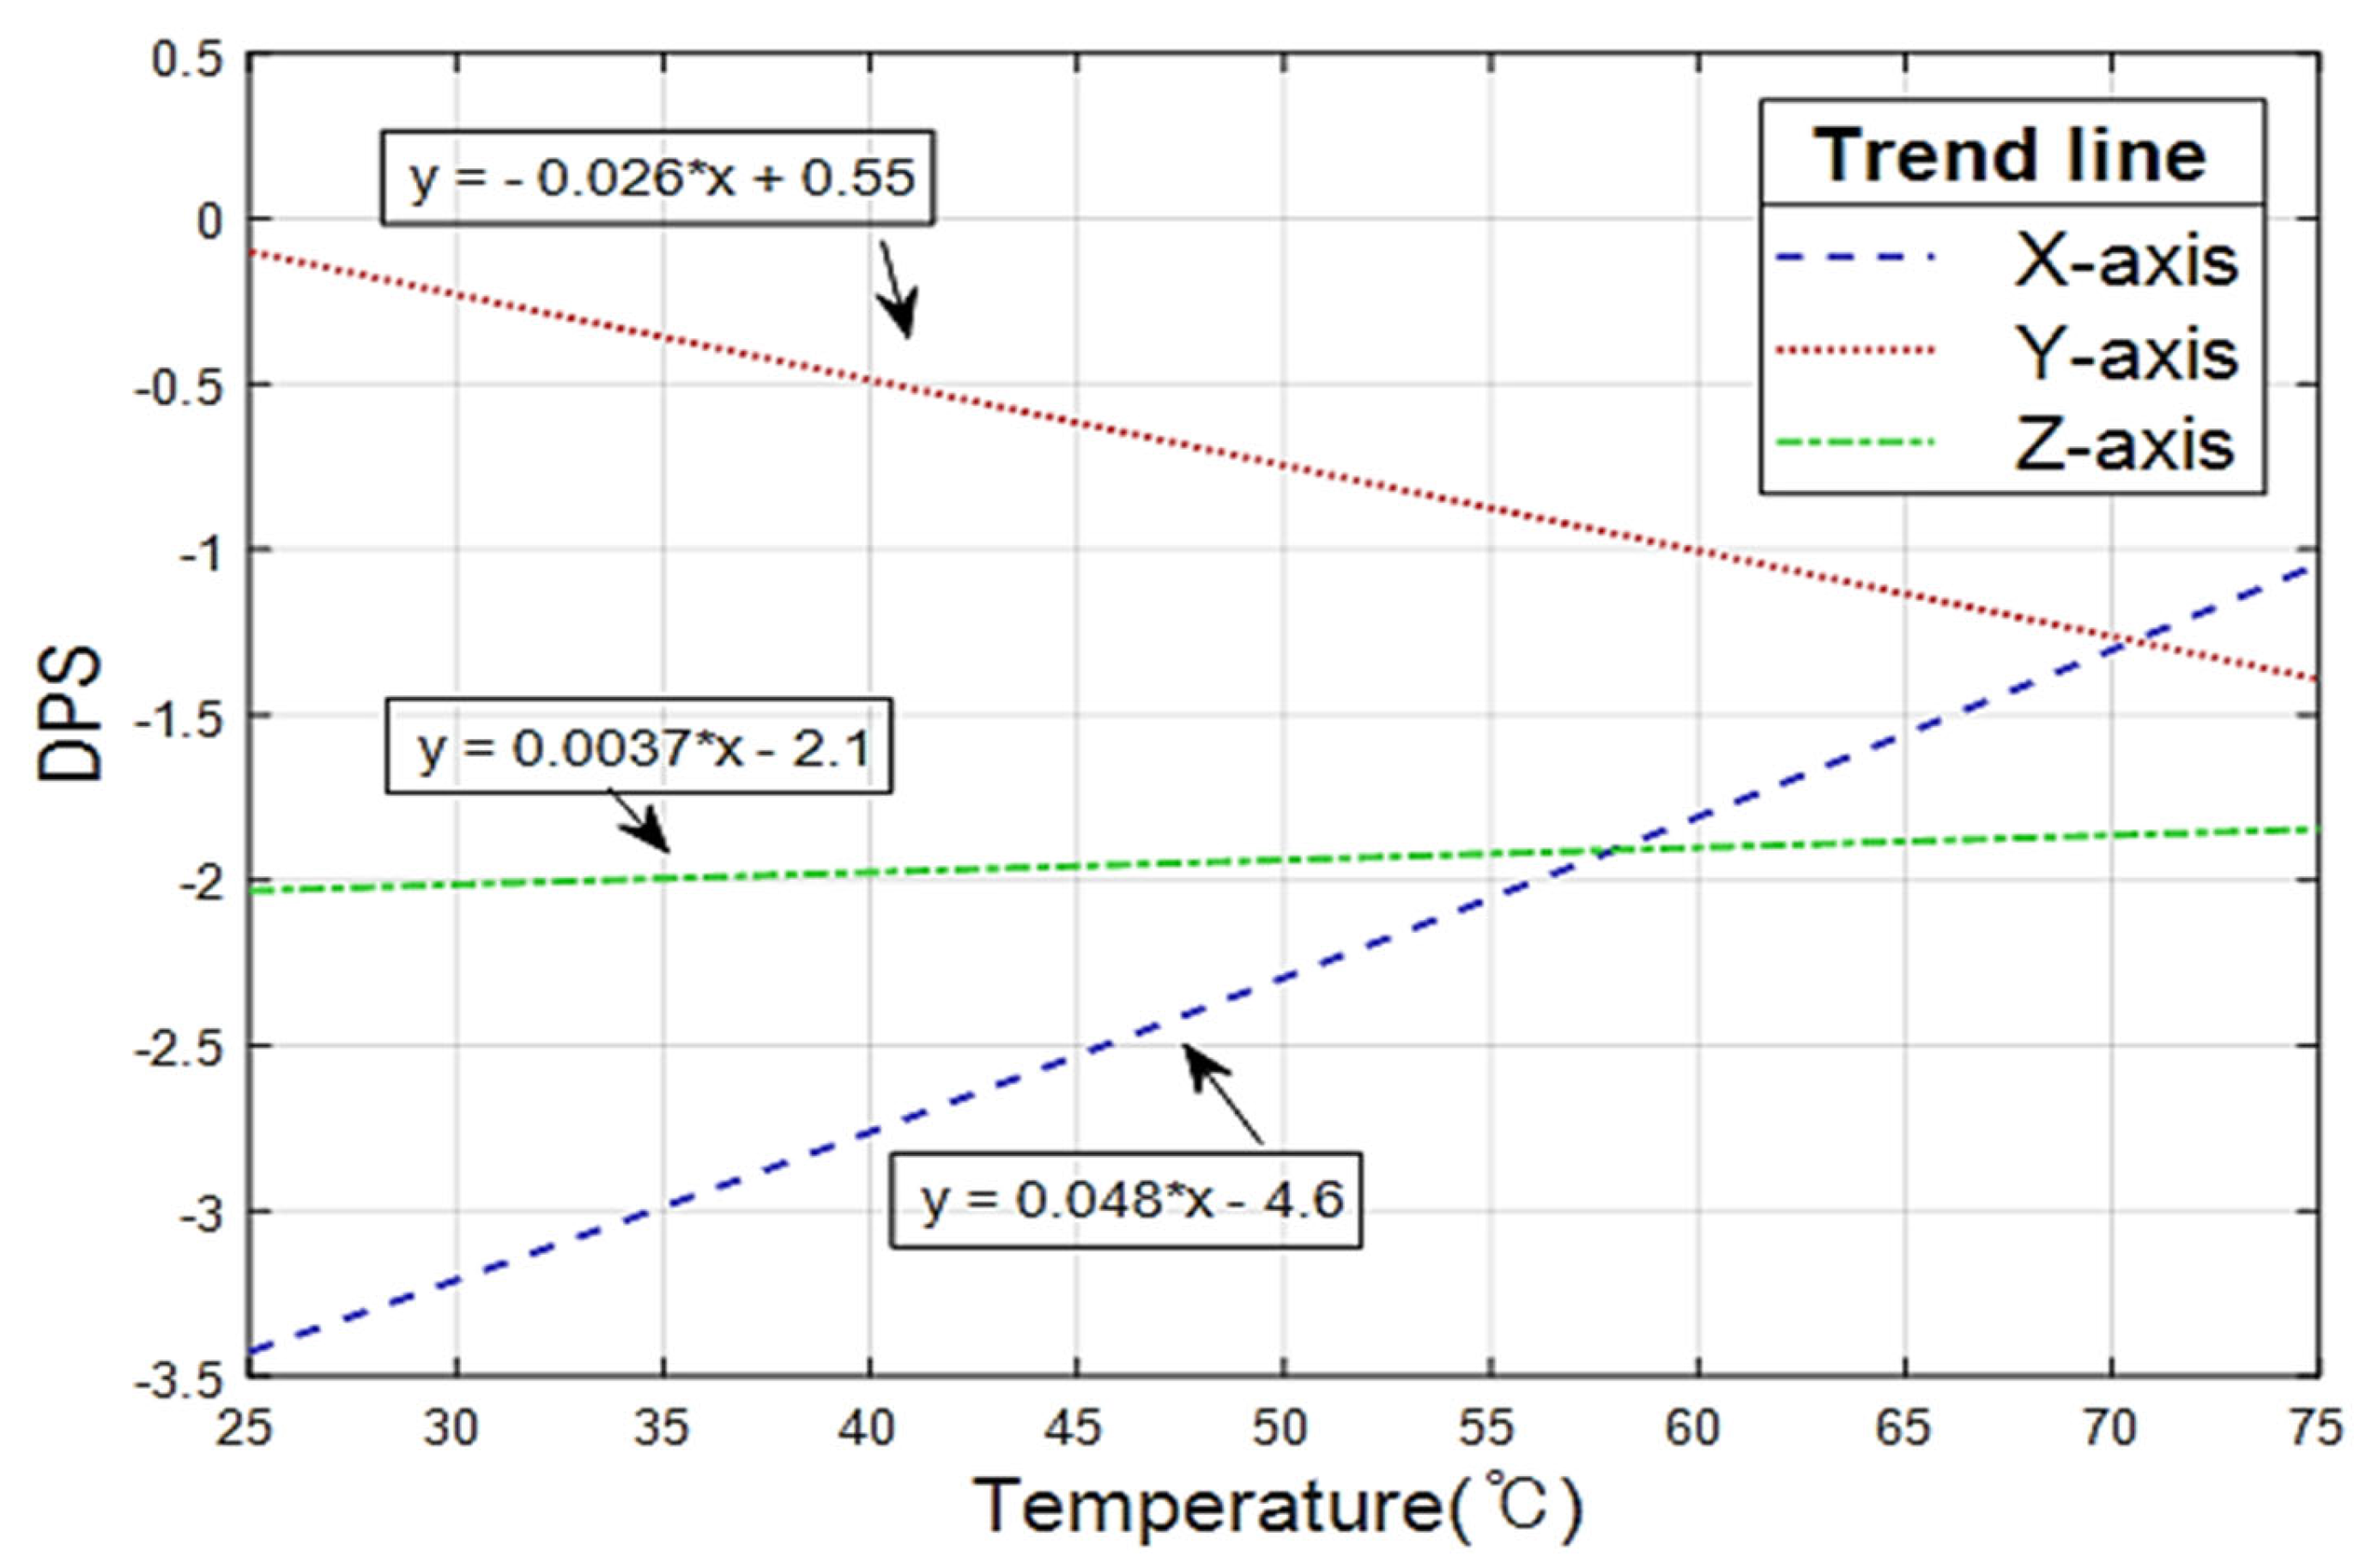
Figure 11 shows the graph that displays the analysis of the trend line of the measured values. The trend of changes in the average values according to temperature rise showed that the gyroscope sensor’s X- and Y-axes exhibited a linear characteristic whose increase or decrease of the value was clear as the temperature increased, and the Z-axis showed a linear characteristic in which the values slightly increased. The trendline analysis results indicated that the gyroscope X-axis could be expressed by a function of
whose measured values increased, and the Y-axis by a function of
, which had a decreasing slope. The Z-axis could be expressed by a function of
whose value slightly increased. The slopes of the three axes showed that the X-axis had the largest slope as expected, while the Z-axis showed the smallest slope.
The analysis of the average values derived the following results: First, the X-axis showed the minimum value of approximately −3.3 DPS at 25 °C. During the experiments, it showed an increase of 0.4 DPS on average, and the largest increase was shown as 0.6 DPS in the range of 65–75 °C. Second, the Y-axis exhibited a decrease of approximately 0.26 DPS on average in all ranges. The largest decrease range was 65–75 °C for 0.4 DPS, the same as the X-axis. The 25–45 °C range showed a decrease of approximately 0.18 DPS, and the 45–65 °C range showed a change of approximately 0.27 DPS. Third, the Z-axis showed the smallest change during the experiment as its measured values increased by approximately 0.18 DPS, showing the most stability to temperature changes.
The analysis of the standard deviations derived the following results: The largest standard deviation was found in the Y-axis among the three axes of the gyroscope sensor. The deviation increased as the temperature increased from 25 °C and then decreased at 65 °C followed by showing the largest standard deviation at 75 °C. The X-axis exhibited uneven standard deviations with temperature rise, and as mentioned above, the largest was found at 55 °C. The Z-axis revealed the size of standard deviation enough to see the error bar only at 55 °C and the rest of the temperature sections showed minimal values.
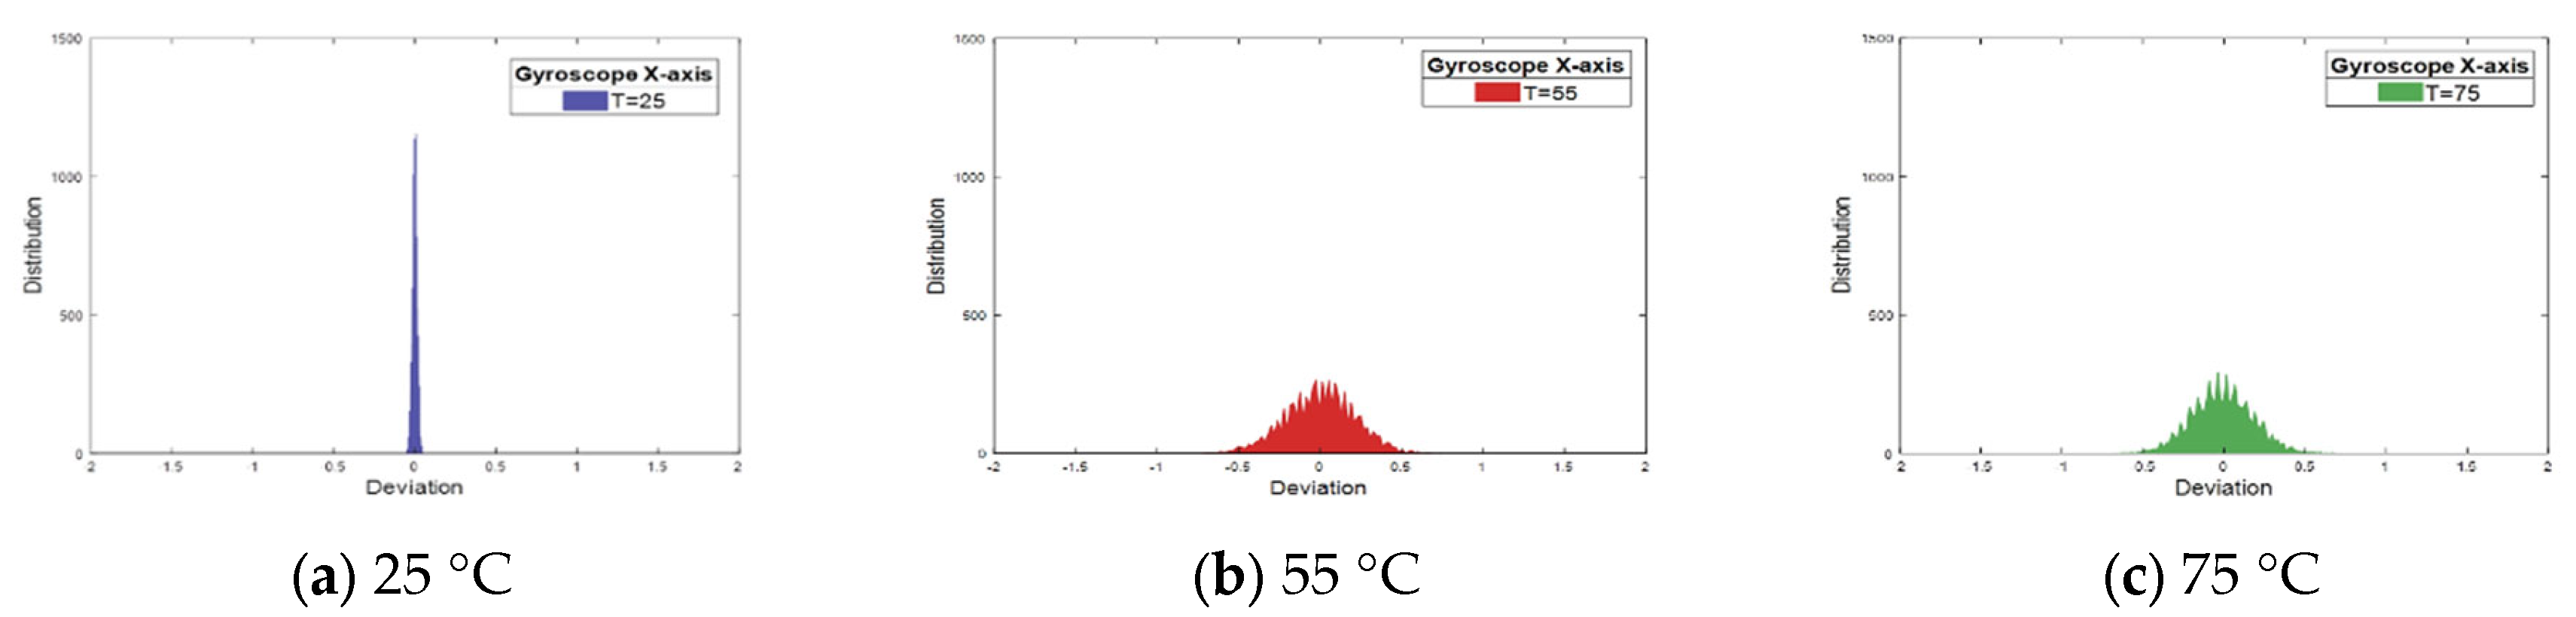
The measured values in the experiment results were divided into the X-, Y-, and Z-axes of the gyroscope sensor, and the noise was analyzed at each temperature.
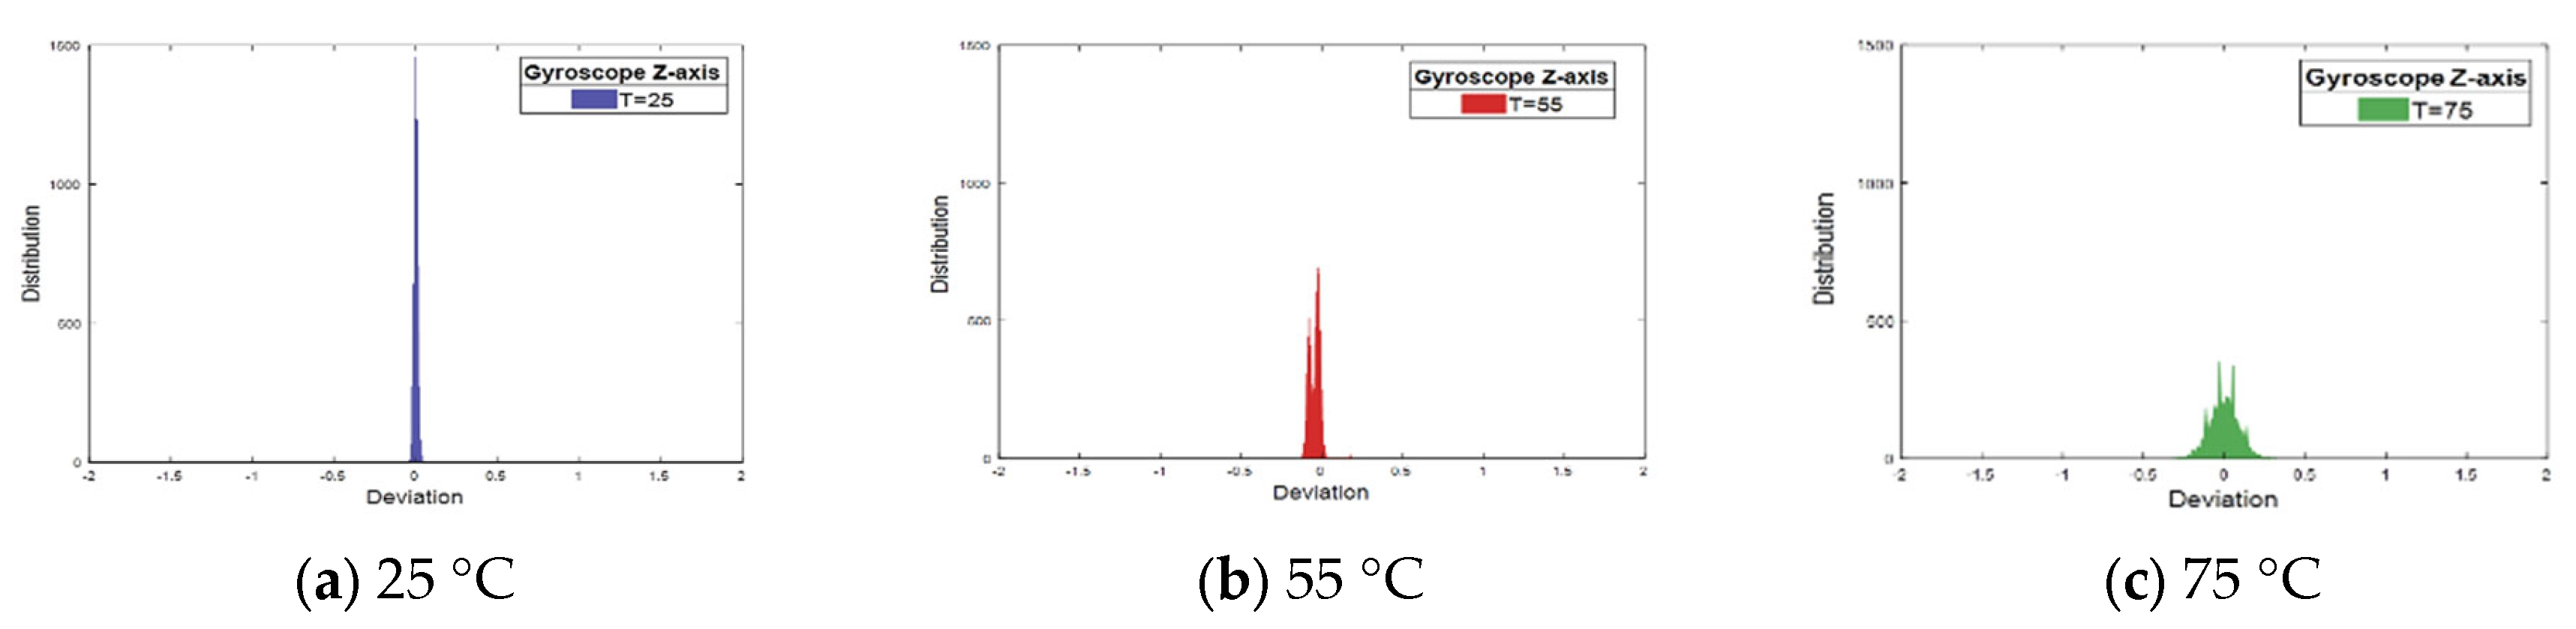
Figure 12a–c show the deviation analysis of the measured values at temperatures 25 °C, 55 °C, and 75 °C in the X-axis of the gyroscope sensor. At temperature 25 °C, the largest distribution was shown approximately 1180 times near slightly greater than 0. The figure verified that the noise at temperature 55 °C was clearly larger than that at 25 °C. The results at three temperatures verified in common that the noise and deviation at the X-axis of the gyroscope sensor increased as temperature increased.
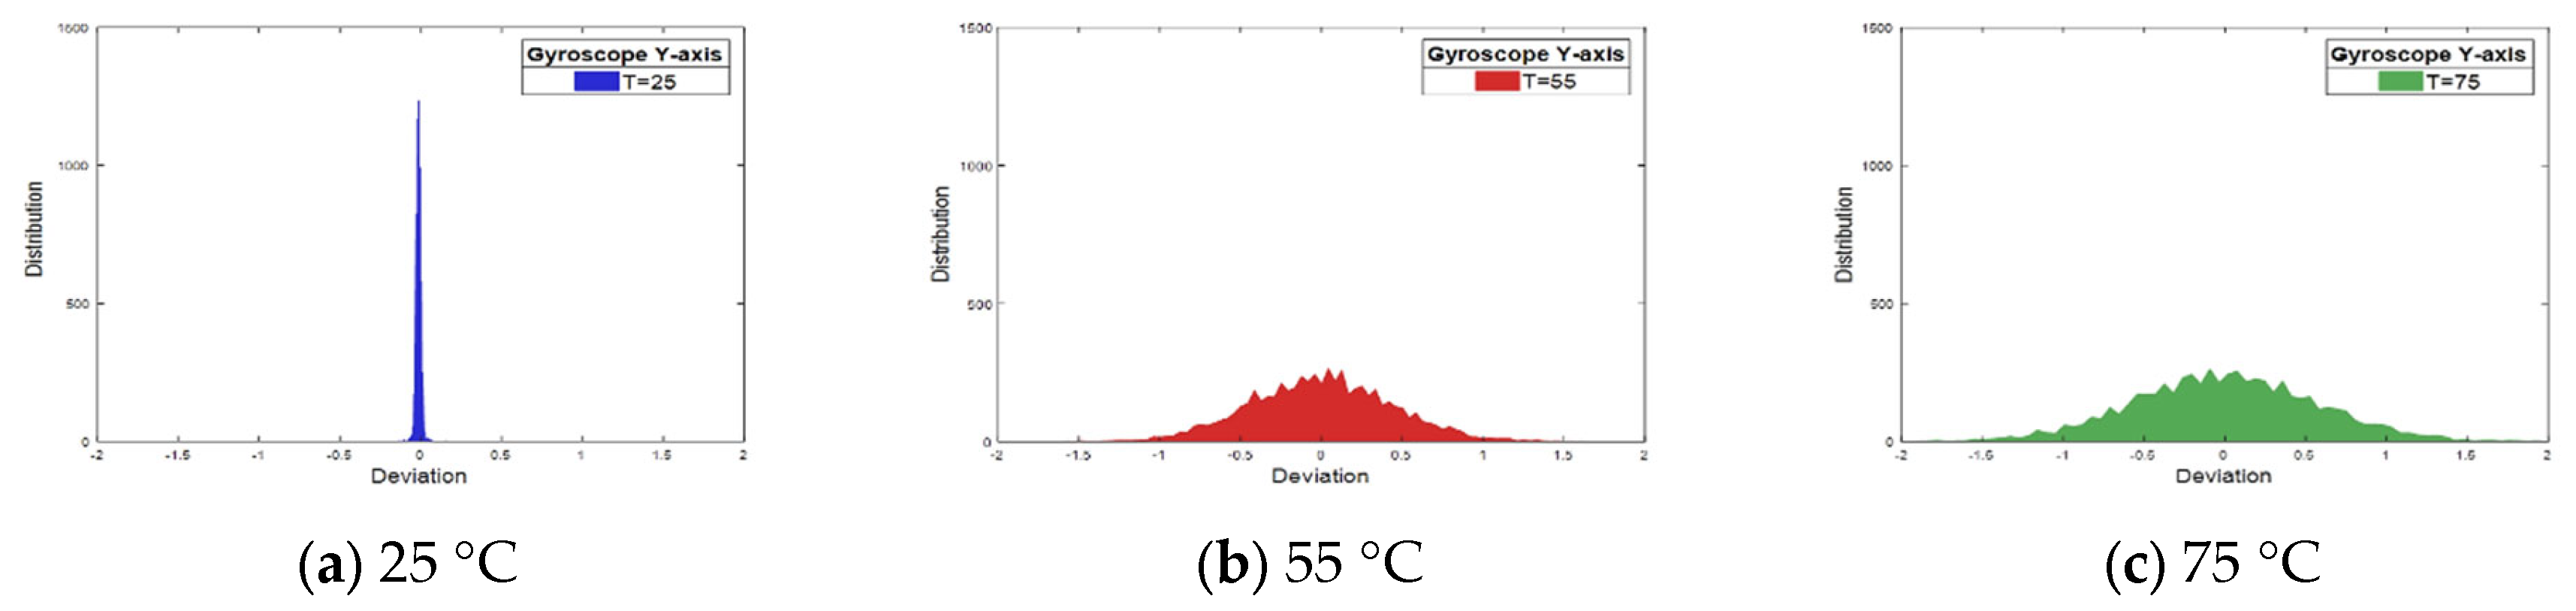
Figure 13a–c show the deviation analysis of the measured values at temperatures 25 °C, 55 °C, and 75 °C in the Y-axis of the gyroscope sensor. The Y-axis of the gyroscope sensor showed an evident change in deviations as the temperature increased. In particular, the largest deviation value was revealed at 75 °C among all experimental deviation values.
Figure 14a–c show the deviation analysis of the measured values at temperatures 25 °C, 55 °C, and 75 °C in the Z-axis of the gyroscope sensor. The Z-axis of the gyroscope sensor showed a relatively stable result of deviation change by temperature compared to other axes, and the range of the deviations was the largest at 55 °C.
5. Discussion
This study measured the thermal error of the siX-axis MEMS sensor. This error is important for accurately measuring the rolling period of ships because it is necessary to identify thermal errors in the x or y-axis of the MEMS sensor, which can be the transverse axis of ships. Hence, this study aims to propose the temperature at which MEMS sensors can be stably operated in MASS.
It may have different characteristics depending on which manufacturers or models of MEMS sensors are used. Nonetheless, this study verified that sensors to be applied to MASS should be used in places where temperature can be controlled to some extent. Humans can fix manned ships if sensors have problems. However, if sensors have problems in MASS, it is difficult to fix the problems. Thus, sensors should not be used in places such as the ship’s on-deck and stores directly exposed to the sun. Therefore, it is preferable to use MEMS sensors indoors or, if possible, in a place where air conditioning controls the temperature.
We had many concerns regarding the setting of the initial temperature for the experiment. We conducted the experiment from 25 °C, considering the recommended temperature by the manual of MEMS sensors and crew accommodation temperature recommended by the ship’s class, such as NK and DNV. Of course, MEMS sensors can be installed in places other than crew accommodation. For example, the sensors can be installed as needed in various places such as a Bosun store or a cable truck space on an external deck. Especially in the vicinity of the engine room, the temperature may be high. If we consider all situations, it may be difficult to set the initial test temperature. So, we refer to the recommended temperature of accommodation by the ship’s class in this study.
Additionally, it would be rare that the temperature rises above 50 °C in crew accommodation. However, since the purpose of this study is to show the degree at which the MEMS sensor’s thermal error appears, we wanted to show the sensor’s thermal error by experimenting up to the most extreme situation possible. However, to prevent damage to the sensor, the maximum temperature was determined to be 75 °C.
In addition, changes with decreasing temperature were considered, but as this was a study on the thermal error caused by material expansion, a different approach to errors in material shrinkage was required; thus, it was excluded from this study.
Irregular waves appearing due to the thermal error are caused by complex situations, such as the distances between components changing according to the expansion of the materials inside the sensor. As MEMS sensors are ultraprecise nanosized sensors, this study has limitations in identifying changes in detail within the sensor due to thermal expansion. However, it was possible to identify the dramatic change in the measured values according to the temperature change. Therefore, in the future, it will also be necessary to design a filter that will compensate for the error of the measured values according to the temperature change of the sensor.
6. Conclusions
The accurate information and control for the ship’s stability are essential for safe MASS sailing. To measure the rolling period of MASS in real time, it is necessary to have a sensor that can detect the ship’s motion. Hence, this study analyzed the characteristics of thermal errors according to temperature changes in MEMS sensors before applying the siX-axis MEMS sensor to MASS.
The conclusions of the study results can be summarized as follows:
First, the thermal error of the gyroscope sensor was much larger than that of the accelerometer. The thermal error of the acceleration sensor had the largest change in errors of 0.023 g based on the measured values at 25 °C, whereas the thermal error of the gyroscope sensor had the largest change in errors of 2.32 DPS based on the measured values at 25 °C. The most stable axis was the Z-axis in both accelerometer and gyroscope sensor. The X-axis was the most sensitive to the thermal error in accelerometer and gyroscope sensor.
Second, the deviation of the measured values in the gyroscope sensor was also larger than that of the accelerometer when the temperature changed. In particular, the Y-axis of the gyroscope sensor showed the largest change in deviations, while the Z-axis of the accelerometer exhibited the largest change in deviations. Note that the deviation was rapidly increased in most axes from 45 °C.
The ship motion should be considered to apply the sensor to ships based on the experimental results. As the ship’s motion during navigation is usually more significant in the transverse direction than in the longitudinal direction, the measured values and noise of thermal errors must be corrected through the filter design before the sensor application. The X-axes of the two sensors, which had the largest change in thermal errors of measured values in our experiments, should be used to measure the ship movements in the longitudinal direction rather than in the transverse direction. The optimal operating temperature of the MEMS sensor when used in MASS is recommended to be in the range of 25–35 °C, and extra caution should be taken to operate the gyroscope sensor in the temperature range. Moreover, the Z-axis of the accelerometer must be designed to enable its horizontal installation. The thermal characteristics of the siX-axis MEMS sensor proposed in this study are expected to contribute to the use of MEMS sensors in MASS. We will continue to study filter design and sensors to measure the () of ships in the future.


